
A Study on Object Detection Performance of YOLOv4 for Autonomous Driving of Tram

Abstract
:1. Introduction
2. Materials and Methods
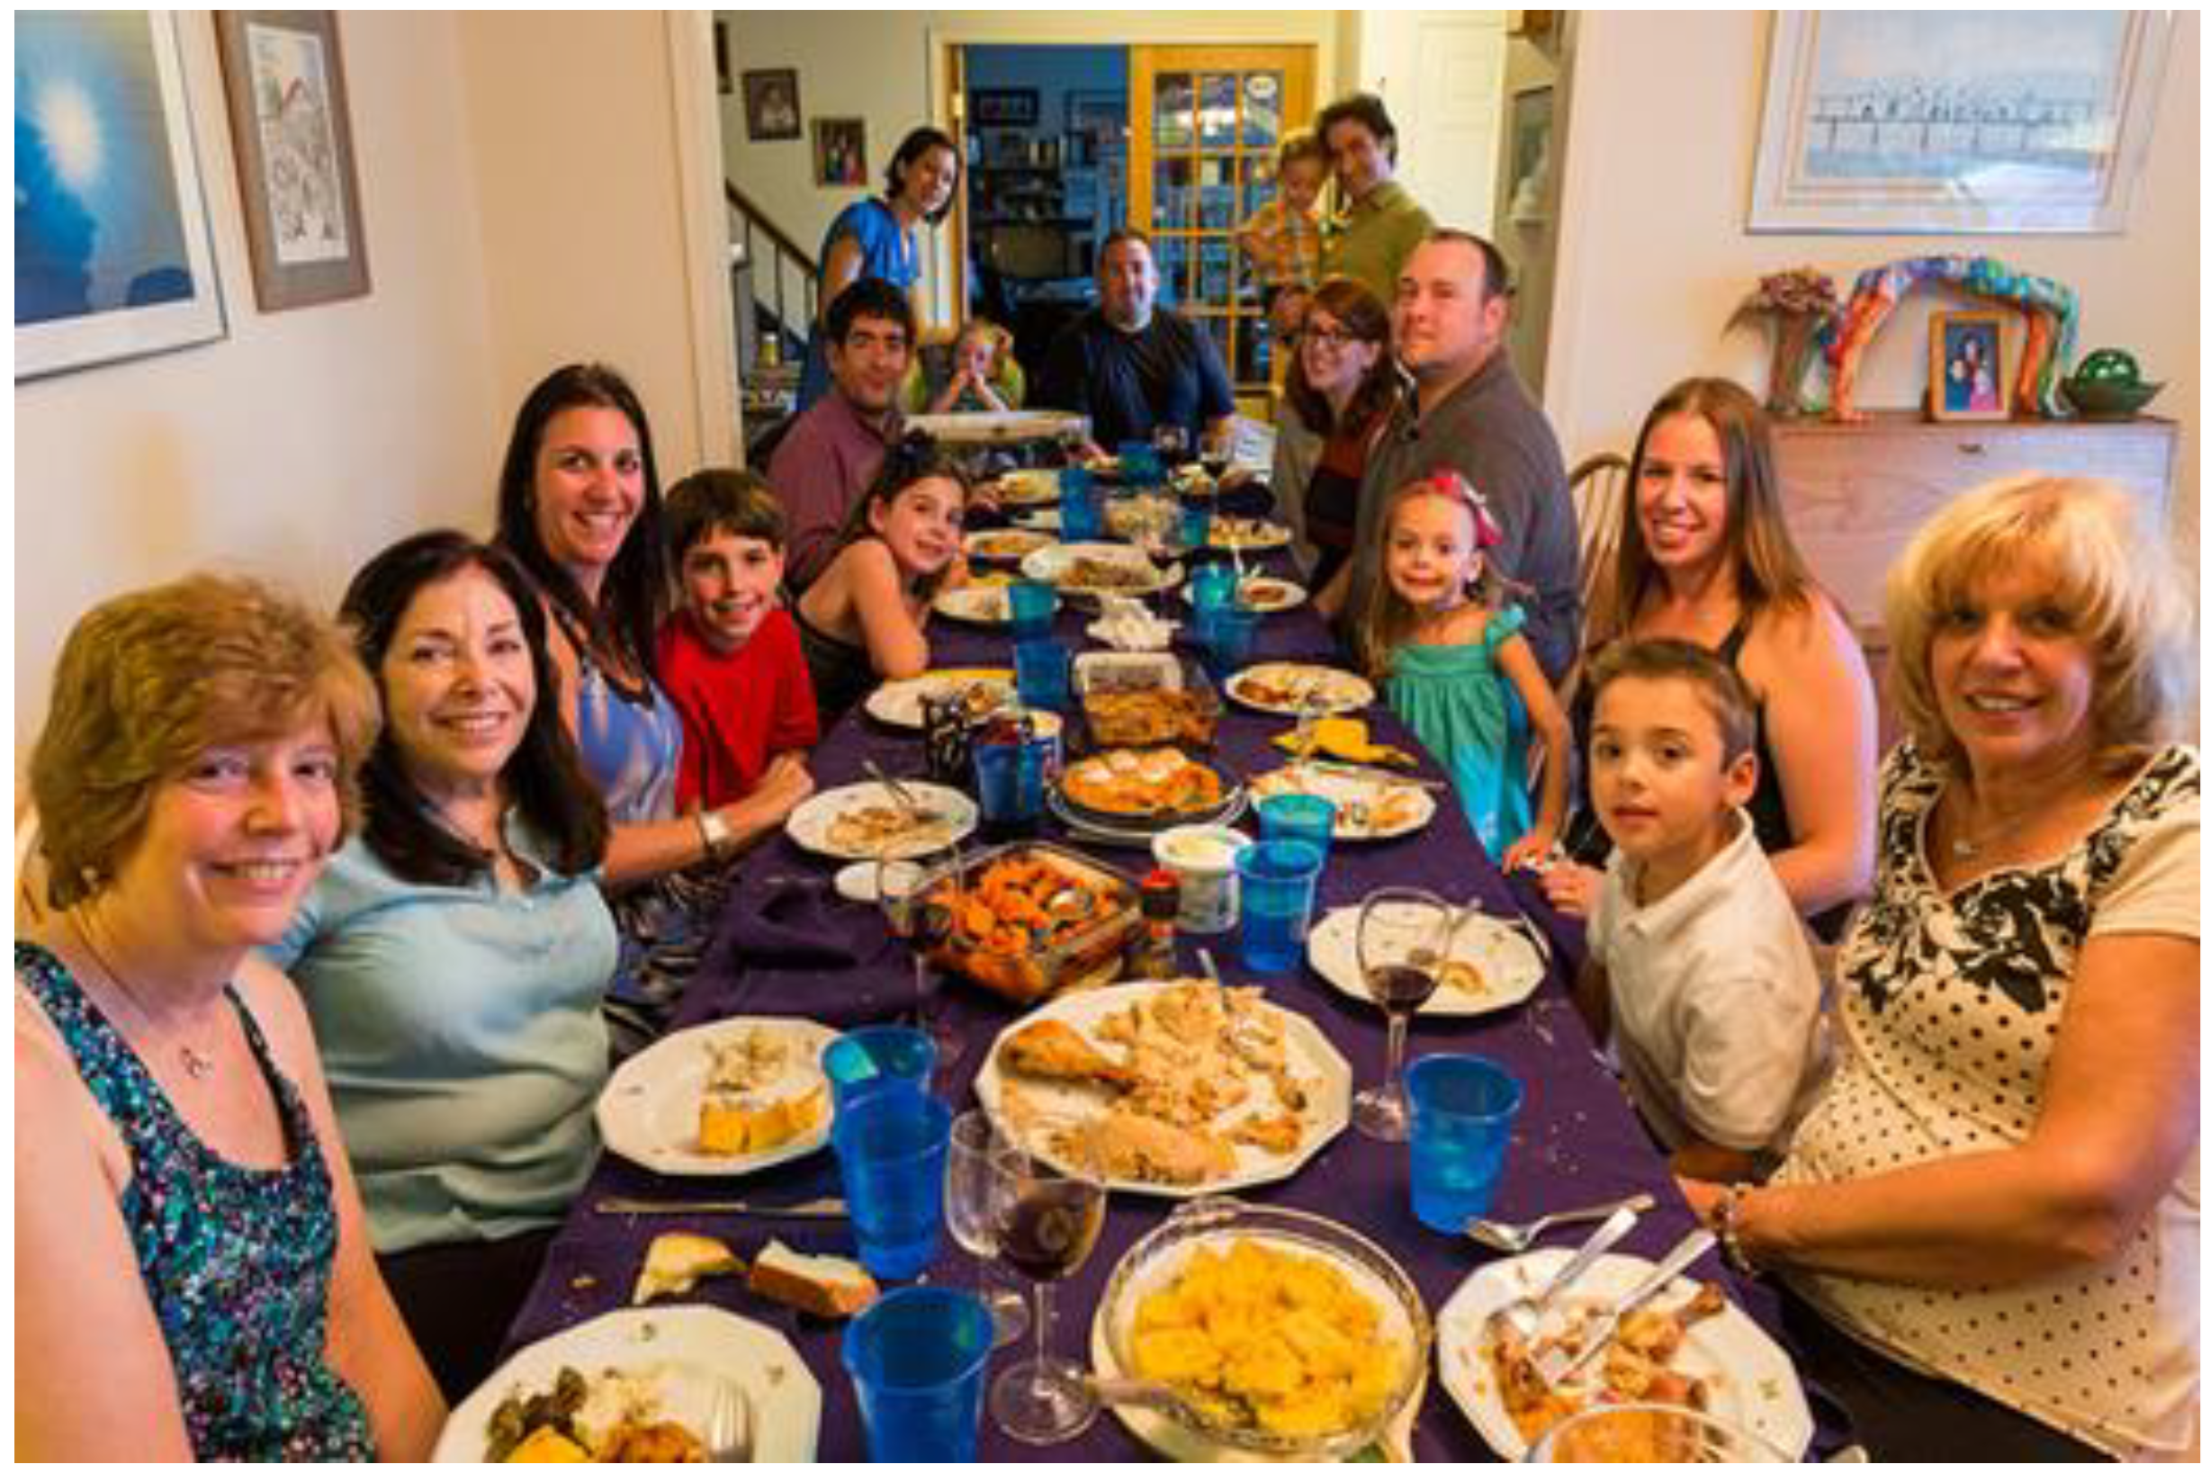
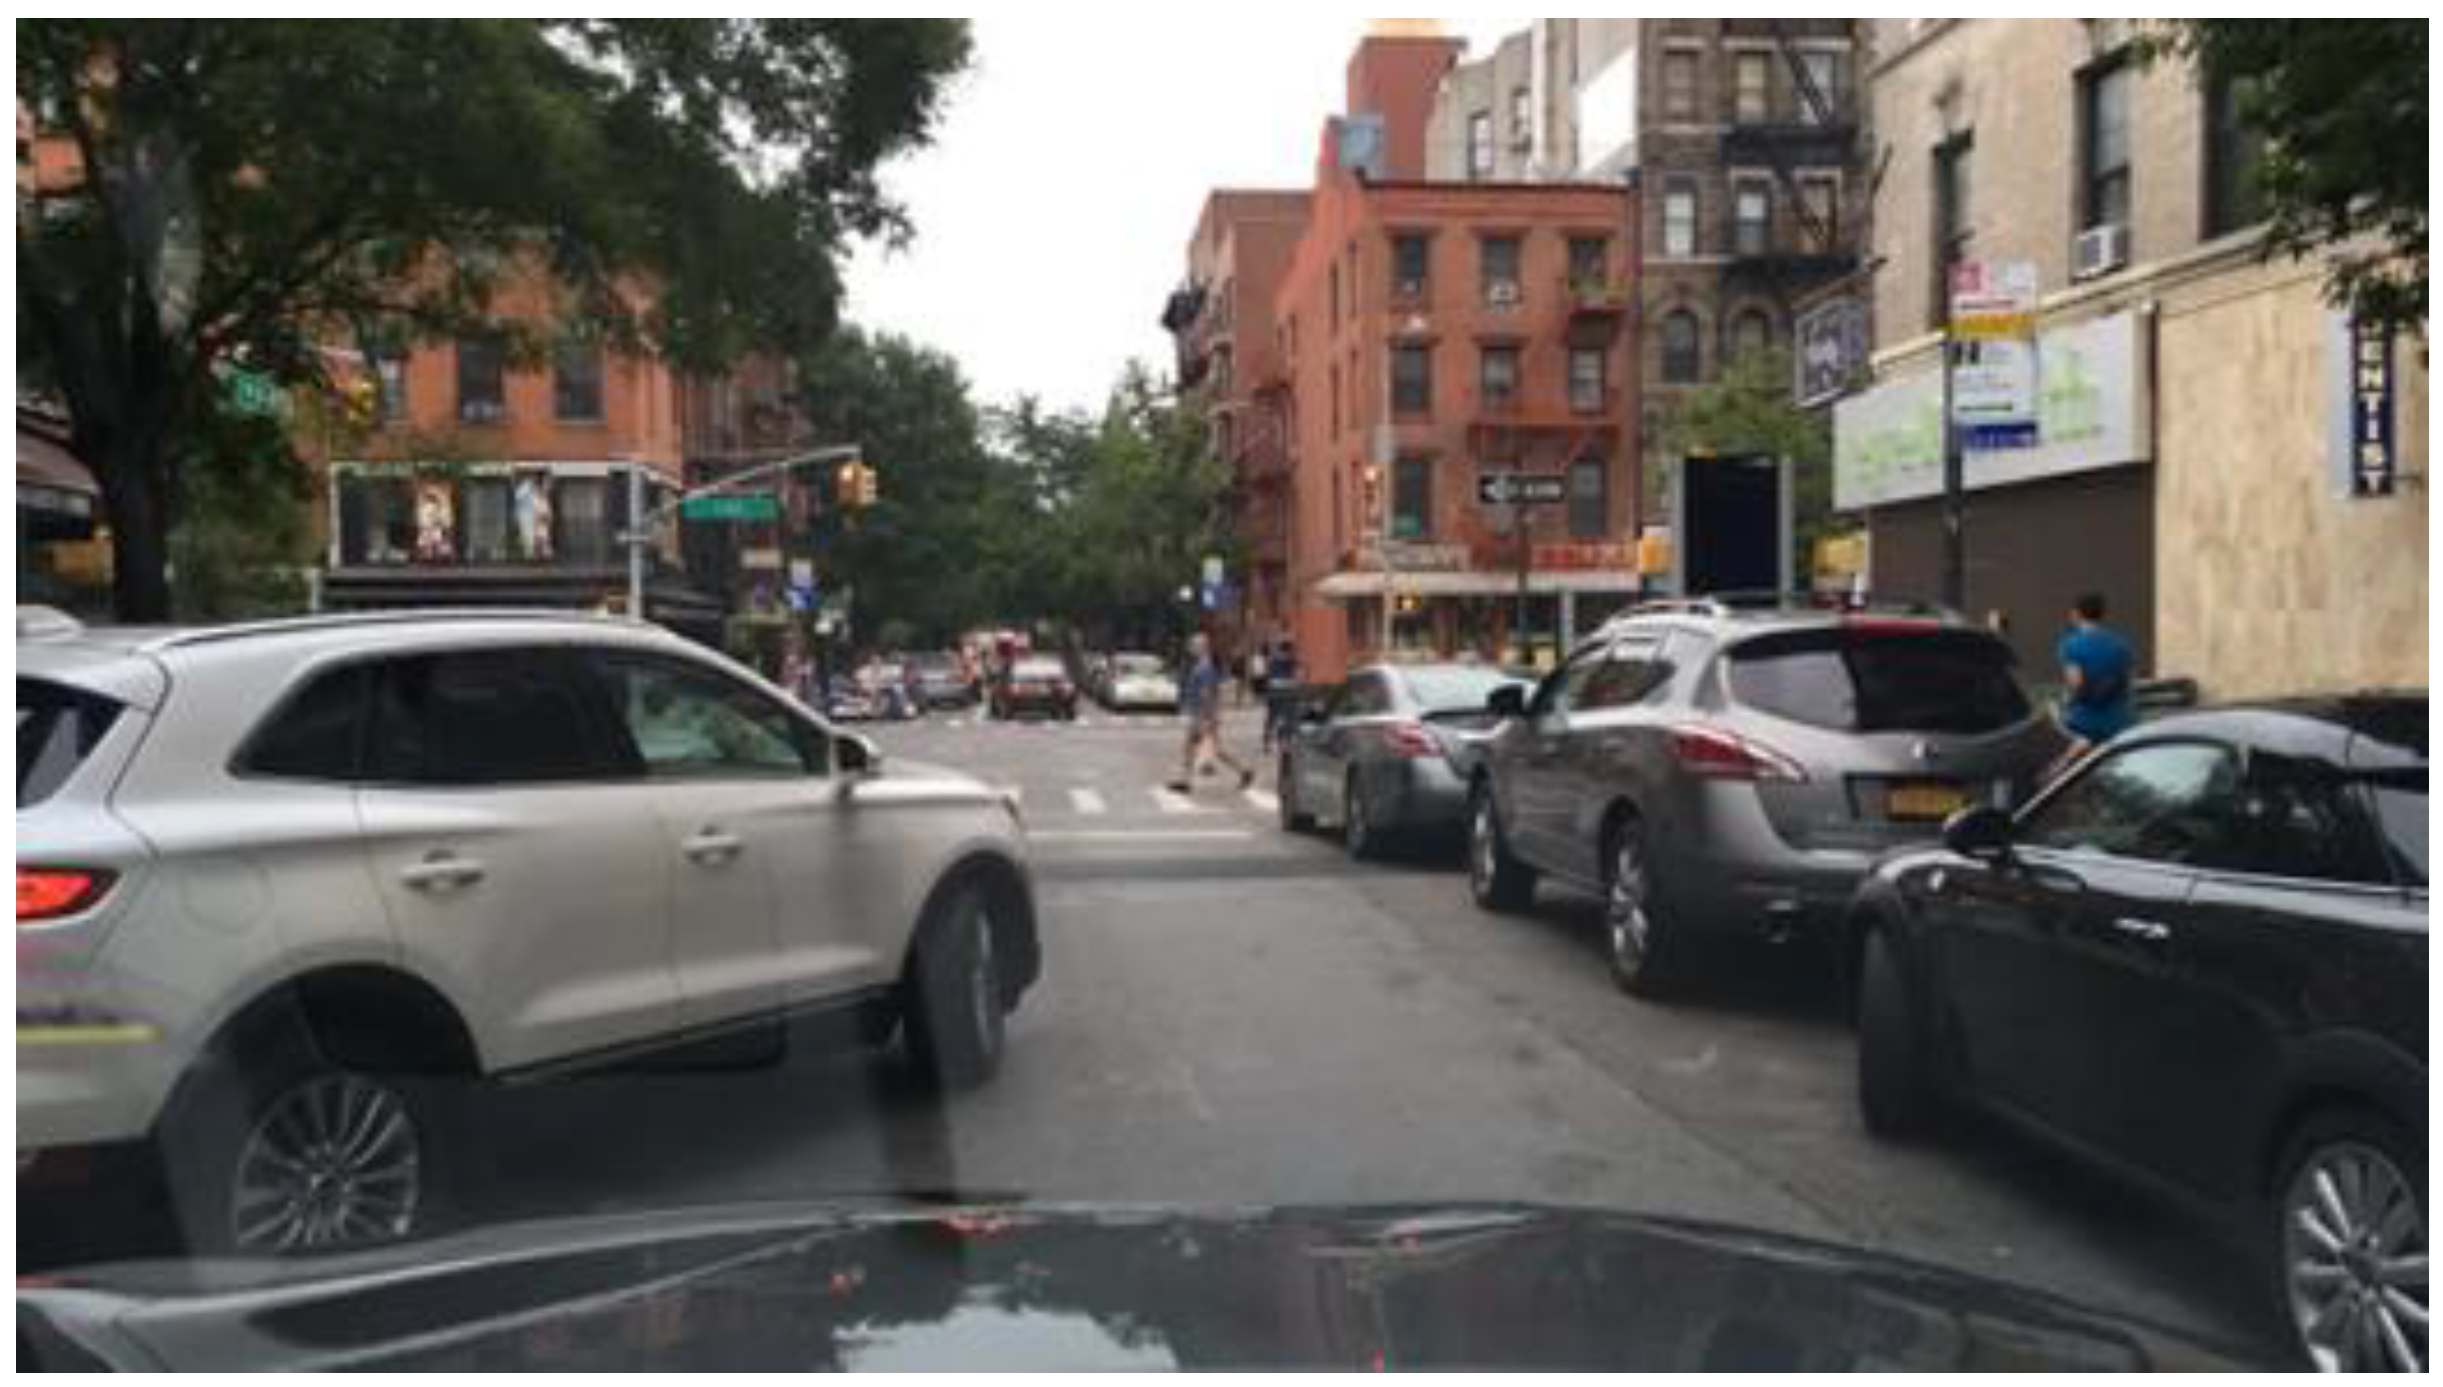
2.1. Dataset
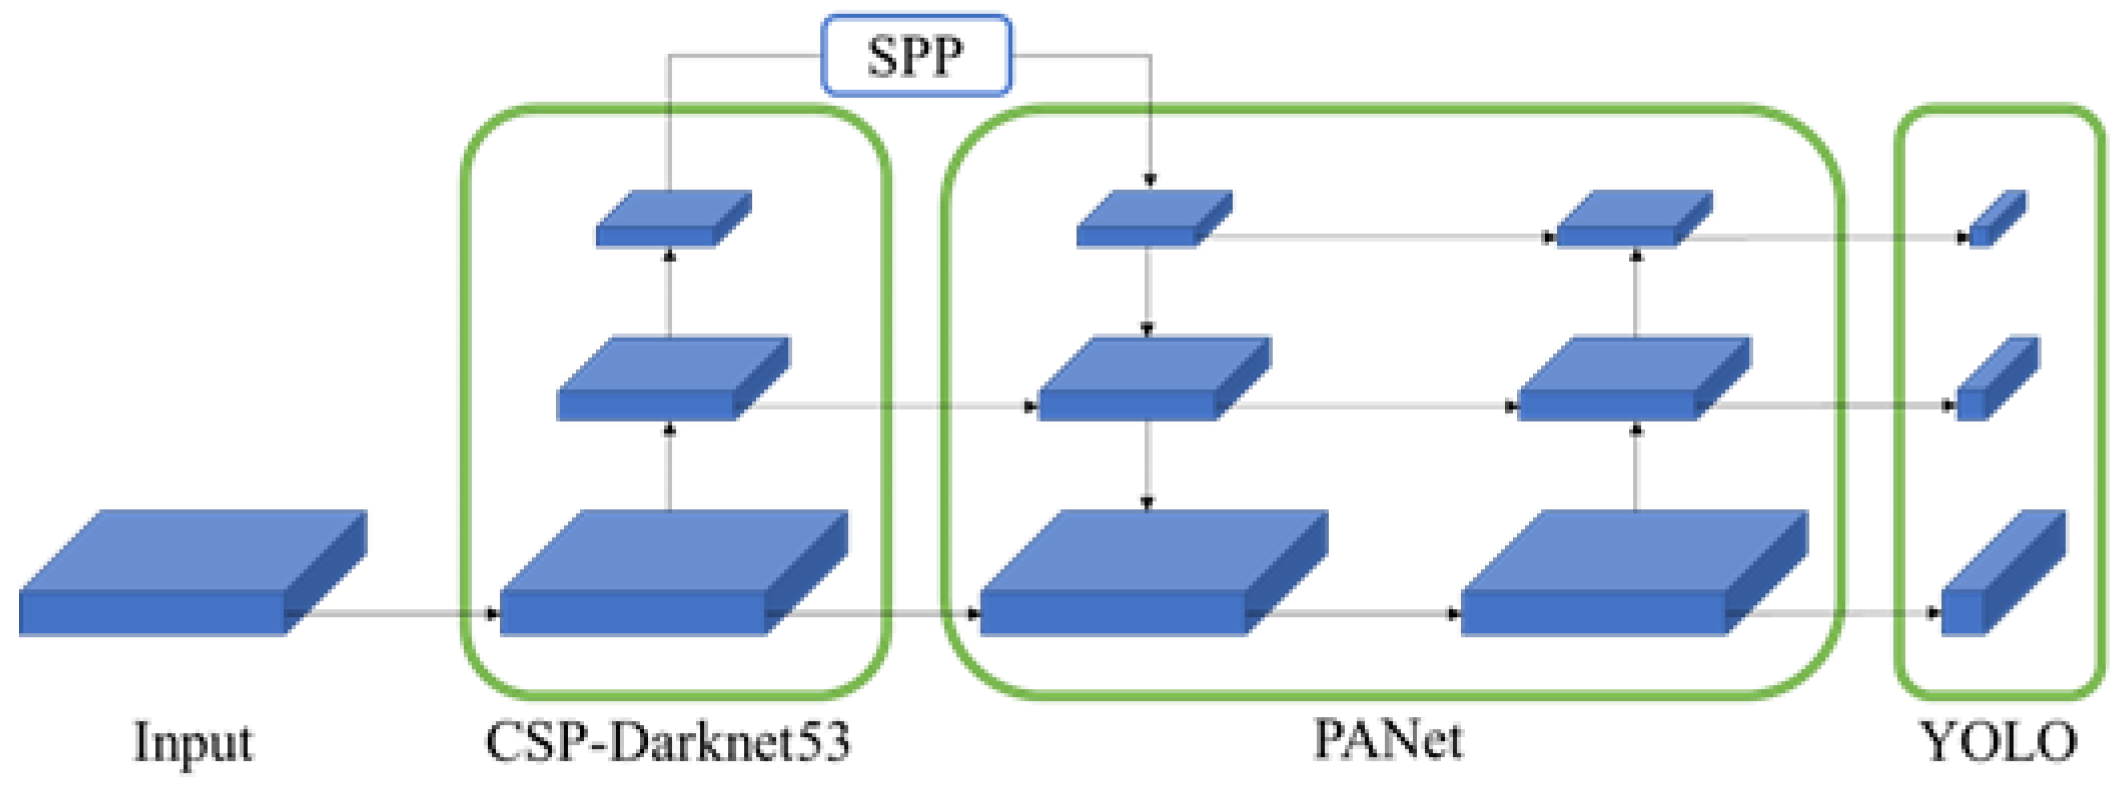
2.2. YOLOv4
3. Results
3.1. Methodology
3.2. Methodology Experimental Results
4. Discussion
5. Conclusions
Author Contributions
Funding
Informed Consent Statement
Conflicts of Interest
References
- Park, S.-W.; Choi, K.-J.; Hwang, H.-C.; Kwak, J.-H. A Dynamic Velocity Profile Generation Method for Autonomous Driving of a Tram Vehicle. Trans. Korean Inst. Elect. Eng. 2020, 69, 1569–1577. [Google Scholar] [CrossRef]
- Bagloee, S.A.; Tavana, M.; Asadi, M.; Oliver, T. Autonomous vehicles: Challenges, opportunities, and future implications for transportation policies. J. Mod. Transp. 2016, 24, 284–303. [Google Scholar] [CrossRef] [Green Version]
- Škultéty, F.; Beňová, D.; Gnap, J. City logistics as an imperative smart city mechanism: Scrutiny of clustered eu27 capitals. Sustainability 2021, 13, 3641. [Google Scholar] [CrossRef]
- Dudziak, A.; Stoma, M.; Kuranc, A.; Caban, J. Assessment of Social Acceptance for Autonomous Vehicles in Southeastern Poland. Energies 2021, 14, 5778. [Google Scholar] [CrossRef]
- Gleichauf, J.; Vollet, J.; Pfitzner, C.; Koch, P.; May, S. Sensor Fusion Approach for an Autonomous Shunting Locomotive. In Proceedings of the 14th International Conference on Informatics in Control, Automation and Robotics, Madrid, Spain, 29–31 July 2017; pp. 603–624. [Google Scholar]
- Choi, G.T.; Kwak, J.-H.; Choi, K.J. Monitoring System for Outside Passenger Accident Prevention in Tram. J. Korean Soc. Railw. 2021, 24, 228–238. [Google Scholar] [CrossRef]
- Hong, D.; Gao, L.; Yao, J.; Zhang, B.; Plaza, A.; Chanussot, J. Graph convolutional networks for hyperspectral image classification. IEEE Trans. Geosci. Remote Sens. 2020, 59, 5966–5978. [Google Scholar] [CrossRef]
- Redmon, J.; Farhadi, A. Yolov3: An incremental improvement. arxiv 2018, arXiv:1804.02767. [Google Scholar]
- Alexey, B.; Wang, C.-Y.; Liao, H.M. Yolov4: Optimal speed and accuracy of object detection. arXiv 2020, arXiv:2004.10934. [Google Scholar]
- Lin, T.-Y.; Maire, M.; Belongie, S.; Hays, J.; Perona, P.; Ramanan, D.; Dollár, P.; Zitnick, C.L. Microsoft Coco: Common Objects in Context. In European Conference on Computer Vision; Springer: Berlin/Heidelberg, Germany, 2014; pp. 740–755. [Google Scholar]
- Yu, F.; Chen, H.; Wang, X.; Xian, W.; Chen, Y.; Liu, F.; Madhavan, V.; Darrell, T. Bdd100k: A diverse driving video database with scalable annotation tooling. arXiv 2018, arXiv:1805.04687 2.5. [Google Scholar]
- Yun, S.; Han, D.; Oh, S.J.; Chun, S.; Choe, J.; Yoo, Y. Cutmix: Regularization Strategy to Train Strong Classifiers with Localizable Features. In Proceedings of the IEEE/CVF International Conference on Computer Vision, Seoul, Republic of Korea, 27 October–2 November 2019; pp. 6023–6032. [Google Scholar]
- Ghiasi, G.; Lin, T.S.; Le, Q.V. Dropblock: A regularization method for convolutional networks. Adv. Neural Inf. Process. Syst. 2018, 31, 10750–10760. [Google Scholar]
- Szegedy, C.; Vanhoucke, V.; Ioffe, S.; Shlens, J.; Wojna, Z. Rethinking the Inception Architecture for Computer Vision. In Proceedings of the IEEE Conference on Computer Vision and Pattern Detection, Las Vegas, NV, USA, 27–30 June 2016; pp. 2818–2826. [Google Scholar]
- Misra, D. Mish: A self-regularized non-monotonic activation function. arXiv 2019, arXiv:1908.08681. [Google Scholar]
- Wang, C.; Liao, H.M.; Yeh, I.; Wu, Y.; Chen, P.; Hsieh, J. CSPNet: A New Backbone that Can Enhance Learning Capability of CNN. In Proceedings of the IEEE/CVF Conference on Computer Vision and Pattern Detection workshops, Seattle, WA, USA, 13–19 June 2020; pp. 390–391. [Google Scholar]
- Zheng, Z.; Wang, P.; Liu, W.; Li, J.; Ye, R.; Ren, D. Distance-IoU loss: Faster and better learning for bounding box regression. Proc. AAAI Conf. Artif. Intell. 2020, 34, 7. [Google Scholar] [CrossRef]
- Yao, Z.; Cao, Y.; Zheng, S.; Huang, G.; Lin, S. Cross-Iteration Batch Normalization. In Proceedings of the IEEE/CVF Conference on Computer Vision and Pattern Detection, Nashville, TN, USA, 19–25 June 2021. [Google Scholar]
- Ilya, L.; Hutter, F. Sgdr: Stochastic gradient descent with warm restarts. arXiv 2016, arXiv:1608.03983. [Google Scholar]
- He, K.; Zhang, X.; Ren, S.; Sun, J. Spatial Pyramid Pooling in Deep Convolutional Networks for Visual Detection. IEEE Trans. Pattern Anal. Mach. Intell. 2015, 37, 1904–1916. [Google Scholar] [CrossRef] [PubMed] [Green Version]
- Woo, S.; Park, J.; Lee, J.; Kweon, I.S. Cbam: Convolutional Block Attention Module. In Proceedings of the European Conference on Computer Vision (ECCV), Munich, Germany, 8–14 September 2018. [Google Scholar]
- Liu, S.; Qi, L.; Qin, H.; Shi, J.; Jia, J. Path Aggregation Network for Instance Segmentation. In Proceedings of the IEEE Conference on Computer Vision and Pattern Detection, Salt Lake City, UT, USA, 18–23 June 2018. [Google Scholar]
- Neupane, B.; Horanont, T.; Aryal, J. Real-Time Vehicle Classification and Tracking Using a Transfer Learning-Improved Deep Learning Network. Sensors 2022, 22, 3813. [Google Scholar] [CrossRef] [PubMed]


| Train | Validation | Test | Class | |
|---|---|---|---|---|
| MS COCO | 118,287 | 5000 | 40,670 | 80 |
| BDD 100K | 70,000 | 10,000 | 20,000 | 10 |
| mAP@0.50 | mAP@0.75 | FPS | |
|---|---|---|---|
| BDD 100K | 48.79% | 22.50% | 50.3 |
| MS COCO | 62.80% | 44.30% | 38.6 |
| Average IoU | Precision | Recall | F1-Score | |
|---|---|---|---|---|
| mAP@0.50 | 47.08% | 0.61 | 0.61 | 0.61 |
| mAP@0.75 | 32.40% | 0.38 | 0.37 | 0.37 |
Publisher’s Note: MDPI stays neutral with regard to jurisdictional claims in published maps and institutional affiliations. |
© 2022 by the authors. Licensee MDPI, Basel, Switzerland. This article is an open access article distributed under the terms and conditions of the Creative Commons Attribution (CC BY) license (https://creativecommons.org/licenses/by/4.0/).
Share and Cite
Woo, J.; Baek, J.-H.; Jo, S.-H.; Kim, S.Y.; Jeong, J.-H. A Study on Object Detection Performance of YOLOv4 for Autonomous Driving of Tram. Sensors 2022, 22, 9026. https://doi.org/10.3390/s22229026
Woo J, Baek J-H, Jo S-H, Kim SY, Jeong J-H. A Study on Object Detection Performance of YOLOv4 for Autonomous Driving of Tram. Sensors. 2022; 22(22):9026. https://doi.org/10.3390/s22229026
Chicago/Turabian StyleWoo, Joo, Ji-Hyeon Baek, So-Hyeon Jo, Sun Young Kim, and Jae-Hoon Jeong. 2022. "A Study on Object Detection Performance of YOLOv4 for Autonomous Driving of Tram" Sensors 22, no. 22: 9026. https://doi.org/10.3390/s22229026