Article

Genetic Structure and Differentiation of Endangered Cycas Species Indicate a Southward Migration Associated with Historical Cooling Events

1
State Environmental Protection Key Laboratory of Regional Eco-Process and Function Assessment, Chinese Research Academy of Environmental Sciences, 8 Dayangfang, Beijing 100012, China
2
College of Environment and Ecology, Hunan Agricultural University, Changsha 410128, China
*
Authors to whom correspondence should be addressed.
These authors contributed equally to this work.
Diversity 2023, 15(5), 643; https://doi.org/10.3390/d15050643
Submission received: 2 April 2023 / Revised: 27 April 2023 / Accepted: 7 May 2023 / Published: 9 May 2023
(This article belongs to the Special Issue Genetic Diversity, Ecology and Conservation of Endangered Species)

Abstract

:
Understanding the genetic structure and differentiation in endangered species is of significance in detecting their phylogenetic relationships and prioritizing conservation. Here we sampled five endangered Cycas species endemic to southwest China and genotyped genetic structure and differentiation among them using the genotyping-by-sequencing (GBS) method. C. hongheensis showed high genetic diversity, but the other four species showed low genetic diversity. The genetic diversity between wild and cultivated populations was similar for C. debaoensis and C. guizhouensis, respectively. Low genetic differentiation and high gene flow were found among C. debaoensis, C. guizhouensis, and C. fairylakea, and C. hongheensis differentiated from them at ~1.74 Mya. TreeMix results showed historic migration events from C. guizhouensis to C. hongheensis, showing southward migration pathways. C. hongheensis showed increased effective population size with time, while the other four species underwent bottleneck events at ~1–5 Mya when continuous cooling events occurred. Our results indicate that the migration, differentiation, and speciation of Cycas species are associated with historical cooling events.

1. Introduction

The genetic diversity of species determines their adaptation and survival to local environments, particularly within the context of global climatic change [1]. Historical climate change and habitat fragmentation caused by human activities pose threats to small and isolated populations of plants [2]. Low genetic diversity likely increases the extinction risk of species [3]. Gene flow and genetic differentiation between populations are generally influenced by habitat fragmentation, overexploitation, and reproductive behavior [4]. Stresses from extreme environmental conditions can exacerbate inbreeding, accumulated genetic load, and other latent genetic issues [5], which likely decrease low effective population size and genetic diversity [6]. Genetic variations, or polymorphisms, reflect the viability and evolutionary potential of natural populations [7], which is crucial for understanding the evolutionary history of extant populations, particularly for endangered species that need effective conservation and management strategies.
It is necessary to study the genetic diversity of endangered plants to scientifically guide protection because the extinction of endangered plants may lead to the destruction of the entire ecosystem [8]. To study genetic diversity, gene marker techniques have been used in plant protection, such as single nucleotide polymorphisms (SNPs), microsatellites (SSRs) [9,10], and random amplified polymorphisms (RAPDs) [11]. SNPs are the most diverse at the DNA level and can reflect the genetic variation of endangered species [12], particularly in small populations [13]. Qian et al. [12] evaluated the genetic structure and differentiation of endangered Pinus bungeana using SNPs and proposed potential historical migration events between populations. In a previous study, we used SNPs to evaluate the differentiation history of short-leaved yellow cedar (Pseudotsuga brevifolia) populations and proposed that climate change led to their southward migration [14]. Cai et al. [15] studied the genetic variation of Horsfieldia tetratea, one plant species with extremely small populations (PSESP), supporting the development of effective conservation strategies for species.
As one of the most primitive gymnosperm species in the world, cycad species are key objectives in the evolutionary history of seed plants [16,17]. Cycads comprise two families, Cycadaceae and Zamiaceae, with 10 genera and 344 accepted species [18]. Around ~40% of the species are threatened based on the International Union for Conservation of Nature (IUCN) Red List [17,19]. East Asia is the ancestral area of Cycadaceae, and the extant Cycadaceae originated before the Eocene period (~43 Mya) [20]. Cycas is the oldest genus in the monotypic Cycadaceae family, with ~118 species [21,22,23], and the Cycas genus is divided into six sections, i.e., Stangerioides, Asiorientales, Indosinenses, Cycas, Panzhihuaenses, and Wadeae [23]. The section Indosinenses is regarded as a sister section to the other sections. We here sampled five endangered Cycas species with small population sizes, i.e., Cycas debaoensis, C. guizhouensis, C. fairylakea (C. szechuanensis W.C.Cheng & L.K.Fu in POWO and C. szechuanensis subsp. fairylakea (D.Yue Wang) in WFO), C. diannanensis, and C. hongheensis. The first four species belong to the section Stangerioides, and C. hongheensis belongs to the Indosinenses section [17]. The C. debaoensis and C. hongheensis are mainly distributed in Yunnan and Guangxi provinces, China [17,24,25]; the C. guizhouensis is an endangered plant endemic to southwest China [26,27]; wild C. fairylakea species live in Guangdong and Guangxi provinces [28]; and the C. diannanensis is endangered and endemic to the Red River region in Yunnan province [29]. Furthermore, C. guizhouensis and the other four species are plant species with extremely small populations (PSESP) [30]. Cycas species have been facing potential endangerment challenges due to the overexploitation of ornamental plants in nature.
Previous studies mainly focused on cycad phylogeography, population genetics, and conservation strategies [20,25,31,32,33,34,35,36,37], and found low genetic diversity and high genetic differentiation among Cycas species [20,29,34,38,39]. However, most of these studies were based on a few molecular markers, and little is known about the genetic evolution and demographic history of Cycas species [40,41]. Thus, it is urgent to detect the genetic diversity, differentiation, and historical population dynamics of Cycas species [38,41]. We investigated genetic diversity and differentiation for five Cycas species and their historical dynamics with climate change using genotyping-by-sequencing (GBS). Understanding the genetic background of Cycas species provides the basis for developing in situ and ex situ conservation strategies.

2. Material and Methods

2.1. Sample Collection

We sampled 133 individuals from five Cycas species, C. debaoensis, C. diannanensis, C. fairylakea, C. guizhouensis, and C. hongheensis, in Yunnan, Guizhou, Guangxi, and Guangdong provinces, China (Figure 1 and Table 1). Among these samples, there were 29 cultivated C. debaoensis and 31 cultivated C. guizhouensis individuals that had been transplanted from nature (Table 1). Around ~50 g of fresh leaves per plant were sampled and dried in allochronic silica gel for DNA extraction.
The genomic DNA of young leaves from these 133 individuals was extracted using a plant genomic DNA extraction kit (TIANGEN BIOTECH, Beijing, China). The purity of the extracted DNA was detected using a Nanodrop spectrophotometer (ND-1000, Thermos Fisher Scientific, Wilmington, NC, USA), and DNA electrophoresis was simultaneously performed in a 1% agarose gel to ensure DNA integrity. A Qubit 2.0 fluorometer (Invitrogen, Carlsbad, CA, USA) was used to accurately measure the DNA concentration. High-quality DNA was used for subsequent GBS library construction and sequencing.
A total of 0.1–1 ug genomic DNA per sample was digested with two restriction enzymes, EcoRI and PstI (New England Biolabs, Beverly, MA, USA), at 37 °C for 8 h. The ligation products of all samples were equally pooled and size-selected into 300–500 bp fragments using agarose gel electrophoresis. After manipulating gel purification, derived fragments were used as templates for PCR amplification via 25 cycles with EcoRI and PstI adapter universal primers using Prime Star Max DNA Polymerase (Takara, Dalian, China). Finally, the amplicons were size-selected once more into 350–500 bp fragments. The resulting ddRAD library was sequenced on the Illumina HiSeq X ten platform with the paired-end 150 (PE 150) sequencing strategy (Novogene Bioinformatics Technology Co., Ltd., Beijing, China). We matched the clean reads individually to the barcodes and remnant restriction sites at both ends [42].

2.2. SNP Calling

Quality control of the FASTQ-format raw data was performed with the software FastQC [43], while adapter sequences and abnormal nucleotide bases at the 5′terminus were removed. Preprocessed sequence reads were subjected to Stacks v2.0’s, “process_radtags” module to confirm the demultiplexed reads and to check the restriction enzyme sites using default parameters. The quality control for the per-base quality of reads and removal of potential adaptor sequences was performed using FastQC and Cutadapt. Reads were then mapped to C. hongheensis as a reference genome using Bowtie2 [44]. The bash command cat was used to combine the two sequences of each sample generated by paired-end sequencing into one sequence. SNP calling for each sample was performed using the Stacks pipeline to build loci (ustacks), create a catalog of loci (cstacks), match samples back to the catalog (sstacks), transpose the data (tsv2bam), add paired-end reads to the analysis, call genotypes, and perform population genomics analysis [45]. For the stacks parameter, m = 5 was set to the minimum coverage depth, and m = 12 was set to the maximum distance between stacks within an individual. The cstacks module-built directories for all samples have n = 12, set as the maximum number of mismatches allowed between individuals. In the population module, we set p = 8 and r = 0.6 to call consensus SNPs. The remaining parameters were defaults.

2.3. Genetic Diversity and Structure Analysis

We calculated the number of private alleles, expected heterozygosity (He), observed heterozygosity (Ho), nucleotide diversity (π), and inbreeding coefficient (FIS) using the “populations” module in Stacks [45].
Population structure was performed from a Bayesian-based analysis using the software Admixture v 1.3.0 [46], and results were visualized in Plink v 1.90 [47]. A population structure analysis of 1–6 clusters was set up (K = 1–6), and the cross-validation error (CV error) was calculated by Admixture v 1.3.0 with the sum of the values of 10 permutations. Principal component analysis (PCA) was performed using the R package adegenet to identify the genetic variation of populations [48].

2.4. Gene Flow and Genetic Differentiation

We used a composite-likelihood approach implemented in TREEMIX (v1.13) to test gene flow among the five Cycas species [49]. The TREEMIX algorithm was run from 0 to 6 migration events using the –m parameter. Residuals were used to select the best-fit model.
The coefficient of genetic differentiation (FST) among populations was calculated in the program vcftools [50]. The values of Nm were estimated from FST, as Nm = (1 − FST)/4 FST for indirectly estimating gene flow [51]. Analysis of molecular variance (AMOVA) was conducted to assess genetic differentiation within populations in Arlequin 3.5.2.1 [52], and the significant level of the variance components was computed using 1000 permutations.

2.5. Population Demographic History

The maximum likelihood (ML) phylogenetic tree of the populations was constructed using the IQ-tree with the recode-INFO-all model [53].
Effective population size was inferred by Stairway Plot v2, a model-flexible method for inferring historical changes in population size based on site frequency spectrum (SFS) [54]. We set the mutation rate at 1.0 × 10⁻⁸ per site and the generation time at 40 years (International Union for Conservation of Nature, 2020). A folded SFS-formatted file was generated by the Python script “easySFS”.
Fastsimcoal 2 (v 2.5) was used to detect bottleneck events based on Ne [55]. The mutation rate was set to 1.0 × 10⁻⁸ because the common mutation rate of the Cycas family is 1.0 × 10⁻⁸ [56]. Statistical models were estimated 50 times, each with 10,000 simulations and 40 executed loops (ECM cycles) for each estimation [57]. The optimal model was selected with the highest parameters.

3. Results

3.1. SNP Characteristics of Cycas Populations

The cstacks module processing generated 3,649,319,605 ± 832,280,494.5 reads, and the average depth per site was 7.5×. We identified 538,982 raw SNPs and then obtained 18,597 loci with 5605 variant sites after SNP calling and filtering with the population module.

3.2. Genetic Diversity of Cycas Species

The populations of five Cycas species showed similar observed heterozygosity (Ho = 0.145–0.428), expected heterozygosity (He = 0.128–0.360), and nucleotide diversity (π = 0.151–0.447) (Table 1). Among the five Cycas species, C. hongheensis (Ho = 0.428, He = 0.360, π = 0.447) (Table 1) showed the highest genetic diversity, while C. debaoensis exhibited the lowest genetic diversity (Ho = 0.145, He = 0.128, π = 0.151) (Table 1). The genetic diversity (Ho, He, and π) between cultivated populations and wild populations was similar for C. debaoensis and C. guizhouensis, respectively (Table 1).

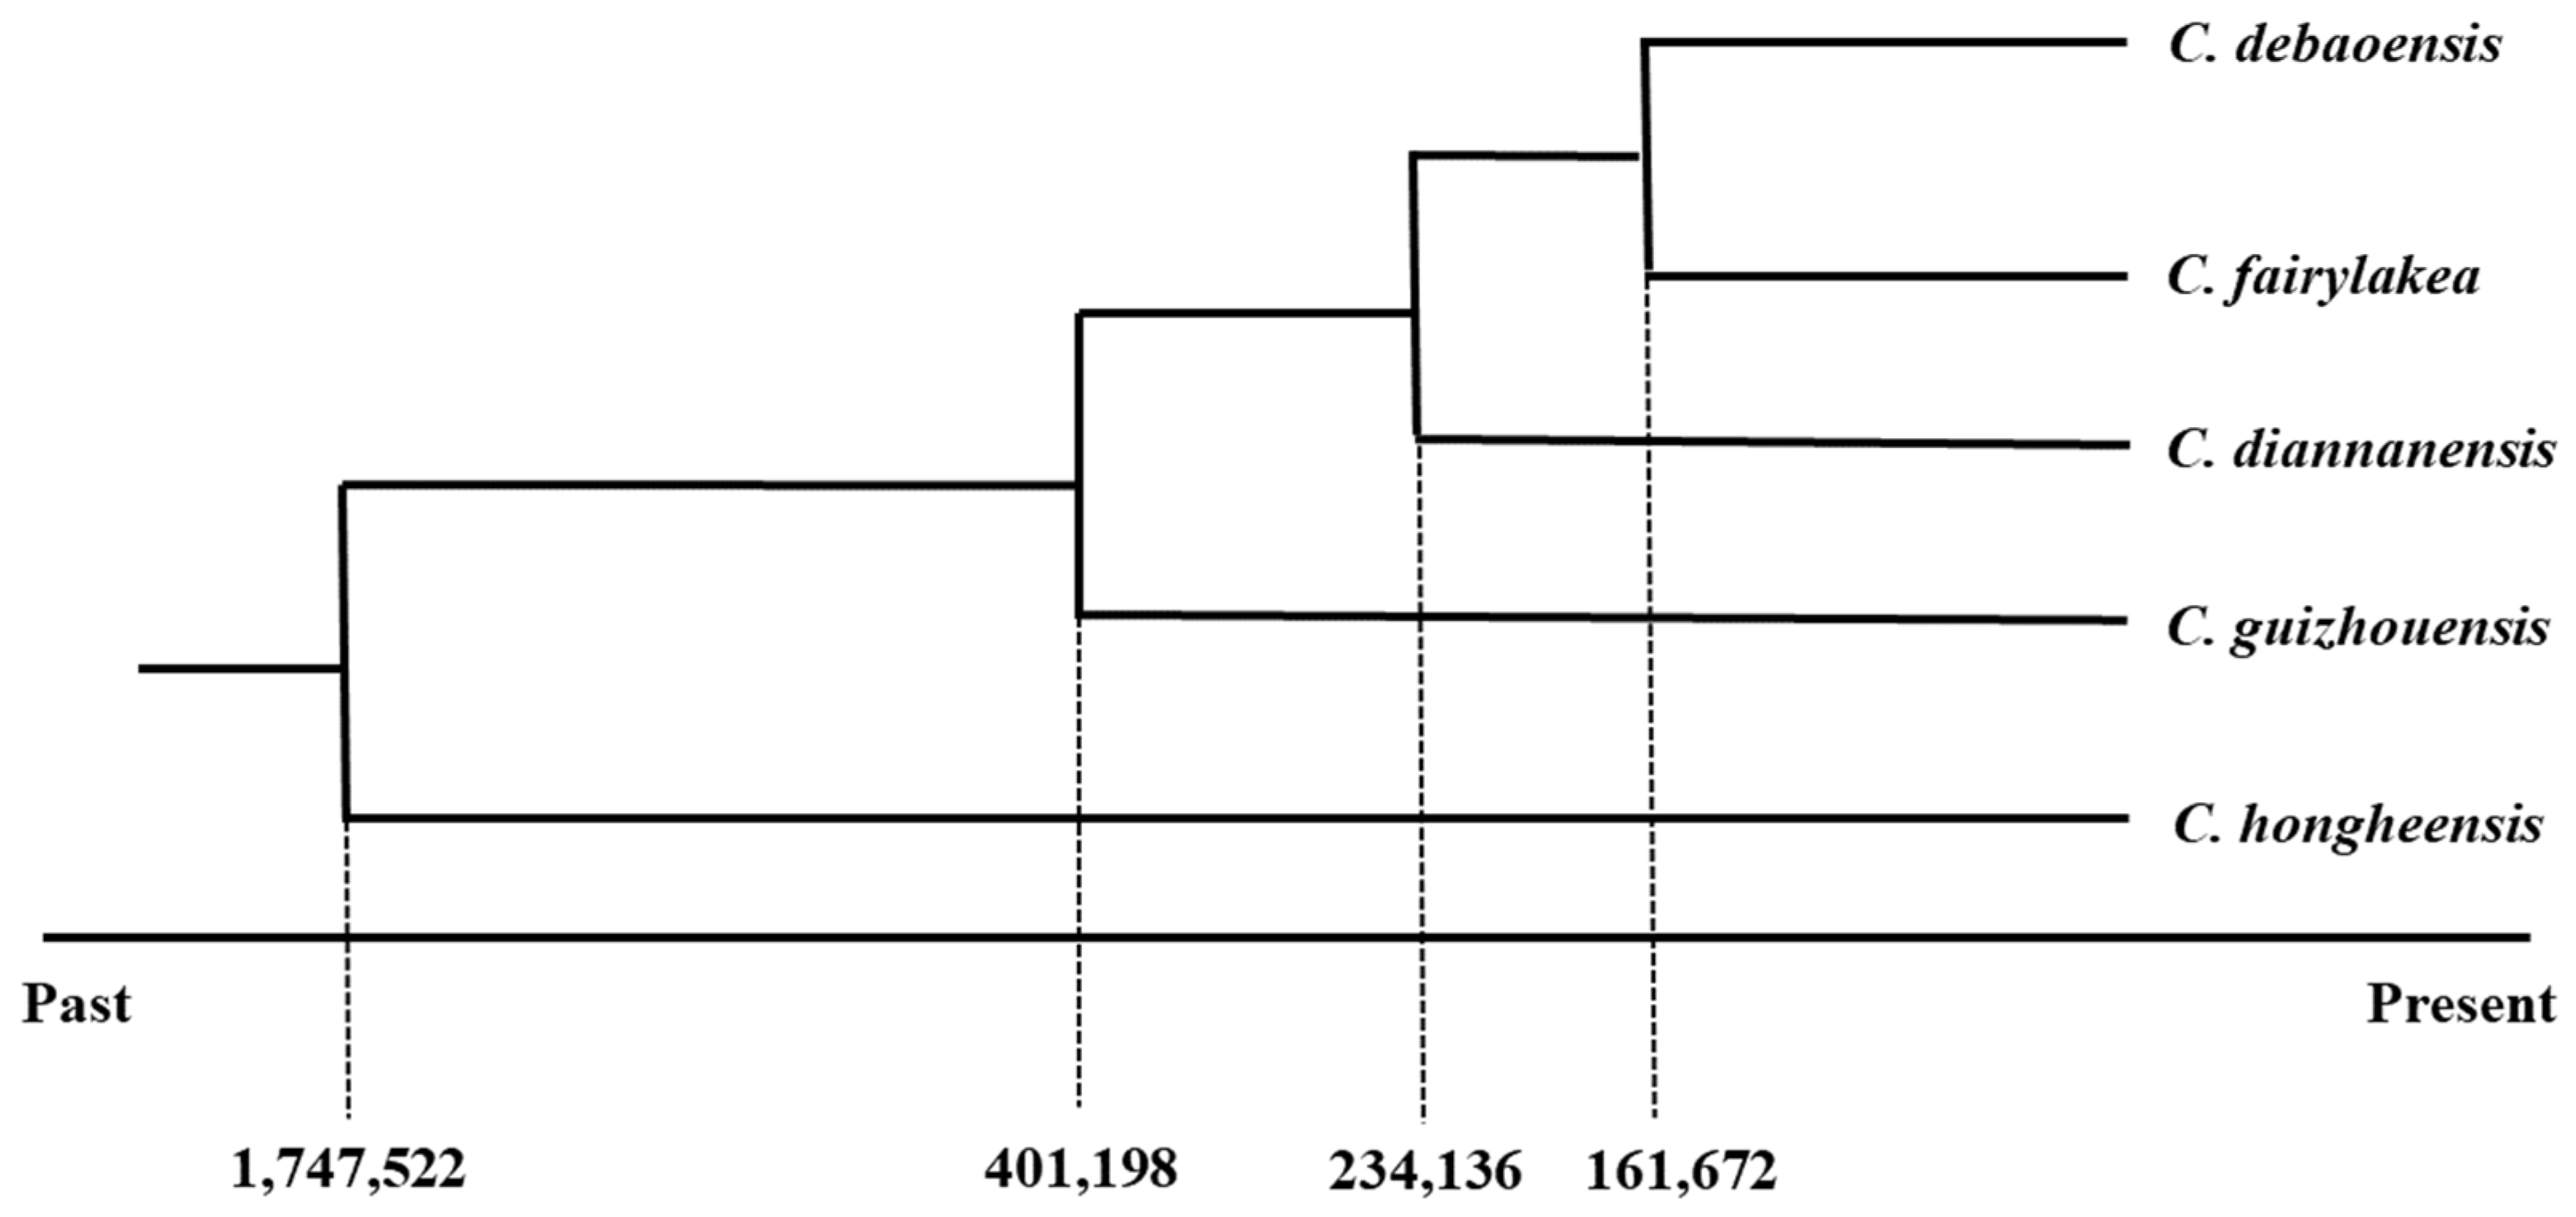
3.3. Genetic Phylogenetic Relationship of the Five Cycas Species

The population structure analysis showed that the C. debaoensis species differed from the other four species (K = 2) (Figure 2 and Table S1). When K  =  3 (best delta K, Figure 2), C. debaoensis, C. fairylakea, and C. guizhouensis separated, while C. hongheensis and C. diannanensis showed introgression from C. fairylakea and C. guizhouensis (Figure 2). When K = 4, C. hongheensis and C. diannanensis still clustered together, corresponding to their closest geographic distribution (Figure 1 and Figure 2). The cultivated and wild populations were not separated for C. debaoensis and C. guizhouensis, respectively (Figure 2).
The principal component analysis (PCA) analysis confirmed the structure results (K  =  3). C. debaoensis, C. fairylakea, and C. guizhouensis separated, while C. hongheensis and C. diannanensis clustered in the center (Figure 3).

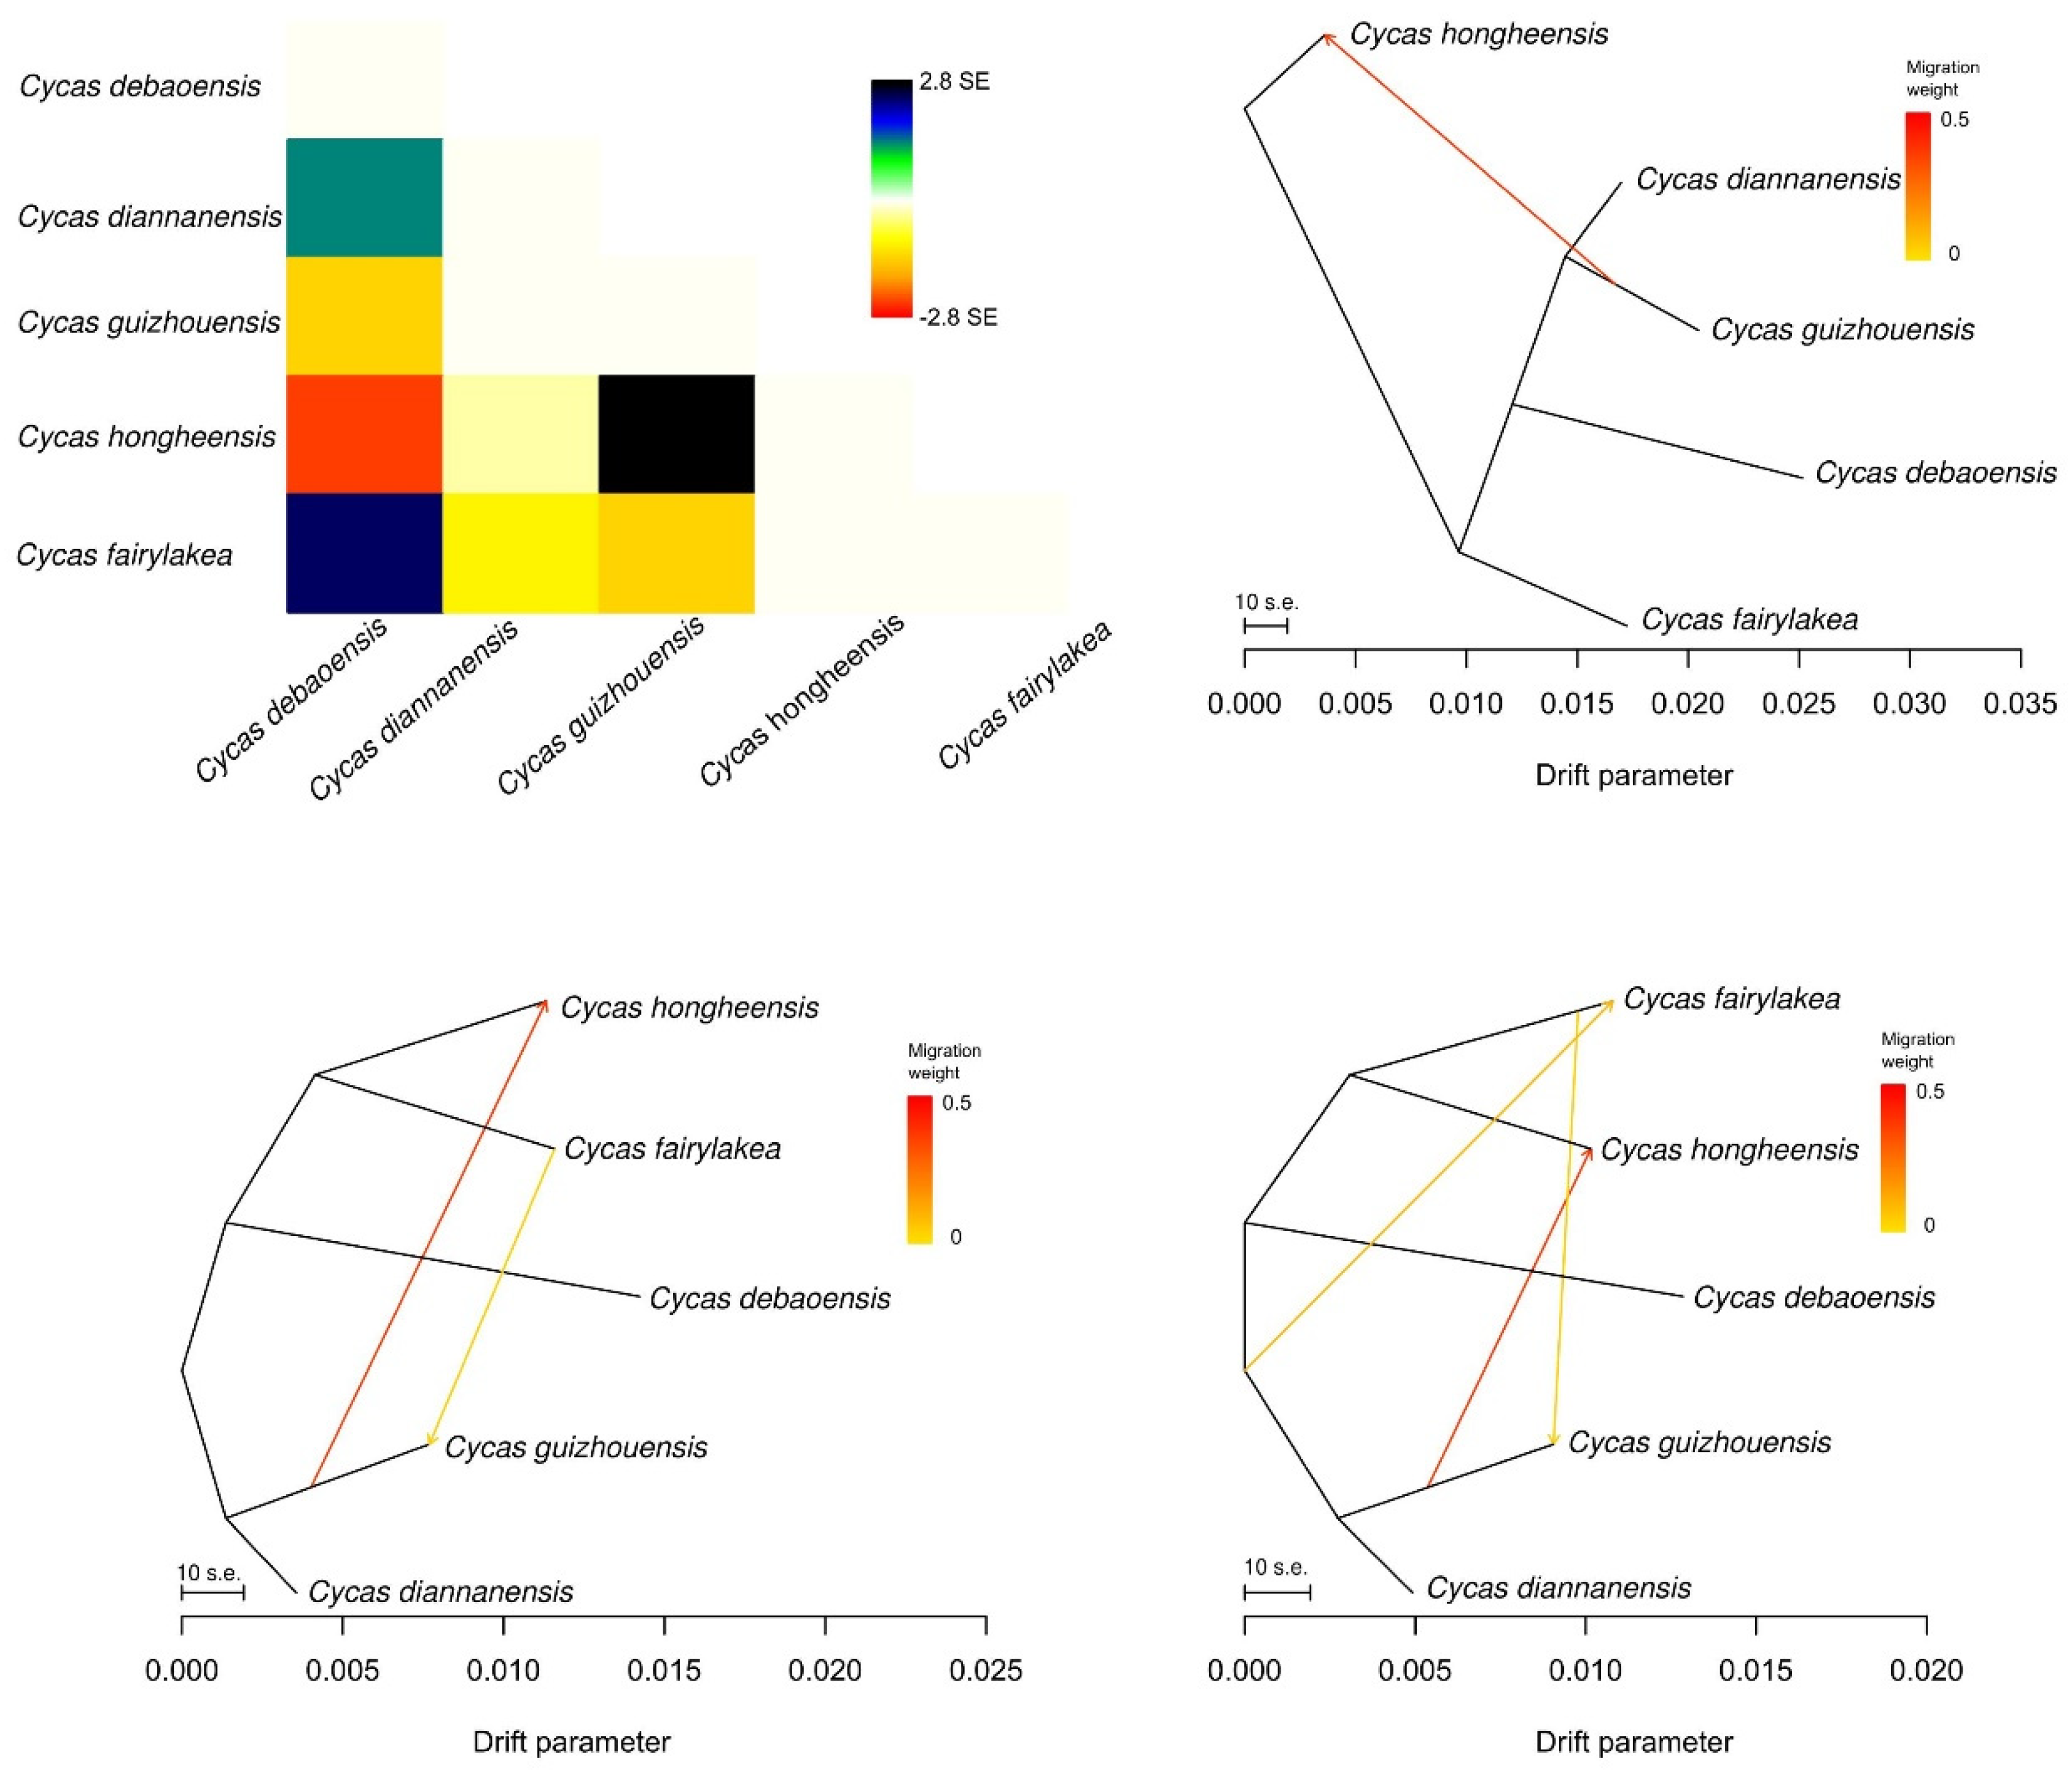
3.4. Genetic Differentiation and Gene Flow among the Five Cycas Species

The genetic differentiation coefficients (FST) ranged from 0.005 to 0.591 among the five Cycas species (Table 2). We detected low levels of genetic differentiation (FST = 0.005–0.012) and high levels of gene flow (Nm = 20.58–49.75) among C. debaoensis–C. fairylakea–C. guizhouensis (Table 2). C. hongheensis showed relatively high genetic differentiation and low gene flow compared to other Cycas species (Table 2). Analysis of molecular variance (AMOVA) showed that 18.66% of the genetic variation of the five Cycas species was attributed to populations and 81.34% to individuals (Table 3).
Among 1–3 migration events in TREEMIX, C. Guizhouensis has a strong gene flow pointed to C. hongheensis, which revealed historic migrations from C. guizhouensis to C. hongheensis, indicating a southward migration of Cycas species (Figure 1, Figure 4, and Figure S2).

3.5. Demographic History of the Five Cycas Species

The optimal result model was confirmed based on the minimum Δ Likelihood (Table S1). Fastsimcoal results showed that C. hongheensis differentiated from the other four Cycas species at ~1.74 Mya (Figure 5). The differentiation time between C. guizhouensis and the other three Cycas species was at ~0.40 Mya. The recent differentiation event occurred at ~0.16 Mya between C. debaoensis and C. fairylakea (Figure 5).
The effective population size of C. hongheensis increased at ~5 Mya, while the other four species underwent bottleneck events at ~1–5 Mya. The effective population size of C. fairylakea and C. guizhouensis started to decrease at ~ 5–10 Mya, and C. debaoensis and that of C. diannanensis started to decrease at ~4–5 Mya (Figure 6).

4. Discussion

Climate change and human activities likely result in habitat fragmentation, limit the geographic ranges of plants and even lead to their extinction [58,59,60]. Maintaining the genetic diversity of natural populations is key to the survival and evolutionary potential of species [61,62]. Cycads, as one of the extant gymnosperm groups, are important for conserving genetic diversity and understanding the origin and early evolution of seed plants [20]. Most Cycas species are narrowly distributed [63], but they have experienced a long evolution process and likely possess high genetic diversity [64]. Here, using genotyping-by-sequencing (GBS), we found that the migration, differentiation, and speciation of Cycas species are associated with historical cooling events.
As an ancient gymnosperm species, cycads are considered to possess high genetic diversity and low genetic differentiation among populations [65,66]. Genetic structure in plant populations is shaped by mating systems, population density, and the continuity of geographical distribution [67,68,69]. Due to the dioicous characteristics and long life cycle of Cycas species, they are considered to have high genetic diversity [20]. However, a lack of pollinators or seed dispersal limits gene flow between populations [70,71]. Liu et al. [20] found that the distribution and phylogeography of Cycas species are shaped by the long-distance seed dispersal driven by ocean current systems. In this study, C. hongheensis has a longer evolutionary history than the other four Cycas species [65,66], which likely explains its high levels of genetic diversity. Maintaining the genetic diversity of C. hongheensis is important to ensure its continued survival and evolutionary potential [61]. However, the other four Cycas species showed low genetic diversity. Previous studies showed relatively high genetic diversity among the four species, e.g., C. debaoensis (Ho = 0.389, He = 0.484 for cpDNA) [72], C. guizhouensis (Ho = 0.311, He = 0.419 for cpDNA and SSR) [27], C. diannanensis (HT = 0.627 for cpDNA) [29], and C. fairylakea (mean Ho = 0.550 and He = 0.420 for SSR) [73]. The difference in genetic diversity is likely due to different methods, i.e., several loci in the SSR and cpDNA analyses but 18,597 loci in this study with GBS.
One reason to explain the relatively low genetic diversity of the four Cycas species that experienced bottleneck events at ~1–5 Mya [74,75] is that the loss of heterozygosity is positively correlated to bottlenecks [76]. In addition, an alternative reason is that four Cycas species have a limited geographical range with small and isolated populations, which likely results in high levels of genetic drift and inbreeding [61,62]. It is consistent with other narrow-ranged species, for example, the threatened species Thuja sutchuenensis (FST = 0.011–0.191 for cpSSR) [77] and three endangered Rhododendron species (FST = 0.128–0.387 for RAD-seq) [78]. Thus, rare species with small populations generally have low genetic diversity compared to those species with large and widespread geographical populations [79,80], such as Paeonia decomposita [81], Mentha cervine [82], and Omphalogramma souliei [83]. The endangered status likely results from intensive human activities [84], e.g., deforestation [85], grazing [86], and road construction [87], which lead to habitat fragmentation and low population size [88].
Understanding long-term demographic history is important not only to elucidate the genetic characteristics of species [89,90] but also to detect the effects of climate change and habitat fragmentation on historical population dynamics [91]. Cycads originated before the mid-Permian and showed the greatest species diversity during the Jurassic-Cretaceous [92,93]. However, the extant cycads have undergone a synchronous global re-diversification at ~12 Mya [16]. We here found that C. hongheensis increased population size, but the other four species underwent bottleneck events at 1~5 Mya, which is consistent with previous studies [16,27,29,72,94]. C. hongheensis differentiated from the other four Cycas species at ~1.74 Mya, which supports the hypothesis that Cycas L. originated in the Quaternary in south China [31]. The divergence time (~1.74 Mya) among Cycas species and bottleneck times (1~5 Mya) of Cycas species correspond to the Pliocene epoch (2.6~5.3 Mya), which was a period of global cooling and drying. Climate change is generally considered an important factor in threatening the survival of plants, particularly those rare and endangered plants with narrow distributions and small population sizes [95]. For example, during the Quaternary (~2.58 Mya), climatic oscillations exerted significant impacts on the genetic diversity of plants in the northern hemisphere [96]. Most cycad plants prefer to live in warm and moist habitats such as valleys or slopes of ridges and cliffs [21]. This likely explains the southward migration of cycad species from C. guizhouensis to C. hongheensis found here. Thus, the glacial-interglacial fluctuation restricted the dispersal of Cycad plants and thus gene flow between populations [25,29,34,39].
Overexploitation not only directly threatens the survival of Cycas species but also destroys their habitats. Thus, it is urgent to take effective measures for the conservation of Cycas species. In situ and ex situ protection are effective for the protection of cycads [97,98]. Ex situ conservation and reintroduction measures can improve the population size and genetic diversity of endemic and endangered species, but it is likely that introgression occurred from cultivated to wild Cycas species [97,99]. This is common in Populus, as many varieties are intentionally introduced, providing conditions for artificial hybridization and introgression [100]. Compared to wild populations, cultivated ones generally have low genetic diversity because founder effects and genetic drift occurred during the process of demonstration and cultivation [77,101], such as Spondias purpurea [102], Morus species [103], and Zanthoxylum [104]. In this study, cultivated C. debaoensis and C. guizhouensis species transplanted from nature to be reintroduced after breeding did not differ from wild populations. That is because wild seedlings are currently transferred to parks [72], and individuals cultivated in the same place might have come from multiple wild source populations. However, limited pollinators and seed dispersal may negatively affect the reproductive systems of Cycas species [105]. For example, the pollination limitation of the alpine shrub Rhododendron aureum weakens its reproductive ability [106]. Thus, it is key to protect the species in its natural habitat (in situ) through setting up nature reserves and protection stations, strengthening artificial pollination, raising local farmer conservation awareness, limiting human activities, conducting research on fast reproduction, and strengthening government management [107,108].

5. Conclusions

In summary, we utilized genotyping by sequencing (GBS) to analyze the genetic structure and differentiation of five endangered cycad species in southwestern China. Results indicate that C. hongheensis showed high genetic diversity, but the other four species showed low genetic diversity that likely resulted from bottleneck events at ~1–5 Mya. The genetic diversity between wild and cultivated populations was similar for C. debaoensis and C. guizhouensis, which is consistent with the results of genetic structure, PCA, and Fst. The population differentiation history and gene flow analysis showed that Cycas species had a southward migration pathway. Moreover, the migration, differentiation, and speciation of Cycas species are associated with historical cooling events. Thus, we proposed strategies for protecting cycad germplasm resources in their natural habitats (in situ) through the construction of nature reserves and other protection stations to strengthen field monitoring.

Supplementary Materials

The following supporting information can be downloaded at: https://www.mdpi.com/article/10.3390/d15050643/s1, Table S1: Parameters of seven demographic models with the Fastsimcoal 2.5.

Author Contributions

Y.L.(Yongbo Liu) and Y.L.(Youzhi Li) designed the study. Z.H., Z.Y., K.W. and Y.L.(Youzhi Li) collected the data. Y.L.(Yongbo Liu), Z.H. and Z.Y. analyzed the data and wrote the paper. All authors have read and agreed to the published version of the manuscript.

Funding

This research was funded by the Biodiversity Survey, Observation, and Assessment of the Ministry of Ecology and Environment, China (2019HJ2096001006).

Institutional Review Board Statement

Not applicable.

Informed Consent Statement

Not applicable.

Data Availability Statement

The original supporting results of this study have been stored in GitHub (https://github.com/HeZhi12/Cycas.git (accessed on 15 March 2023)).

Acknowledgments

We thank local farmers and staffs in natural reserves for their assistance in plant survey and sampling.

Conflicts of Interest

The authors declare no conflict of interest.

References

  1. Schlötterer, C. The evolution of molecular markers—Just a matter of fashion? Nat. Rev. Genet. 2004, 5, 63–69. [Google Scholar] [CrossRef] [PubMed]
  2. Ma, H.; Liu, Y.; Liu, D.; Sun, W.; Liu, X.; Wan, Y.; Zhang, X.; Zhang, R.; Yun, Q.; Wang, J. Chromosome-level genome assembly and population genetic analysis of a critically endangered rhododendron provide insights into its conservation. Plant J. 2021, 107, 1533–1545. [Google Scholar] [CrossRef] [PubMed]
  3. Saccheri, I.; Kuussaari, M.; Kankare, M.; Vikman, P.; Fortelius, W.; Hanski, I. Inbreeding and extinction in a butterfly metapopulation. Nature 1998, 392, 491–494. [Google Scholar] [CrossRef]
  4. Escaravage, N.; Cambecedes, J.; Largier, G.; Pornon, A. Conservation genetics of the rare Pyreneo-Cantabrian endemic Aster pyrenaeus (Asteraceae). AoB Plants 2011, 2011. [Google Scholar] [CrossRef] [PubMed]
  5. Fox, C.W.; Reed, D.H. Inbreeding depression increases with environmental stress: An experimental study and meta-analysis. Evolution 2011, 65, 246–258. [Google Scholar] [CrossRef]
  6. Ouborg, N.; Vergeer, P.; Mix, C. The rough edges of the conservation genetics paradigm for plants. J. Ecol. 2006, 94, 1233–1248. [Google Scholar] [CrossRef]
  7. Wang, K.; Deng, P.; Yao, Z.; Dong, J.; He, Z.; Yang, P.; Liu, Y. Biogeographic patterns of polyploid species for the angiosperm flora in China Running title: Biogeography of polyploid species in China. J. Syst. Evol. 2022. [Google Scholar] [CrossRef]
  8. Xu, J.; Xiao, P.; Li, T.; Wang, Z. Research Progress on endangered plants: A bibliometric analysis. Biodivers. Conserv. 2022, 31, 1125–1147. [Google Scholar] [CrossRef]
  9. Yu, W.; Wu, B.; Wang, X.; Yao, Z.; Li, Y.; Liu, Y. Scale-dependent effects of habitat fragmentation on the genetic diversity of Actinidia chinensis populations in China. Hortic. Res. 2020, 7, 172. [Google Scholar] [CrossRef]
  10. Wu, Q.; Zang, F.; Ma, Y.; Zheng, Y.; Zang, D. Analysis of genetic diversity and population structure in endangered Populus wulianensis based on 18 newly developed EST-SSR markers. Glob. Ecol. Conserv. 2020, 24, e01329. [Google Scholar] [CrossRef]
  11. Wang, X.; Li, L.; Zhao, J.; Li, F.; Guo, W.; Chen, X. Effects of different preservation methods on inter simple sequence repeat (ISSR) and random amplified polymorphic DNA (RAPD) molecular markers in botanic samples. Comptes Rendus Biol. 2017, 340, 204–213. [Google Scholar] [CrossRef] [PubMed]
  12. Tian, Q.; El-Kassaby, Y.A.; Li, W. Revealing the Genetic Structure and Differentiation in Endangered Pinus bungeana by Genome-Wide SNP Markers. Forests 2022, 13, 326. [Google Scholar] [CrossRef]
  13. Nazareno, A.G.; Bemmels, J.B.; Dick, C.W.; Lohmann, L.G. Minimum sample sizes for population genomics: An empirical study from an Amazonian plant species. Mol. Ecol. Resour. 2017, 17, 1136–1147. [Google Scholar] [CrossRef]
  14. Zhang, C.; He, Z.; Dong, X.; Liu, H.; Zhou, H.; Wang, K.; Guo, J.; Liu, Y. History cooling events contributed to the endangered status of Pseudotsuga brevifolia endemic to limestone habitats. Glob. Ecol. Conserv. 2023, 42, e02414. [Google Scholar] [CrossRef]
  15. Cai, C.; Xiao, J.; Ci, X.; Conran, J.G.; Li, J. Genetic diversity of Horsfieldia tetratepala (Myristicaceae), an endangered Plant Species with Extremely Small Populations to China: Implications for its conservation. Plant Syst. Evol. 2021, 307, 50. [Google Scholar] [CrossRef]
  16. Nagalingum, N.S.; Marshall, C.R.; Quental, T.B.; Rai, H.S.; Little, D.P.; Mathews, S. Recent synchronous radiation of a living fossil. Science 2011, 334, 796–799. [Google Scholar] [CrossRef] [PubMed]
  17. Zheng, Y.; Liu, J.; Feng, X.; Gong, X. The distribution, diversity, and conservation status of Cycas in China. Ecol. Evol. 2017, 7, 3212–3224. [Google Scholar] [CrossRef]
  18. Christenhusz, M.J.; Reveal, J.L.; Farjon, A.; Gardner, M.F.; Mill, R.R.; Chase, M.W. A new classification and linear sequence of extant gymnosperms. Phytotaxa 2011, 19, 55–70. [Google Scholar] [CrossRef]
  19. Marler, P.N.; Marler, T.E. An assessment of Red List data for the Cycadales. Trop. Conserv. Sci. 2015, 8, 1114–1125. [Google Scholar] [CrossRef]
  20. Liu, J.; Lindstrom, A.J.; Chen, Y.S.; Nathan, R.; Gong, X. Congruence between ocean-dispersal modelling and phylogeography explains recent evolutionary history of Cycas species with buoyant seeds. New Phytol. 2021, 232, 1863–1875. [Google Scholar] [CrossRef]
  21. Fragnière, Y.; Bétrisey, S.; Cardinaux, L.; Stoffel, M.; Kozlowski, G. Fighting their last stand? A global analysis of the distribution and conservation status of gymnosperms. J. Biogeogr. 2015, 42, 809–820. [Google Scholar] [CrossRef]
  22. Condamine, F.L.; Nagalingum, N.S.; Marshall, C.R.; Morlon, H. Origin and diversification of living cycads: A cautionary tale on the impact of the branching process prior in Bayesian molecular dating. BMC Evol. Biol. 2015, 15, 65. [Google Scholar] [CrossRef]
  23. Hill, K.D.; Stevenson, D.W.; Osborne, R. The world list of cycads. Bot. Rev. 2004, 70, 274–298. [Google Scholar] [CrossRef]
  24. Yang, Y.; Li, Y.; Li, L.F.; Ge, X.J.; Gong, X. Isolation and characterization of microsatellite markers for Cycas debaoensis Y. C. Zhong et C. J. Chen (Cycadaceae). Mol. Ecol. Resour. 2008, 8, 913–915. [Google Scholar] [CrossRef]
  25. Zhan, Q.-Q.; Wang, J.-F.; Gong, X.; Peng, H. Patterns of chloroplast DNA variation in Cycas debaoensis (Cycadaceae): Conservation implications. Conserv. Genet. 2011, 12, 959–970. [Google Scholar] [CrossRef]
  26. Xiao, L.Q.; Ge, X.J.; Gong, X.; Hao, G.; Zheng, S.X. ISSR variation in the endemic and endangered plant Cycas guizhouensis (Cycadaceae). Ann. Bot. 2004, 94, 133–138. [Google Scholar] [CrossRef] [PubMed]
  27. Feng, X.; Zheng, Y.; Gong, X. Middle-Upper Pleistocene climate changes shaped the divergence and demography of Cycas guizhouensis (Cycadaceae): Evidence from DNA sequences and microsatellite markers. Sci. Rep. 2016, 6, 27368. [Google Scholar] [CrossRef]
  28. Wang, D.P.; Peng, S.L.; Chen, F.P.; Ji, S.Y. Population dynamics and considerations for the conservation of the rare Cycas fairylakea in China. For. Stud. China 2012, 14, 118–123. [Google Scholar] [CrossRef]
  29. Liu, J.; Zhou, W.; Gong, X. Species delimitation, genetic diversity and population historical dynamics of Cycas diannanensis (Cycadaceae) occurring sympatrically in the Red River region of China. Front. Plant Sci. 2015, 6, 696. [Google Scholar] [CrossRef]
  30. Wade, E.M.; Nadarajan, J.; Yang, X.; Ballesteros, D.; Sun, W.; Pritchard, H.W. Plant species with extremely small populations (PSESP) in China: A seed and spore biology perspective. Plant Divers. 2016, 38, 209–220. [Google Scholar] [CrossRef]
  31. Liu, J.; Zhang, S.; Nagalingum, N.S.; Chiang, Y.C.; Lindstrom, A.J.; Gong, X. Phylogeny of the gymnosperm genus Cycas L. (Cycadaceae) as inferred from plastid and nuclear loci based on a large-scale sampling: Evolutionary relationships and taxonomical implications. Mol. Phylogen. Evol. 2018, 127, 87–97. [Google Scholar] [CrossRef] [PubMed]
  32. Chiang, Y.C.; Hung, K.H.; Moore, S.J.; Ge, X.J.; Huang, S.; Hsu, T.W.; Schaal, B.A.; Chiang, T. Paraphyly of organelle DNAs in Cycas Sect. Asiorientales due to ancient ancestral polymorphisms. BMC Evol. Biol. 2009, 9, 161. [Google Scholar] [CrossRef] [PubMed]
  33. Cibrián-Jaramillo, A.; Daly, A.C.; Brenner, E.; Desalle, R.; Marler, T.E. When North and South don’t mix: Genetic connectivity of a recently endangered oceanic cycad, Cycas micronesica, in Guam using EST-microsatellites. Mol. Ecol. 2010, 19, 2364–2379. [Google Scholar] [CrossRef] [PubMed]
  34. Feng, X.; Wang, Y.; Gong, X. Genetic diversity, genetic structure and demographic history of Cycas simplicipinna (Cycadaceae) assessed by DNA sequences and SSR markers. BMC Plant Biol. 2014, 14, 187. [Google Scholar] [CrossRef]
  35. Feng, X.; Liu, J.; Gong, X. Species Delimitation of the Cycas segmentifida Complex (Cycadaceae) Resolved by Phylogenetic and Distance Analyses of Molecular Data. Front. Plant Sci. 2016, 7, 134. [Google Scholar] [CrossRef]
  36. Yessoufou, K.; Daru, B.H.; Tafirei, R.; Elansary, H.O.; Rampedi, I. Integrating biogeography, threat and evolutionary data to explore extinction crisis in the taxonomic group of cycads. Ecol. Evol. 2017, 7, 2735–2746. [Google Scholar] [CrossRef]
  37. Xiao, L.Q.; Möller, M. Nuclear ribosomal ITS functional paralogs resolve the phylogenetic relationships of a late-Miocene radiation cycad Cycas (Cycadaceae). PLoS ONE 2015, 10, e0117971. [Google Scholar] [CrossRef]
  38. Gong, Y.Q.; Zhan, Q.Q.; Nguyen, K.S.; Nguyen, H.T.; Wang, Y.H.; Gong, X. The historical demography and genetic variation of the endangered Cycas multipinnata (Cycadaceae) in the red river region, examined by chloroplast DNA sequences and microsatellite markers. PLoS ONE 2015, 10, e0117719. [Google Scholar] [CrossRef]
  39. Zheng, Y.; Liu, J.; Gong, X. Tectonic and climatic impacts on the biota within the Red River Fault, evidence from phylogeography of Cycas dolichophylla (Cycadaceae). Sci. Rep. 2016, 6, 33540. [Google Scholar] [CrossRef]
  40. Roodt, D.; Lohaus, R.; Sterck, L.; Swanepoel, R.L.; Van de Peer, Y.; Mizrachi, E. Evidence for an ancient whole genome duplication in the cycad lineage. PLoS ONE 2017, 12, e0184454. [Google Scholar] [CrossRef]
  41. Tao, Y.; Chen, B.; Kang, M.; Liu, Y.; Wang, J. Genome-Wide Evidence for Complex Hybridization and Demographic History in a Group of Cycas From China. Front. Genet. 2021, 12, 1614. [Google Scholar] [CrossRef] [PubMed]
  42. Elshire, R.J.; Glaubitz, J.C.; Sun, Q.; Poland, J.A.; Kawamoto, K.; Buckler, E.S.; Mitchell, S.E. A robust, simple genotyping-by-sequencing (GBS) approach for high diversity species. PLoS ONE 2011, 6, e19379. [Google Scholar] [CrossRef]
  43. Brown, J.; Pirrung, M.; McCue, L.A. FQC Dashboard: Integrates FastQC results into a web-based, interactive, and extensible FASTQ quality control tool. Bioinformatics 2017, 33, 3137–3139. [Google Scholar] [CrossRef] [PubMed]
  44. Liu, J.; Lindstrom, A.J.; Gong, X. Towards the plastome evolution and phylogeny of Cycas L.(Cycadaceae): Molecular-morphology discordance and gene tree space analysis. BMC Plant Biol. 2022, 22, 116. [Google Scholar] [CrossRef] [PubMed]
  45. Catchen, J.; Hohenlohe, P.A.; Bassham, S.; Amores, A.; Cresko, W.A. Stacks: An analysis tool set for population genomics. Mol. Ecol. 2013, 22, 3124–3140. [Google Scholar] [CrossRef] [PubMed]
  46. Alexander, D.H.; Novembre, J.; Lange, K. Fast model-based estimation of ancestry in unrelated individuals. Genome Res. 2009, 19, 1655–1664. [Google Scholar] [CrossRef] [PubMed]
  47. Chang, C.C.; Chow, C.C.; Tellier, L.C.; Vattikuti, S.; Purcell, S.M.; Lee, J.J. Second-generation PLINK: Rising to the challenge of larger and richer datasets. Gigascience 2015, 4, 7. [Google Scholar] [CrossRef]
  48. Jombart, T. Adegenet: A R package for the multivariate analysis of genetic markers. Bioinformatics 2008, 24, 1403–1405. [Google Scholar] [CrossRef]
  49. Pickrell, J.K.; Pritchard, J.K. Inference of population splits and mixtures from genome-wide allele frequency data. PLoS Genet. 2012, 8, e1002967. [Google Scholar] [CrossRef]
  50. McKenna, A.; Hanna, M.; Banks, E.; Sivachenko, A.; Cibulskis, K.; Kernytsky, A.; Garimella, K.; Altshuler, D.; Gabriel, S.; Daly, M.; et al. The Genome Analysis Toolkit: A MapReduce framework for analyzing next-generation DNA sequencing data. Genome Res. 2010, 20, 1297–1303. [Google Scholar] [CrossRef]
  51. Wright, S. The genetical structure of populations. Ann. Eugen. 1951, 15, 323–354. [Google Scholar] [CrossRef] [PubMed]
  52. Excoffier, L.; Lischer, H.E.L. Arlequin suite ver 3.5: A new series of programs to perform population genetics analyses under Linux and Windows. Mol. Ecol. Resour. 2010, 10, 564–567. [Google Scholar] [CrossRef] [PubMed]
  53. Nguyen, L.T.; Schmidt, H.A.; von Haeseler, A.; Minh, B.Q. IQ-TREE: A fast and effective stochastic algorithm for estimating maximum-likelihood phylogenies. Mol. Biol. Evol. 2015, 32, 268–274. [Google Scholar] [CrossRef] [PubMed]
  54. Liu, X.; Fu, Y.X. Stairway Plot 2: Demographic history inference with folded SNP frequency spectra. Genome Biol. 2020, 21, 280. [Google Scholar] [CrossRef] [PubMed]
  55. Terrab, A.; Talavera, S.; Arista, M.; Paun, O.; Stuessy, T.F.; Tremetsberger, K. Genetic diversity at chloroplast microsatellites (cpSSRs) and geographic structure in endangered West Mediterranean firs (Abies spp., Pinaceae). Taxon 2007, 56, 409–416. [Google Scholar] [CrossRef]
  56. Yang, R.; Feng, X.; Gong, X. Genetic structure and demographic history of Cycas chenii (Cycadaceae), an endangered species with extremely small populations. Plant Divers. 2017, 39, 44–51. [Google Scholar] [CrossRef] [PubMed]
  57. Excoffier, L.; Marchi, N.; Marques, D.A.; Matthey-Doret, R.; Gouy, A.; Sousa, V.C. fastsimcoal2: Demographic inference under complex evolutionary scenarios. Bioinformatics 2021, 37, 4882–4885. [Google Scholar] [CrossRef]
  58. Hamrick, J.L.; Godt, M.J.W. Effects of life history traits on genetic diversity in plant species. Philos. Trans. R. Soc. B Biol. Sci. 1996, 351, 1291–1298. [Google Scholar] [CrossRef]
  59. Frankham, R.; Briscoe, D.A. Introduction to Conservation Genetics; Cambridge University Press: Cambridge, UK, 2010. [Google Scholar]
  60. Nybom, H. Comparison of different nuclear DNA markers for estimating intraspecific genetic diversity in plants. Mol. Ecol. 2004, 13, 1143–1155. [Google Scholar] [CrossRef]
  61. Daszak, P.; Cunningham, A.A.; Hyatt, A.D. Emerging infectious diseases of wildlife--threats to biodiversity and human health. Science 2000, 287, 443–449. [Google Scholar] [CrossRef]
  62. Barrett, R.D.; Schluter, D. Adaptation from standing genetic variation. Trends Ecol. Evol. 2008, 23, 38–44. [Google Scholar] [CrossRef]
  63. Li, J. Flora of China. Harv. Pap. Bot. 2007, 13, 301–302. [Google Scholar] [CrossRef]
  64. Axsmith, B.J.; Serbet, R.; Krings, M.; Taylor, T.N.; Taylor, E.L.; Mamay, S.H. The enigmatic Paleozoic plants Spermopteris and Phasmatocycas reconsidered. Am. J. Bot. 2003, 90, 1585–1595. [Google Scholar] [CrossRef] [PubMed]
  65. Hamrick, J.L. Factors influencing levels of genetic diversity in woody plant species. In Population Genetics of Forest Trees; Springer Netherlands: Dordrecht, The Netherlands, 1992. [Google Scholar] [CrossRef]
  66. Arenas, M.; Ray, N.; Currat, M.; Excoffier, L. Consequences of range contractions and range shifts on molecular diversity. Mol. Biol. Evol. 2012, 29, 207–218. [Google Scholar] [CrossRef] [PubMed]
  67. Barrett, S.C.; Harder, L.D. The ecology of mating and its evolutionary consequences in seed plants. Annu. Rev. Ecol. Evol. Syst. 2017, 48, 135–157. [Google Scholar] [CrossRef]
  68. Vekemans, X.; Hardy, O.J. New insights from fine-scale spatial genetic structure analyses in plant populations. Mol. Ecol. 2004, 13, 921–935. [Google Scholar] [CrossRef]
  69. Kramer, A.T.; Fant, J.B.; Ashley, M.V. Influences of landscape and pollinators on population genetic structure: Examples from three Penstemon (Plantaginaceae) species in the Great Basin. Am. J. Bot. 2011, 98, 109–121. [Google Scholar] [CrossRef]
  70. Slarkin, M. Gene flow in natural populations. Annu. Rev. Ecol. Syst. Biodivers. 1985, 16, 393–430. [Google Scholar] [CrossRef]
  71. Zhou, T.H.; Qian, Z.Q.; Li, S.; Guo, Z.G.; Huang, Z.H.; Liu, Z.L.; Zhao, G.F. Genetic diversity of the endangered Chinese endemic herb Saruma henryi Oliv.(Aristolochiaceae) and its implications for conservation. Popul. Ecol. 2010, 52, 223–231. [Google Scholar] [CrossRef]
  72. Gong, Y.-Q.; Gong, X. Pollen-mediated gene flow promotes low nuclear genetic differentiation among populations of Cycas debaoensis (Cycadaceae). Tree Genet. Genomes 2016, 12, 93. [Google Scholar] [CrossRef]
  73. Wang, Y.; Li, N.; Chen, T.; Deng, H. Screening of microsatellite loci by cross-species amplification and their use in Cycas fairylakea (Cycadaceae). Guihaia 2014, 34, 608–613, (In Chinese with English Abstract). [Google Scholar]
  74. Nei, M.; Maruyama, T.; Chakraborty, R. The bottleneck effect and genetic variability in populations. Evolution 1975, 29, 1–10. [Google Scholar] [CrossRef] [PubMed]
  75. Pimm, S.L.; Gittleman, J.L.; McCracken, G.F.; Gilpin, M. Plausible alternatives to bottlenecks to explain reduced genetic diversity. Trends Ecol. Evol. 1989, 4, 176–178. [Google Scholar] [CrossRef] [PubMed]
  76. Montgomery, M.E.; Woodworth, L.M.; Nurthen, R.K.; Gilligan, D.M.; Briscoe, D.A.; Frankham, R. Relationships between population size and loss of genetic diversity: Comparisons of experimental results with theoretical predictions. Conserv. Genet. 2000, 1, 33–43. [Google Scholar] [CrossRef]
  77. Yao, Z.; Wang, X.; Wang, K.; Yu, W.; Deng, P.; Dong, J.; Li, Y.; Cui, K.; Liu, Y. Chloroplast and Nuclear Genetic Diversity Explain the Limited Distribution of Endangered and Endemic Thuja sutchuenensis in China. Front. Genet. 2021, 12, 801229. [Google Scholar] [CrossRef] [PubMed]
  78. Wang, K.; Zhou, X.-H.; Liu, D.; Li, Y.; Yao, Z.; He, W.-M.; Liu, Y. The uplift of the Hengduan Mountains contributed to the speciation of three Rhododendron species. Glob. Ecol. Conserv. 2022, 35, e02085. [Google Scholar] [CrossRef]
  79. Clegg, M.T.; Kahler, A.L.; Weir, B.S. Plant Population Genetics, Breeding, and Genetic Resources; Sinauer Associates: Sunderland, MA, USA, 1989. [Google Scholar]
  80. Willi, Y.; Van Buskirk, J.; Hoffmann, A.A. Limits to the adaptive potential of small populations. Annu. Rev. Ecol. Evol. Syst. 2006, 37, 433–458. [Google Scholar] [CrossRef]
  81. Wang, S.-Q. Genetic diversity and population structure of the endangered species Paeonia decomposita endemic to China and implications for its conservation. BMC Plant Biol. 2020, 20, 510. [Google Scholar] [CrossRef]
  82. Rodrigues, L.; van den Berg, C.; Póvoa, O.; Monteiro, A. Low genetic diversity and significant structuring in the endangered Mentha cervina populations and its implications for conservation. Biochem. Syst. Ecol. 2013, 50, 51–61. [Google Scholar] [CrossRef]
  83. Huang, Y.; Zhang, C.Q.; Li, D.Z. Low genetic diversity and high genetic differentiation in the critically endangered Omphalogramma souliei (Primulaceae): Implications for its conservation. J. Syst. Evol. 2009, 47, 103–109. [Google Scholar] [CrossRef]
  84. Xu, W.-B.; Svenning, J.-C.; Chen, G.-K.; Zhang, M.-G.; Huang, J.-H.; Chen, B.; Ordonez, A.; Ma, K.-P. Human activities have opposing effects on distributions of narrow-ranged and widespread plant species in China. Proc. Natl. Acad. Sci. USA 2019, 116, 26674–26681. [Google Scholar] [CrossRef] [PubMed]
  85. Jha, S.; Bawa, K.S. Population growth, human development, and deforestation in biodiversity hotspots. Conserv. Biol. 2006, 20, 906–912. [Google Scholar] [CrossRef] [PubMed]
  86. Peng, J.; Liang, C.; Niu, Y.; Jiang, W.; Wang, W.; Wang, L. Moderate grazing promotes genetic diversity of Stipa species in the Inner Mongolian steppe. Landsc. Ecol. 2015, 30, 1783–1794. [Google Scholar] [CrossRef]
  87. Jackson, N.D.; Fahrig, L. Relative effects of road mortality and decreased connectivity on population genetic diversity. Biol. Conserv. 2011, 144, 3143–3148. [Google Scholar] [CrossRef]
  88. Mona, S.; Arenas, M.; Excoffier, L. Genetic consequences of habitat fragmentation during a range expansion. Heredity 2014, 112, 291–299. [Google Scholar] [CrossRef] [PubMed]
  89. Hewitt, G. The genetic legacy of the Quaternary ice ages. Nature 2000, 405, 907–913. [Google Scholar] [CrossRef]
  90. Ekblom, R.; Brechlin, B.; Persson, J.; Smeds, L.; Johansson, M.; Magnusson, J.; Flagstad, Ø.; Ellegren, H. Genome sequencing and conservation genomics in the Scandinavian wolverine population. Conserv. Biol. 2018, 32, 1301–1312. [Google Scholar] [CrossRef]
  91. Selwood, K.E.; McGeoch, M.A.; Mac Nally, R. The effects of climate change and land-use change on demographic rates and population viability. Biol. Rev. Camb. Philos. Soc. 2015, 90, 837–853. [Google Scholar] [CrossRef]
  92. Jones, D.L. Cycads of the World; Smithsonian: Washington, DC, USA, 1993. [Google Scholar]
  93. Mustoe, G.E. Coevolution of cycads and dinosaurs. Cycad Newsl. 2007, 30, 6–9. [Google Scholar]
  94. Wang, X.H.; Li, J.; Zhang, L.M.; He, Z.W.; Mei, Q.M.; Gong, X.; Jian, S.G. Population Differentiation and Demographic History of the Cycas taiwaniana Complex (Cycadaceae) Endemic to South China as Indicated by DNA Sequences and Microsatellite Markers. Front. Genet. 2019, 10, 1238. [Google Scholar] [CrossRef]
  95. Ulrey, C.; Quintana-Ascencio, P.F.; Kauffman, G.; Smith, A.B.; Menges, E.S. Life at the top: Long-term demography, microclimatic refugia, and responses to climate change for a high-elevation southern Appalachian endemic plant. Biol. Conserv. 2016, 200, 80–92. [Google Scholar] [CrossRef]
  96. Qiu, Y.X.; Fu, C.X.; Comes, H.P. Plant molecular phylogeography in China and adjacent regions: Tracing the genetic imprints of Quaternary climate and environmental change in the world’s most diverse temperate flora. Mol. Phylogenet. Evol. 2011, 59, 225–244. [Google Scholar] [CrossRef] [PubMed]
  97. Griffith, M.P.; Calonje, M.; Meerow, A.W.; Tut, F.; Kramer, A.T.; Hird, A.; Magellan, T.M.; Husby, C.E. Can a botanic garden cycad collection capture the genetic diversity in a wild population? Int. J. Plant Sci. 2015, 176, 1–10. [Google Scholar] [CrossRef]
  98. Griffith, M.P.; Calonje, M.; Meerow, A.W.; Francisco-Ortega, J.; Knowles, L.; Aguilar, R.; Tut, F.; Sánchez, V.; Meyer, A.; Noblick, L.R. Will the same ex situ protocols give similar results for closely related species? Biodivers. Conserv. 2017, 26, 2951–2966. [Google Scholar] [CrossRef]
  99. Hoban, S.; Callicrate, T.; Clark, J.; Deans, S.; Dosmann, M.; Fant, J.; Gailing, O.; Havens, K.; Hipp, A.L.; Kadav, P. Taxonomic similarity does not predict necessary sample size for ex situ conservation: A comparison among five genera. Proc. R. Soc. B 2020, 287, 20200102. [Google Scholar] [CrossRef]
  100. Broeck, A.V.; Villar, M.; Van Bockstaele, E.; VanSlycken, J. Natural hybridization between cultivated poplars and their wild relatives: Evidence and consequences for native poplar populations. Ann. For. Sci. 2005, 62, 601–613. [Google Scholar] [CrossRef]
  101. Cohen, J.I.; Williams, J.T.; Plucknett, D.L.; Shands, H. Ex situ conservation of plant genetic resources: Global development and environmental concerns. Science 1991, 253, 866–872. [Google Scholar] [CrossRef]
  102. Miller, A.J.; Schaal, B.A. Domestication and the distribution of genetic variation in wild and cultivated populations of the Mesoamerican fruit tree Spondias purpurea L.(Anacardiaceae). Mol. Ecol. 2006, 15, 1467–1480. [Google Scholar] [CrossRef]
  103. Weiguo, Z.; Zhihua, Z.; Xuexia, M.; Yong, Z.; Sibao, W.; Jianhua, H.; Hui, X.; Yile, P.; Yongping, H. A comparison of genetic variation among wild and cultivated Morus species (Moraceae: Morus) as revealed by ISSR and SSR markers. Biodivers. Conserv. 2007, 16, 275–290. [Google Scholar] [CrossRef]
  104. Feng, S.; Yang, T.; Liu, Z.; Chen, L.; Hou, N.; Wang, Y.; Wei, A. Genetic diversity and relationships of wild and cultivated Zanthoxylum germplasms based on sequence-related amplified polymorphism (SRAP) markers. Genet. Resour. Crop Evol. 2015, 62, 1193–1204. [Google Scholar] [CrossRef]
  105. Tang, R.; Li, Y.; Xu, Y.; Schinnerl, J.; Sun, W.; Chen, G. In-situ and ex situ pollination biology of the four threatened plant species and the significance for conservation. Biodivers. Conserv. 2020, 29, 381–391. [Google Scholar] [CrossRef]
  106. Hirao, A.; Kameyama, Y.; Ohara, M.; Isagi, Y.; Kudo, G. Seasonal changes in pollinator activity influence pollen dispersal and seed production of the alpine shrub Rhododendron aureum (Ericaceae). Mol. Ecol. 2006, 15, 1165–1173. [Google Scholar] [CrossRef] [PubMed]
  107. Xu, G.; Tang, W.; Skelley, P.; Liu, N.; Rich, S. Cycadophila, a new genus (Coleoptera: Erotylidae: Pharaxonothinae) inhabiting Cycas debaoensis (Cycadaceae) in Asia. Zootaxa 2015, 3986, 251–278. [Google Scholar] [CrossRef] [PubMed]
  108. Clugston, J.A.; Ruhsam, M.; Kenicer, G.J.; Henwood, M.; Milne, R.; Nagalingum, N.S. Conservation genomics of an Australian cycad Cycas calcicola, and the Absence of Key Genotypes in Botanic Gardens. Conserv. Genet. 2022, 23, 449–465. [Google Scholar] [CrossRef]
Figure 1. Sampling sites and geographic distributions of the five Cycas species in China.
Diversity 15 00643 g001
Figure 2. Genetic structures of populations of five Cycas species. Population structure bar plots show the clustering of samples from K = 2 to 4. The best K = 3. Each vertical bar indicates a single individual, and the height of each colored bar represents the proportion of assignments to a given cluster. The red line segment distinguishes between wild species (left) and cultivated species (right) within the species.
Diversity 15 00643 g002
Figure 3. Plots of the first two dimensions of a principal component analysis (PCA) for all individuals of the five Cycas species.
Diversity 15 00643 g003
Figure 4. TREEMIX results showing historical mitigation events among the five Cycas species. Upper left corner shows residual fit plots in the TREEMIX analysis. We divided the residual covariance between each pair of populations by the average standard error across all pairs. We then plot in each cell this scaled residual. Colors are described in the palette on the right. Residuals above zero represent populations that are more closely related to each other in the data than in the best-fit tree and thus are candidates for admixture events.
Diversity 15 00643 g004
Figure 5. Best-fitting model inferring demographic histories and differentiation for the five Cycas species implemented by the Fastsimcoal 2.5. Number unit: years ago.
Diversity 15 00643 g005
Figure 6. Historical effective population sizes of five Cycas species. Black lines and gray shadows represent the medians and the 2.5 and 97.5 percentiles, respectively.
Diversity 15 00643 g006
Table 1. Genetic diversity of Cycas species based on all sits (variant and fixed).
SpeciesNPopulationsVariant SitesPrivatePoly sitesPoly (%)pHoHeπ
C. debaoensis53CS 29112121101190.1870.8770.2420.2010.200
WS 240.2680.2200.198
C. diannanensis17 1121186276.8960.8940.2030.1840.234
C. fairylakea21 1121985476.1820.8990.1900.1710.222
C. guizhouensis36CS 31112110102691.5250.8900.1860.1660.200
WS 50.4000.3360.198
C. hongheensis6 1121031127.7430.9280.4280.3600.447
Abbreviation: N, population sample size; Variant sites, variant nucleotide sites; Private, the number of variable sites unique to each population; Poly, a percentage of polymorphic loci; Ho, the average observed heterozygosity per locus; He, the average excepted heterozygosity per locus; π, the average nucleotide diversity; FIS, the average Wright’s inbreeding coefficient; CS, cultivated population; WS, wild population.
Table 2. Matrix of pairwise FST and Nm coefficient of Cycas species.
C. debaoensisC. diannanensisC. fairylakeaC. guizhouensisC. hongheensis
C. debaoensis 1.68820.58341.4170.239
C. diannanensis0.129 1.3531.4390.285
C. fairylakea0.0120.156 49.7500.173
C. guizhouensis0.0060.1480.005 0.188
C. hongheensis0.5110.4670.5910.571
Top-right matrix refers to the pairwise gene flow coefficient. Lower-left matrix refers to the pairwise genetic differentiation coefficient.
Table 3. Analysis of molecular variance (AMOVA) in five Cycas species.
Source of VariationdfSSσ%
Among species49.4890.05218.66
Among individuals within species11224.383−0.009−3.12
Within species11727.50.23584.45
Total22361.3720.278
Note: df: degree of freedom; SS: sum of squares; MS: mean of squares; σ: each species and the percent of the total variance explained by each source of variance; %: percentage of variance.
Disclaimer/Publisher’s Note: The statements, opinions and data contained in all publications are solely those of the individual author(s) and contributor(s) and not of MDPI and/or the editor(s). MDPI and/or the editor(s) disclaim responsibility for any injury to people or property resulting from any ideas, methods, instructions or products referred to in the content.

