Article

Assessing Biodiversity Conditions in Cocoa Agroforests with a Rapid Assessment Method: Outcomes from a Large-Scale Application in Ghana

by
Sandra Oliveira
1,2,*,
Jessica E. Raneri
3,4 and
Stephan F. Weise
5
1
Centre of Geographical Studies, Institute of Geography and Spatial Planning, University of Lisbon, 1600-276 Lisbon, Portugal
2
Associated Laboratory Terra, 1349-017 Lisbon, Portugal
3
Nutrition-Senstive Agriculture Advisor to the Australian Centre for International Agricultural Research and the Agriculture Development and Food Security Section, Department of Foreign Affairs and Trade, Canberra, ACT 0221, Australia
4
Department of Food Technology, Safety and Health, Ghent University, B-9000 Ghent, Belgium
5
Alliance of Bioversity International and CIAT, Bayan Lepas 11960, Penang, Malaysia
*
Author to whom correspondence should be addressed.
Diversity 2023, 15(4), 503; https://doi.org/10.3390/d15040503
Submission received: 31 January 2023 / Revised: 16 March 2023 / Accepted: 23 March 2023 / Published: 1 April 2023
(This article belongs to the Special Issue Diversity in 2023)

Abstract

:
Cocoa fields in West Africa traditionally kept other tree species to provide shade for cocoa trees and obtain food and other products. Measuring other trees is paramount to monitoring environmental conditions in cocoa agroforests, but it has been difficult to apply at a large scale. This study presents the results of a rapid assessment method applied in Ghana, developed to measure non-cocoa tree characteristics based on easily observed parameters using sample surveys and mapping tools. We collected data from over 8700 cocoa farms and evaluated their biodiversity performance based on 6 indicators classified according to recommended thresholds to benefit biodiversity conditions. Our results show that species richness, shade cover, and potential for tree succession have the lowest proportions of fields with the recommended levels, with variations among regions and districts. The methodological procedure allowed us to identify priority areas and indicators falling behind desirable thresholds, which can inform training and management approaches regarding biodiversity-friendly practices in cocoa fields tailored to the needs of the farmers. The analysis procedure was developed with open-access automated routines, allowing for easy updates and replication to other areas, as well as for other commodities, enabling comparisons at different spatial scales and contributing to monitoring biodiversity over time.

1. Introduction

In West Africa, cocoa farming was traditionally established with agroforestry practices through introducing cocoa seedlings into partially cleared forests and keeping native trees on-field to provide shade to the cocoa trees [1,2]. In these traditional systems, farmers also introduced other native or exotic tree species to obtain food products, diversify their income, and satisfy different household needs [3,4,5]. Recent studies have highlighted the benefits of agroforestry systems for both ecological and economic purposes [6,7,8,9]. Besides providing livelihoods for local people, tree-based intercropping can contribute to preserving biodiversity and ecosystem services, such as climate control, carbon sequestration, regulation of hydrological and biogeochemical processes, and nutrient recycling [10,11,12,13]. However, current cocoa demands are prompting the intensification of production, leading to the conversion of forests to cropland and driving forest loss [14,15]. In cocoa agroforests, overall practices have been evolving towards the maintenance of less shade to improve yields [1,16]. For this reason, cocoa smallholders in major producing countries, such as Ghana, Côte d’Ivoire, and Cameroon, establish full-sun or very light shade cocoa fields [2,17,18]. The replacement of the agroforestry system by intensive tree crop stands or monocultures results in decreased biodiversity and disrupts the ecosystem functions and environmental services that cocoa agroforests can potentially provide. Within cocoa production systems, a key issue is identifying opportunities to balance different and often conflicting uses of natural resources. On the one hand, maintaining the livelihoods and improving the economic conditions of smallholder farmers; on the other hand, ensuring the provision of ecosystem services, climate change mitigation, and the sustainable conservation and use of the available resources [9,12,19,20].
In this context, assessing and monitoring the status of biodiversity and environmental conditions in cocoa agroforests, promoted by existing non-cocoa tree species, is a critical step to understanding (i) the ecosystem services these trees can support, and (ii) their contribution to the sustainability of the crop production [21,22]. Since cocoa production in West Africa includes different typologies of smallholder farmers and is integrated into a wide range of agroforest types, assessing biodiversity and environmental conditions at a large scale becomes a challenge. A key matter is finding meaningful and consistent indicators to measure biodiversity suitable to the particular context of agroforests; these indicators should be applicable across scales, make comparisons possible and allow for monitoring trends over time [22,23]. Another main challenge is the definition of a representative baseline to evaluate the status of agroforestry systems regarding biodiversity and other environmental conditions promoted by the presence of different tree species.
This research intended to respond to these challenges. The main purpose was to assess the status of biodiversity and other environmental conditions in cocoa fields using a novel rapid assessment method based on the survey of non-cocoa trees. From specific tree parameters retrieved on-field, we calculate a set of indicators that can be analyzed at different spatial scales, aggregating at field, district, or regional levels. To facilitate data interpretation and promote their use by farmers and decision-makers, a new classification system is suggested. It includes recommended levels for the indicators based on benchmark values, with classes of performance defined from cocoa certification criteria, stakeholder consultation, and literature review. The status of biodiversity and other environmental conditions for different fields, districts, and regions is discussed because of their association with other characteristics of the cocoa fields. When applied over time, and by integrating the analysis of updated data, this procedure allows for comparisons in different timeframes. Our findings can contribute to improving biodiversity levels of cocoa agroforests by identifying priority areas for intervention and enabling monitoring over time.

2. Materials and Methods
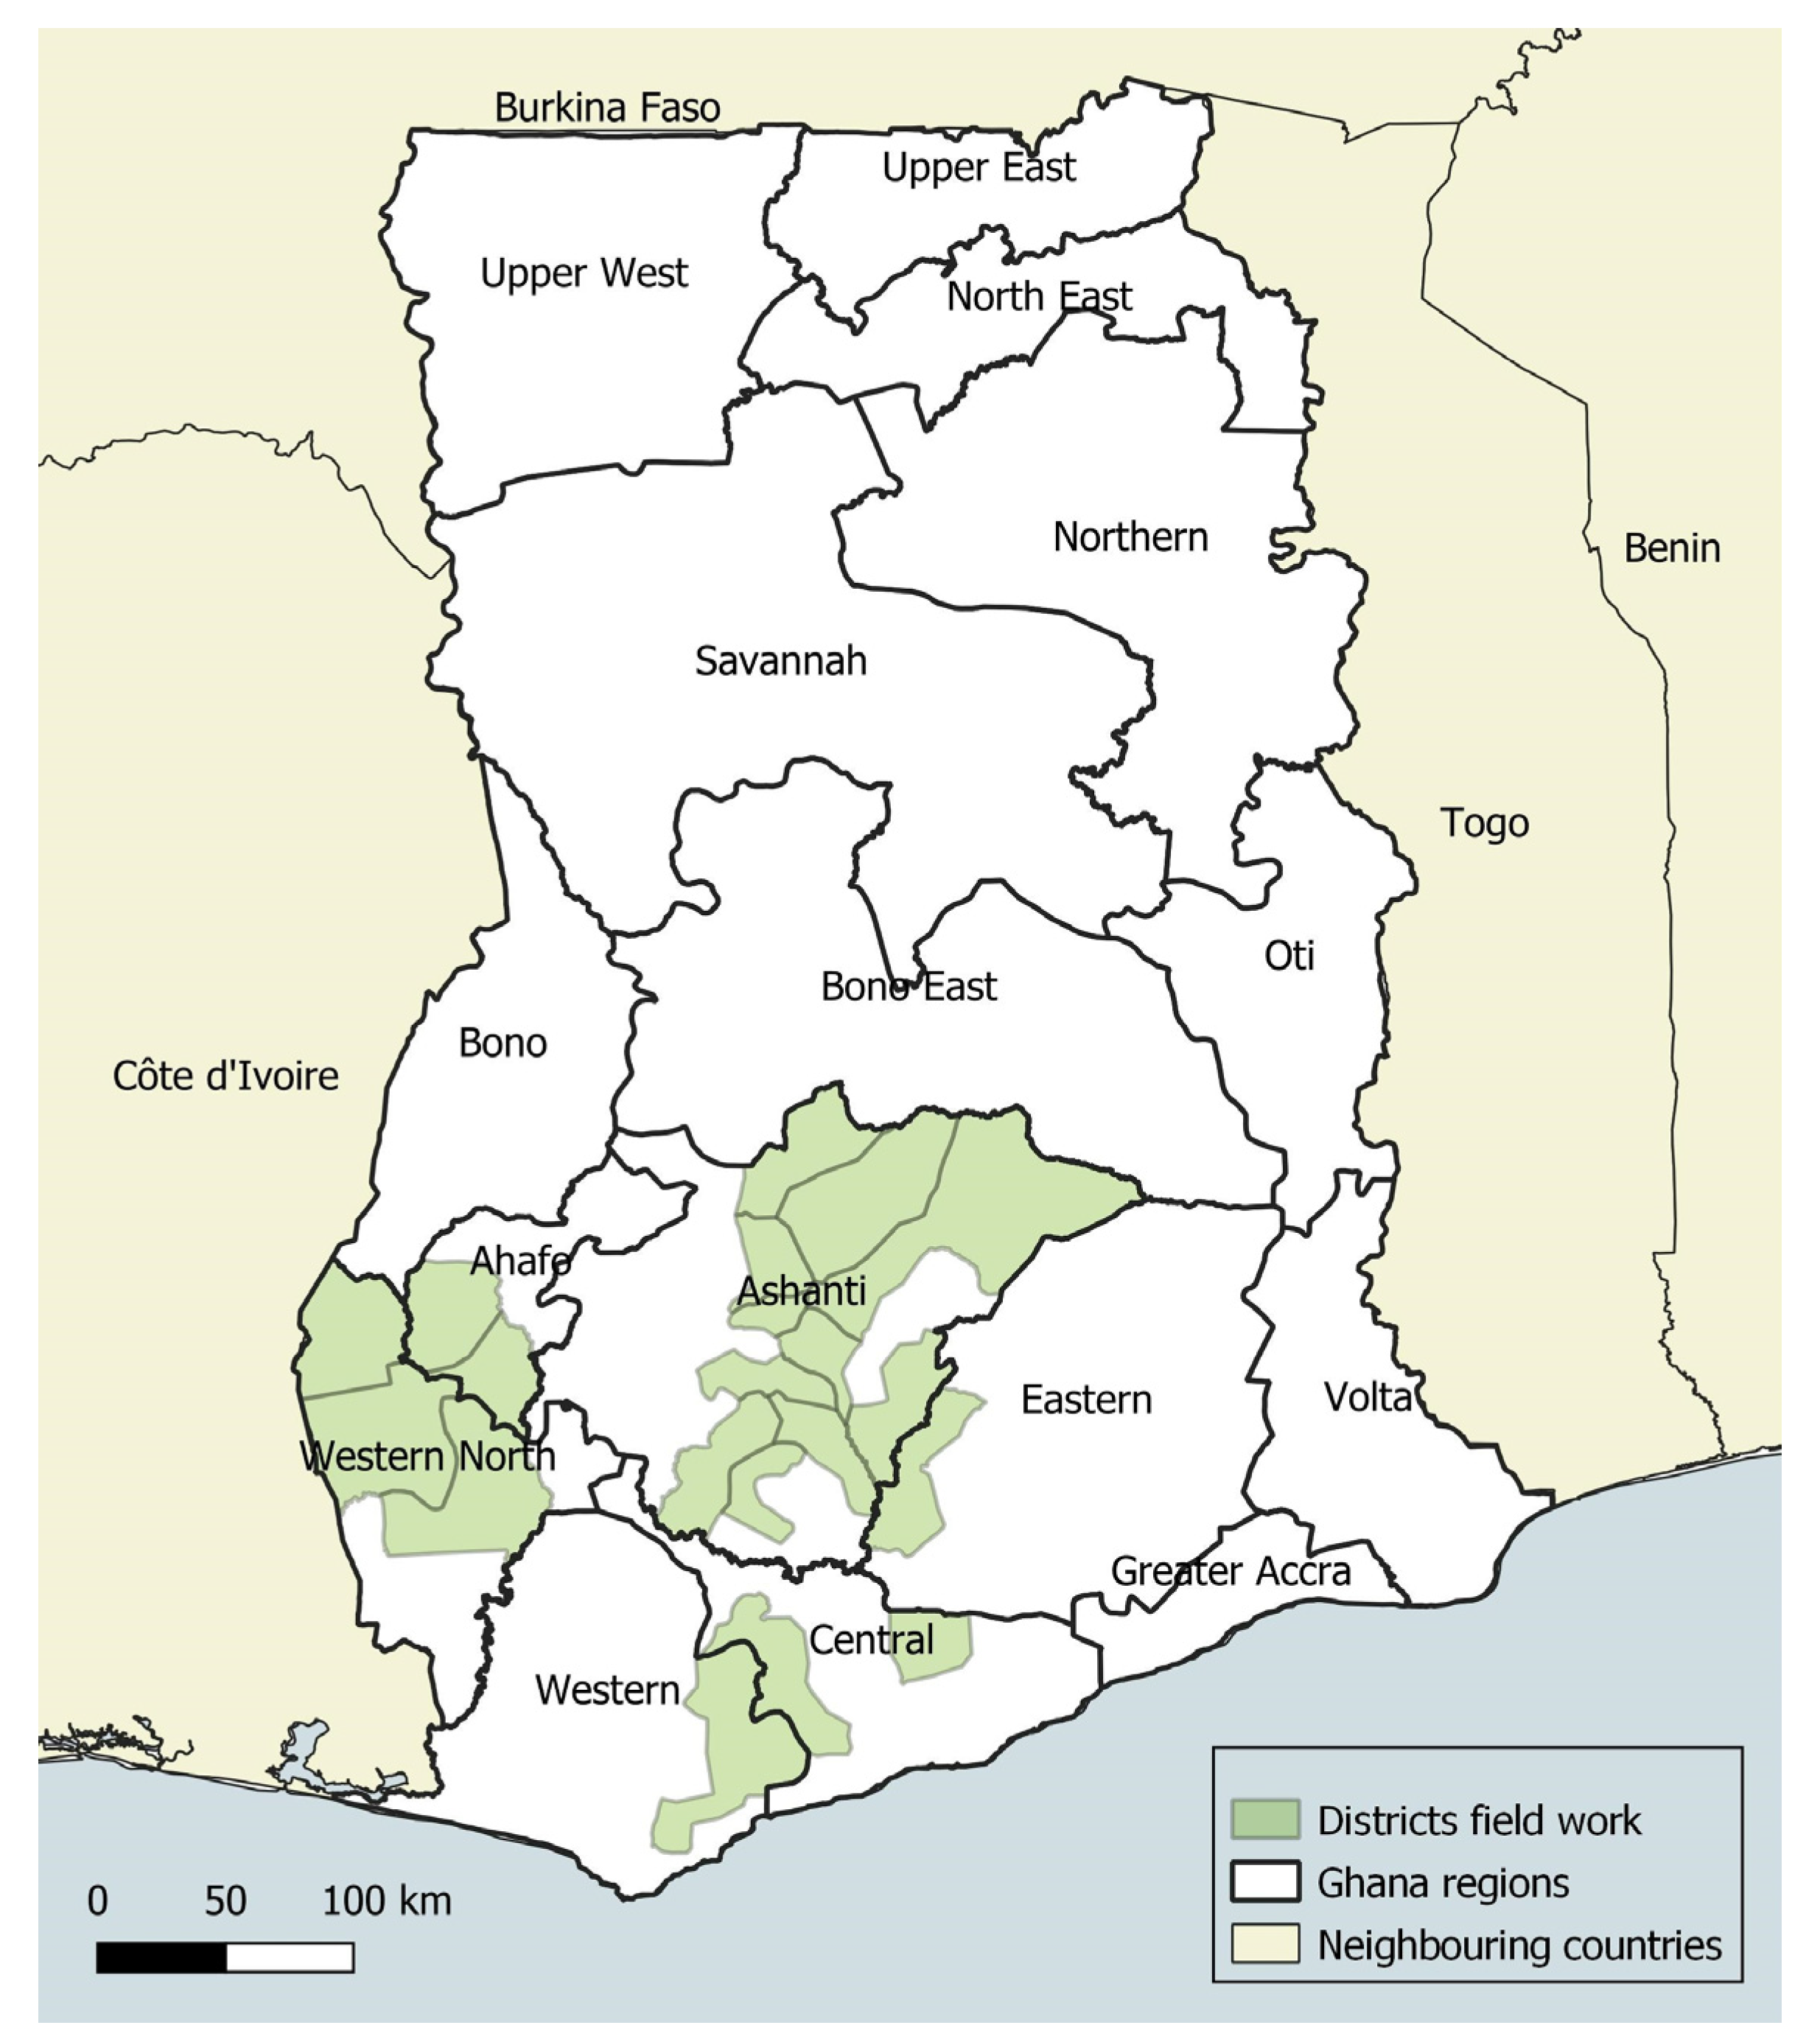
2.1. Study Area

This research was carried out in Ghana, West Africa, the second largest exporter of cocoa beans in the world [24]. Cocoa is mostly grown in the southern tropical belt of the country [25], where the mosaic forest/cropland predominates, with patches of closed evergreen lowland forest [26]. The country’s production is mainly based on smallholder farming, which occupies ca. 10% of the agricultural land of the country and is the primary source of livelihood for about 25% of the population [27]. The fieldwork was conducted in 19 districts across six regions: Ahafo, Ashanti, Central, Eastern, Western, and Western North (Figure 1).

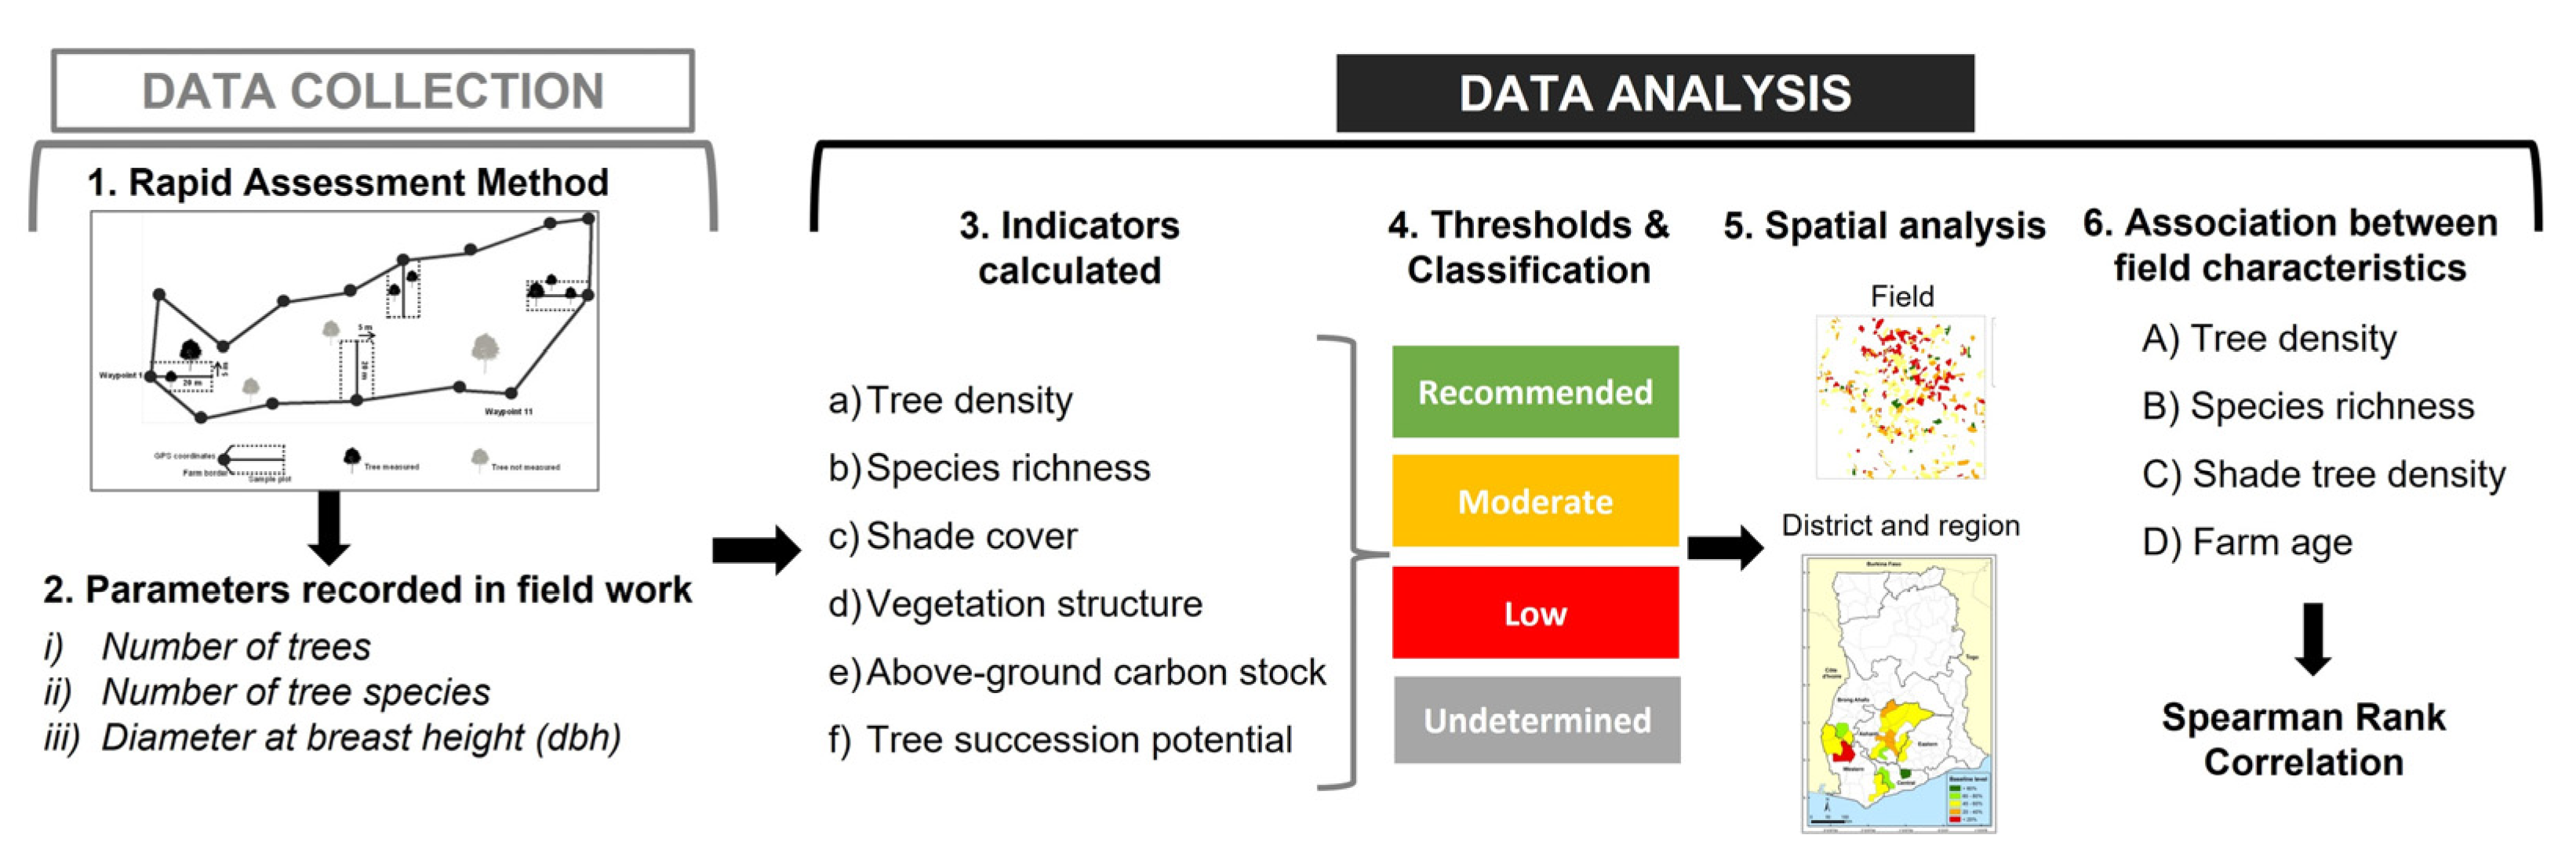
2.2. Data Collection

Data on biodiversity and other environmental parameters were obtained via sample surveys of non-cocoa trees in selected fields, combined with GPS mapping. Specific parameters of non-cocoa trees were retrieved by applying a rapid biodiversity assessment method (here called RapidBAM), developed recently in the framework of a Traceability and Mapping System (TMS) promoted by the cocoa industry [28]. The parameters to measure were selected based on literature review and expert knowledge, through stakeholder engagement of governmental institutions, non-governmental organizations, and certification bodies. Among the stakeholders that participated in the consultation were the Ghana Cocoa Board, the Cocoa Research Institute of Ghana, the Conservation Alliance, and the Rainforest Alliance [28,29]. The data defined to be collected were (i) number of trees, (ii) number of tree species, and (iii) diameter at breast height (dbh) in the sample plots established in the cocoa fields.

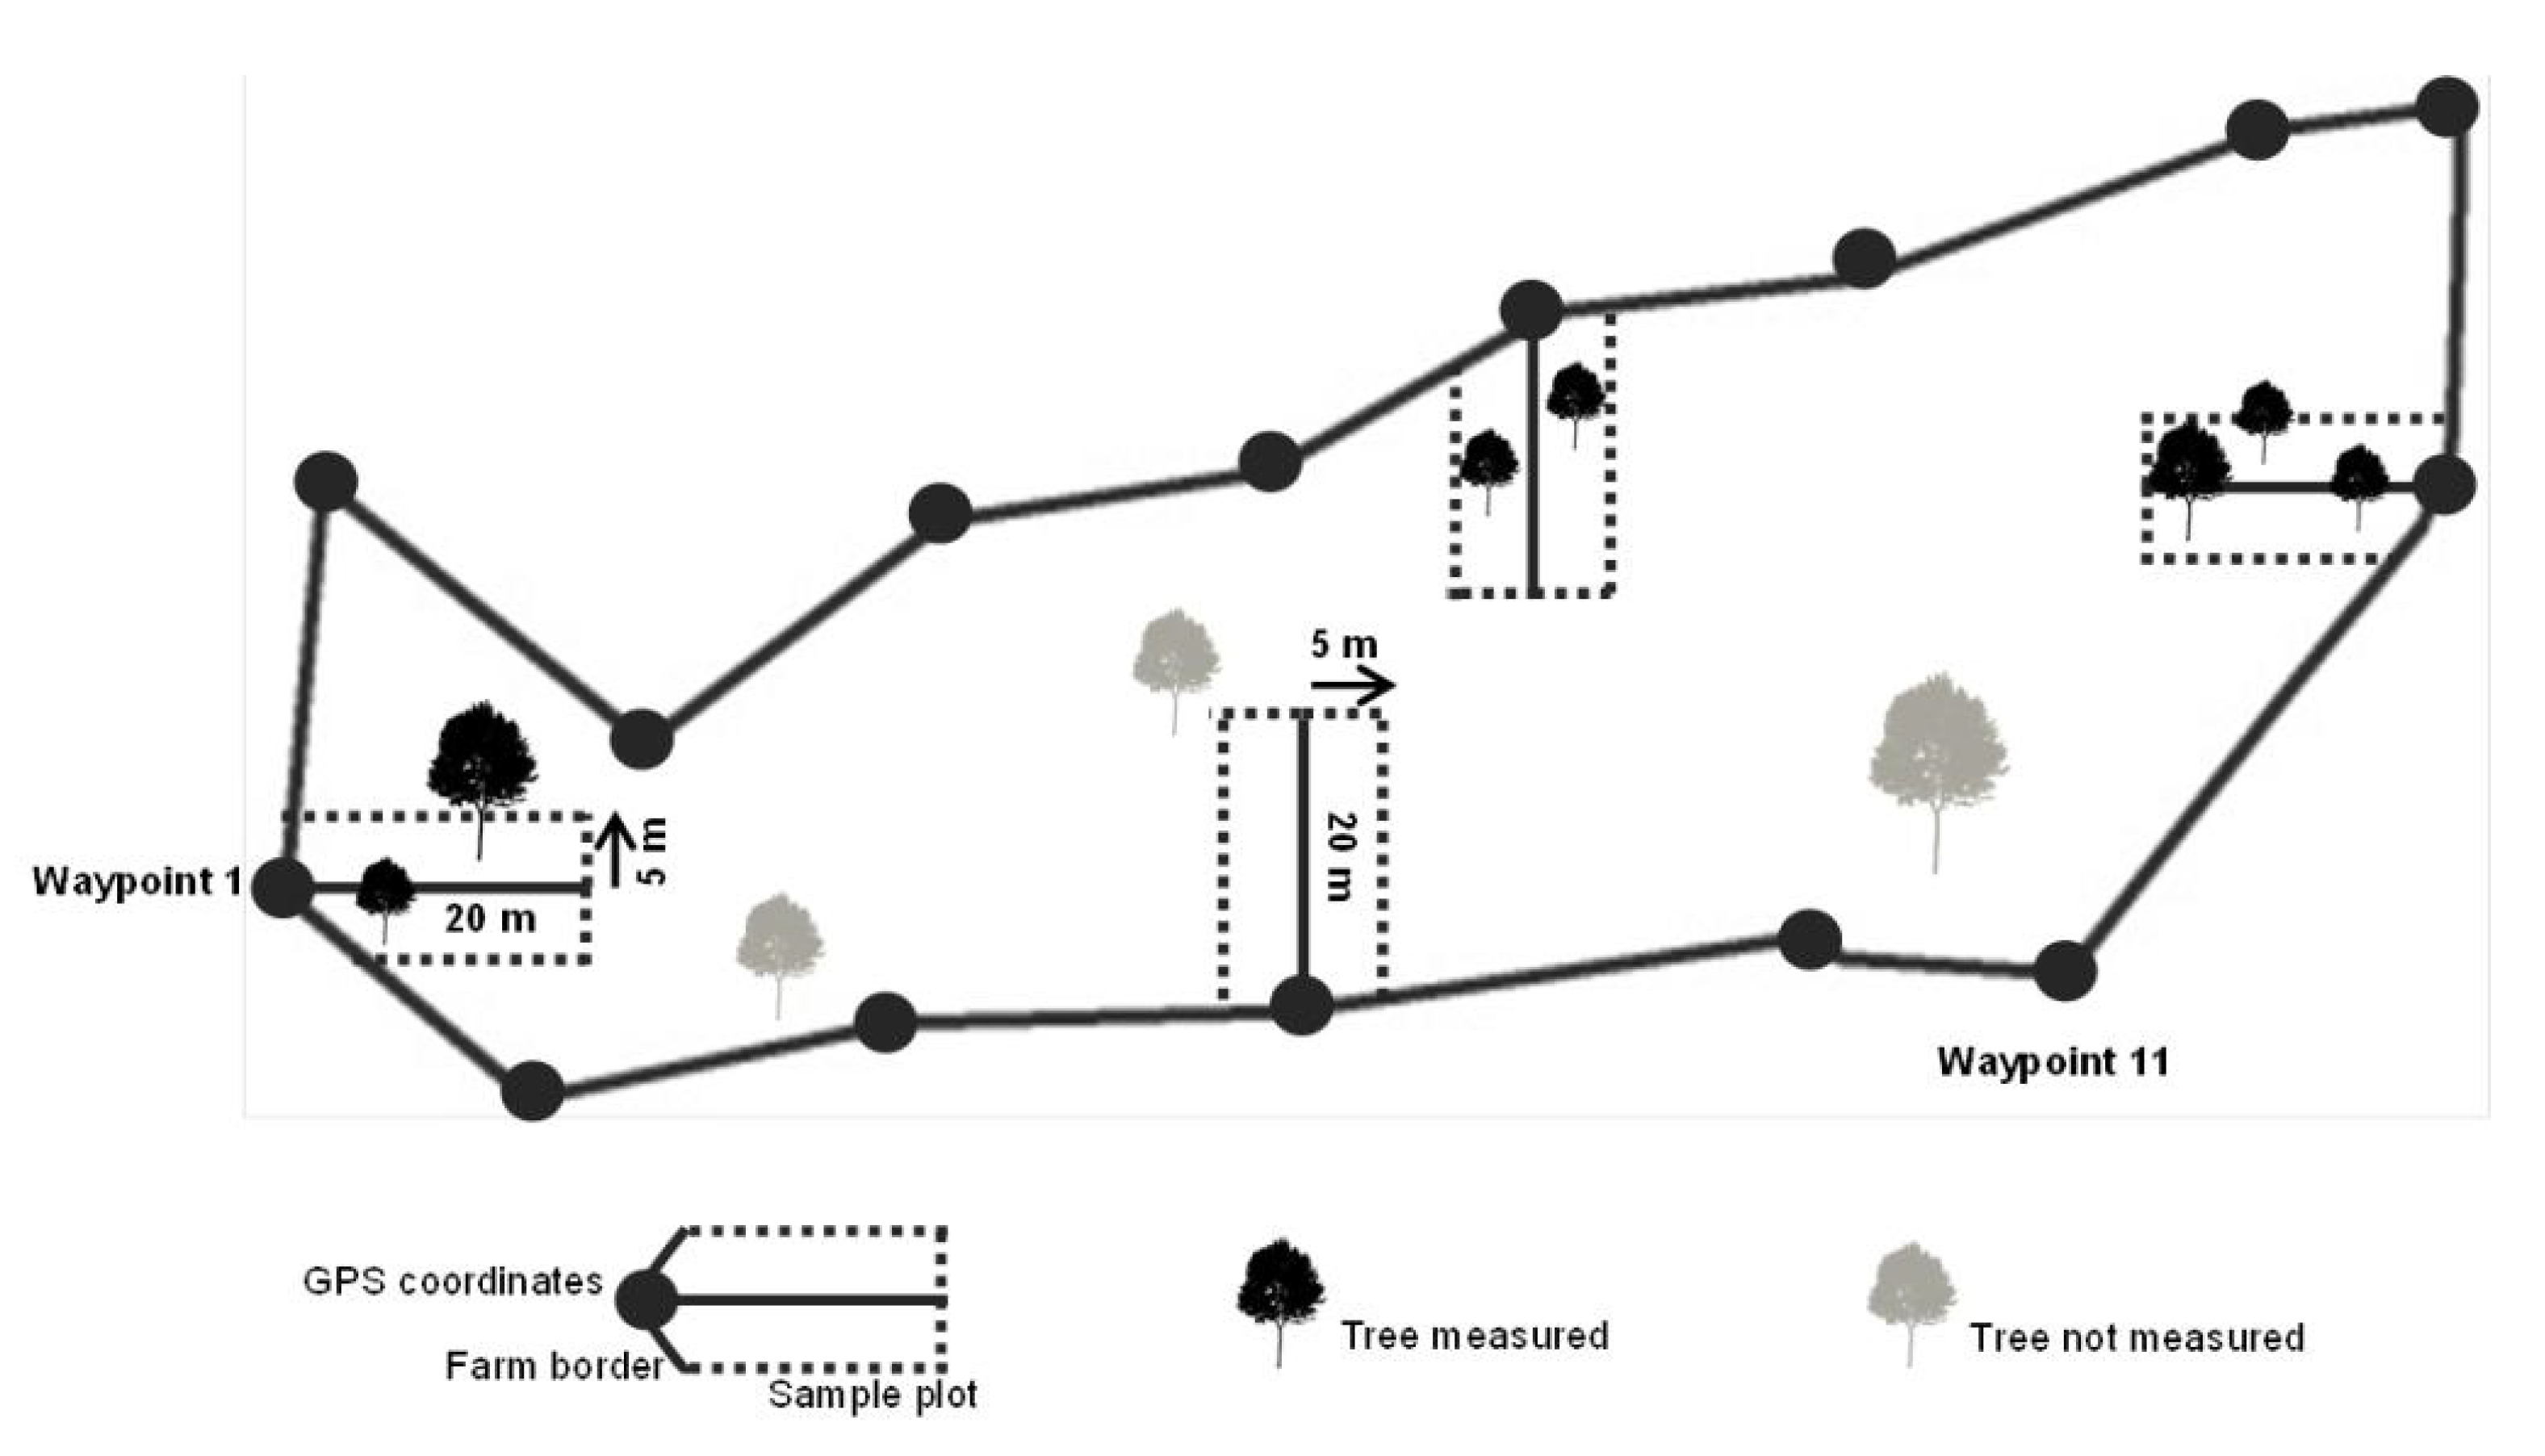
2.3. Rapid Biodiversity Assessment Method

The rapid biodiversity assessment method (RapidBAM) was specifically developed to be applied at a large scale and in conjugation with the field border mapping initiatives taking place (in this case, TMS). The design and testing of this method are explained in detail in Raneri et al. [28], and only a brief description is given here.
Based on the TMS mapping initiative and with the collaboration of the farmers, three rapid biodiversity assessment methods were designed and tested in cocoa fields in Ghana. The main purpose was to select a rapid assessment method, applicable at a large scale and based on the following criteria: (i) the method could capture sound biodiversity data for scientific purposes; (ii) the method could be carried out by non-experts, to ensure its large scale application despite limited resources; (iii) the method had to comply with field mapping initiatives, such as the TMS System already in place, and take a short time to complete; (iv) the method could be replicated and adjusted for potential application in other countries and for different commodities.
All three methods collected the same parameters in the field and included a similar inventory technique based on pre-defined forms, but the sampling procedure varied [28]. To select the most suitable method out of the three designed, an evaluation procedure was implemented in three phases, each including stakeholder consultation to assess results. (a) calibration phase: to verify the accuracy and consistency of the three methods by comparing the data captured with in-depth assessments; (b) testing phase: to assess the representativeness of the data captured in a random sample of fields and the time feasibility of each method; (c) evaluation phase: to verify the reproducibility and the quality of the data obtained by the method selected after the previous phase. Along with the evaluation procedure, several statistical tests were applied to verify the accuracy and representativeness of the data obtained by each method, as explained in detail in the dedicated study [28].
After this procedure, a single RapidBAM was selected for further application, which follows a set of specific steps for establishing the sample plots within each cocoa farm. In this method, applied in the study presented here, the surveyor marks the first waypoint with the GPS when reaching the farm’s border. The first sample plot, out of the 4 plots required, is established starting at this waypoint; 20 m long inside the farm (perpendicular to the farm’s border) and 5 m sideways of the waypoint in both directions, parallel to the border. The other 3 sample plots are set up while mapping the border of the farm at a distance of at least 100 m from each other and after changing direction. If, after 200 m, no significant change in direction has been made, the surveyor must stop and set the next sample plot. The procedure is repeated until all 4 plots are established and the farm border is fully mapped (Figure 2). This sampling procedure was defined based on the average size of the cocoa fields in the country and covered by TMS, of ca. 1.4 ha, and a corresponding farm perimeter of 400–500 m. The minimum distance between the sample plots (100 m) allows the coverage of most of the field’s perimeter and adjacent areas in different geographical directions. In each sample plot, with 200 m2 (20 m × 10 m) in size, the surveyor registers data on non-cocoa tree parameters as a tally in a pre-designed form to harmonize and accelerate the collection of the data [28].

2.4. Data Analysis

2.4.1. Indicators and Thresholds of Biodiversity and Other Environmental Conditions

From the data collected, several indicators were subsequently calculated, representing biodiversity (tree density, species richness) and other environmental conditions in the cocoa field (shade cover, vegetation structure, above-ground carbon stock, and tree succession potential) (Table 1 and Figure 3). Each indicator was evaluated in view of a set of thresholds defined from previous research and stakeholders’ appraisal [28,30,31,32,33,34,35]. The recommended level of an indicator represents the minimum value to obtain favorable circumstances for biodiversity or other environmental conditions. The different thresholds of the indicators calculated were further classified based on a traffic-light color system that simplifies interpretation and can be easily understood by different stakeholders, farmers, and the general public [36,37]. In this system, green represents the most favorable situation from an environmental or biodiversity perspective, indicating that a field has reached the recommended threshold for that indicator. Red, on the other hand, represents the most detrimental situation, meaning the cocoa field is far from the recommended level. It is darker when the magnitude of differences related to the recommended threshold is higher. In contrast, yellow represents intermediate situations, and the grey color was added in cases where the contribution to biodiversity or environmental conditions was impossible to determine. Table 1 summarizes the indicators and thresholds defined, explained in detail in the Supplementary Materials.
Current cocoa farm conditions were assessed at different spatial levels:
(i) At field level, by classifying the six indicators for each mapped field, to identify which assessed conditions could be improved. In addition, we counted the number of recommended levels each field attained out of the 6 indicators evaluated to compare their general environmental performance;
(ii) At the district and regional level by aggregating the results obtained at the field level to assess the environmental status of the fields belonging to different districts and regions. This analysis allows the identification of spatial patterns that may be driven by specific regional and local contexts.

2.4.2. Association between Different Conditions of Cocoa Farms

The biodiversity and environmental conditions measured for each cocoa field were further analyzed concerning their potential association with each other and with the age of the farm. The age information was collected in the framework of the traceability and mapping system (TMS), with a questionnaire compiled by the farmers of the surveyed fields. We tested the correlation between the farm’s age and the unclassified values of three indicators: tree density, species richness, and shade tree density, using the Spearman rank correlation coefficient. This test evaluates the relation between non-parametric variables, testing whether the large values of one variable tend to be associated with large (or small) values of the other variable [38].

2.4.3. Statistical and Spatial Analysis Tools

The main procedure for data analysis was developed in R software, version 4.2.2. [39], which is freely available, can be easily obtained online, and is possible to use in different operating systems. This software uses a specific programming language to create scripts with the required instructions for data analysis, running algorithms, and implementing the methodological procedures selected. These scripts can be easily adjusted or updated, integrating new data and changing sections of the procedure to include local or regional adaptations that may be necessary, depending on the data available and/or the objectives of the analysis. Although the use of these tools requires some initial training, suitable resources are also freely available online (https://cran.r-project.org/ (accessed on 2 March 2023)). The option to implement the analysis procedure with these tools was also based on the possibility of sharing existing scripting routines; this option can facilitate the replication of the same procedure in different timeframes and in other areas, regions, or countries and allows for the adjustment of specific steps if required, while maintaining the coherence of the overall procedure. These routines can also be applied to analyze other commodities (e.g., coffee), provided suitable data are available. Mapping of the results was also done with an open-source Geographic Information System, QGIS (https://qgis.org/ (accessed on 2 March 2023)). Besides training, using such open-source tools, which are free and widely available, does not require additional financial effort, which can facilitate replication of the procedure.

3. Results

A total set of 8750 farms was assessed by approximately 40 local surveyors over 2 months, spread over 6 different regions and 19 districts in Ghana (Figure 1). Consistent with the overall spatial distribution of cocoa production in the country, 52% of the farms were located in the Western North region, 20% in Ashanti, 10% in the Western region, 10% in the Eastern region, and the remaining 8% in Ahafo and Central regions. The mean area of the farms surveyed was 1.1 ha. For each farm, a sample of 800 m2, divided into 4 plots of 20 m × 10 m, was obtained using the rapid biodiversity assessment method.

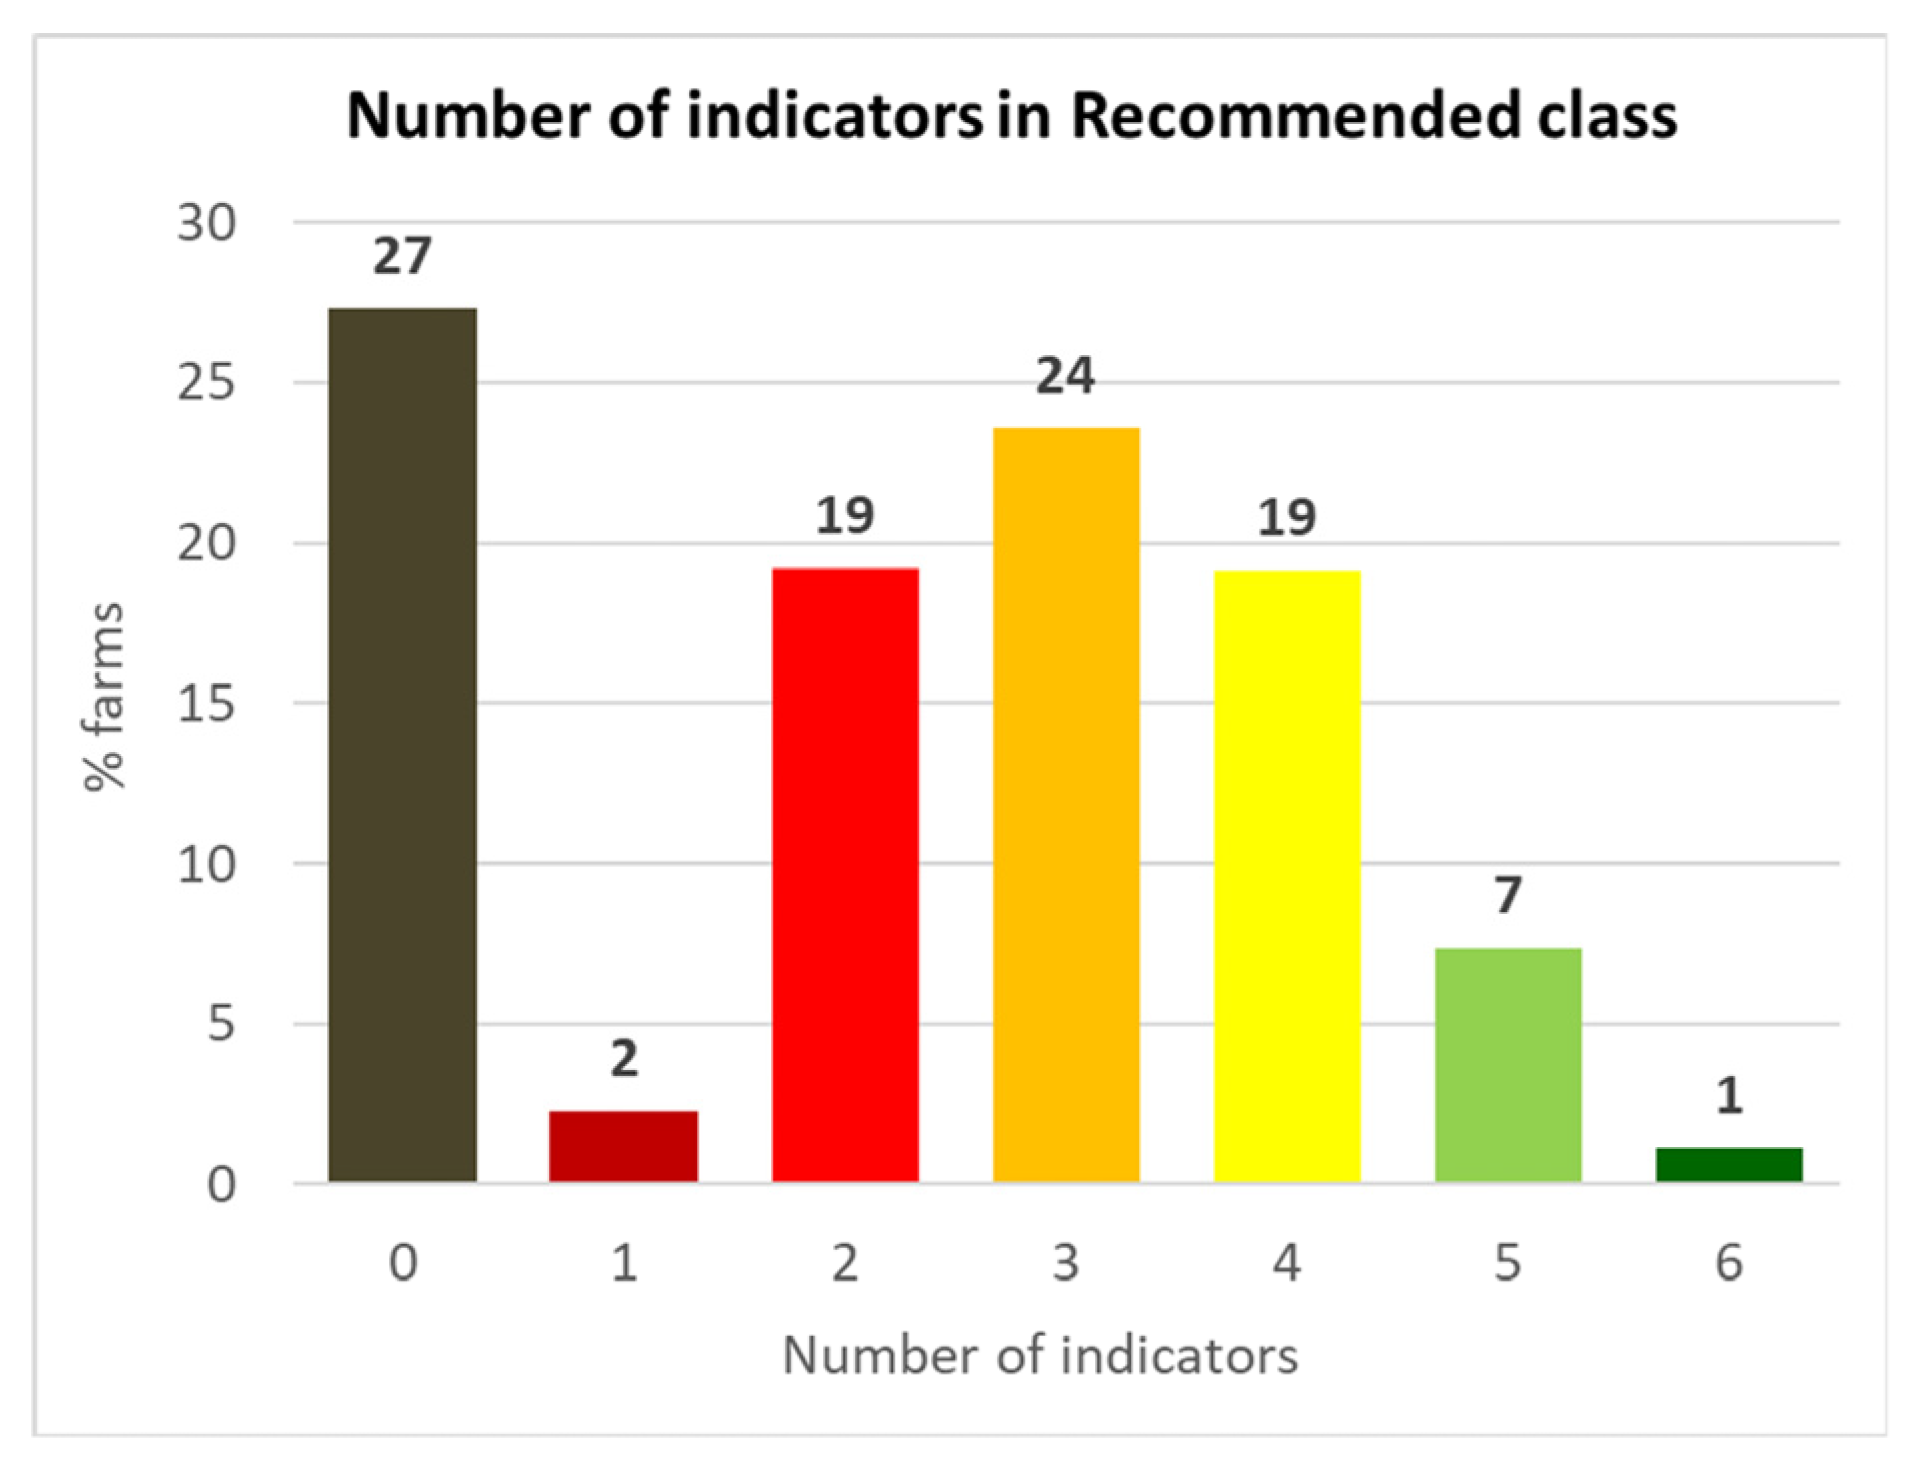
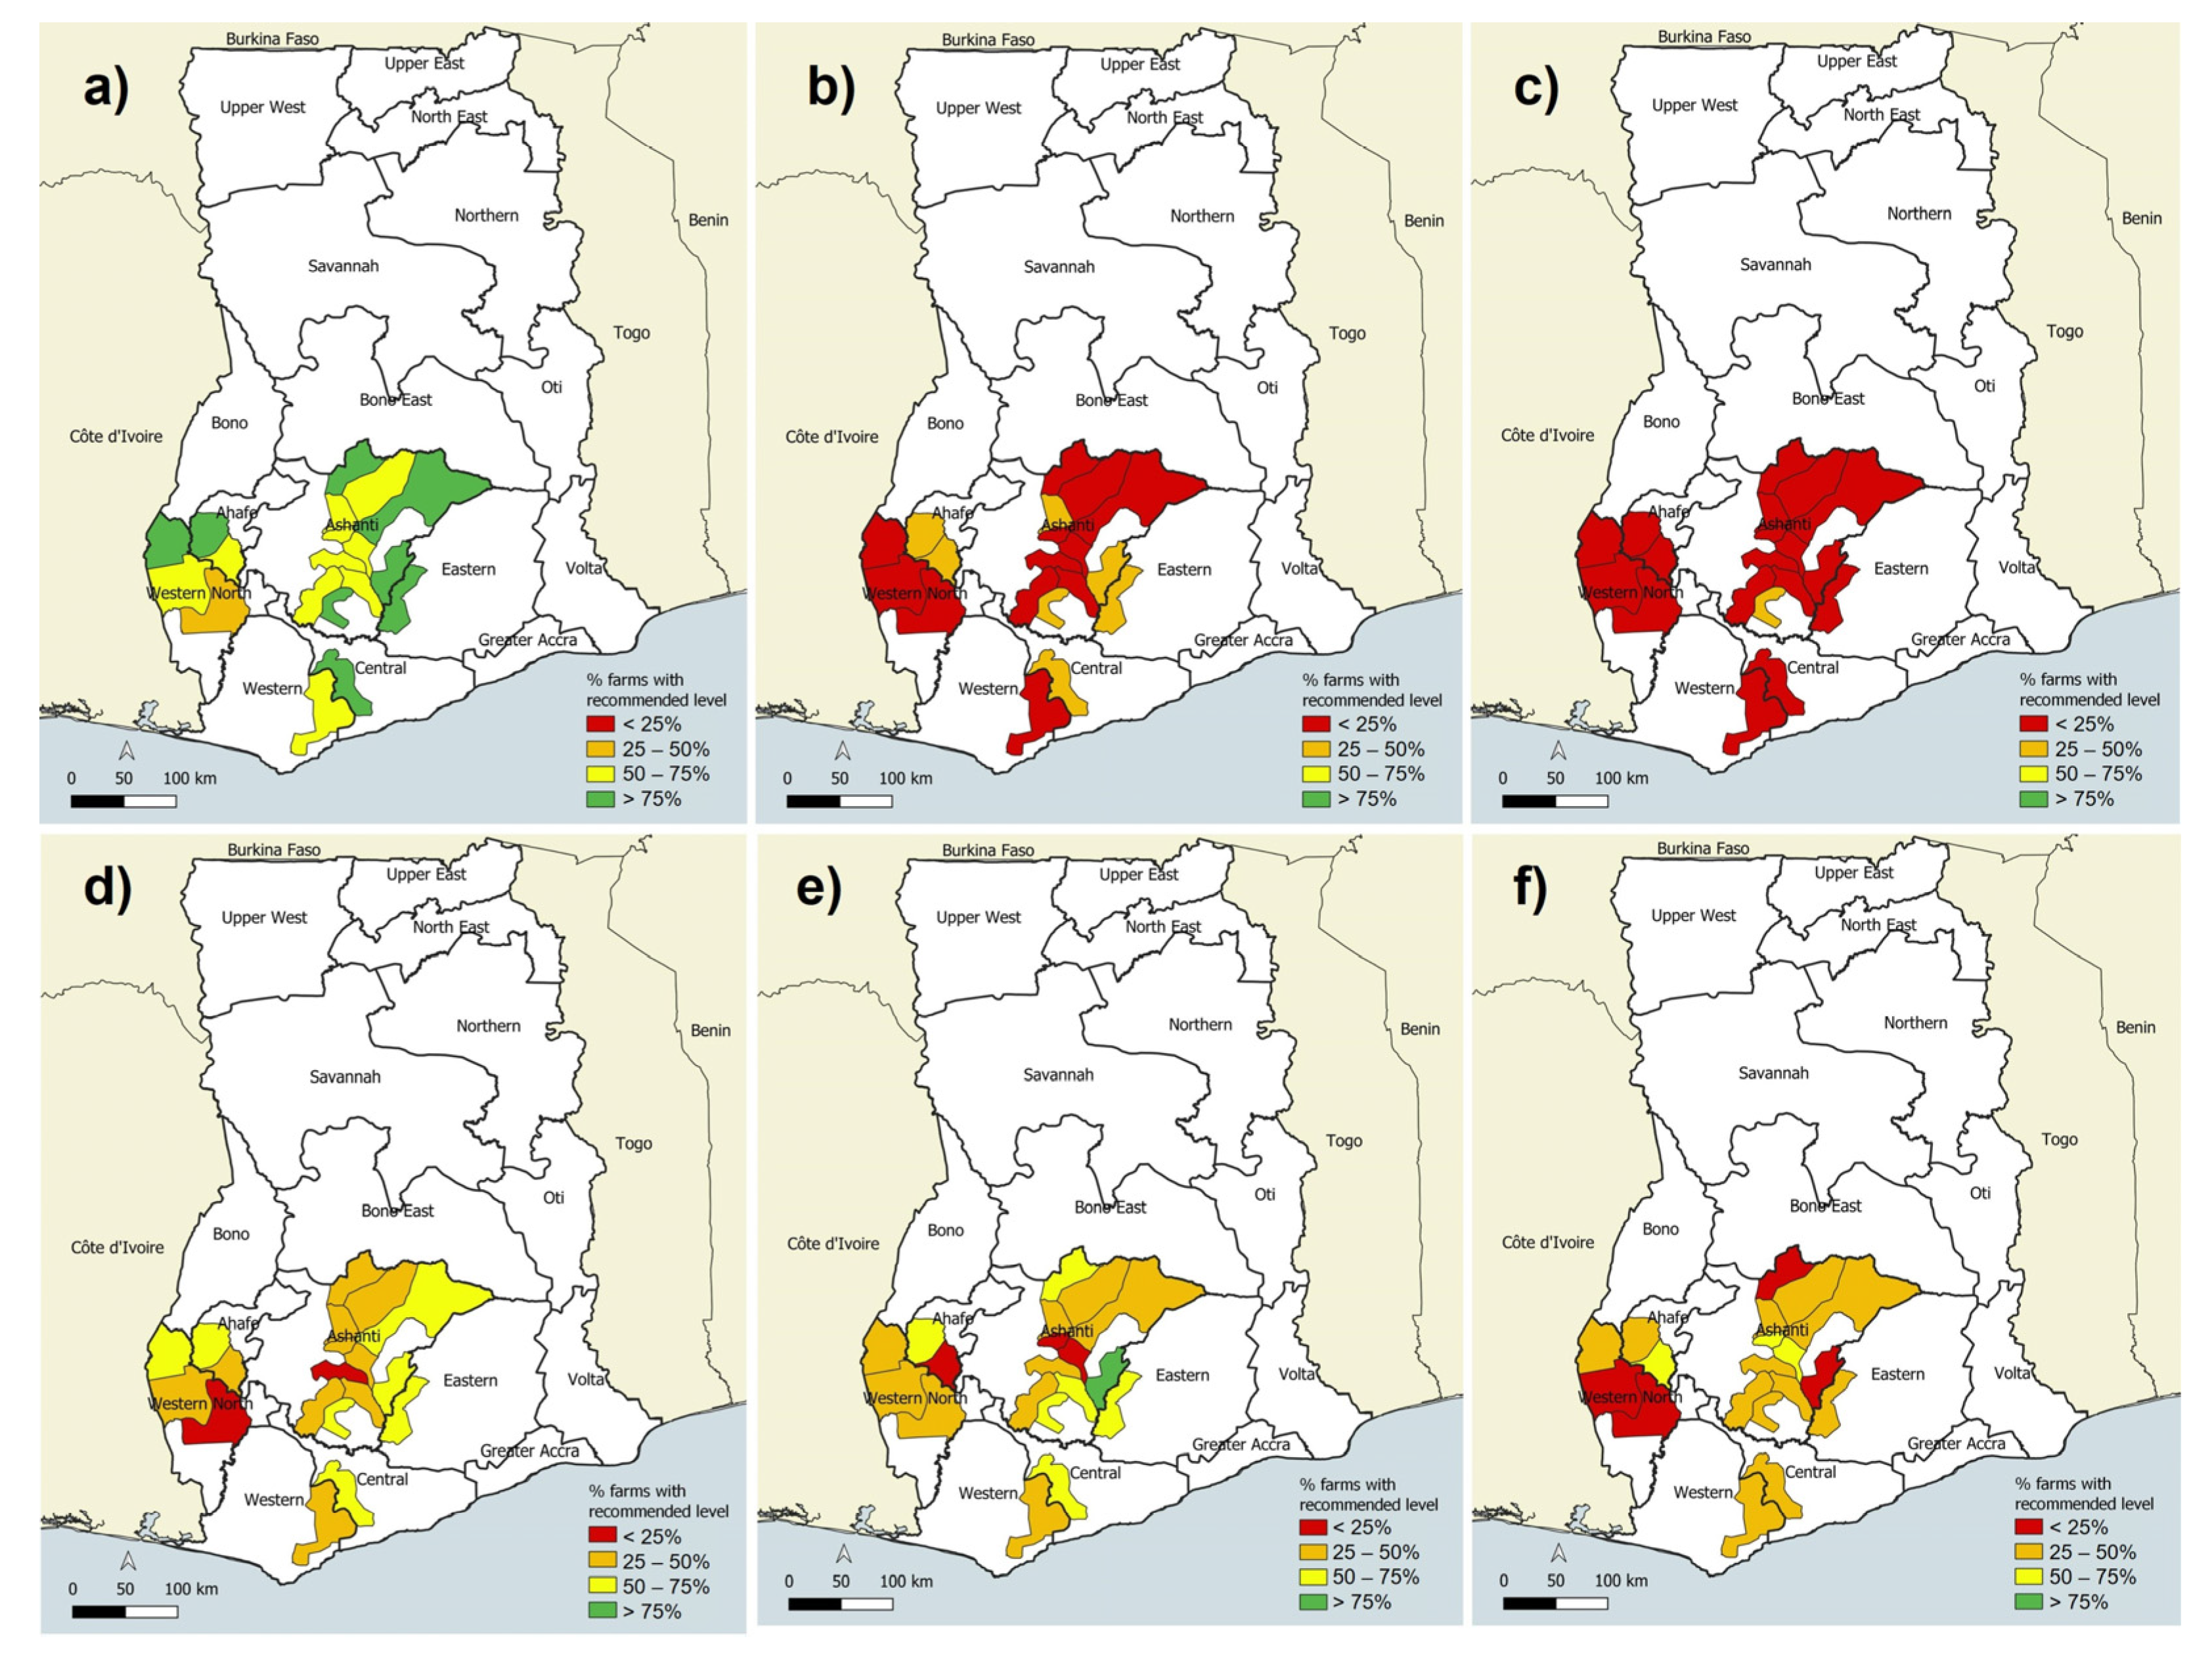
3.1. Indicators of Biodiversity and Other Environmental Conditions

(a)
Tree density:
The average number of trees per ha was 45 ± 40 trees/ha (Table 2). The majority of farms (71%) showed the recommended level of tree density, and the moderate class was found in 14% of the surveyed farms. In about 15% of the farms, no trees were found. Farms in the Ahafo region showed a higher mean value of tree density (59 trees/ha), whereas, in Western North, the mean value was the lowest (40 trees/ha). Within each region, the proportion of farms in the different classes varied; the Central region showed the highest number of farms with the recommended level (ca. 84%), followed by Ahafo, and Western North showed the lowest proportion (ca. 67%) (Table 3).
(b)
Species richness:
The average number of species per hectare was 7 ± 5.5 (Table 2). Half the farms (50%) showed a very low level of richness, below 5 species/ha, and only 20% showed the recommended level, with more than 12 species/ha. Farms located in the Ahafo region showed a higher mean value of species richness (9 species/ha), whereas in Western North, the mean value was the lowest (6 species/ha), followed by the Ashanti region (7 species/ha). In all regions, at least a third of the farms showed a very low richness level, higher for Western North with about 56%. Ahafo and Eastern regions showed higher proportions of farms with the recommended level, 34% and 29%, respectively.
(c)
Shade cover:
The mean density of shade trees (with dbh above 30 cm) was 27 ± 29 trees/ha (Table 2). The Ahafo and Eastern regions had the higher mean values, with ca. 34 and 30 trees/ha, respectively, and the Western region had the lowest value of 24 trees/ha. The recommended level of shade was defined at a moderate level, between 14 and 25 trees/ha, and values above this threshold were considered heavy shade and not optimal for cocoa production (see Supplementary Materials). About 28% of the farms surveyed had no shade trees, and 33% were classified as heavy shade. Moderate (recommended) levels were found for 18% of the cocoa farms, and 21% showed light shade levels (Table 3). Farms located in the Ahafo and Eastern regions showed a higher mean value of shade trees (34 and 30, respectively), whereas in the Western region, the mean value was the lowest (24 shade trees/ha), followed by the Western North and Ashanti region (ca. 26 shade trees/ha). Considering the distribution of classes within each region, Ashanti shows the highest proportion of farms with no shade (31%). Ahafo had the lowest proportion of farms with no shade (14%) and the highest heavy shade (43%).
An additional analysis was done for the younger cocoa fields (up to 8 years old for full productivity, which corresponded to 10% of the surveyed fields). Banana/plantain and oil palm can provide temporary shade to young cocoa trees and an additional food and income source for the farmer. In these very young fields, the proportion of “No shade” decreased slightly to 26%, and the “Heavier shade” proportion increased to 43%. For younger fields, a higher mean value of banana/plantain (55 banana/ha) in relation to the other farms (29 banana/ha) was also found.
(d)
Vegetation structure:
About 46% of the fields met minimum requirements with at least 2 canopy levels above the cocoa trees. The absence of other trees in the cocoa farm was documented in 14% of the fields, as they only had the cocoa strata, and in 40% of the farms only a single stratum above cocoa was found. Within the regions, Western North and Ashanti showed the lowest proportion of farms with multi-strata above the cocoa, with 42% and 45%, respectively. The Central region had the highest proportion (62%) (Table 3).
(e)
Above-ground carbon stock:
Nearly 45% of all cocoa fields presented the minimum recommended or higher class, whereas 33% showed very low carbon stock, 17% had low levels, and about 5% showed moderate levels. Within the regions, Ashanti showed the lowest proportion of farms with recommended levels (42%), and the Central region had the highest (55%) (Table 3).
(f)
Tree succession potential:
For succession potential, 38% of the farms belong to the low class, which means that the proportion of young trees (i.e., with smaller dbh) in relation to older trees (with larger dbh) is low, indicating a lower potential for tree succession over time. In 29% of the farms, only 1 tree was found in all 4 sample plots, and, as such, it was not possible to estimate succession potential. About 32% of the fields were at the adequate level, with at least 50% younger trees. Within regions, Western North had the highest proportion of farms in the undetermined class (33%) and the lowest proportion of farms in the adequate class (26%) (Table 3).
Overall, 27% of the surveyed cocoa farms had no indicator in the recommended class, only 1% had all 6 indicators with the desirable conditions, and about 24% had 3 indicators with the recommended class (Figure 4).
These numbers vary by region; the Western North and Ashanti regions showed the highest proportion of farms that did not meet minimum recommended levels for any indicator, with 32% and 25% of the surveyed farms in each region, respectively. On the contrary, Ahafo and Central regions showed the highest proportion of farms with at least 5 indicators at the recommended level, with 16% and 13%, respectively, against 6% and 10% found in Western North and Ashanti.
These results are also reflected in an unequal spatial distribution at the district level (Figure 5). Overall, shade cover presents the worst performance since most districts showed less than 25% of the farms with the recommended level. Species richness follows, with two-thirds of the districts having less than 25% of the farms with the desirable class. The indicator with the better performance is tree density, with most districts having at least 50% of the surveyed farms with the recommended level.

3.2. Association between Farms’ Characteristics

The mean age of the farms surveyed was 20 years, ranging from 1 to 73 years, with 75% of the farms having up to 25 years. The variables representing the number of species, trees, and shade trees are significantly and positively associated with each other, as shown by the Spearman rank test (Table 4). The number of species and the number of trees show the strongest association. Weaker associations were found between each of these indicators and the age of the farm, indicating a common positive trajectory between the values of the variables, though they were only significant for species and shade trees.

4. Discussion

The biodiversity assessment using the traffic light system showed that suboptimal biodiversity performance was common across fields, districts, and regions. These findings reveal the need to focus on specific indicators to improve biodiversity conditions in cocoa farms. For the fields surveyed, strategies should specifically target shade cover, species richness, and tree succession potential—indicators that can be successfully controlled and improved by farmers’ choices. According to the classes obtained for the different indicators, particular training interventions can be implemented to progressively increase the number of green scores for individual fields, therefore assisting farmers in implementing biodiversity-friendly practices
Most fields showed a good performance concerning tree density, with 67% to 84% of farms reaching the recommended level amongst regions. Despite dissimilar results found by different authors, high values of tree density have been reported in other West African countries. In Nigeria, Oke and Olatiilu [40] found an average of 40 shade trees/ha in sparse cocoa agroforests and 76 shade trees/ha in dense agroforests; in Cameroon, Jagoret et al. [41] found 120 trees/ha, and Bisseleua et al. [42] found an average of 89 trees/ha, 8 of them shade trees. The reasons behind this dissimilar distribution of tree density are diverse. The origin of the farmers has been pointed out as a relevant factor, with migrant farmers reducing the number of non-cocoa trees in their fields [43,44]; this may be due to cultural traditions regarding specific tree species that are retained instead by indigenous farmers. The increased land use intensity due to market demands is also a potential factor for lower tree density [45,46]. Plantation age has also been linked with tree density; Saj et al. [47] found reduced tree densities in older plantations, with cocoa fields managed as a full-sun system in an attempt to reverse the decline in productivity derived from aging cocoa trees. This pattern, however, is not corroborated by our results since no significant association was found between tree density and farm age.
The low level of species richness contrasts with the results found for tree density. Shade management strategies and the particular choices of species by the farmers are possible reasons. Previous authors have shown that the conversion of natural forests to agroforests results in the reduction of forest tree species [45,48]. Reducing shade tree cover in cocoa fields reduces biological diversity harbored by agroforests [30,42,49,50]. However, this trend may be partially reversed by integrating exotic (non-native) species and indigenous fruit trees [51,52,53].
On the other hand, these results may also be related to the method used to collect the data, which presents some limitations. False absences (when the species is not found on the sample plot but may exist on the field) are possible with sampling methods [54], and the application of the method by multiple surveyors may bring additional differences in data collection, despite prior calibration measures [55]. Furthermore, as the RapidBAM was developed for potential large-scale surveys without the need for experts to allow for replication even when resources are scarce, the identification of a new species is dependent on the knowledge and visual interpretation of the surveyors. Further training on species differentiation may be required to expand the surveyors’ ability to categorize the sampled trees as new and unique species within the farm.
The results obtained are also dependent on the type of cocoa fields surveyed, which were selected based on their integration into the mapping system already in place. Despite this limitation, including biodiversity assessments in existing initiatives may accelerate their implementation, as resources and objectives are shared between institutions.
Banana/plantain and oil palm can provide temporary shade to young cocoa trees, as well as an additional food and income source for the farmer [47,56]. In younger farms (<8 years old), shade levels were generally higher, likely due to the higher presence of bananas or plantain to provide shade to young cocoa trees. As the rapid assessment method does not discriminate between species (except for banana/plantain and palm), these results estimate the overall shade conditions in cocoa fields and should be considered as a basis for further investigation. Nevertheless, our findings indicate a general tendency of either too low or too high a shade cover for most fields. Considering the economic purpose of agroforestry systems, adopting specific shade management strategies must entail a balance between sustainable biodiversity support and profitable yield returns [57].
In the context of climate change mitigation, the possibility of carbon sequestration by agroforests has received growing attention [47,58,59,60]. Despite an expected reduction in carbon stocks when compared to natural or primary forests [40,61], their carbon storage capacity is still relevant and mostly due to trees other than cocoa [47,59]. The contribution to climate change mitigation, and the eventual participation in the carbon market, can support the willingness of farmers to maintain other trees in cocoa fields. In this study, only the above-ground carbon of non-cocoa trees found within the sampled plots was estimated. Thus, the potential for carbon sequestration would be higher than what is presented here if considering cocoa trees, litter, and the below-ground carbon stock as well, which were not accounted for.
Although details on tree species, individual tree size, and functional attributes are missing from this analysis, the straightforward application of the method facilitates its application in wider areas. This can contribute to obtaining larger sets of data for deeper analysis, as well as for monitoring biodiversity in cacao production systems over time. In this regard, several adaptations can be implemented to collect data on tree species. A species list compiled by the farmers involved in the mapping could provide useful insights to identify which species and functional attributes are present on their fields and to obtain information on the reasons for their choices regarding shade trees kept on the field, for example. This, however, would require the listing of potential species by their local names, and the data collected would have to first be validated using in-depth assessments. The rapid assessment method applied in this study did not include this information, to ensure its replicability at a large scale without the need for specialized knowledge that would require additional resources. The involvement of the farmers is crucial to apply the method consistently, in particular because mapping the border of the fields requires their knowledge and assistance. Their participation since the early stages of the data collection process is expected to help them understand the status of their fields, as well as the potential benefits of improving biodiversity conditions for productivity, income, and long-term sustainability of their activity.
In addition to data collection, the data analysis procedure can be easily adjusted and fostered by using automated routines and programming tools. For example, the classification system can be adjusted to consider regional contexts. Different indicator thresholds should be tested and validated in other country settings and for other tree-commodity agroforest systems (e.g., coffee). The definition of recommended levels for biodiversity-related conditions, so far lacking for agroforests, and the use of a straightforward classification system, are valuable tools that can facilitate disseminating biodiversity results among different users, including farmers and governmental stakeholders.

5. Conclusions

Applying a rapid assessment method for tree biodiversity in cocoa fields enabled the estimation of the current biodiversity and other associated conditions at a large scale. It provided the opportunity to evaluate the overall status of individual fields regarding their biodiversity and environmental performance, as well as to analyze differences at local and landscape scales. Using a reference classification defined from benchmark minimum recommended values for each indicator, and representing them through a straightforward colored code scale, facilitates the diffusion of the data and could help identify the environmental conditions that require improvement. This first assessment, carried out in 8750 cocoa fields spread over 19 districts and 6 regions in Ghana, showed that species richness, shade cover, and succession potential don’t reach the recommended level in most of the fields surveyed. These parameters should be prioritized for targeted actions. Training approaches regarding biodiversity-friendly practices in cocoa fields should be tailored to the specific requirements and needs of the farmers, which vary across fields, districts, and regions. The mainstreaming of biodiversity into national policies is an important step in facilitating accountability for both public and private sectors involved with agriculture, specifically with cacao agroforests. Applying a replicable rapid assessment method for tree biodiversity in cocoa fields can provide useful tools to define suitable environmental and biodiversity-friendly strategies and enable a monitoring scheme for further assessments.

Supplementary Materials

The following supporting information can be downloaded at: https://www.mdpi.com/article/10.3390/d15040503/s1.

Author Contributions

Conceptualization, S.O. and S.F.W.; formal analysis, S.O.; investigation, J.E.R.; methodology, S.O. and J.E.R.; resources, S.F.W.; software, S.O.; supervision, S.F.W.; writing—original draft, S.O. and J.E.R.; writing—review and editing, S.F.W. All authors have read and agreed to the published version of the manuscript.

Funding

This research was developed under the framework of the project “Biodiversity and Cocoa Farming: Ghana Case”, funded by the Biodiversity and Agricultural Commodities Program, BACP-[Armajaro Grant-014 (6 August 2012)] and in collaboration with Geotraceability, Armajaro Trading Limited, and Chemonics International. To develop the manuscript, additional funding was received from the CGIAR Research Program on Forests, Trees and Agroforestry, the Research Unit UIDB/00295/2020-UIDP/00295/2020, and SO was funded through FCT, I.P., under the program ‘Stimulus of Scientific Employment—Individual Support’ within the contract [2020.03873.CEECIND].

Institutional Review Board Statement

This study did not involve obtaining information from or about people and so Bioversity International did not require an IRB.

Data Availability Statement

Restrictions apply to the availability of raw data at the farm level due to privacy issues. Aggregated data obtained with the analysis developed in the study can be provided upon request. The R Code used for the analysis is available upon request.

Acknowledgments

We would like to acknowledge the surveyors from Armajaro and Geotraceability who contributed to the field work, and a special thanks to the farmers who participated voluntarily in this project.

Conflicts of Interest

The authors declare no conflict of interest.

References

  1. Anglaaere, L.C.N.; Cobbina, J.; Sinclair, F.L.; McDonald, M.A. The effect of land use systems on tree diversity: Farmer preference and species composition of cocoa-based agroecosystems in Ghana. Agrofor. Syst. 2011, 81, 249–265. [Google Scholar] [CrossRef]
  2. Asare, R.; Afari-Sefa, V.; Osei-Owusu, Y.; Pabi, O. Cocoa agroforestry for increasing forest connectivity in a fragmented landscape in Ghana. Agrofor. Syst. 2014, 88, 1143–1156. [Google Scholar] [CrossRef]
  3. Ruf, F.O. The Myth of Complex Cocoa Agroforests: The Case of Ghana. Hum. Ecol. 2011, 39, 373–388. [Google Scholar] [CrossRef] [Green Version]
  4. Cerda, R.; Deheuvels, O.; Calvache, D.; Niehaus, L.; Saenz, Y.; Kent, J.; Vilchez, S.; Villota, A.; Martinez, C.; Somarriba, E. Contribution of cocoa agroforestry systems to family income and domestic consumption: Looking toward intensification. Agrofor. Syst. 2014, 88, 957–981. [Google Scholar] [CrossRef]
  5. Smith Dumont, E.; Gnahoua, G.M.; Ohouo, L.; Sinclair, F.L.; Vaast, P. Farmers in Côte d’Ivoire value integrating tree diversity in cocoa for the provision of ecosystem services. Agrofor. Syst. 2014, 88, 1047–1066. [Google Scholar] [CrossRef] [Green Version]
  6. Rosa-Schleich, J.; Loos, J.; Mußhoff, O.; Tscharntke, T. Ecological-economic trade-offs of Diversified Farming Systems—A review. Ecol. Econ. 2019, 160, 251–263. [Google Scholar] [CrossRef]
  7. Sonwa, D.J.; Weise, S.F.; Schroth, G.; Janssens, M.J.J.; Shapiro, H.Y. Structure of cocoa farming systems in West and Central Africa: A review. Agrofor. Syst. 2019, 93, 2009–2025. [Google Scholar] [CrossRef]
  8. Niether, W.; Jacobi, J.; Blaser, W.J.; Andres, C.; Armengot, L. Cocoa agroforestry systems versus monocultures: A multi-dimensional meta-analysis. Environ. Res. Lett. 2020, 15, 104085. [Google Scholar] [CrossRef]
  9. Wainaina, P.; Minang, P.A.; Duguma, L.; Muthee, K. A review of the trade-offs across different cocoa production systems in Ghana. Sustainability 2021, 13, 10945. [Google Scholar] [CrossRef]
  10. Cardinale, B.J.; Duffy, J.E.; Gonzalez, A.; Hooper, D.U.; Perrings, C.; Venail, P.; Narwani, A.; Mace, G.M.; Tilman, D.; Wardle, D.A.; et al. Biodiversity loss and its impact on humanity. Nature 2012, 486, 59–68. [Google Scholar] [CrossRef] [Green Version]
  11. Alam, M.; Olivier, A.; Paquette, A.; Dupras, J.; Revéret, J.-P.; Messier, C. A general framework for the quantification and valuation of ecosystem services of tree-based intercropping systems. Agrofor. Syst. 2014, 88, 679–691. [Google Scholar] [CrossRef]
  12. Kuyah, S.; Whitney, C.W.; Jonsson, M.; Sileshi, G.W.; Öborn, I.; Muthuri, C.W.; Luedeling, E. Agroforestry delivers a win-win solution for ecosystem services in sub-Saharan Africa. A meta-analysis. Agron. Sustain. Dev. 2019, 39, 47. [Google Scholar] [CrossRef] [Green Version]
  13. Tschora, H.; Cherubini, F. Co-benefits and trade-offs of agroforestry for climate change mitigation and other sustainability goals in West Africa. Glob. Ecol. Conserv. 2020, 22, e00919. [Google Scholar] [CrossRef]
  14. Acheampong, E.O.; Macgregor, C.J.; Sloan, S.; Sayer, J. Deforestation is driven by agricultural expansion in Ghana’s forest reserves. Sci. Afr. 2019, 5, e00146. [Google Scholar] [CrossRef]
  15. Ashiagbor, G.; Asante, W.A.; Forkuo, E.K.; Acheampong, E.; Foli, E. Monitoring cocoa-driven deforestation: The contexts of encroachment and land use policy implications for deforestation free cocoa supply chains in Ghana. Appl. Geogr. 2022, 147, 102788. [Google Scholar] [CrossRef]
  16. Kaba, J.S.; Otu-Nyanteh, A.; Abunyewa, A.A. The role of shade trees in influencing farmers’ adoption of cocoa agroforestry systems: Insight from semi-deciduous rain forest agroecological zone of Ghana. NJAS—Wagening. J. Life Sci. 2020, 92, 100332. [Google Scholar] [CrossRef]
  17. Tondoh, J.E.; Kouamé, F.N.; Guéi, A.M.; Sey, B.; Koné, A.W.; Gnessougou, N.; Ebagnerin, J.; François, N. Ecological changes induced by full-sun cocoa farming in Côte d’Ivoire. Glob. Ecol. Conserv. 2015, 3, 575–595. [Google Scholar] [CrossRef] [Green Version]
  18. Somarriba, E.; Lopez-Sampson, A. Coffee and Cocoa Agroforestry Systems: Pathways to Deforestation, Reforestation, and Tree Cover Change; International Bank for Reconstruction and Development/The World Bank: Washington, DC, USA, 2018; Available online: https://repositorio.catie.ac.cr/handle/11554/9035 (accessed on 10 January 2023).
  19. Boeckx, P.; Bauters, M.; Dewettinck, K. Poverty and climate change challenges for sustainable intensification of cocoa systems. Curr. Opin. Environ. Sustain. 2020, 47, 106–111. [Google Scholar] [CrossRef]
  20. Mattalia, G.; Wezel, A.; Costet, P.; Jagoret, P.; Deheuvels, O.; Migliorini, P.; David, C. Contribution of cacao agroforestry versus mono-cropping systems for enhanced sustainability. A review with a focus on yield. Agrofor. Syst. 2022, 96, 1077–1089. [Google Scholar] [CrossRef]
  21. Mertz, O.; Ravnborg, H.M.; Lövei, G.L.; Nielsen, I.; Konijnendijk, C.C. Ecosystem services and biodiversity in developing countries. Biodivers. Conserv. 2007, 16, 2729–2737. [Google Scholar] [CrossRef]
  22. Feld, C.K.; Sousa, J.P.; Silva, P.M.; Dawson, T.P. Indicators for biodiversity and ecosystem services: Towards an improved framework for ecosystems assessment. Biodivers. Conserv. 2010, 19, 2895–2919. [Google Scholar] [CrossRef]
  23. Feld, C.K.; Da Silva, P.M.; Sousa, J.P.; De Bello, F.; Bugter, R.; Grandin, U.; Hering, D.; Lavorel, S.; Mountford, O.; Pardo, I.; et al. Indicators of biodiversity and ecosystem services: A synthesis across ecosystems and spatial scales. Oikos 2009, 118, 1862–1871. [Google Scholar] [CrossRef]
  24. Ahoa, E.; Kassahun, A.; Tekinerdogan, B.; Verdouw, C. Analyzing and designing business processes in the Ghana cocoa supply chain for supporting inclusiveness. Sustainability 2021, 13, 12440. [Google Scholar] [CrossRef]
  25. Kolavalli, S.; Vigneri, M. Cocoa in Ghana: Shaping the success of an economy. In Yes, Africa Can: Success Stories from a Dynamic Continent; World Bank: Washington, DC, USA, 2011; pp. 201–218. [Google Scholar]
  26. ESA CCI, Climate Change Initiative. LandCover Project 2017 LC 20m Map of Africa 2016 2017. Available online: https://2016africalandcover20m.esrin.esa.int/ (accessed on 6 December 2022).
  27. Asante-Poku, A.; Angelucci, F. Analysis of Incentives and Disincentives for Cocoa in Ghana. Technical Notes Series. Rome, Italy, 2013. Available online: https://www.fao.org/in-action/mafap/resources/detail/ru/c/394343/ (accessed on 15 December 2022).
  28. Raneri, J.E.; Oliveira, S.; Demers, N.R.; Asare, R.; Nuamah, S.; Dalaa, M.A.; Weise, S. A rapid tree diversity assessment method for cocoa agroforestry systems. Ecol. Indic. 2021, 130, 107993. [Google Scholar] [CrossRef]
  29. SAN. Sustainable Agriculture Network, General Interpretation Guide—Sustainable Agriculture Standard; SAN: San José, Puerto Rico, 2014. [Google Scholar]
  30. Wade, A.S.I.; Asase, A.; Hadley, P.; Mason, J.; Ofori-Frimpong, K.; Preece, D.; Spring, N.; Norris, K. Management strategies for maximizing carbon storage and tree species diversity in cocoa-growing landscapes. Agric. Ecosyst. Environ. 2010, 138, 324–334. [Google Scholar] [CrossRef]
  31. Sonwa, D. Biomass Management and Diversification within Cocoa Agroforests in the Humid Forest Zone of Southern Cameroon; Cuvillier Verlag: Göttingen, Germany, 2004. [Google Scholar]
  32. Melo, A.S.; Pereira, R.A.S.; Santos, A.J.; Shepherd, G.J.; Machado, G.; Medeiros, H.F.; Sawaya, R.J. Comparing species richness among assemblages using sample units: Why not use extrapolation methods to standardize different sample sizes? Oikos 2003, 101, 398–410. [Google Scholar] [CrossRef] [Green Version]
  33. Vashum, K.T.; Jayakumar, S.; Vashum, K.T. Methods to Estimate Above-Ground Biomass and Carbon Stock in Natural Forests—A Review. J. Ecosyst. Ecography 2012, 2, 1000116. [Google Scholar] [CrossRef]
  34. Geldenhuys, C.J. Managing forest complexity through application of disturbance–recovery knowledge in development of silvicultural systems and ecological rehabilitation in natural forest systems in Africa. J. For. Res. 2010, 15, 3–13. [Google Scholar] [CrossRef]
  35. Schroth, G.; da Fonseca, G.A.B.; Harvey, C.A.; Gascon, C.; Vasconcelos, H.L.; Izac, A.-M.N. (Eds.) Agroforestry and Biodiversity Conservation in Tropical Landscapes; Island Press: Washington, DC, USA, 2004. [Google Scholar]
  36. Machín, L.; Aschemann-Witzel, J.; Curutchet, M.R.; Giménez, A.; Ares, G. Traffic Light System Can Increase Healthfulness Perception: Implications for Policy Making. J. Nutr. Educ. Behav. 2018, 50, 668–674. [Google Scholar] [CrossRef]
  37. Oliveira, S.; Rocha, J.; Sousa, C.A.; Capinha, C. Wide and increasing suitability for Aedes albopictus in Europe is congruent across distribution models. Sci. Rep. 2021, 11, 9916. [Google Scholar] [CrossRef]
  38. Dodge, Y. Spearman Rank Correlation Coefficient. In The Concise Encyclopedia of Statistics; Springer Science & Business Media: Berlin, Germany, 2008; pp. 502–505. [Google Scholar]
  39. R Core Team. R: A Language and Environment for Statistical Computing; R Foundation for Statistical Computing: Vienna, Austria, 2021; Available online: http://www.R-project.org/ (accessed on 6 December 2022).
  40. Oke, D.; Olatiilu, A. Carbon storage in agroecosystems: A case study of the cocoa based Agroforestry in Ogbese Forest Reserve, Ekiti State, Nigeria. J. Environ. Prot. 2011, 2, 1069–1075. [Google Scholar] [CrossRef] [Green Version]
  41. Jagoret, P.; Michel-Dounias, I.; Malézieux, E. Long-term dynamics of cocoa agroforests: A case study in central Cameroon. Agrofor. Syst. 2011, 81, 267–278. [Google Scholar] [CrossRef]
  42. Bisseleua, H.B.D.; Fotio, D.; Yede; Missoup, A.D.; Vidal, S. Shade tree diversity, cocoa pest damage, yield compensating inputs and farmers’ net returns in West Africa. PLoS ONE 2013, 8, e56115. [Google Scholar] [CrossRef]
  43. Ruf, F.; Schroth, G. Chocolate forests and monocultures: A historical review of cocoa growing and its conflicting role in tropical deforestation and forest conservation. In Agroforestry and Biodiversity Conservation in Tropical Landscapes; Island Press: Washington, DC, USA, 2004; pp. 107–134. [Google Scholar]
  44. Laird, S.A.; Awung, G.L.; Lysinge, R.J. Cocoa farms in the Mount Cameroon region: Biological and cultural diversity in local livelihoods. Biodivers. Conserv. 2007, 16, 2401–2427. [Google Scholar] [CrossRef]
  45. Steffan-Dewenter, I.; Kessler, M.; Barkmann, J.; Bos, M.M.; Buchori, D.; Erasmi, S.; Faust, H.; Gerold, G.; Glenk, K.; Gradstein, S.R.; et al. Tradeoffs between income, biodiversity, and ecosystem functioning during tropical rainforest conversion and agroforestry intensification. Proc. Natl. Acad. Sci. USA 2007, 104, 4973–4978. [Google Scholar] [CrossRef] [PubMed] [Green Version]
  46. Sonwa, D.; Nkongmeneck, B.A.; Weise, S.F.; Tchatat, M.; Janssens, M.J.J. Tree diversity of the cocoa agroforest around Yaoundé (southern Cameroon). In Systematics and Conservation of African Plants. Proceedings of the 18th AETFAT Congress, Yaoundé, Cameroun, 26 February to 2 March 2007; van der Burgt, X., van der Maesen, J., Onana, J.M., Eds.; Royal Botanic Gardens: Richmond, UK, 2010; pp. 691–699. [Google Scholar]
  47. Saj, S.; Jagoret, P.; Ngogue, H.T. Carbon storage and density dynamics of associated trees in three contrasting Theobroma cacao agroforests of Central Cameroon. Agrofor. Syst. 2013, 87, 1309–1320. [Google Scholar] [CrossRef]
  48. Kessler, M.; Hertel, D.; Jungkunst, H.F.; Kluge, J.; Abrahamczyk, S.; Bos, M.; Buchori, D.; Gerold, G.; Gradstein, S.R.; Köhler, S.; et al. Can joint carbon and biodiversity management in tropical agroforestry landscapes be optimized? PLoS ONE 2012, 7, e47192. [Google Scholar] [CrossRef] [Green Version]
  49. Bisseleua, D.H.B.; Missoup, A.D.; Vidal, S. Biodiversity conservation, ecosystem functioning, and economic incentives under cocoa agroforestry intensification. Conserv. Biol. 2009, 23, 1176–1184. [Google Scholar] [CrossRef]
  50. De Beenhouwer, M.; Aerts, R.; Honnay, O. A global meta-analysis of the biodiversity and ecosystem service benefits of coffee and cacao agroforestry. Agric. Ecosyst. Environ. 2013, 175, 1–7. [Google Scholar] [CrossRef]
  51. Sonwa, D.; Nkongmeneck, B.A.; Weise, S.F.; Tchatat, M.; Janssens, J.J. Chocolate Forest and the Peri-Urban Landscape: Tree Diversity of the Cocoa Agroforests around Yaoundé (Southern Cameroon); STCP Working Paper; International Institute of Tropical Agriculture: Ibadan, Nigeria, 2006. [Google Scholar]
  52. Oke, D.O.; Odebiyi, K.A. Traditional cocoa-based agroforestry and forest species conservation in Ondo State, Nigeria. Agric. Ecosyst. Environ. 2007, 122, 305–311. [Google Scholar] [CrossRef]
  53. Cassano, C.R.; Schroth, G.; Faria, D.; Delabie, J.H.C.; Bede, L. Landscape and farm scale management to enhance biodiversity conservation in the cocoa producing region of southern Bahia, Brazil. Biodivers. Conserv. 2009, 18, 577–603. [Google Scholar] [CrossRef]
  54. Gotelli, N.J.; Colwell, R.K. Estimating species richness. In Biological Diversity: Frontiers in Measurement and Assessment; Oxford University Press: Oxford, UK, 2010; pp. 39–54. [Google Scholar]
  55. Archaux, F.; Camaret, S.; Dupouey, J.L.; Ulrich, E.; Corcket, E.; Bourjot, L.; Brêthes, A.; Chevalier, R.; Dobremez, J.-F.; Dumas, Y.; et al. Can we reliably estimate species richness with large plots? An assessment through calibration training. Plant Ecol. 2009, 203, 303–315. [Google Scholar] [CrossRef]
  56. Graefe, S.; Meyer-Sand, L.F.; Chauvette, K.; Abdulai, I.; Jassogne, L.; Vaast, P.; Asare, R. Evaluating Farmers’ Knowledge of Shade Trees in Different Cocoa Agro-Ecological Zones in Ghana. Hum. Ecol. 2017, 45, 321–332. [Google Scholar] [CrossRef]
  57. Clough, Y.; Barkmann, J.; Juhrbandt, J.; Kessler, M.; Wanger, T.C.; Anshary, A.; Buchori, D.; Cicuzza, D.; Darras, K.; Putra, D.D.; et al. Combining high biodiversity with high yields in tropical agroforests. Proc. Natl. Acad. Sci. USA 2011, 108, 8311–8316. [Google Scholar] [CrossRef] [Green Version]
  58. Jose, S.; Bardhan, S. Agroforestry for biomass production and carbon sequestration: An overview. Agrofor. Syst. 2012, 86, 105–111. [Google Scholar] [CrossRef]
  59. Norgrove, L.; Hauser, S. Carbon stocks in shaded Theobroma cacao farms and adjacent secondary forests of similar age in Cameroon. Trop. Ecol. 2013, 54, 15–22. [Google Scholar]
  60. Luedeling, E.; Sileshi, G.; Beedy, T.; Dietz, J. Carbon sequestration potential of agroforestry systems in Africa. In Carbon Sequestration Potential of Agroforestry Systems; Kumar, B.M., Nair, P.R., Eds.; Springer Science & Business Media: Cham, Switzerland, 2011; pp. 61–83. [Google Scholar]
  61. Sonwa, D.; Weise, S.F.; Janssen, M.J.J.; Schroth, G.; Shapiro, H. Diversifying and Intensifying the Cocoa Agroforest Landscape: Review and Strategic Approaches for Managing the Shade Matrix in West and Central Africa; International Institute of Tropical Agriculture: Ibadan, Nigeria, 2008. [Google Scholar]
Figure 1. Districts (n = 19) and regions (n = 6) of Ghana where fieldwork was carried out.
Diversity 15 00503 g001
Figure 2. Schematic view of the rapid biodiversity assessment method (RapidBAM) applied in a cocoa field.
Diversity 15 00503 g002
Figure 3. Schematic procedure of the data collection and methods applied.
Diversity 15 00503 g003
Figure 4. Proportion of cocoa farms with the recommended level regarding the six indicators obtained.
Diversity 15 00503 g004
Figure 5. Spatial distribution of the percentage of cocoa farms reaching the recommended level for each indicator at district level: (a) Tree density; (b) Species richness; (c) Shade cover; (d) Vegetation structure; (e) Carbon stock; (f) Tree succession potential. Classes are the same across all maps, for comparison, even if some indicators don’t reach all classes in the districts surveyed.
Diversity 15 00503 g005
Table 1. Summary of data analysis and classification proposed for biodiversity and other environmental indicators in cocoa agroforests, including the color code adapted: G (Green), Y (Yellow), R (Red), DR (Dark Red), Gr (Grey).
IndicatorData AnalysisRecommendedThresholdsClassificationColor
(a) Tree densityTrees above 10 cm dbh, extrapolated to ha (number of trees in plots/plots area). Including fruit trees, excluding palms. Plot area = 0.08 ha.18 trees/ha≥18 trees/haHighG
6–17 trees/haLow to ModerateY
<5 trees/haVery lowR
(b) Species richnessEvans estimator [32]
S = s log(N + 1)/log(n + 1)
12 species/ha≥12 species/haHighG
9–11 species/haModerateY
5–9 species/haLowR
>5 species/haVery lowDR
(c) Shade coverTrees above 30 cm dbh, extrapolated to ha (number of trees in plots/plots area).
Plot area = 0.08 ha.
14–25 trees/ha>25 trees/haHeavy shadeY
14–25 trees/haModerate shadeG
1–13 trees/haLight shadeY
0 trees/haNo shade/Full sunR
(d) Vegetation structureTrees above 10 cm dbh correspond to strata above the cocoa canopy.
2 classes: 10–30 cm—stratum 1; above 30 cm dbh—stratum 2. Banana/plantain same stratum as cocoa. If only 1 class exists, 1 stratum defined.
2 canopy levels (strata) above cocoa trees2 or more strata above cocoaMultistrataG
1 stratum above cocoaSingle strataY
Only cocoa stratumCocoa stratumR
(e) Above-ground carbon stockBiomass from measured dbh of trees, using the allometric formula [31]:
Y = 42.69 − 12.800(D) + 1.242(D2).
Carbon stock = 0.45 biomass [33]
36 Mg/ha>36 Mg/haHighG
26–36 Mg/haModerateY
10–25 Mg/haLowR
<10 Mg/haVery lowDR
(f) Tree succession potential3 classes were defined based on the proportion of younger trees (taking dbh 10–30 cm as a proxy) in relation to older trees (above 30 cm dbh).Trees in dbh class 10–30 cm ≥ 50% of all trees measureddbh 10–30 ≥ 50% AdequateG
dbh 10–30 = 35–50% ModerateY
dbh 10–30 < 35%LowR
<2 trees measuredUndeterminedGr
Table 2. Mean values and variation (SD = standard deviation) obtained for trees, shade trees, and species per region.
Trees
(nr/ha)
Shade Trees (>30 cm dbh)
(nr/ha)
Species
(nr/ha)
RegionMeanSDMeanSDMeanSD
Ahafo58.846.833.746.89.46.7
Ashanti51.046.227.746.27.35.5
Central51.936.926.136.98.65.7
Eastern52.042.630.142.68.15.7
Western46.338.123.838.17.66.0
Western North40.136.225.736.26.25.1
Total45.440.326.729.37.05.5
Table 3. Proportion of cocoa farms in each class, for each indicator, in the regions where fieldwork was carried out. Results are shown concerning the distribution of farms within each region to account for different sample sizes.
REGIONS
IndicatorsClassesAhafoAshantiCentralEasternWesternWestern North
(a) Tree densityRecommended80.173.883.779.674.366.8
Low to Moderate13.812.39.98.413.916.4
No trees6.113.96.312.011.816.9
(b) Species RichnessRecommended33.722.926.628.521.815.6
Moderate14.314.318.315.315.211.9
Low15.716.917.916.115.116.7
Very low36.445.937.340.147.855.9
(c) Shade coverModerate shade20.915.421.819.420.917.0
Heavy shade43.034.134.539.229.931.7
Light shade21.619.823.017.820.022.2
No shade14.530.720.623.629.329.0
(d) Vegetation StructureMultistrata61.245.461.953.049.241.8
Single Strata32.740.731.734.939.041.3
Cocoa strata6.113.96.312.011.816.9
(e) Carbon stockRecommended53.642.054.853.345.543.1
Moderate7.66.04.84.44.55.4
Low20.118.518.314.016.916.3
Very low18.733.522.228.333.235.2
(f) Tree succession potentialAdequate36.637.845.633.538.126.4
Moderate2.92.30.83.11.41.1
Low40.533.737.342.934.739.3
Undetermined19.926.216.320.425.733.2
Table 4. Results of the Spearman rank test (ρ value) between indicators and the age of each farm. Significant correlations (p-value < 0.05) are highlighted in bold.
Species
(nr/ha)
Trees
(nr/ha)
Shade Trees
(nr/ha)
Trees (nr/ha)0.953
Shade trees (nr/ha)0.7530.781
Farm age (nr years)0.0280.0200.081
Disclaimer/Publisher’s Note: The statements, opinions and data contained in all publications are solely those of the individual author(s) and contributor(s) and not of MDPI and/or the editor(s). MDPI and/or the editor(s) disclaim responsibility for any injury to people or property resulting from any ideas, methods, instructions or products referred to in the content.

