Article

In Search of Proximate Triggers of Anthrax Outbreaks in Wildlife: A Hypothetical Individual-Based Model of Plasmid Transfer within Bacillus Communities

by
Hsiao-Hsuan Wang
1,*,
Alexandra E. Bishop
2,
Tomasz E. Koralewski
1 and
William E. Grant
1
1
Ecological Systems Laboratory, Department of Ecology and Conservation Biology, Texas A&M University, College Station, TX 77843, USA
2
Department of Biology, Texas A&M University, College Station, TX 77843, USA
*
Author to whom correspondence should be addressed.
Diversity 2023, 15(3), 347; https://doi.org/10.3390/d15030347
Submission received: 6 December 2022 / Revised: 11 February 2023 / Accepted: 21 February 2023 / Published: 1 March 2023
(This article belongs to the Special Issue Diversity of Wildlife Pathogens)

Abstract

:
Bacillus anthracis, the causative agent of anthrax in humans, livestock, and wildlife, exists in a community with hundreds of other species of bacteria in the environment. Work on the genetics of these communities has shown that B. anthracis shares a high percentage of chromosomal genes with both B. thuringiensis and B. cereus, and that phenotypic differences among these bacteria can result from extra-chromosomal DNA in the form of plasmids. We developed a simple hypothetical individual-based model to simulate the likelihood of detecting plasmids with genes encoding anthrax toxins within bacterial communities composed of B. anthracis, B. thuringiensis, and B. cereus, and the surrounding matrix of extra-cellular polymeric substances. Simulation results suggest the horizontal transfer of plasmids with genes encoding anthrax toxins among Bacillus species persisting outside the host could function as a proximate factor triggering anthrax outbreaks.

1. Introduction

A common characteristic of many wildlife disease-causing agents is their ability to appear and disappear quickly in nature, often in an inexplicable manner [1]. The bacterium Bacillus anthracis is the causative agent of anthrax in humans, livestock, and wildlife [2]. It is notorious among scientists and disease control specialists for its ability to disappear suddenly, even after major outbreaks [3].
At the macro level, anthrax spores have been found throughout the world [4], and quantitative models describing the documented [5], and projecting the potential [6] geographic distribution of anthrax abound. Many studies have correlated reported cases of anthrax with physical environmental factors and with the distribution of potential vectors [7]. However, while macro-scale correlative models are useful in delineating areas of high risk where anthrax or its components are or were present, they are less useful in providing information that could be used to design preemptive management schemes on finer spatial and temporal scales. The latter requires an understanding of not only the conditions fostering appearance of the pathogen in a form capable of producing an epidemic but also of its environmental reservoir [3].
At the micro level, Bacillus and other bacteria exist in communities composed of potentially hundreds of species. The complexity and plasticity of ecological and evolutionary relationships within microbial communities is well documented [8,9]. Bacterial plasmids (extra-chromosomal genetic elements that code for a wide variety of phenotypes in their bacterial hosts and which are maintained in bacterial communities through both vertical and horizonal transfer) contribute significantly to this plasticity and complexity [10,11].
Work on the genetics of B. anthracis and other Bacillus species has suggested that B. anthracis, B. thuringiensis (an important source of insecticidal toxins), and B. cereus (a ubiquitous soil bacterium and opportunistic human pathogen) have a very high degree of genetic similarity based on their chromosomal genes (slightly below ≈92.5 ANI), with extra-chromosomal DNA, usually present as plasmids, accounting for many phenotypic differences [12,13]. In fact, there are known cases in which humans diagnosed with inhalation anthrax were subsequently found to be infected with bacteria identified genetically as B. cereus, not B. anthracis [14]. However, further examination identified the presence of two plasmids with genes encoding anthrax toxins within the B. cereus cells [14]. In B. anthracis, the anthrax toxin and capsule genes responsible for anthrax disease are located on the pXO1 and pXO2 plasmids, respectively [15,16]. These plasmids are not self-transmissible but can be mobilized by conjugative plasmids, such as pXO14 or pXO16, commonly found in B. thuringiensis [17,18]. Hu et al. [19] have documented the distribution, diversity, and potential mobility of extrachromosomal elements related to the B. anthracis pXO1 and pXO2 plasmids.
The fact that species related to B. anthracis, B. thuringiensis, and B. cereus can share bacteriophages, plasmids, and other genetic material suggests that they must grow in environmental niches that provide the opportunity for such exchange. Although relatively little is known about the ecology of B. anthracis outside of the host, past studies have documented that it can survive as a saprophyte in the soil and can establish vegetative cells that support horizontal gene transfer in the rhizosphere of grass plants [10]. These results suggest that horizontal plasmid transfer among Bacillus species persisting outside the host may provide important clues in the search for the proximate factors triggering anthrax epidemics, and that the causative agent may not be B. anthracis per se. More specifically, we hypothesize that the biodiversity of bacterial communities may be linked to anthrax outbreaks in a manner analogous to the manner in which the prevalence of vector-borne infectious diseases has been linked to biodiversity of their host communities [20,21].
Vector-borne pathogens often have multiple hosts whose densities vary widely in time and space [22,23], and who have very different transmission capabilities, thus providing two mechanisms for diluting or intensifying the rate of disease spread. An example of one of the two mechanisms is the case of plague in prairie dog populations in North American grasslands. Sudden outbreaks of plague have been linked to population fluctuations coupled with spatially-restricted movement patterns of grasshopper mice, which carry fleas with plague [1]. When grasshopper mice populations are low, movement of fleas among prairie dog colonies is restricted and plague remains enzootic; when populations are high, grasshopper mice provide a flea/plague transmission network connecting colonies and triggering an outbreak. The other mechanism could be illustrated with the case of Lyme disease in the northeastern United States. The prevalence of the disease has been linked to host community composition [24,25]. Disease prevalence is higher in areas of reduced biodiversity dominated by white-footed mice, which have a high competence to transmit the Lyme pathogen, and lower in areas of higher host diversity in which the majority of hosts have a low transmission competence.
In the case of anthrax, the same two mechanisms may be operating in a similar manner, albeit on different spatial and temporal scales. Concentrations of plasmid-bearing genes encoding anthrax toxins may be diluted or intensified by spatial and temporal variation in the composition of bacterial communities, since different species have markedly different segregation loss rates. A study by Krone et al. [26] of plasmid transfer in bacterial micro-colonies and biofilms has identified the importance of spatial structure in determining the rates of plasmid transfer and persistence in such communities, while another recent article has documented drastic differences in bacterial biodiversity in the ecosystem inside a pitcher plant due solely to the presence or absence of a mosquito larvae [27]. The same article [27] documented a correlation between human lung function and bacterial community diversity in the respiratory tract. Subjects with healthy lungs had diverse communities, whereas patients suffering from cystic fibrosis had less diverse communities dominated by Pseudomonas aeruginosa (the predominant pathogen of cystic fibrosis).
Studies have found a high abundance and diversity of B. anthracis pXO1-like plasmid replicons (repX) in various environmental settings not known to contain B. anthracis [28,29]. Furthermore, some of the same B. cereus group strains that contained repX gene sequences with high homology to the repX gene of plasmid pXO1 also contained replicon-specific sequences with high homology to those of pXO2-like plasmids, although they did not contain the pXO1-associated cya and lef virulence genes. The presence of both pXo1-like and pXo2-like plasmids in the same environmental settings and the presence of the backbone genes of these plasmids in various environmental settings not suspected of containing B. anthracis suggests that these plasmids may co-reside in the same host strains [28]. This suggests the species classification with the B. cereus group may be misleading in describing their virulence profile and in predicting their potential to trigger anthrax epidemics.
There has been much experimental and theoretical work focused on the processes and factors that govern plasmid transfer via bacterial conjugation. Conjugation rates change in relation to biotic and abiotic factors which include cell metabolic activity, bacterial cell diversity, plasmid donor and recipient relatedness, nutrient availability and the spatial architecture of the bacterial community [30]. Studies of plasmid invasion of bacterial communities are providing insights into both the evolution of microorganisms and the potential benefits and risks of human manipulation of such invasions [31,32].
Studies have documented the importance of extra-cellular chemical signaling in controlling the dynamics of bacterial communities [8] and in biofilm formation [33], as well as the potential role of such chemical signals in linking biofilms with their external environment [34]. Other studies have investigated the possibility of manipulating the structure and function of bacterial communities via the introduction of specific signaling chemicals [34]. Thus, it seems plausible to suggest the possibility of linking anthrax outbreaks to the horizontal transfer within bacterial communities of plasmids carrying the genes encoding the anthrax toxin, and to potentially control transfer rates via externally supplied chemical signals. A bacteriolytic agent capable of detecting and killing B. anthracis and other members of the B. anthracis “cluster” of bacilli has been identified [35]. However, less intrusive and longer-acting chemical signals would be desirable.
For the investigation of plasmid invasion and extra-cellular chemical signaling in bacterial communities, where dimensionality in space and time are important factors, an individual-based approach seems more appropriate both computationally and experimentally [36]. The most relevant parameters describing a conjugation event at the individual cell level in a structured environment are (1) the conjugation rate, (2) the donor-recipient distance, and (3) the lag times between plasmid receipt and plasmid transfer [37]. Although the majority of parameter estimates currently available are based on population-level averages, the rapid development of individual-based observational technology [38] has provided the opportunity for experiments yielding estimates of plasmid transfer efficiencies at the individual cell scale [30].
As a proof of concept illustrating the utility of simple individual-based models to explore potential mechanisms of pathogen spread to wildlife, we developed such a model that simulates the potential spread of pXO1 and pXO2 plasmids within bacterial communities composed of B. anthracis, B. thuringiensis, B. cereus, and the surrounding matrix of extra-cellular polymeric substances. We then used our hypothetical model to explore the likelihood of detecting plasmids with genes encoding anthrax toxins within B. anthracis, B. thuringiensis, B. cereus, and/or the surrounding matrix of extra-cellular polymeric substances under a variety of assumptions regarding conditions in the rhizosphere at the time of inoculation with B. anthracis.

2. Materials and Methods

2.1. Model Description

The model represents the dynamics of a community of Bacillus sp. existing in the rhizosphere of a hypothetical plant, which, implicitly, may serve as the source of an anthrax outbreak among mammalian hosts (Figure 1). The rhizosphere is represented by (1) 2500 habitat cells, 2 μm2 each (total area = 5 mm2), arrayed in a 50 × 50 habitat grid (vertical plane), (2) up to 5000 bacteria (maximum 2 per habitat cell), and (3) up to several thousand plasmids. The attributes of the habitat cells include the current nutrient level, rate of nutrient renewal, and whether or not they contain a plant root. The attributes of individual bacteria include the species, state (active or spore), nutrient requirement, nutrients accumulated since last cell division, relative starvation level (number of consecutive time steps without consuming nutrients), and current identification numbers of the pXO1 and pXO2 plasmids as well as of hypothetical conjugative plasmids hpCONJ within the cell. The plasmid hpCONJ is an abstract conjugative plasmid that represents any of the conjugative plasmids that can mobilize pXO1 and pXO2 (e.g., pXO14 or pXO16). The attributes of the plasmids include kind (pXO1, pXO2, or hpCONJ), current location (in a bacterium or extra-cellular), state (active or in spore), and accumulated number of conjugation events. The system-level variables include the numbers of active and inactive B. anthracis, B. thuringiensis, and B. cereus, as well as the numbers of the pXO1, pXO2, and hpCONJ plasmids in active bacteria, in spores, and in the extra-cellular matrix. We present a detailed model description following the protocol suggested for individual-based models by Grimm et al. [39] in Appendix A.

2.2. Model Verification
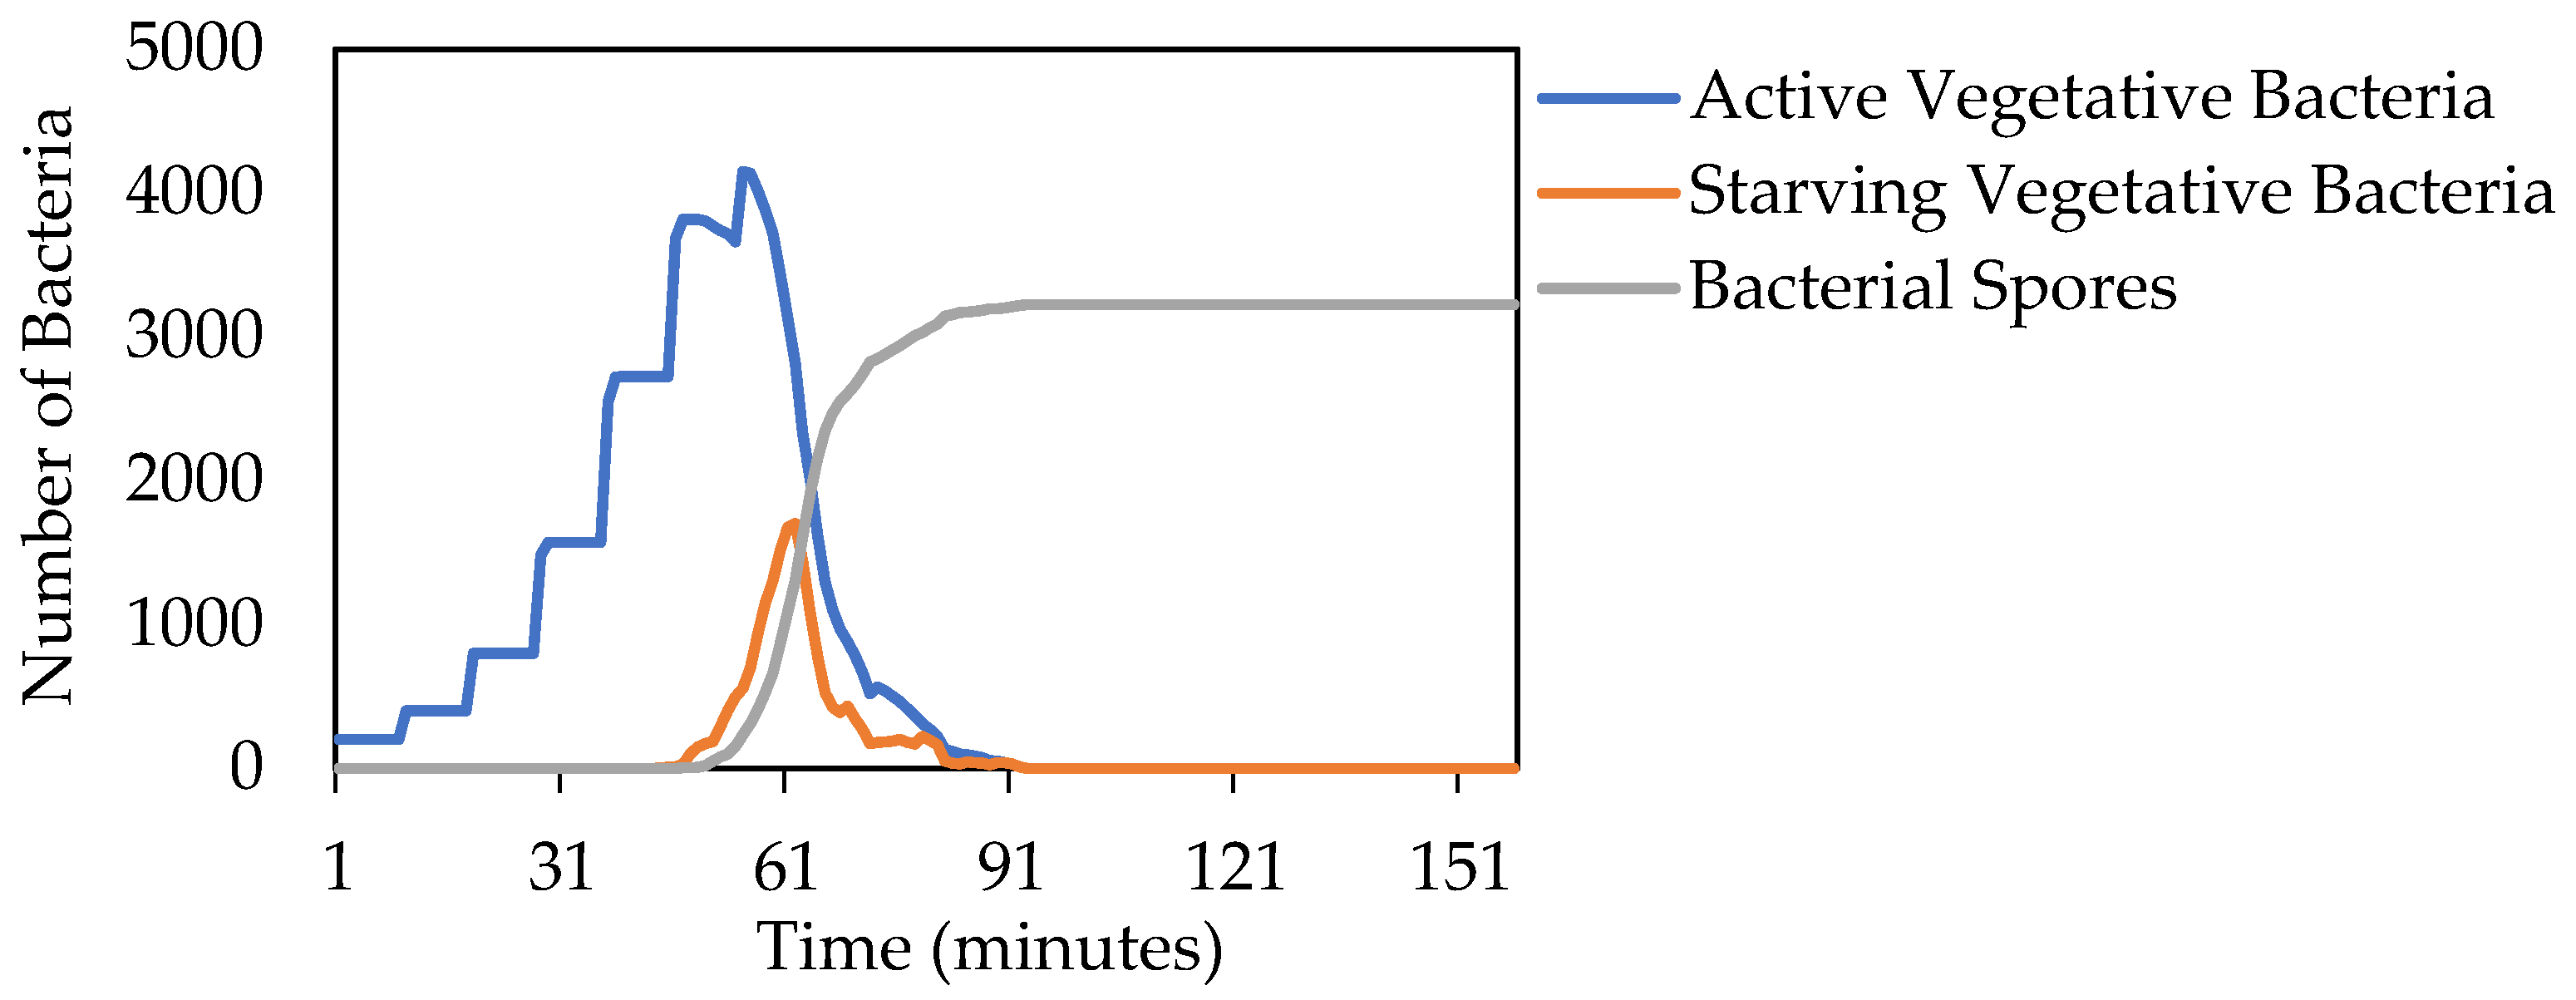
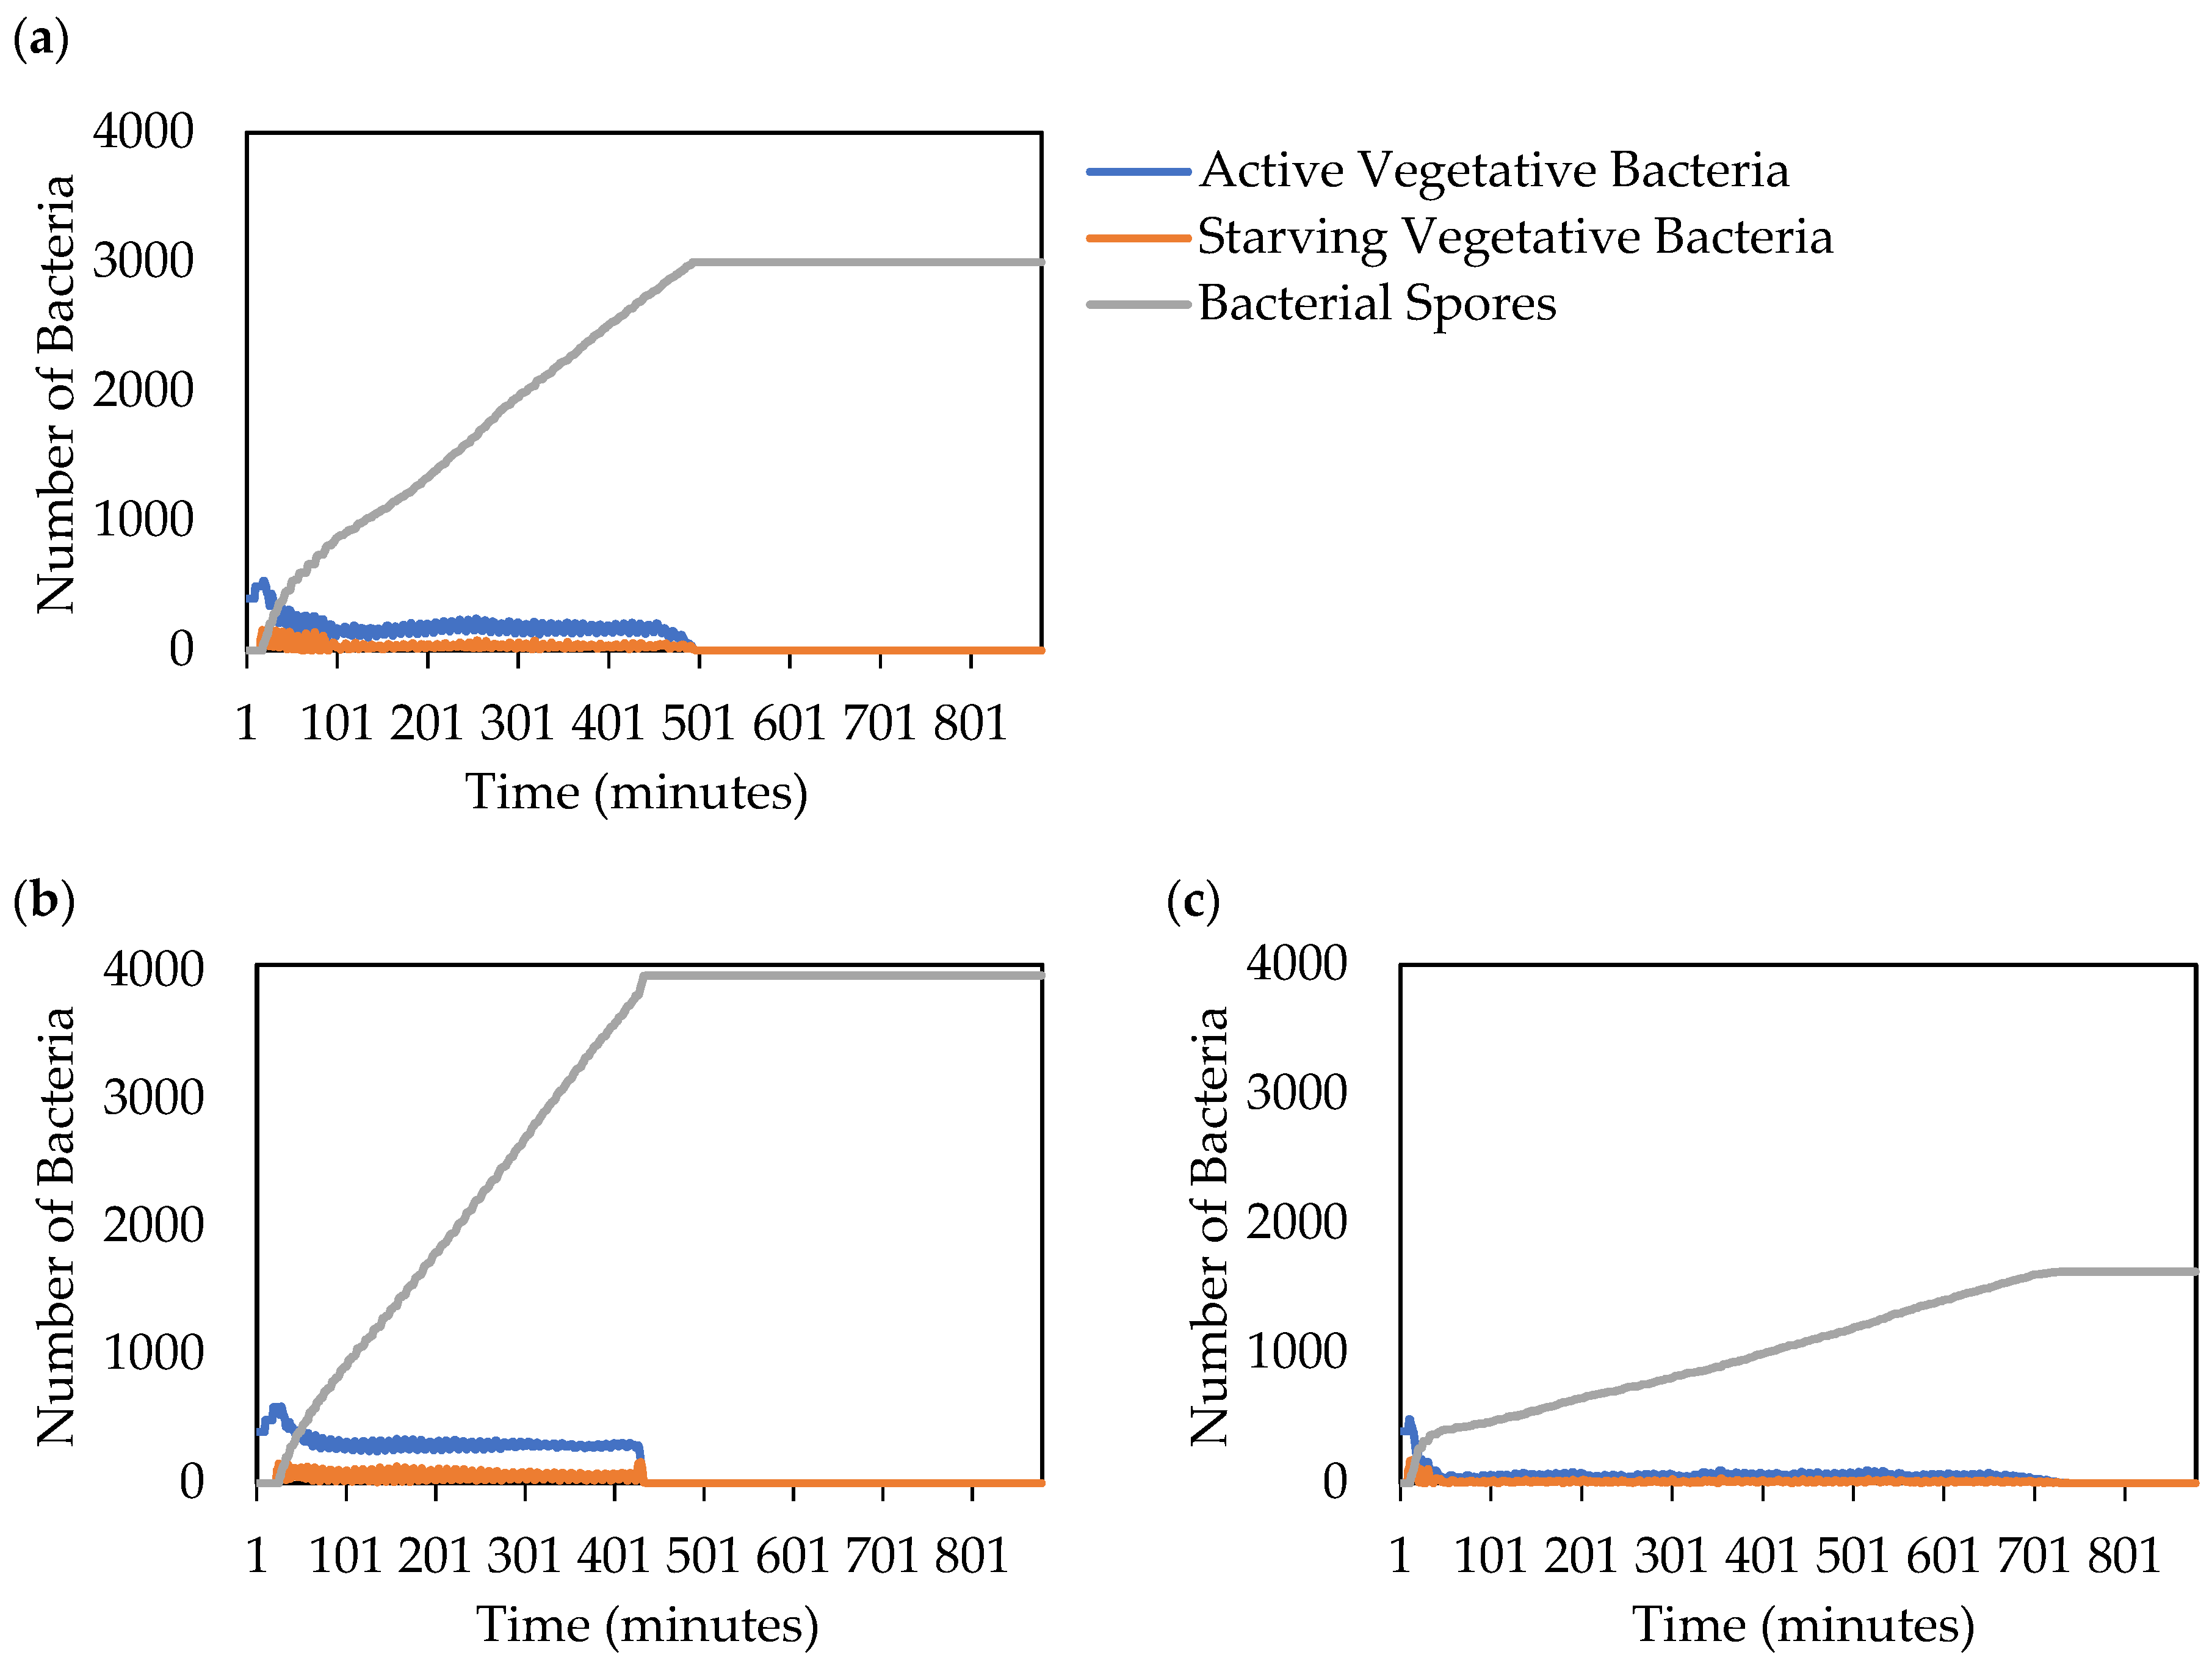
2.2.1. Growth

We parameterized the effects of temperature and relative humidity on bacterial growth based on the derivations of Zwietering et al. [40] and the experiments of Iturriaga et al. [41], respectively. To confirm that the model was simulating growth adequately, we initialized the system with one bacterial colony consisting of one bacterium (without plasmids) in each of four adjacent cells in the center of the 5 mm2 habitat surface, and simulated colony growth over a 24-h period at various constant temperatures and relative humidities, assuming nutrients were supplied ad libitum over the entire habitat surface (nutrient renewal rate = 0.125 units per 5-min time step in each habitat cell).

2.2.2. Conjugation and Segregative Loss

We based our parameterization of conjugation on the individual-based experiments and computer simulations of plasmid invasion in bacterial populations conducted by Seoane et al. [30], and our parameterization of segregative loss on the estimate of Krone et al. [26]. To confirm that the model was simulating conjugation and segregative loss adequately, we initialized the system with five bacterial colonies, one in the center and one near each corner of the habitat grid, with each colony again consisting of one bacterium in each of four adjacent cells. Each bacterium in the center (donor) colony contained a conjugative plasmid (hpCONJ), whereas each bacterium in the four corner (recipient) colonies contained a non-conjugative plasmid (pXO2). We again simulated growth of the colonies over a 24-h period at 30 °C and 100% relative humidity, assuming nutrients were supplied ad libitum over the entire habitat surface.

2.2.3. Transformation and Extra-Cellular Plasmid Degradation

We based our parameterization of transformation and extra-cellular plasmid degradation on the data compiled by Lorenz and Wackernagel [42]. To confirm that the model was simulating transformation and extra-cellular plasmid degradation adequately, we initialized the system with two bacteria and one extra-cellular plasmid in each habitat cell. The bacteria did not contain a plasmid, and the extra-cellular plasmids were non-conjugative (pXO2); hence, no conjugative transfer of plasmids was possible. Once again, we simulated the system dynamics over a 24-h period at 30 °C and 100% relative humidity, assuming nutrients were supplied ad libitum over the entire habitat surface.

2.3. Model Evaluation

2.3.1. Bacterial Colonization of a Homogeneous Root Surface

To assess the ability of the model to simulate bacterial colonization on homogeneous root surfaces, we initialized the system with two bacteria without plasmids in each of 100 randomly chosen habitat cells (4% of the simulated root surface). We assumed the root occupied the entire habitat surface (5 mm2) and that nutrients initially were distributed homogeneously over the entire root surface at a high level (5 nutrient units per root cell). We simulated the system dynamics at 30 °C and 100% relative humidity, with no nutrient renewal, until the system had come to a dynamic equilibrium with regard to the numbers of active bacteria (those consuming nutrients), starving bacteria (those still alive but not consuming nutrients and having not yet formed spores), and spores.

2.3.2. Bacterial Colonization of an Elongating Root under Different Nutrient Concentrations

To assess the ability of the model to simulate bacterial colonization on elongating root surfaces with different initial nutrient concentrations, we initialized the system with two bacteria without plasmids in each habitat cell within the upper four rows of the grid, representing the portion of the grid initially occupied by a plant root (within approximately 5.7 μm of the soil surface). We simulated root growth by adding one row of grid cells, moving from the top to the bottom of the grid, after each 5-min time step (root elongation of approximately 0.41 mm/day). We distributed nutrients homogeneously over the entire initial root surface at either high (5 nutrient units per root cell), medium (3.33 nutrient units per root cell), or low (1.67 nutrient units per root cell) levels, and also initialized each new root cell when it appeared during a simulation with either a high, medium, or low nutrient level, depending on the scenario being simulated. Nutrients were not renewed in existing root cells during the simulations. We simulated the system dynamics at 30 °C and 100% relative humidity until the system had come to a dynamic equilibrium with regard to the numbers of active bacteria, starving bacteria, and spores.

2.4. Model Simulation

2.4.1. Baseline Simulation

To establish realistic baseline conditions for our simulations, we drew upon the experimental results of Raymond et al. [43], which suggested that B. anthracis and B. thuringiensis are much less abundant than B. cereus within bacterial communities in the wild. We then determined the lowest initial proportions of B. anthracis and B. thuringiensis compared with B. cereus that would produce an outbreak of anthrax spores under conditions of 30 °C, 100% relative humidity, and the model parameter values in Table 1. These initial proportions were 0.5% B. anthracis, 1% B. thuringiensis, and 98.5% B. cereus, which produced an anthrax outbreak (defined as the production of B. anthracis spores that contain plasmids pXO1 and pXO2) after ≈20 h of simulated time.

2.4.2. Experimental Simulation: Assuming Bacillus Thuringiensis Cannot Conjugate

In order to investigate whether B. thuringiensis is essential in conjugation leading to form B. anthracis spores, we ran an experimental simulation in which B. thuringiensis could not conjugate. Essentially, any B. thuringiensis bacteria within the model could not receive or donate plasmids with genes encoding for anthrax toxins or the protein capsule. Baseline estimates were used to establish this simulation, with initial bacterial proportions maintained at 0.5% B. anthracis, 1% B. thuringiensis, and 98.5% B. cereus and standard environmental conditions.

3. Results

3.1. Model Verification

3.1.1. Growth

Simulated colony growth at 30 °C and 100% relative humidity essentially filled the habitat surface in 24 h (Figure 2a) with a doubling time during the exponential growth phase ≈ 40 min (Figure 2b), which was our target base rate for scaling purposes, and also is a reasonable doubling time for a variety of bacterial species [26]. Simulated colony growth decreased with decreasing temperature in a manner similar to the relationship derived by Zwietering et al. [40] and with decreasing relative humidity in a manner similar to that observed experimentally by Iturriaga et al. [41] (Figure 2a,b).

3.1.2. Conjugation and Segregative Loss

The simulated numbers of donor and recipient bacteria increased exponentially as they grew toward each other (Figure 3 and Figure 4), with the transconjugants appearing shortly after the donor and recipient colonies met at ≈ 7 h. (Note that a very few transconjugants appeared earlier within the donor colony following segregative loss.) Conjugation occurred slowly as the transfer interface area was forming, accelerated rapidly during a transition phase in which virtually all conjugation events occurred (8 to 12 h), and essentially ceased thereafter as the colonies coalesced to occupy all available space, thus suppressing reproduction and conjugation (see Appendix A.7.7 and Appendix A.7.8). These results corresponded well with the dynamics of plasmid invasion reported by Seoane et al. [30], who observed conjugation events during an approximately six-hour period after donor and recipient bacterial colonies first began to merge, with plasmids spreading into the recipient colony until conjugation was halted as a result of suppression of further cell growth (cell elongation) in the central portions of the colony due to lack of space. Simulated segregative loss occurred at a rate of ≈ 0.005, similar to the estimate of Krone et al. [26].

3.1.3. Transformation and Extra-Cellular Plasmid Degradation

The simulated numbers of transformations increased at a decreasing rate, occurring at a frequency of ≈0.0004 at first, as observed by Lorenz and Wackernagel [42], and decreasing in frequency as the number of bacteria without a plasmid decreased (Figure 5). The simulated degradation of extra-cellular plasmids occurred at a frequency of ≈0.006, as reported by Lorenz and Wackernagel [42].

3.2. Model Evaluation

3.2.1. Bacterial Colonization of a Homogeneous Root Surface

The simulated colonization followed the typical bacterial growth pattern, exhibiting exponential increases in the number of active bacteria, followed by rapid starvation and death or sporulation (Figure 6). As bacterial clusters expanded and coalesced, bacteria in the inner portions of larger clusters became isolated from the remaining nutrient patches, entered a starvation phase, and either formed spores or died, thus forming a time-series of mosaic-like patterns of active, starved, and sporulated bacteria. This spatially heterogeneous pattern of root colonization was similar to that reported by Muci et al. [45], who simulated root surface colonization by bacteria based on laboratory data collected on clover (Trifolium pratense) roots using a modeling approach (a combination of cellular automata models and agent-based models) broadly similar to ours. In addition, as Muci et al. [45] noted, such formations of bacterial clusters on root surfaces commonly are observed under natural conditions and usually are attributed to the heterogeneous availability of nutrients in the rhizosphere [46,47].

3.2.2. Bacterial Colonization of an Elongating Root under Different Nutrient Concentrations

Under the high (5 nutrient units per root cell), medium (3.33 nutrient units per root cell), or low (1.67 nutrient units per root cell) nutrient concentrations, spores soon outnumbered active bacteria as nutrients on older portions of the root surface were depleted and starved bacteria either formed spores or died (Figure 7). The number of bacteria surviving as spores decreased, but the length of time that active bacteria survived on the root surface increased, with decreasing nutrient concentrations. The inverse relationships between nutrient concentration and duration of the presence of active bacteria was due to the inverse relationship between rate of bacterial colonization and length of time nutrients at the newly forming root tip remained unexploited (beyond the “nutrient neighborhood” of the bacteria at the leading edge of the colonization front). Once again, these patterns were generally similar to those obtained by Muci et al. [45] when simulating bacterial colonization of clover roots, and, as these authors noted, such results are in agreement with the observation that root-colonizing bacteria increase in proportion to the quantities of root exudates (nutrients) released [46,47].

3.3. Model Simulations

3.3.1. Baseline Simulation

The baseline simulations indicated that the numbers of transconjugant bacteria rose steeply to ≈140 after ≈600 min (≈10 h) and remained at approximately that level thereafter (Figure 8). The donor bacteria and recipient bacteria both peaked after ≈305 min (≈5 h), with the donor bacteria peaking at a slightly higher level (≈40 bacteria) than the recipient bacteria (≈27 bacteria), after which both decreased to essentially 0 after ≈645 min (≈10.75 h) of simulated time.

3.3.2. Experimental Simulation: Assuming Bacillus thuringiensis Cannot Conjugate

The same overall pattern is demonstrated in the experimental simulation (Figure 9) as the baseline (Figure 8), with slightly lower numbers of transconjugant and donor bacteria. Similar to the baseline trend, transconjugant bacterial levels rose on a steep curve until plateauing at around 600 min (10 h) at about 120 bacteria and remaining at those high levels for the remainder of the simulation. The donor bacteria and recipient bacteria exhibited similar patterns in that they both demonstrated a downwards facing parabola, peaking at around 305 min (about 5 h). The donor bacteria peaked at a slightly lower level (21 bacteria) compared with the recipient bacteria (26 bacteria) before returning to near zero around 650 min (10.83 h). This is expected because as B. thuringiensis could not conjugate, 1% of the initial bacterial population could not engage in conjugation, thus lowering the number of bacteria participating in the donation and transconjugation of plasmids.
As for the rate of production of transconjugant bacteria for each species, B. cereus formed almost the entirety the bacterial transconjugants, plateauing at around 120 bacteria about a third of the way through the simulation, with a very small amount of B. anthracis participating in conjugation near the end of the simulation (1–2 bacteria) (Figure 10). As B. thuringiensis was preset to not be able to conjugate, its rate of transconjugant production remained at zero for the duration of the simulation.
Even this limited conjugation between B. anthracis and B. cereus was enough to produce anthrax spores containing plasmids coding for anthrax toxins near the end of the time frame. Plasmid movement among B. cereus adequately allowed for the generation and movement of anthrax-related plasmids so that an anthrax outbreak was possible. At the end of the 20-h period of the simulation, the majority of all three plasmids, pXO1, pXO2, and hpCONJ, were present in the extracellular matrix (90% of plasmids), meaning that they were not housed within a bacteria or spore (Figure 11). These results show that the majority of plasmids were lost from bacteria, through segregative loss, and deposited in the extracellular matrix as the simulation progressed. A small but significant number of plasmids were present in active bacteria (9.9%), and a very small percentage of plasmids were present in spores (0.13%). In the absence of B. thuringiensis conjugation, B. cereus can contribute heavily to conjugation events with B. anthracis.

4. Discussion

The results from our experimental simulation suggested that despite the lack of conjugation from B. thuringiensis, there was adequate conjugation present between B. cereus and B. anthracis to produce anthrax spores. Environmentally, B. cereus has shown the capacity to acquire plasmids necessary for producing an anthrax outbreak [14], so it is significant that the model not only reflects this but also has the capacity to project this kind of phenomenon. Furthermore, experimental simulation produced only about 10–15 spores, depending on the trial run, showing that only small numbers of B. anthracis cells are required to produce toxic spores when able to conjugate with other bacteria in the Bacillus genus. This model represents only 5 mm2 of plant root surface, so even with very limited initial proportions, and with B. thuringiensis not able to conjugate, 10–15 B. anthracis spores were produced. When considering the entire root surface area of even one plant, the minimum number of anthrax spores required for infection, 2500 spores [48,49], could be reached easily.
We want to emphasize that our simulations are not intended to reflect the complexity of real-world conditions. Rather, the purpose of our model is illustration (sensu Edmonds et al. [50]). That is, regarding the potential role of plasmid transfer within bacterial communities as a trigger for wildlife disease outbreaks, our goal is clarity of illustration not veracity or completeness of representation. A variety of much more sophisticated models of bacteria are available, which, depending on the particular questions addressed, have included detailed mechanistic representations of metabolic pathways and genetic control networks, e.g., Abedon et al. [51], Evans et al. [52], Laschov and Margaliot [53], and Payne and Jansen [54], or sophisticated sets of rules for individual-based models, e.g., Gregory et al. [36] and Vlachos et al. [55]. However, we would suggest that the challenge related to the use of models of bacterial dynamics to explore potential mechanisms of pathogen spread to wildlife is to design a model based on processes simple enough to be understood that also can generate simulated patterns that can be tested experimentally [56].
A related challenge is coupling models of bacterial dynamics represented on micro-level temporal and spatial scales to models of wildlife movement and population dynamics represented on macro-level temporal and spatial scales. Scale issues are problematic for modelers in a variety of disciplines who are faced with the need to represent processes occurring on markedly different spatial and temporal scales within a single integrated systems model (e.g., Iwanaga et al. [57,58,59] and Koralewski et al. [60,61,62]). Modeling issues related to scale are both conceptual and technical, and have been discussed in detail elsewhere (e.g., Iwanaga et al. [57,58,59] and Koralewski et al. [60,61]). Related to, but distinct from, consideration of spatial and temporal scales is consideration of the level of detail with which to represent system processes. Modeling wildlife diseases within an ecological/environmental context is fundamentally different from modeling diseases in humans and livestock in that data available for model parameterization are sparse and, hence, models must inevitably be simpler [63]. We hope the hypothetical model presented in the current paper will encourage exploration of the use of individual-based models that couple simplified versions of generally accepted micro-level models of the spread of bacterial pathogens with specific question-driven macro-level models of the spread of wildlife diseases.

Author Contributions

Conceptualization, H.-H.W., T.E.K. and W.E.G.; methodology, H.-H.W. and W.E.G.; software, H.-H.W. and W.E.G.; validation, W.E.G.; formal analysis, H.-H.W. and A.E.B.; writing—original draft preparation, H.-H.W. and A.E.B.; writing—review and editing, T.E.K. and W.E.G.; visualization, H.-H.W. All authors have read and agreed to the published version of the manuscript.

Funding

This research was funded by the Air Force Research Laboratories Human Effectiveness Directorate (AFRL/HED) through Prime Contract No. FA8650-05-C-6521 to Conceptual MindWorks, Inc. (CMI) and Subcontract No. C6521-TAMUS to the Texas A&M University System.

Institutional Review Board Statement

Not applicable.

Data Availability Statement

The datasets generated during and/or analyzed during the current study are available from the corresponding author on reasonable request.

Acknowledgments

We would like to thank the three anonymous reviewers for their time and effort. The manuscript is greatly improved as a result of their comments.

Conflicts of Interest

The authors declare no conflict of interest.

Appendix A

In the sections that follow, we describe model structure, function, and underlying principles following the protocol for individual-/agent-based models suggested by Grimm et al. [39].

Appendix A.1. Purpose

The purpose of the model was to simulate the spatial-temporal dynamics of bacterial communities (composed of B. anthracis, B. thuringiensis, and B. cereus, and the surrounding matrix of extra-cellular polymeric substances) on the surface of a hypothetical plant root.

Appendix A.2. State Variables and Scales

The state variables included (1) 2500 habitat cells, 2 μm2 each (total area = 5 mm2), arrayed in a 50 × 50 habitat grid (vertical plane), (2) up to 5000 bacteria (maximum two per habitat cell), and (3) up to several thousand plasmids (Table A1). The attributes of the habitat cells included identification number, location, whether or not they contained a plant root, nutrient level, and rate of nutrient renewal. The attributes of bacteria included the identification number, species, state (active or spore), nutrient requirement, nutrients accumulated since last cell division, starvation level (number of consecutive 5-min time steps without consuming nutrients), and identification numbers of the pXO1, pXO2, and hpCONJ (hypothetical conjugative plasmid) plasmids within the bacterial cell. The attributes of plasmids included the identification number, kind (pXO1, pXO2, and hpCONJ), identification number of the bacterium in which they are located (or “−1” if extra-cellular), state (active or in spore), and number of conjugation events. The system-level auxiliary variables included the total number of active and inactive bacterial cells and numbers of active and inactive B. anthracis, B. thuringiensis and B. cereus, as well as the numbers of the pXO1, pXO2, and hpCONJ plasmids in active bacteria, in spores, and in the extra-cellular matrix (Table A2). The auxiliary variables and attributes of state variables that could change over time were updated at 5-min intervals.
Table A1. State variables characterizing low-level model entities. (# means number.)
State VariablesCategory or Value/Unit
Habitat CellsIdentification NumberID # of habitat cell
LocationX and Y coordinates indicating position within the grid
Plant root in cellYes or No
Nutrient Level# of arbitrary units
Rate of Nutrient Renewal# arbitrary units per 5 min
BacteriaIdentification NumberID # of bacteria
SpeciesB. anthracis, B. thuringiensis, or B. cereus
StateActive or Spore
Nutrient RequirementNumber of units of nutrients required per 5 min to grow at maximum rate
Nutrients ConsumedNumber of units of nutrients accumulated since last cell division
Accumulated NutrientsNumber of units of nutrients accumulated since last reproduction (cell division)
Starvation LevelNumber of consecutive 5-min periods in which no consumption has occurred
Identification number of pXO1 and plasmid within the cell ID # of pXO1 plasmid, if present
Identification number of pXO2 plasmid within the cellID # of pXO2 plasmid, if present
Identification number of hpCONJ plasmid within the cellID # of hpCONJ plasmid, if present
PlasmidsIdentification NumberID # of plasmid
KindpXO1, pXO2, or hpCONJ
In BacteriaID # of bacterium in which located or “−1” if not in bacterium
StateActive or in Spore
Conjugation Events# of conjugation events to date
Table A2. Auxiliary variables characterizing aggregated model entities.
Auxiliary Variable
Number of active bacterial cells in system
Number of inactive bacterial cells (spores) in system
Number of active B. anthracis cells in system
Number of active B. thuringiensis cells in system
Number of active B. cereus cells in system
Number of B. anthracis spore cells in system
Number of B. thuringiensis spore cells in system
Number of B. cereus spore cells in system
Number of pXO1 plasmids in system
Number of pXO2 plasmids in system
Number of hpCONJ plasmids in system
Number of pXO1 plasmids in active bacteria
Number of pXO2 plasmids in active bacteria
Number of hpCONJ plasmids in active bacteria
Number of pXO1 plasmids in spores
Number of pXO2 plasmids in spores
Number of hpCONJ plasmids in spores
Number of pXO1 extra-cellular plasmids
Number of pXO2 extra-cellular plasmids
Number of hpCONJ extra-cellular plasmids
We based the determination of spatial and temporal scales on the ecology of the organisms involved, the level of detail contained in available information, and computational considerations. This spatial scale allowed adequate representation of the (implicit) positioning of bacterial cells for conjugation (we assumed an average bacterial cell size of 1 μm2 and, thus, a maximum of two bacterial cells per habitat cell) [26], as well as adequate representation of the spread of plasmids through the bacterial colony [30]. This temporal scale provided adequate resolution to represent the effects of temperature [40] and relative humidity [41] on bacterial growth rates and associated processes (processes occur at rates scaled to baseline rates that represent a system in which the doubling time of Bacillus species would be ≈ 40 min at 30 °C and 100% relative humidity when nutrients are not limited).

Appendix A.3. Process Overview and Scheduling

We programmed the model and executed simulations in NetLogo (http://ccl.northwestern.edu/netlogo/, accessed on 31 August 2011). During each simulation, the system is initialized by describing the numbers, types, and spatial distribution of bacteria and plasmids, and the amount and spatial distribution of nutrients (Figure A1). Next, iteratively, for each 5-min time step, (1) climatic conditions are updated and associated potential bacterial growth rates are calculated, (2) plant root growth occurs and nutrient levels in each habitat cell are updated, and (3) plasmid degradation, (4) spore formation, (5) nutrient consumption, (6) bacterial death, (7) reproduction and segregative loss, (8) conjugation, (11) transformation, and (12) germination occur. We discuss the conceptual design details for process scheduling in Appendix A.4.
Figure A1. Overview of the scheduling of processes and calculations during execution of the model.
Diversity 15 00347 g0a1

Appendix A.4. Design Concepts

Appendix A.4.1. Emergence

The spatial and temporal patterns of nutrients emerge as system-level properties as a result of rates of nutrient renewal of individual habitat cells, which depends on the presence or absence of plant roots, and rates of nutrient consumption by individual bacteria. The spatial and temporal patterns of vegetative (active) cells and spores of B. anthracis, B. thuringiensis, and B. cereus emerge as a result of the reproduction, death, spore formation, and germination of individual bacteria. The spatial and temporal patterns of pXO1, pXO2, and hpCONJ plasmids, both within bacteria and in the surrounding matrix of extra-cellular polymeric substances, emerge as a result of the reproduction, segregative loss, conjugation, transformation, and death of individual bacteria, as well as via the degradation of individual plasmids.

Appendix A.4.2. Sensing

Individual bacteria, in addition to being aware of their own species and state, which affect all of their behavior, also are aware of (1) the nutrient level in each habitat cell within their “nutrient neighborhood” (described in Appendix A.7.5), which affects their rate of consumption, (2) the number of bacteria of each species in each habitat cell within their “growth neighborhood” (described in Appendix A.7.7), which affects their rates of reproduction and conjugation, (3) the number of plasmids of each kind within each bacterium (including themselves) within their growth neighborhood, which affects their rates of conjugation, (4) the number of extra-cellular plasmids of each kind in each habitat cell within their growth neighborhood, which affects their rate of transformation, and (6) their own starvation level, which affects their rates of spore formation and death. Individual plasmids are aware of their own kind, state, and number of previous conjugation events, and whether or not they are currently in a bacterium, which affects their rates of horizontal transfer during bacterial conjugation, their rates of extra-cellular degradation, and their rates of “pickup” from the extra-cellular matrix during bacterial transformation.

Appendix A.4.3. Interaction

Interactions occur between individual bacteria explicitly during conjugation via the exchange of plasmids, and implicitly during reproduction via the suppression of cell division if the growth neighborhood is fully occupied. Interactions occur implicitly between individual bacteria and individual plasmids during conjugation and transformation via the suppression of these processes depending on the plasmids already within the potentially conjugating or transforming bacteria, and during the death of bacteria via the release of plasmids into the extra-cellular matrix. Interactions also occur implicitly between individual plasmids during conjugation and transformation via the suppression of these processes.

Appendix A.4.4. Stochasticity

Individual bacteria are activated, and plasmids are assigned to bacteria and to the extra-cellular matrix of habitat cells randomly at the beginning of simulations, depending on the scenario being simulated. All processes in the model are calculated probabilistically. The importance of capturing the stochastic nature of the spread of microbial communities in spatially structured habitats is well recognized [26,64,65].

Appendix A.4.5. Scheduling Details

To initiate each 5-min time step, first the climatic conditions are updated and the associated potential bacterial growth rates are calculated (Figure A1). Then, plant root growth occurs and habitat nutrient levels are updated. Plasmid degradation then occurs. These processes do not involve interaction among system components. Next, the bacterial processes of spore formation, nutrient consumption, death, reproduction and segregative loss, conjugation, transformation, and germination occur sequentially. Each bacterium, in random order, is given the opportunity to perform each process before the model proceeds to the next process, with the system updated after each action. Since these processes involve either direct or indirect “simultaneous” interaction among all system components, the bias created by sequential processing is minimized by randomizing the order in which individual bacteria perform their activities. Since individual plasmids do not initiate any actions, except their own degradation in the extra-cellular matrix, randomization of the order in which individual bacteria act also minimizes the effect of sequential processing on individual plasmids.

Appendix A.4.6. Observation

During model evaluation, that is, evaluating the capability of the model to generate reasonable patterns of bacterial growth, conjugation, and transformation, we monitored the spatial-temporal dynamics of bacteria and plasmids from an omniscient perspective. During model application, to investigate the likelihood of detecting plasmids with genes encoding anthrax toxins on the surface of a hypothetical plant root, we sampled conjugation, segregative loss, and transformation levels in response to different environmental factors from the perspective of a virtual ecologist.

Appendix A.5. Initialization

The system is initialized by describing the numbers, types, and spatial distributions of bacteria and plasmids, and the amount and spatial distribution of nutrients at time t = 0 depending on the scenario being simulated.

Appendix A.6. Input

Time series of temperature and relative humidity, as well as nutrient levels and distributions, are inputted depending on the scenario being simulated.

Appendix A.7. Submodels

Appendix A.7.1. Adjust Climatic Conditions and Bacterial Growth Rates

Temperature and relative humidity are adjusted depending on the scenario being simulated. The potential growth rates of bacteria are calculated as functions of temperature and relative humidity. The maximum potential growth rates, and the associated nutrient requirements, are scaled such that the doubling time of bacteria at 30 °C and 100% relative humidity with nutrients ad libitum (Ψbase) is ≈40 min, which is approximately equal to the doubling time of Bacillus species under these conditions. Bacterial cells can divide after they have consumed 1 unit of nutrients; thus, at 30 °C and 100% relative humidity, 0.125 units of nutrients per Δt (per 5-min time step) are needed to sustain maximum growth. The effect of temperature on growth rate ( γ ) is demonstrated by Equation (A1):
γ ( h 1 ) = [ b ( T     T m i n ) ] 2 × {   1 exp [ c ( T     T m a x ) ] }
where T is the current temperature (°C, T > 0), Tmin = 3.99 °C, Tmax = 43.7 °C, b = 0.041, and c = 0.161 [40]. The effect of relative humidity on growth rate (δ) at 30 °C is demonstrated by Equation (A2):
δ = b 0 + b 1 × R H
where b0 = 1.725, b1 = 0.043, and RH is the relative humidity (%) [41].
Assuming Equation (2) holds for 3.99 °C < T < 43.7 °C, the adjusted relative growth rate (δ) is defined as the proportion of the growth rate achieved at 100% RH that is achieved at any given RH, as demonstrated by Equation (A3):
δ = 0.286307 + 0.007137 × R H
Thus, growth rate as a function of temperature and relative humidity is demonstrated by Equation (A4):
γ   ( h 1 ) = δ { [ b ( T     T m i n ) ] 2 × { 1   exp [ c ( T     T m a x ) ] } }
The associated doubling time (Ψ) is equal to (ln 2)/γ, and the number of units of nutrients per Δt needed to sustain Ψ is equal to 0.125 × (Ψbase/Ψ).

Appendix A.7.2. Nutrient Renewal and Plant Root Growth

The spatial distribution of nutrients over the habitat surface and their rate of renewal, as well as the root growth rate for those scenarios in which the habitat surface represents a growing plant root, depend on the scenario being simulated.

Appendix A.7.3. Plasmid Degradation

Extra-cellular plasmids (plasmids contained by bacteria are released into the surrounding matrix of extra-cellular polymeric substances when bacteria die; see Appendix A.7.6) have a constant probability of degrading during any given step (Table 1).

Appendix A.7.4. Spore Formation

Spore formation (metabolically active bacterial cells become metabolically inactive) occurs probabilistically if an active bacterium has been unable to consume nutrients for three consecutive time steps (15 min).

Appendix A.7.5. Nutrient Consumption

Each active bacterium consumes nutrients from its “nutrient neighborhood”, which consists of the 7 × 7 block of 49 habitat cells (98 μm2) centered on the habitat cell in which the bacterium is located [26]. The bacterium first attempts to consume nutrients from the habitat cell in which it is located. If no nutrients are available, the 8 adjacent cells are sampled in random order in search of nutrients. If no nutrients are found, the 16 adjacent cells in the next “ring” are sampled in random order, and, finally, the 24 adjacent cells in the next “ring”. When a cell with nutrients is encountered, the bacterium consumes the nutrients needed to sustain maximum growth under the current conditions of temperature and relative humidity (= 0.125 × (Ψbase/Ψ), Section G1), or all the nutrients in the cell, whichever is less. A bacterium can consume nutrients from only one habitat cell per 5-min time step. This results implicitly in nutrient diffusion as nutrients are “drawn” from increasingly distant cells within the “nutrient neighborhood”.

Appendix A.7.6. Death

Bacterial cells die if they have been unable to consume nutrients during four consecutive time steps (20 min). When bacterial cells die, any plasmids they contain are released into the matrix of extra-cellular polymeric substances in the habitat cell in which they are located (see Section Appendix A.7.3).

Appendix A.7.7. Reproduction and Segregative Loss

Bacterial cells divide at rates that depend on their consumption and accumulation of nutrients (see Section Appendix A.7.5), with the daughter cell placed in a habitat cell within the “growth neighborhood”, which consists of the 3 x 3 block of nine habitat cells (18 μm2) centered at the habitat cell in which the bacterium is located [26]. If the bacterium has accumulated at least one unit of nutrients, it can reproduce (divide), provided there is space available within the growth neighborhood (no habitat cell can contain more than two bacteria). If there is space available in the habitat cell in which the bacterium is located, the daughter cell is placed there. If no space is available, the eight adjacent cells are sampled in random order in search of space. If no available space is found, reproduction is suppressed.
When a plasmid-bearing bacterium reproduces, vertical transmission of plasmids can be complete or incomplete. Segregative loss of plasmids occurs probabilistically (Table 1) for each type of plasmid (pXO1, pXO2, hpCONJ) in each species of bacteria (B. anthracis, B. cereus, B. thuringiensis), with the daughter cell containing all or none of the plasmids of the parent cell.

Appendix A.7.8. Conjugation

Horizontal transfer of plasmids only occurs between a growing (implicitly elongating) recipient bacterium [30] and a donor bacterium with a conjugative plasmid (hpCONJ, e.g., pXO16 [19]) that is within its growth neighborhood. An active bacterium is defined as “growing” as long as its reproduction has not been suppressed (under Appendix A.7.7). If there is a bacterium with an hpCONJ plasmid in the growth neighborhood, conjugation occurs probabilistically (Table 1). If there are two or more potential donor bacteria in the growth neighborhood, one is chosen randomly. If no potential donor bacterium is found, conjugation does not occur. If conjugation occurs, the recipient bacterium also may receive pXO1 and/or pXO2 plasmids from the donor bacterium if the donor bacterium has these plasmids and the recipient bacteria does not already have them (Figure A2). The new transconjugant bacterium has a higher probability of transferring the plasmids it has just received than did the donor bacterium, this is, it has a shorter conjugal lag time than the original donor, and the conjugal lag time for transferring a given plasmid continues to decrease with each subsequent conjugation event in which the plasmid is involved [30].
Figure A2. Diagrammatic representation of the horizontal transfer of plasmids via bacterial conjugation. Horizontal transfer only occurs between a growing recipient bacterium and a donor bacterium with a hypothetical conjugative plasmid (hpCONJ). If conjugation occurs (without red cross), the recipient bacterium also may receive pXO1 and/or pXO2 plasmids from the donor bacterium if the donor bacterium has these plasmids and the recipient bacteria does not already have them.
Diversity 15 00347 g0a2

Appendix A.7.9. Transformation

Transformation (incorporation into bacterial cells of extra-cellular plasmids) occurs probabilistically (Table 1) if there are extra-cellular plasmids in the habitat cell in which a bacterium is located.

Appendix A.7.10. Germination

Metabolically inactive bacterial cells germinate (become active) if nutrients become available within their nutrient neighborhood.

References

  1. Salkeld, D.J.; Salathé, M.; Stapp, P.; Jones, J.H. Plague outbreaks in prairie dog populations explained by percolation thresholds of alternate host abundance. Proc. Natl. Acad. Sci. USA 2010, 107, 14247–14250. [Google Scholar] [CrossRef] [PubMed] [Green Version]
  2. Jiranantasak, T.; Benn, J.S.; Metrailer, M.C.; Sawyer, S.J.; Burns, M.Q.; Bluhm, A.P.; Blackburn, J.K.; Norris, M.H. Characterization of Bacillus anthracis replication and persistence on environmental substrates associated with wildlife anthrax outbreaks. PLoS ONE 2022, 17, e0274645. [Google Scholar] [CrossRef] [PubMed]
  3. Kiel, J.; Walker, W.W.; Andrews, C.J.; De Los Santos, A.; Adams, R.N.; Bucholz, M.W.; McBurnett, S.D.; Fuentes, V.; Rizner, K.E.; Blount, K.W. Pathogenic ecology: Where have all the pathogens gone? Anthrax: A classic case. In Proceedings of the Chemical, Biological, Radiological, Nuclear, and Explosives (CBRNE) Sensing X, Orlando, FL, USA, 14–16 April 2009; pp. 13–21. [Google Scholar]
  4. Goel, A.K. Anthrax: A disease of biowarfare and public health importance. World J. Clin. Cases WJCC 2015, 3, 20–33. [Google Scholar] [CrossRef] [PubMed]
  5. Blackburn, J.K.; Matakarimov, S.; Kozhokeeva, S.; Tagaeva, Z.; Bell, L.K.; Kracalik, I.T.; Zhunushov, A. Modeling the ecological niche of Bacillus anthracis to map anthrax risk in Kyrgyzstan. Am. J. Trop. Med. Hyg. 2017, 96, 550–556. [Google Scholar] [CrossRef] [PubMed] [Green Version]
  6. Barro, A.S.; Fegan, M.; Moloney, B.; Porter, K.; Muller, J.; Warner, S.; Blackburn, J.K. Redefining the Australian anthrax belt: Modeling the ecological niche and predicting the geographic distribution of Bacillus anthracis. PLoS Negl. Trop. Dis. 2016, 10, e0004689. [Google Scholar] [CrossRef] [Green Version]
  7. Blackburn, J.K. Evaluating the Spatial Ecology of Anthrax in North America: Examining Epidemiological Components across Multiple Geographic Scales Using a GIS-Based Approach; Louisiana State University: Baton Rouge, LA, USA, 2006. [Google Scholar]
  8. Czárán, T.; Hoekstra, R.F. Microbial communication, cooperation and cheating: Quorum sensing drives the evolution of cooperation in bacteria. PLoS ONE 2009, 4, e6655. [Google Scholar] [CrossRef] [Green Version]
  9. Faust, K.; Sathirapongsasuti, J.F.; Izard, J.; Segata, N.; Gevers, D.; Raes, J.; Huttenhower, C. Microbial co-occurrence relationships in the human microbiome. PLoS Comput. Biol. 2012, 8, e1002606. [Google Scholar] [CrossRef]
  10. Saile, E.; Koehler, T.M. Bacillus anthracis multiplication, persistence, and genetic exchange in the rhizosphere of grass plants. Appl. Environ. Microbiol. 2006, 72, 3168–3174. [Google Scholar] [CrossRef] [Green Version]
  11. Pena-Gonzalez, A.; Rodriguez-R, L.M.; Marston, C.K.; Gee, J.E.; Gulvik, C.A.; Kolton, C.B.; Saile, E.; Frace, M.; Hoffmaster, A.R.; Konstantinidis, K.T. Genomic characterization and copy number variation of Bacillus anthracis plasmids pXO1 and pXO2 in a historical collection of 412 strains. Msystems 2018, 3, e00065-18. [Google Scholar] [CrossRef] [Green Version]
  12. Helgason, E.; Økstad, O.A.; Caugant, D.A.; Johansen, H.A.; Fouet, A.; Mock, M.; Hegna, I.; Kolstø, A.-B. Bacillus anthracis, Bacillus cereus, and Bacillus thuringiensis—One species on the basis of genetic evidence. Appl. Environ. Microbiol. 2000, 66, 2627–2630. [Google Scholar] [CrossRef] [Green Version]
  13. Carroll, L.M.; Wiedmann, M.; Kovac, J. Proposal of a taxonomic nomenclature for the Bacillus cereus group which reconciles genomic definitions of bacterial species with clinical and industrial phenotypes. MBio 2020, 11, e00034-20. [Google Scholar] [CrossRef] [PubMed] [Green Version]
  14. Hoffmaster, A.R.; Ravel, J.; Rasko, D.A.; Chapman, G.D.; Chute, M.D.; Marston, C.K.; De, B.K.; Sacchi, C.T.; Fitzgerald, C.; Mayer, L.W. Identification of anthrax toxin genes in a Bacillus cereus associated with an illness resembling inhalation anthrax. Proc. Natl. Acad. Sci. USA 2004, 101, 8449–8454. [Google Scholar] [CrossRef] [Green Version]
  15. Okinaka, R.; Cloud, K.; Hampton, O.; Hoffmaster, A.; Hill, K.; Keim, P.; Koehler, T.; Lamke, G.; Kumano, S.; Manter, D. Sequence, assembly and analysis of pX01 and pX02. J. Appl. Microbiol. 1999, 87, 261–262. [Google Scholar] [CrossRef] [PubMed]
  16. Taylor-Joyce, G.; Brooker, T.; Waterfield, N. The impact of a horizontally acquired virulence plasmid on Bacillus cereus G9241, the causative agent of an anthrax-like illness. Access Microbiol. 2019, 1, 840. [Google Scholar] [CrossRef]
  17. Reddy, A.; Battisti, L.; Thorne, C. Identification of self-transmissible plasmids in four Bacillus thuringiensis subspecies. J. Bacteriol. 1987, 169, 5263–5270. [Google Scholar] [CrossRef] [PubMed] [Green Version]
  18. Hinnekens, P.; Koné, K.M.; Fayad, N.; Leprince, A.; Mahillon, J. pXO16, the large conjugative plasmid from Bacillus thuringiensis serovar israelensis displays an extended host spectrum. Plasmid 2019, 102, 46–50. [Google Scholar] [CrossRef] [PubMed]
  19. Hu, X.; Van der Auwera, G.; Timmery, S.; Zhu, L.; Mahillon, J. Distribution, diversity, and potential mobility of extrachromosomal elements related to the Bacillus anthracis pXO1 and pXO2 virulence plasmids. Appl. Environ. Microbiol. 2009, 75, 3016–3028. [Google Scholar] [CrossRef] [Green Version]
  20. Keesing, F.; Belden, L.K.; Daszak, P.; Dobson, A.; Harvell, C.D.; Holt, R.D.; Hudson, P.; Jolles, A.; Jones, K.E.; Mitchell, C.E. Impacts of biodiversity on the emergence and transmission of infectious diseases. Nature 2010, 468, 647–652. [Google Scholar] [CrossRef]
  21. Wang, H.-H.; Grant, W.E.; Teel, P.D.; Hamer, S.A. Tick-borne infectious agents in nature: Simulated effects of changes in host density on spatial-temporal prevalence of infected ticks. Ecol. Model. 2016, 323, 77–86. [Google Scholar] [CrossRef]
  22. Wang, H.-H.; Grant, W.E.; Teel, P.D. Simulation of climate–host–parasite–landscape interactions: A spatially explicit model for ticks (Acari: Ixodidae). Ecol. Model. 2012, 243, 42–62. [Google Scholar] [CrossRef]
  23. Wang, H.-H.; Grant, W.E.; Teel, P.D.; Hamer, S.A. Simulation of climate-tick-host-landscape interactions: Effects of shifts in the seasonality of host population fluctuations on tick densities. J. Vector Ecol. 2015, 40, 247–255. [Google Scholar] [CrossRef] [PubMed]
  24. LoGiudice, K.; Ostfeld, R.S.; Schmidt, K.A.; Keesing, F. The ecology of infectious disease: Effects of host diversity and community composition on Lyme disease risk. Proc. Natl. Acad. Sci. USA 2003, 100, 567–571. [Google Scholar] [CrossRef] [PubMed] [Green Version]
  25. Granter, S.R.; Bernstein, A.; Ostfeld, R.S. Of mice and men: Lyme disease and biodiversity. Perspect. Biol. Med. 2014, 57, 198–207. [Google Scholar] [CrossRef] [PubMed]
  26. Krone, S.M.; Lu, R.; Fox, R.; Suzuki, H.; Top, E.M. Modelling the spatial dynamics of plasmid transfer and persistence. Microbiology 2007, 153, 2803–2816. [Google Scholar] [CrossRef] [PubMed] [Green Version]
  27. Kolter, R. Biofilms in lab and nature: A molecular geneticist’s voyage to microbial ecology. Int. Microbiol. 2010, 13, 1–7. [Google Scholar] [CrossRef] [PubMed]
  28. Bahl, M.I.; Rosenberg, K. High abundance and diversity of Bacillus anthracis plasmid pXO1-like replicons in municipal wastewater. FEMS Microbiol. Ecol. 2010, 74, 241–247. [Google Scholar] [CrossRef] [PubMed] [Green Version]
  29. Akhtar, P.; Khan, S.A. Two independent replicons can support replication of the anthrax toxin-encoding plasmid pXO1 of Bacillus anthracis. Plasmid 2012, 67, 111–117. [Google Scholar] [CrossRef] [PubMed] [Green Version]
  30. Seoane, J.; Yankelevich, T.; Dechesne, A.; Merkey, B.; Sternberg, C.; Smets, B.F. An individual-based approach to explain plasmid invasion in bacterial populations. FEMS Microbiol. Ecol. 2011, 75, 17–27. [Google Scholar] [CrossRef] [Green Version]
  31. Birge, E.A. Bacterial and Bacteriophage Genetics; Springer: New York, NY, USA, 2013. [Google Scholar]
  32. Maloy, S.R.; Cronan, J.E.J.; Freifelfer, D.L. Microbial Genetics; Jones & Bartlett: Boston, MA, USA, 1994. [Google Scholar]
  33. Sharma, S.; Gopu, V.; Sivasankar, C.; Shetty, P.H. Hydrocinnamic acid produced by Enterobacter xiangfangensis impairs AHL-based quorum sensing and biofilm formation in Pseudomonas aeruginosa. RSC Adv. 2019, 9, 28678–28687. [Google Scholar] [CrossRef] [PubMed] [Green Version]
  34. Wood, T.K.; Hong, S.H.; Ma, Q. Engineering biofilm formation and dispersal. Trends Biotechnol. 2011, 29, 87–94. [Google Scholar] [CrossRef] [Green Version]
  35. Schuch, R.; Nelson, D.; Fischetti, V.A. A bacteriolytic agent that detects and kills Bacillus anthracis. Nature 2002, 418, 884–889. [Google Scholar] [CrossRef] [PubMed]
  36. Gregory, R.; Saunders, J.; Saunders, V. Rule-based modelling of conjugative plasmid transfer and incompatibility. Biosystems 2008, 91, 201–215. [Google Scholar] [CrossRef] [PubMed]
  37. Seoane, J. Individual-based analysis and prediction of the fate of plasmids in spatially structured bacterial populations. Technical University of Denmark Individual-Based Analysis and Prediction of the Fate of Plasmids in Spatially Structured Bacterial Populations. 2010. Available online: https://backend.orbit.dtu.dk/ws/portalfiles/portal/5245262/ENV2010-287.pdf (accessed on 31 May 2011).
  38. Brehm-Stecher, B.F.; Johnson, E.A. Single-cell microbiology: Tools, technologies, and applications. Microbiol. Mol. Biol. Rev. 2004, 68, 538–559. [Google Scholar] [CrossRef] [PubMed] [Green Version]
  39. Grimm, V.; Berger, U.; Bastiansen, F.; Eliassen, S.; Ginot, V.; Giske, J.; Goss-Custard, J.; Grand, T.; Heinz, S.K.; Huse, G. A standard protocol for describing individual-based and agent-based models. Ecol. Model. 2006, 198, 115–126. [Google Scholar] [CrossRef]
  40. Zwietering, M.; De Koos, J.; Hasenack, B.; De Witt, J.; Van’t Riet, K. Modeling of bacterial growth as a function of temperature. Appl. Environ. Microbiol. 1991, 57, 1094–1101. [Google Scholar] [CrossRef] [Green Version]
  41. Iturriaga, M.H.; Tamplin, M.L.; Escartin, E.F. Colonization of tomatoes by Salmonella montevideo is affected by relative humidity and storage temperature. J. Food Prot. 2007, 70, 30–34. [Google Scholar] [CrossRef] [Green Version]
  42. Lorenz, M.G.; Wackernagel, W. Bacterial gene transfer by natural genetic transformation in the environment. Microbiol. Rev. 1994, 58, 563–602. [Google Scholar] [CrossRef]
  43. Raymond, B.; Wyres, K.L.; Sheppard, S.K.; Ellis, R.J.; Bonsall, M.B. Environmental factors determining the epidemiology and population genetic structure of the Bacillus cereus group in the field. PLoS Pathog. 2010, 6, e1000905. [Google Scholar] [CrossRef] [Green Version]
  44. Gauvry, E.; Mathot, A.-G.; Couvert, O.; Leguérinel, I.; Jules, M.; Coroller, L. Differentiation of vegetative cells into spores: A kinetic model applied to Bacillus subtilis. Appl. Environ. Microbiol. 2019, 85, e00322-00319. [Google Scholar] [CrossRef] [Green Version]
  45. Muci, A.L.; Jorquera, M.A.; Ávila, Á.I.; Rengel, Z.; Crowley, D.E.; de la Luz Mora, M. A combination of cellular automata and agent-based models for simulating the root surface colonization by bacteria. Ecol. Model. 2012, 247, 1–10. [Google Scholar] [CrossRef]
  46. Hartmann, A.; Schmid, M.; Tuinen, D.v.; Berg, G. Plant-driven selection of microbes. Plant Soil 2009, 321, 235–257. [Google Scholar] [CrossRef]
  47. Buddrus-Schiemann, K.; Schmid, M.; Schreiner, K.; Welzl, G.; Hartmann, A. Root colonization by Pseudomonas sp. DSMZ 13134 and impact on the indigenous rhizosphere bacterial community of barley. Microb. Ecol. 2010, 60, 381–393. [Google Scholar] [CrossRef] [PubMed]
  48. Meselson, M.; Guillemin, J.; Hugh-Jones, M.; Langmuir, A.; Popova, I.; Shelokov, A.; Yampolskaya, O. The Sverdlovsk anthrax outbreak of 1979. Science 1994, 266, 1202–1208. [Google Scholar] [CrossRef] [PubMed]
  49. Watson, A.; Keir, D. Information on which to base assessments of risk from environments contaminated with anthrax spores. Epidemiol. Infect. 1994, 113, 479–490. [Google Scholar] [CrossRef] [PubMed]
  50. Edmonds, B.; Le Page, C.; Bithell, M.; Chattoe-Brown, E.; Grimm, V.; Meyer, R.; Montañola-Sales, C.; Ormerod, P.; Root, H.; Squazzoni, F. Different modelling purposes. J. Artif. Soc. Soc. Simul. 2019, 22, 6. [Google Scholar] [CrossRef] [Green Version]
  51. Abedon, S.T.; Herschler, T.D.; Stopar, D. Bacteriophage latent-period evolution as a response to resource availability. Appl. Environ. Microbiol. 2001, 67, 4233–4241. [Google Scholar] [CrossRef] [Green Version]
  52. Evans, T.; Bowers, R.G.; Mortimer, M. Modelling the stability of Stx lysogens. J. Theor. Biol. 2007, 248, 241–250. [Google Scholar] [CrossRef]
  53. Laschov, D.; Margaliot, M. Mathematical modeling of the lambda switch: A fuzzy logic approach. J. Theor. Biol. 2009, 260, 475–489. [Google Scholar] [CrossRef]
  54. Payne, R.J.; Jansen, V.A. Understanding bacteriophage therapy as a density-dependent kinetic process. J. Theor. Biol. 2001, 208, 37–48. [Google Scholar] [CrossRef] [Green Version]
  55. Vlachos, C.; Paton, R.; Saunders, J.; Wu, Q. A rule-based approach to the modelling of bacterial ecosystems. Biosystems 2006, 84, 49–72. [Google Scholar] [CrossRef]
  56. Grimm, V.; Railsback, S.F. Individual-Based Modeling and Ecology; Princeton University Press: Princeton, NJ, USA, 2005; p. 428. [Google Scholar]
  57. Iwanaga, T.; Wang, H.-H.; Hamilton, S.H.; Grimm, V.; Koralewski, T.E.; Salado, A.; Elsawah, S.; Razavi, S.; Yang, J.; Glynn, P.; et al. Socio-technical scales in socio-environmental modeling: Managing a system-of-systems modeling approach. Environ. Model. Softw. 2021, 135, 104885. [Google Scholar] [CrossRef] [PubMed]
  58. Iwanaga, T.; Wang, H.-H.; Koralewski, T.; Grant, W.; Jakeman, A.; Little, J. Toward a complete interdisciplinary treatment of scale: Reflexive lessons from socioenvironmental systems modeling. Elem. Sci. Anth. 2021, 9, 00182. [Google Scholar] [CrossRef]
  59. Iwanaga, T.; Steinmann, P.; Sadoddin, A.; Robinson, D.; Snow, V.; Grimm, V.; Wang, H.-H. Perspectives on confronting issues of scale in systems modeling. Socio-Environ. Syst. Model. 2022, 4, 18156. [Google Scholar] [CrossRef]
  60. Koralewski, T.E.; Westbrook, J.K.; Grant, W.E.; Wang, H.-H. Coupling general physical environmental process models with specific question-driven ecological simulation models. Ecol. Model. 2019, 405, 102–105. [Google Scholar] [CrossRef]
  61. Koralewski, T.E.; Wang, H.-H.; Grant, W.E.; Brewer, M.J.; Elliott, N.C.; Westbrook, J.K.; Szczepaniec, A.; Knutson, A.; Giles, K.L.; Michaud, J. Integrating models of atmospheric dispersion and crop-pest dynamics: Linking detection of local aphid infestations to forecasts of region-wide invasion of cereal crops. Ann. Entomol. Soc. Am. 2020, 113, 79–87. [Google Scholar] [CrossRef] [Green Version]
  62. Koralewski, T.E.; Wang, H.-H.; Grant, W.E.; Brewer, M.J.; Elliott, N.C.; Westbrook, J.K. Modeling the dispersal of wind-borne pests: Sensitivity of infestation forecasts to uncertainty in parameterization of long-distance airborne dispersal. Agric. For. Meteorol. 2021, 301–302, 108357. [Google Scholar] [CrossRef]
  63. McCallum, H. Models for managing wildlife disease. Parasitology 2016, 143, 805–820. [Google Scholar] [CrossRef]
  64. Kreft, J.-U.; Booth, G.; Wimpenny, J.W. BacSim, a simulator for individual-based modelling of bacterial colony growth. Microbiology 1998, 144, 3275–3287. [Google Scholar] [CrossRef] [Green Version]
  65. Wei, W.; Krone, S.M. Spatial invasion by a mutant pathogen. J. Theor. Biol. 2005, 236, 335–348. [Google Scholar] [CrossRef] [Green Version]
Figure 1. Conceptualization of the spatial-temporal dynamics of bacterial communities composed of Bacillus species and the surrounding matrix of extra-cellular polymeric substances on the surface of a hypothetical plant root, and their potential role in disease outbreaks.
Diversity 15 00347 g001
Figure 2. (a) Simulated temporal patterns of bacterial growth at decreasing temperatures and relative humidity. (b) Simulated doubling times for the same simulations as (a). Note that Simulation 1 and Simulation 2 results are nearly identical.
Diversity 15 00347 g002
Figure 3. Simulated temporal dynamics of the numbers of donor, recipient, and transconjugant bacteria at 30 °C and 100% relative humidity.
Diversity 15 00347 g003
Figure 4. Results of simulated spatial patterns of bacterial conjugation and plasmid invasion of recipient colonies at 30 °C and 100% relative humidity: (a) after 10 h; (b) after 12 h; (c) after 14 h; and (d) after 16 h. As labeled in (a), donor bacteria are represented by a large dot on the left side of the cell, recipient bacteria are represented as a small dot on the left side of the cell, and plasmids are represented as a small dot on the right side of the cell.
Diversity 15 00347 g004
Figure 5. Simulated temporal dynamics of numbers of extracellular plasmids and transformed bacteria at 30 °C and 100% relative humidity.
Diversity 15 00347 g005
Figure 6. Simulated temporal dynamics of numbers of active vegetative bacteria, starving vegetative bacteria, and bacterial spores at 30 °C and 100% relative humidity.
Diversity 15 00347 g006
Figure 7. Simulated temporal dynamics of numbers of active vegetative bacteria, starving vegetative bacteria, and bacterial spores on an elongating root surface with (a) high, (b) medium, and (c) low initial nutrient concentrations under conditions of 30 °C and 100% relative humidity.
Diversity 15 00347 g007
Figure 8. Simulated temporal dynamics of numbers of donor, recipient, and transconjugant bacteria under realistic baseline conditions at 30 °C and 100% relative humidity.
Diversity 15 00347 g008
Figure 9. Simulated temporal dynamics of numbers of donor, recipient, and transconjugant bacteria under experimental conditions at 30 °C and 100% relative humidity.
Diversity 15 00347 g009
Figure 10. Simulated temporal dynamics of numbers of transconjugant bacteria by species (when B. thuringiensis cannot conjugate) on an elongating root surface under conditions of 30 °C and 100% relative humidity.
Diversity 15 00347 g010
Figure 11. Simulated distribution of plasmids (when B. thuringiensis cannot conjugate) on elongating root surfaces under conditions of 30 °C and 100% relative humidity.
Diversity 15 00347 g011
Table 1. Values of model parameters and associated information sources.
ParameterValue *UnitReference
Doubling time (base rate at 30 °C, relative humidity = 100%; same for all bacteria)40MinutesKrone et al. [26]
Plasmid degradation rate (same for all plasmids)0.006Probability (≈15 h half-life)Lorenz and Wackernagel [42]
Spore formation0.5ProbabilityGauvry et al. [44]
Segregative loss rate (same for all plasmids in all bacteria)0.005ProbabilityKrone et al. [26]
Conjugation rate (base rate same for all donor bacteria)0.05Probability Seoane et al. [30]
First transconjugant conjugation rate (same for all bacteria)3Multiple of base rateSeoane et al. [30]
Second, third, etc. transconjugant conjugation rate (same for all bacteria)16Multiple of base rateSeoane et al. [30]
Transformation rate (same for all bacteria and extra-cellular plasmids)0.0004Probability Lorenz and Wackernagel [42]
* Values expressed as probabilities represent probability of occurrence at the individual level (bacterium or plasmid) per 5 min.
Disclaimer/Publisher’s Note: The statements, opinions and data contained in all publications are solely those of the individual author(s) and contributor(s) and not of MDPI and/or the editor(s). MDPI and/or the editor(s) disclaim responsibility for any injury to people or property resulting from any ideas, methods, instructions or products referred to in the content.

