Article

Assessment of Anthropogenic Impacts on the Genetic Diversity of Phragmites australis in Small-River Habitats

by
Jolanta Patamsytė
1,
Carla Lambertini
2,
Jurgita Butkuvienė
1,
Donatas Naugžemys
3 and
Donatas Žvingila
1,*
1
Institute of Biosciences, Life Sciences Center, Vilnius University, Saulėtekio Av. 7, 10257 Vilnius, Lithuania
2
Department of Bioscience, University of Milan, Via Celoria 26, 20133 Milan, Italy
3
Botanical Garden, Vilnius University, Kairėnų Str. 43, 10239 Vilnius, Lithuania
*
Author to whom correspondence should be addressed.
Diversity 2023, 15(11), 1116; https://doi.org/10.3390/d15111116
Submission received: 9 October 2023 / Revised: 23 October 2023 / Accepted: 25 October 2023 / Published: 26 October 2023
(This article belongs to the Special Issue Population Genetics of Animals and Plants)

Abstract

:
Common reed is often used as a model plant to study the anthropogenic impacts on ecosystems at local and global scales. As a community-forming species, it is directly exposed to the impacts of human activities on the ecosystem. The aim of our study was to evaluate the patterns of genetic diversity in common reed stands located in habitats that are differently affected by anthropogenic factors. We studied whether riverbed modifications, land cover in the neighborhood of the stand and the chemical and physical parameters of the river water affect the genetic diversity of P. australis at the studied sites. Using DNA fingerprinting, we genotyped 747 plants from 42 sites located in 16 small Lithuanian rivers. Bayesian clustering and principal coordinate analysis revealed two main gene pools at the population (river) level. At the site level (i.e., considering all sites independently of their rivers), polymorphism was high even between sites in the same river. Our study revealed a negative relationship between the concentration of nitrogen compounds and the genotypic richness of P. australis populations. We did not find any correlations between the other chemical parameters of the water and the parameters of the genetic diversity. Additionally, there were no genetic differences between sites in modified and unmodified river sections or between sites that differed in land cover type in the neighborhood of the stand.

1. Introduction

Genetic diversity is an essential component of biodiversity. It is an objective measure of species dynamics and is generally regarded as an indicator of environmental conditions on the basis of all processes on which biodiversity (species diversity, ecosystem diversity) depends [1]. The extent of genetic diversity controls the ability of populations to adapt to environmental changes and is therefore the core of their long-term survival [1,2]. Together with species diversity, it can play a very important role in ecosystem responses to stressors. High genetic diversity can, in fact, increase the likelihood in the community of genotypes being resistant to one or multiple biotic or abiotic factors in the community and, at the same time, enhance the ability of the ecosystem to function under adverse conditions [3]. The loss of genetic diversity puts species at risk of extinction [4].
Anthropogenic stressors cause changes in gene flow and selection and can trigger genetic drift and mutations in populations and increase population differentiation [5,6,7]. It has been demonstrated that fragmentation of natural habitats results in a decrease in genetic diversity within populations [8]. In many cases, anthropogenic pressure interacts with natural factors [9,10]. Therefore, it is important to understand how genetic diversity changes with global environmental changes, especially in habitat-forming species, and predict patterns of ecosystem functioning.
Common reed (Phragmites australis (Cav.) Trin. ex Steudel) is a habitat-forming species in aquatic ecosystems that serves important functions such as stabilization and protection of the shore, removing significant amounts of pollutants from agricultural runoffs and providing food and a home to animals and other organisms [11,12]. Common reed is widespread all over the planet along riverbanks and lakeshores on all continents except Antarctica [13,14,15]. This genetically diverse plant can grow under very different climatic and ecological conditions. Some lineages of the common reed are invasive and colonize various disturbed ecosystems in North America [16,17,18]. P. australis, like many other macrophytes, can reproduce sexually through seeds and asexually through rhizomes or broken rhizome fragments [19,20]. Pollen and seeds are carried by the wind [20]. Dispersal also occurs through water, as rhizome fragments and seeds can float on water [21], or can be carried by birds [13,22]. The role of rhizome fragments in the dispersal of species over large distances appears to be rather limited compared to that of seed dispersal [23,24,25]. Seed germination usually results in genetically distinct individuals, while spread via rhizome fragments or vegetative growth inside stands determines clonal propagation. Kettenring et al. [17,26] reported that the proportion of viable seeds and seed viability were positively associated with stand genetic diversity; therefore, the greater the genetic diversity of a stand is, the more seeds are produced. It has been recognized that genetic diversity, either from sexual reproduction or from genome structure rearrangements and changes in gene expression, can be an important factor for invasion in new ranges [27,28,29,30]. River ecosystems and especially macrophyte communities are strongly impacted by natural and anthropogenic environmental changes. Humankind disturbs river ecosystems via pollution, damming, hydrological alterations and alien species dispersal [10,31,32,33,34,35]. Anthropogenic and natural factors frequently leave detectable footprints on affected populations genetic diversity patterns and structure [8,34,36,37,38]. For example, Koppitz and Kühl [39], based on DNA polymorphisms in common reed stands, revealed that polymorphic multiclonal populations established by seeds can become dominated by one or a few locally adapted genotypes over time, probably due to competition. In accordance with this, Engloner and Major [40] showed that the genotype number in a population decreases with increasing water depth as a result of competition among clones toward the open water. McCormick et al. [37] revealed that common reed populations were more genetically diverse and had more genotypes as habitat disturbance increased. Hazelton et al. [41] observed that older common reed stands exhibit lower clonal richness and shorter interclonal genetic distances than young stands. Liu et al. [34] highlighted the potentially negative impact of dams on rhizome dispersal and local adaptation of P. australis. Kuprina et al. [25] analyzed the genetic diversity of populations from northeastern Germany under different levels of disturbance caused by water salinity and mowing and concluded that disturbance is important for the accumulation of genetic diversity. Guo et al. [18] found that even on a continental scale, the human footprint has a stronger effect than climate on the genetic structure of P. australis populations. In contrast, Paul et al. [42] did not find any correlation between the impact of management and/or habitat disturbance and the genetic diversity pattern of common reed stands in the United Kingdom.
The genetic diversity of P. australis populations can also be influenced by environmental pollution caused by agriculture, sewage and industry. Reeds thrive in environments enriched with nutrients (eutrophication) and industrial pollution [43,44,45] and are successfully used for contamination control and phytoremediation [46,47,48]. For example, it has been shown that reeds can accumulate heavy metals [43,49,50]. On the other hand, heavy metals and other toxic chemicals are environmental stressors and can cause genetic effects in plants [31,51]. Competition between common reed genotypes may also take place in such stressful environments. Coppi et al. [31] found a significant correlation between genetic diversity and environmental concentrations of certain heavy metals and explained this phenomenon as the possible genotoxic effect of heavy metals (Cr, Cu and Zn). Excess nutrients in the environment can also impact the genetic structure of clonal plants that use both vegetative and sexual reproduction, leading to shifts to prevalent clonal growth and changes in reproductive modes [13,52,53].
Common reed is abundant in all the territory of Lithuania, mainly around water bodies and occasionally in roadside ditches and sandy soils [35]. These plants establish themselves in new sites quite quickly, whenever suitable moisture and nutrient conditions occur. This indicates that there is a constant circulation of seeds of this species in the environment. River ecosystems shape suitable conditions for the establishment of reedbeds and have an impact on their genetic diversity [34]. Lithuania’s rivers are suffering eutrophication due to intensive agriculture and urbanization. According to the Lithuanian Environmental Protection Agency (EPA) [54], the concentration of nitrogen nitrate in river catchments in agricultural districts is significantly higher (at least 3–4 times higher) than that in the rivers in forest areas. Nitrate levels in some rivers significantly exceed the values of good water quality by 2–3 times (in 60% of cases), and this excess is 4–9 times higher in one third of the cases. High concentrations of N were detected in common reed leaves collected in many Lithuanian rivers [33]. The reedbeds in Lithuanian rivers were also influenced by river regulation works, which were very intense in 1950–1990 [35]. The excavation works associated with the straightening and modification of the riverbeds and the removal of the upper soil layer could have contributed to the establishment of new reed populations from the soil seed bank or from seed [25,36,55]. In a previous study [35], we used simple sequence repeat (SSR) markers to assess how river modifications impact the genetic diversity patterns of Lithuanian P. australis populations. Our results showed that differences in genetic diversity between the populations in modified and natural river sections cannot be explained solely by the hydraulic works carried out in the past century. In this study, we analyzed a larger sample set and other regions of the Phragmites genome to assess the anthropogenic factors that can impact the genetic diversity of the populations of this species. Here, we employed intersimple sequence repeats (ISSRs), dominant molecular markers that are highly polymorphic, sufficiently reliable, inexpensive and, as some other dominant markers, equally informative as SSRs in the analysis of polyploid genotypes [56]. The application of the ISSR technique enabled the investigation of DNA polymorphisms between adjacent, inverted microsatellite loci, located at suitable distances for PCR amplification, and produced reproducible multilocus band patterns [38,57,58,59,60,61,62,63]. In addition, these markers allowed us to assess a larger number of loci than the 10 SSR loci commonly used for P. australis [64].
Our aim was to quantify the genetic diversity of Lithuanian common reed populations using ISSRs and to assess how disturbance, land cover in the neighborhood of the stand and the chemical and physical parameters of the river water affect the genetic diversity of P. australis populations. Our study should provide new insights into the adaptation and dynamics of common reed populations to anthropogenic disturbance.

2. Materials and Methods

2.1. Sampling Sites and Common Reed Samples

A total of 747 common reed samples were collected in the summer periods of 2015–2018 from 42 sites located at 16 Lithuanian rivers (Table 1, Figure 1).
The number of collection sites per river varied from 1 (Skroblus River, Beržė River) to 6 (Merkys River) and was generally proportional to river size. Plants were sampled on transects along the coastline. The distance between samples was at least 5 meters if the stand was small and 10 or more meters if the stand at the sampling site was larger. The tips of the plants with the youngest leaves were separated from the plant with secateurs, placed in a plastic bag with an attached label indicating the location of the plant collection and placed in a car refrigerator on ice. Samples were transported to the laboratory, where leaves were washed and used for DNA extraction.
The prevailing land cover in the neighborhood of the sampled stand was recorded using Google Maps and by directly visiting the sites. The land cover type was assessed as seminatural (N)—undisturbed wetland or forest; urbanized (U)—in the vicinity of artificial surfaces, in most cases in urbanized territories; and agricultural (A)—near areas of intensive agricultural land use. Some hydro-chemical characteristics (pH, dissolved oxygen, BOD7 (biochemical oxygen consumption over 7 days), ammonium nitrogen, nitrite nitrogen, nitrate nitrogen, mineral nitrogen, total nitrogen (NT), phosphate phosphorus, total phosphorus, specific electrical conductivity), during the period of 9 years (2010–2018) were obtained from the Lithuanian EPA database [54]. Averages of the nine-year values of these indicators were used. River modification data were obtained from the Lithuanian EPA and Lithuanian Energy Institute [35].

2.2. DNA Extraction

Approximately 100 mg of cleaned tissue from young healthy leaves was weighed and used for DNA isolation. DNA was extracted from leaf tissue using a modified version of the CTAB method adapted to extract DNA from small amounts of plant material [65]. The DNA quality was assessed using 0.8% agarose gel electrophoresis and a spectrophotometer. The DNA concentration was determined using a BioPhotometer (Eppendorf, Hamburg, Germany). The DNA samples were stored at −20 °C until use.

2.3. ISSR Marker Analysis

ISSR-PCR conditions were as described previously by Patamsytė et al. [65]. Amplification was performed in a 10 μL volume containing 1× PCR buffer, 10 ng of genomic DNA, 3 mM MgCl2, 5 μM primers, 200 μM dNTPs and 0.4 U of Taq DNA polymerase (Thermo Fisher Scientific Baltics, Vilnius, Lithuania). Amplification reactions were run on a Mastercycler Pro (Eppendorf, Hamburg, Germany) under the following protocol: starting denaturation cycle at 94 °C for 7 min; 32 cycles of 30 s at 94 °C, 45 s at the primer-specific annealing temperature (from 45 °C to 51 °C, Table S1) and 2 min at 72 °C, and a final step of 7 min at 72 °C. A total of 7 ISSR primers (CCA(GTC)4, (AG)8CG, GTGC(TC)7, (CCA)5, (GGGT)3GTG, (CA)8A and (AC)8T) suitable for common reed genome analysis were selected from the 20 tested. These primers amplified numerous clear and reproducible DNA bands. The amplification products were analyzed in large 1.5% agarose gels using 0.5× TBE buffer (4 h, 4 V/cm) and stained with ethidium bromide. ISSR-PCR banding patterns were recorded using a UV transilluminator and BioDocAnalyze software (Biometra, Göttingen, Germany). GeneRulerTM DNA Ladder Mix (100–10,000 bp) (Thermo Fisher Scientific Baltics, Vilnius, Lithuania) was used for DNA fragment size assessment. DNA bands in the size range of 310–2000 bp were scored. Each DNA sample was examined in independent amplification reactions at least twice to ensure reproducibility. The genotyping error rate was 1.6%. Problematic loci were not included in the data analysis.

2.4. Data Analysis

Reproducible DNA bands generated by ISSR-PCR were scored and used to construct a binary data matrix that was used for further analyses. The presence of a DNA band was indicated as 1 and the absence as 0. Monomorphic bands were not included in the analysis.
Genetic diversity parameters and differentiation were assessed on different genotypes (genets). Identical genotypes (ramets) within sites were excluded from these calculations. Clones were defined using the multilocus matches function in GenAlEx v. 6.5 [66]. We calculated the genotypic richness (R) using the formula R = (G − 1)/(n − 1), as suggested by [67], where G is the number of different genotypes (genets) at a studied site and n is the total number of plants collected from a given site. The total gene diversity at the species level (Ht) and average gene diversity at the site and population levels (Hw) were estimated using AFLP-SURV [68]. The number of alleles (Na), the number of effective alleles (Ne) and Shannon’s information index (I) were calculated using POPGENE 1.31 software [69]. The percentage of polymorphic loci (P) and expected heterozygosity (He) were estimated using GenAlEx v 6.5 [66].
The analysis of molecular variance (AMOVA; [70]) was used to define genetic variability among P. australis populations and within populations. AMOVA was performed using GenAlEx v. 6.5 [66]. AMOVA was also used to assess how genetic diversity is partitioned between rivers (populations), between sampling sites within rivers and within sites based on Euclidean pairwise distances among individuals. Only the populations that had two or more sampling sites were included in this calculation. Significance testing was carried out using 999 permutations. Four sites were not included in the analysis because they contained only one unique genotype (see Table 1). Hierarchical AMOVA was also used to assess genetic differences between sites that varied according to the type of land cover (seminatural—N; agricultural—A; and urbanized—U) in the neighborhood and groups of sites from modified and natural river stretches. Genetic distances among sites and populations were determined using principal coordinate analysis (PCoA) based on the ΦPT matrix. The PCoA was performed using GenAlEx v. 6.5. The correlation between genetic (ΦPT) and geographic distances was estimated and the effect of isolation by distance (IBD) among sites was assessed using the Mantel test (999 permutations) in GenAlEx v.6.5.
The genetic structure and the extent of admixture between genotypes, sites and populations were assessed using the Bayesian clustering method implemented in the software STRUCTURE v. 2.3.4 [71,72] using an admixture model. The likelihood L(K) and the values of K (ΔK) from K = 1–42 were computed for the sites and from 1 to 16 for populations, and the most likely number of clusters (K) was identified according to Evanno et al. [73] with STRUCTURE HARVESTER. The study used an initial burn-in period of 20,000 steps and 40,000 MCMC (Markov chain Monte Carlo) iterations [73] with 10 independent replicates each.
For the examination of differences between groups of sites subdivided according to land-use type in the neighborhood of the stand, we used TIBCO StatisticaTM v13.3.0 (TIBCO Software Inc., Palo Alto, CA, USA, 2017) and performed the Kruskal‒Wallis H test. We also assessed the relationships between the P. australis genetic diversity parameters (R, PL, polymorphism, Na, Ne, I and He) of 32 sites and the water chemical and physical parameters (pH, dissolved oxygen, BOD7, NH4-N, NO2-N, NO3-N, mineral N, total N, PO4-P, total P and specific electrical conductivity) using Spearman’s rank correlations.

3. Results

3.1. Genetic Diversity Based on ISSR Markers

The 747 DNA samples were successfully amplified and yielded reproducible banding patterns (ISSR phenotypes). Further analysis of these samples with 7 preselected primers identified 182 loci (bands) (Table S1). The number of polymorphic bands per primer ranged from 20 to 31. A total of 339 distinguishable multilocus genotypes (genets) were identified and used for data analysis. Of the 42 sampling sites scored in 16 Lithuanian rivers, 38 showed genotypic polymorphism (Table 1). The number of genets per multiclonal site varied from 24 (MR1, KN1, KN2) to 2 (SL1, VN2, NV4). Only 1 genotype per site was identified at 4 monoclonal sites (SK, VS3, PN2, SR1). Genotypes from these four sites showed site-specific banding patterns with all tested primers. The mean number of genets per site was 8.368 ± 1.130. The percentage of polymorphic loci per multiclonal site ranged from 1.1% (VN2) to 51.1% (KN2), with an average of 26.62 ± 2.36% (Table 2).
The genotypic richness (R) at 42 sampling sites ranged from 1 to 0. The highest R values were detected at the VR2, MR1, GR2, SL4, KN1 and KN2 sites, and the lowest at the SK, VN3, PN2 and SR1 sites. The mean number of observed alleles (Na) at 38 studied polymorphic sites was 1.266 ± 0.024 and the mean number of effective alleles (Ne) was 1.178 ± 0.015. The Shannon information index (I) was highest at VR3 (0.284) and lowest at the VN2 site (0.007). The average value of I was 0.150 ± 0.013. Expected heterozygosity (He) ranged from 0.191 (VR3) to 0.005 (GR1, VN2).
When genetic diversity parameters were also calculated for the 16 rivers, the following average values were generated: R—0.377 ± 0.068; Na—1.482 ± 0.105; Ne—1.355 ± 0.033;, I—0.299 ± 0.028; and He—0.203 ± 0.019 (Table 3).
The highest number of genets was found in the Merkys River (MR)—49; the lowest number of genotypes was detected in samples from the Skroblus River (SK)—1. The mean number of genets per population was 20.25 ± 4.09. The genetic diversity at the species level was calculated with AFLPSURV, Ht = 0.3503, and that calculated at the population (river) level was Hw = 0.2201.
The correlation between genetic and geographical distances of sites according to the Mantel test was nonsignificant (R2 = 0.0033, p = 0.255).

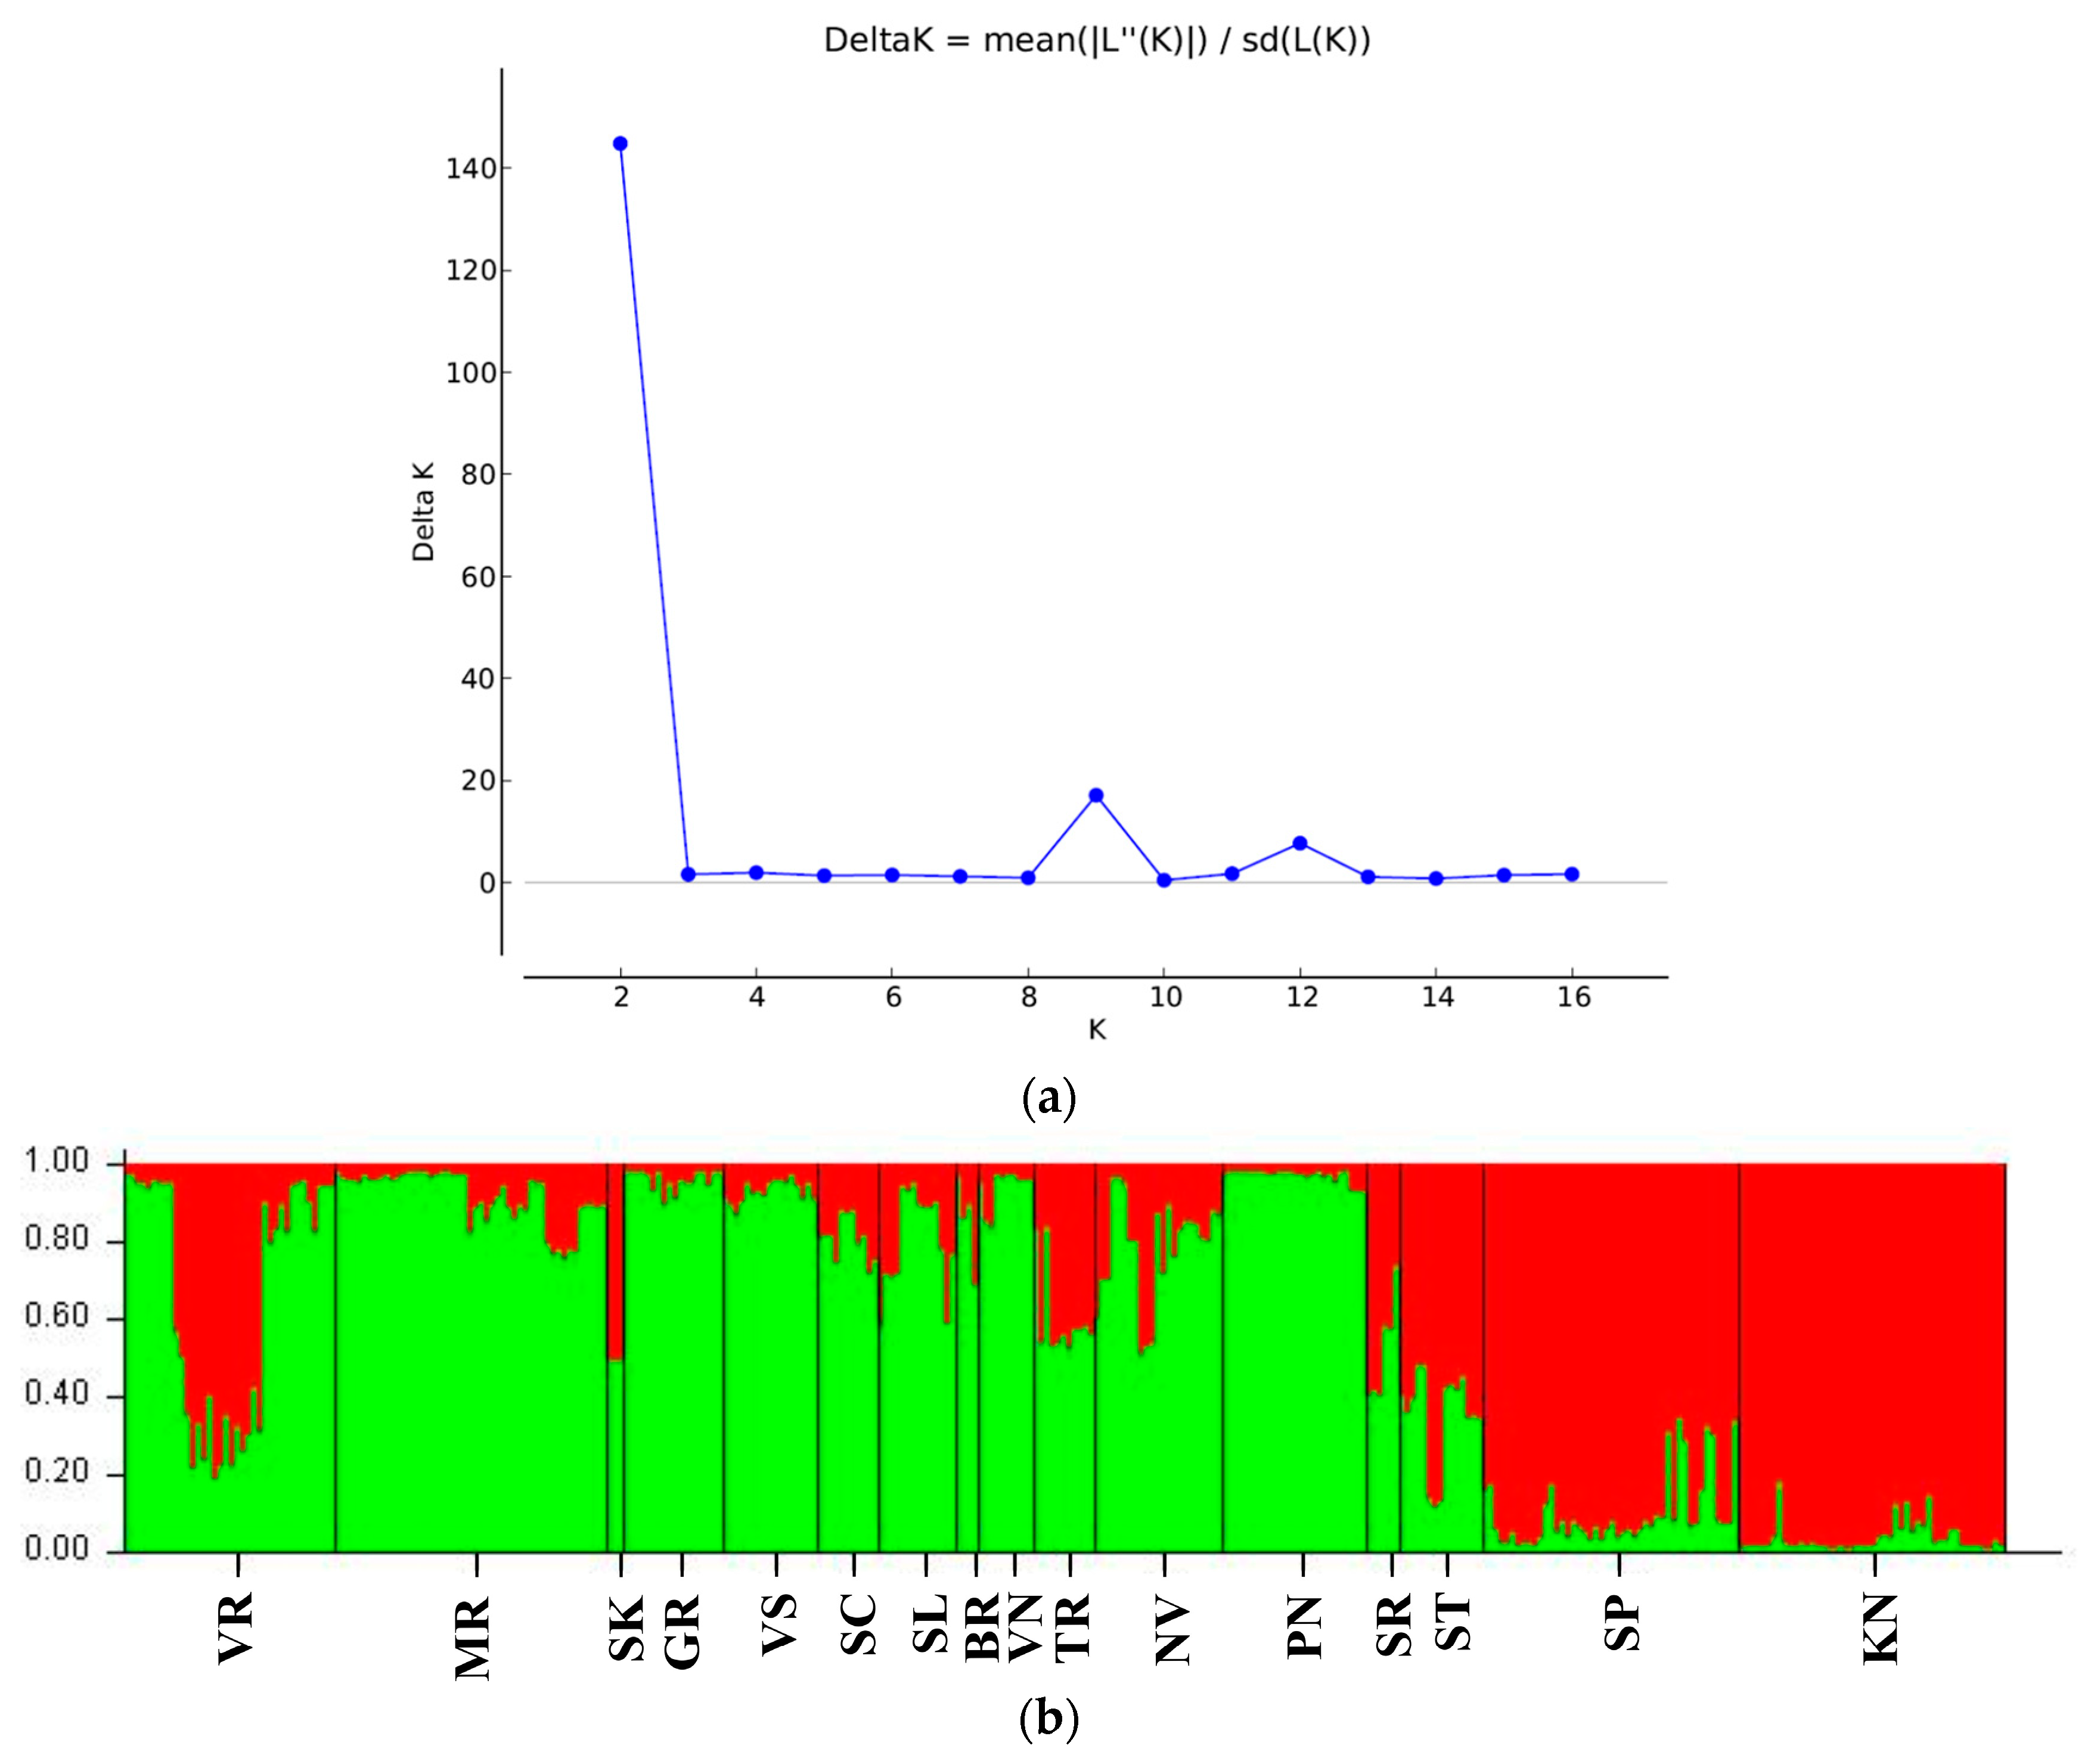
3.2. Genetic Differentiation of Sites and Populations

The hierarchical AMOVA partitioned the total genetic diversity of Lithuanian common reed into the following components: among populations (rivers), among sites and within sites. The percentages of these components of genetic diversity were 14, 33 and 53, respectively. The ΦPT value calculated on the basis of ISSR markers was 0.322 (p = 0.001).
We carried out principal coordinate analysis (PCoA) for the comparison of genetic relationships among polymorphic study sites. The first axis of the PCoA explained 22.3% of the genetic variance among sites. Three main axes explained 59.18%. The resulting diagram of the first two principal coordinates shown in Figure 2 illustrates the pattern of site grouping.
The sites were divided into two subgroups. Twenty-four sites formed the larger subgroup on the right side of the PCoA plot. A smaller number of sites (12), including all sites in Siesartis (ST1–ST3), Kiauna (KN1, KN2), Šešupė (SP1–SP3), Taurupis (TR1, TR2) and some other sites, formed a smaller subgroup on the left side of the plot. Some sites from the same river tended to cluster according to their origin. For example, this was typical for sites SP1–SP3, ST1–ST3 and SL1–SL4. The sites from other rivers were scattered on the plot. Sites in the Merkys River (MR2, MR3 and MR4) were especially genetically divergent. Although the sampling sites of some rivers tended to cluster together, their grouping was not related to the geographical location of the rivers.
The analysis of the genetic structure of 16 P. australis populations was performed using the Bayesian clustering method using STRUCTURE. The highest Delta K value was observed at K = 2 (144.83) (Figure 3a), which means that the studied reed populations could be divided into two genetic clusters. Additional peaks were detected at K = 9 (17.07) and K = 12 (7.66) but were very weak and uncertain to be able to recognize a secondary population structure. STRUCTURE analysis revealed two gene pools and divided the populations into green and red clusters (Figure 3b). Two large populations (SP and KN) were attributed to the red cluster, and five populations (MR, GR, VS, VN and PN) were attributed to the green cluster. The remaining populations were admixed. The highest Delta K for sites (Figure 4a) was K = 14 (331.52), with a few small secondary peaks at K = 12 (44.76), 22 (20.02) and 33 (21.83).
Bayesian analysis of the genetic structure of the sites revealed the genetic specificity of separate sites and a high level of admixture (Figure 4b).

3.3. Assessment of Environmental and Anthropogenic Impacts on Genetic Diversity

We compared site genetic diversity parameters with water chemical characteristics at 32 sites (Table S2) and found a weak negative correlation between the genetic richness (R) and the concentrations of nitrogen forms (R:NO2r = −0.3485, p = 0.05; R:Mineral N:—r = −0.3458, p = 0.05; R:NTr = −0.3446, p = 0.05). For nitrates, the significance of the correlation with genetic richness was very close to significance (R:NO3r = −0.3401, p = 0.0569). There were no significant relationships between the other genetic diversity parameters of P. australis and the river water chemical and physical characteristics at these sites (p > 0.05).
Hierarchical AMOVA and the Kruskal–Wallis test did not detect any genetic differentiation among the groups of sites based on similar neighboring land cover; i.e., among seminatural areas, urbanized areas or agricultural land as well as between sites from natural and modified river stretches.

4. Discussion

4.1. Genetic Structure of Populations and Sites

The polymorphism of P. australis populations based on ISSR markers was high (Hw = 0.2201 ± 0.0127; Ht = 0.3503), which corroborates our previous findings based on SSR markers [35] and with the studies of other authors who have shown that high genetic diversity in populations of the common reed is due to gene flow between populations and the relatively frequent establishment by seeds [20,25,36,37,55]. Nevertheless, 4 of our sites (SK, VS3, PN2, SR1) and 1 population (Skroblus River) were monoclonal. This latter population was small and we could sample only 12 plants from it (Table 1). Monoclonal patches, stands or populations were found also in several studies [13,20,23,74]. The population genetic structure that was inferred by the Bayesian clustering method showed that there are two allele pools that determine the genetic makeup of studied populations (Figure 3). The Šešupė and Kiauna populations were grouped into the smaller red cluster. The green cluster included populations from the Merkys, Visinčia, Pienia, Verseka and Grūda rivers. The remaining populations were combinations of these two allele pools. Despite their genetic similarity, the Šešupė and Kiauna populations are geographically distant, confirming that there is no correlation between geographic and genetic distances, as shown by the Mantel test. Additionally, STRUCTURE analysis carried out at the site level identified high variation among sites within populations (Figure 4). The sampling sites can be divided into two groups according to their polymorphism patterns. Some sites of the same population were genetically similar and were grouped in the same cluster, for example, sites SP1–SP3 from the Šešupė River and sites SR1 and SR2 from the Širvinta River. Such grouping can indicate gene flow between adjacent sites of P. australis [75]. However, some sites that are geographically close to each other were genetically different. For example, sites MR3, MR4 and MR6 from the Merkys River and NV1–NV4 from the Nevėžis River had rather different genetic structures. The changes in the genetic diversity of the reed stands of these two rivers could have been influenced by the modification of the river bed. The part of the Nevėžis River, including riverbank habitats, where our sampling sites (NV1–NV3) are located was strongly modified in the previous century during melioration and riverbed straightening works [35]. The changes in the genetic structure of these sites could therefore be determined by the genetic drift because the disturbance caused by the works, like, for instance, the removal of the upper soil layer, could have created the conditions for the recruitment of propagules coming from different stands or from local seed bank. However, we were unable to identify distinct genetic clusters that could distinguish modified sites from those located in unmodified riverbeds. No correlation of genetic diversity parameters with site disturbance level was found even in several P. australis studies [25,42]. The results of the Bayesian clustering generally corroborated the site grouping in the PCoA plot (Figure 2), where sites from the Merkys River and the Nevėžis River were, in fact, very scattered.

4.2. Eutrophication Impact

We analyzed the impact of anthropogenic factors that can have a strong effect on the structure of the genetic diversity of the common reed stands. Our study found a weak negative relationship between the concentration of nitrogen compounds and genotypic richness. Previous studies analyzed the impact of nutrients, particularly of N, on the clonal growth and sexual reproduction of plants [52,53] and concluded that clonal plants can respond to environmental stress by switching reproduction mode [53,76,77]. It was proven experimentally that clonal growth is stimulated by nutrients. Nitrogen fertilization increased, for instance, the growth of Leymus chinensis ramets and significantly reduced sexual reproduction [53]. Therefore, the negative relationships that we found in our study between genotypic richness and the concentrations of nitrogen compounds could indicate that an increase in these nutrients in water could stimulate clonal spread. In support of this, Kirk et al. [13] reported a significant negative relationship between soil potassium concentration and genotypic richness. The authors suggested that low environmental stress (consistent with abundant nutrient availability) is beneficial for the clonal spread of P. australis. Our study also revealed a new potential relationship of genotypic richness with nitrate (NO3-N) (p = 0.0569). Such a result can be explained by the fact that different forms of nitrogen can have different effects on plant physiology, including a trade-off between the two modes of reproduction [13,78,79]. In contrast, McCormick et al. [37] explained the high genotypic diversity at P. australis sites in Chesapeake Bay by disturbance and increased amounts of nutrients caused by eutrophication. This contradiction could be due to the fact that the balance between reproduction modes may be rather plastic and be impacted also by many other factors than nutrients, like stand age, successional status, ramet density and others [53]. We did not find any relationship between the chemical and physical parameters of the water and the other genetic diversity parameters (Na, Ne, I and He) that we measured.

5. Conclusions

The analysis of a large number of common reed samples provided a more detailed picture of the genetic diversity of P. australis and its dynamics in Lithuanian rivers. The study showed that of all the anthropogenic factors that were tested, the concentration of nitrogen compounds is the only one that could influence the reed clonal diversity in the studied sites. As corroborated by other studies, increased nutrient availability may have promoted clonal growth and reduced seed recruitments at the studied sites. We did not find any relationship between allelic frequencies and river stretch modifications as well as between allelic frequencies and land cover type in the neighborhood of the stand. Further studies are needed to assess population dynamics and adaptation in response to the human impact.

Supplementary Materials

The following supporting information can be downloaded at: https://www.mdpi.com/article/10.3390/d15111116/s1, Table S1. Oligonucleotide ISSR primers used for diversity analysis in common reed sites and populations, primer annealing temperature, number of scored and polymorphic bands, percentage of polymorphic loci identified per primer and scored DNA fragments size range. Table S2. Water hydro-chemical and physical characteristics of common reed sampling sites.

Author Contributions

Conceptualization, C.L. and D.Ž.; Methodology, J.P., D.N. and D.Ž.; Software, J.P., J.B. and D.N.; Validation, J.P. and J.B.; Formal analysis, J.B., D.N. and D.Ž.; Investigation, J.P.; Resources, D.Ž.; Data curation, J.P.; Writing–original draft, D.Ž.; Writing–review & editing, J.P., C.L. and J.B.; Visualization, J.P.; Supervision, C.L. and D.Ž.; Project administration, D.Ž.; Funding acquisition, D.Ž. All authors have read and agreed to the published version of the manuscript.

Funding

This work was supported by the Research Council of Lithuania (SIT-2/2015).

Institutional Review Board Statement

Not applicable.

Data Availability Statement

Not applicable.

Conflicts of Interest

The authors declare no conflict of interest.

References

  1. Hoban, S.; Archer, F.I.; Bertola, L.D.; Bragg, J.G.; Breed, M.F.; Bruford, M.W.; Coleman, M.A.; Ekblom, R.; Funk, W.C.; Grueber, C.E.; et al. Global genetic diversity status and trends: Towards a suite of Essential Biodiversity Variables (EBVs) for genetic composition. Biol. Rev. 2022, 97, 1511–1538. [Google Scholar] [CrossRef] [PubMed]
  2. Reed, D.H.; Frankham, R. Correlation between fitness and genetic diversity. Conserv. Biol. 2003, 17, 230–237. [Google Scholar] [CrossRef]
  3. Roger, F.; Godhe, A.; Gamfeldt, L. Genetic diversity and ecosystem functioning in the face of multiple stressors. PLoS ONE 2012, 7, e45007. [Google Scholar] [CrossRef] [PubMed]
  4. Hautier, Y.; Tilman, D.; Isbell, F.; Seabloom, E.W.; Borer, E.T.; Reich, P.B. Anthropogenic environmental changes impact ecosystem stability via biodiversity. Science 2015, 348, 336–340. [Google Scholar] [CrossRef] [PubMed]
  5. Leimu, R.; Mutikainen, P.; Koricheva, J.; Fisher, M. How general are positive relationship between plant population size, fitness, and genetic variation? J. Ecol. 2006, 94, 942–952. [Google Scholar] [CrossRef]
  6. Sebbenn, A.M.; Carvalho, A.C.M.; Freitas, M.L.M.; Moraes, S.M.B.; Gaino, A.P.S.C.; daSilva, J.M.; Jolivet, C.; Moraes, M.L.T. Low levels of realized seed and pollen gene flow and strong spatial genetic structure in a small, isolated and fragmented population of the tropical tree Copaifera langsdorffii Desf. Heredity 2011, 106, 134–145. [Google Scholar] [CrossRef]
  7. Beatty, G.E.; Reid, N.; Provan, J. Retrospective genetic monitoring of the threatened yellow marsh saxifrage (Saxifraga hirculus) reveals genetic erosion but provides valuable insights for conservation strategies. Divers. Distrib. 2014, 20, 529–537. [Google Scholar] [CrossRef]
  8. Sampson, J.F.; Hankinson, M.; McArthur, S.; Tapper, S.; Langley, M.; Gibson, N.; Yates, C.; Byrne, M. Long-term ‘islands’ in the landscape: Low gene flow, effective population size and genetic divergence in the shrub Hakea oldfieldii (Proteaceae). Bot. J. Linn. Soc. 2015, 179, 319–334. [Google Scholar] [CrossRef]
  9. Banks, S.C.; Cary, G.J.; Smith, A.L.; Davies, I.D.; Driscoll, D.A.; Gill, A.M.; Lindenmayer, D.B.; Peakall, R. How does ecological disturbance influence genetic diversity? Trends Ecol. Evol. 2013, 28, 670–679. [Google Scholar] [CrossRef]
  10. Fuller, M.R.; Doyle, M.W.; Strayer, D.L. Causes and consequences of habitat fragmentation in river networks. Ann. N. Y. Acad. Sci. 2015, 1355, 31–51. [Google Scholar] [CrossRef]
  11. Kiviat, E. Ecosystem services of Phragmites in North America with emphasis on habitat functions. AoB Plants 2013, 5, plt008. [Google Scholar] [CrossRef]
  12. Engloner, A.I.; Szegő, D. Genetic diversity of riverine reed stands indicating the water regime of the habitat. Ecol. Indic. 2016, 61, 846–849. [Google Scholar] [CrossRef]
  13. Kirk, H.; Paul, J.; Straka, J.; Freeland, J.R. Long distance dispersal and genetic diversity are implicated in the invasive spread of the common reed Phragmites australis (Poaceae) in Eastern North America. Am. J. Bot. 2011, 98, 1180–1190. [Google Scholar] [CrossRef] [PubMed]
  14. Lambertini, C.; Sorrell, B.K.; Riis, T.; Olesen, B.; Brix, H. Exploring the borders of European Phragmites within a cosmopolitan genus. AoB Plants 2012, 2012, pls020. [Google Scholar] [CrossRef] [PubMed]
  15. Eller, F.; Skálová, H.; Caplan, J.S.; Bhattarai, G.P.; Burger, M.K.; Cronin, J.T.; Guo, W.-Y.; Guo, X.E.; Hazelton, L.G.; Kettenring, K.M.; et al. Cosmopolitan species as models for ecophysiological responses to global change: The common reed Phragmites australis. Front. Plant Sci. 2017, 8, 1833. [Google Scholar] [CrossRef] [PubMed]
  16. Saltonstall, K. Cryptic invasion by a non-native genotype of Phragmites australis into North America. Proc. Natl. Acad. Sci. USA 2002, 99, 2445–2449. [Google Scholar] [CrossRef] [PubMed]
  17. Kettenring, K.M.; McCormick, M.K.; Baron, H.M.; Whigham, D.F. Mechanisms of Phragmites australis invasion: Feedbacks among genetic diversity, nutrients, and sexual reproduction. J. Appl. Ecol. 2011, 48, 1305–1313. [Google Scholar] [CrossRef]
  18. Guo, W.Y.; Lambertini, C.; Pyšek, P.; Meyerson, L.A.; Brix, H. Living in two worlds: Evolutionary mechanisms act differently in the native and introduced ranges of an invasive plant. Ecol. Evol. 2018, 8, 2440–2452. [Google Scholar] [CrossRef] [PubMed]
  19. Cronk, J.K.; Fennessy, M.S. Wetland Plants: Biology and Ecology; CRC Press/Lewis Publishers: Boca Raton, FL, USA, 2001; pp. 147–188. [Google Scholar]
  20. McCormick, M.K.; Kettenring, K.M.; Baron, H.M.; Whigham, D.F. Extent and reproductive mechanisms of Phragmites australis spread in brackish wetlands in Chesapeake Bay, Maryland (USA). Wetlands 2010, 30, 67–74. [Google Scholar] [CrossRef]
  21. Ishii, J.; Kadono, Y. Factors influencing seed production of Phragmites australis. Aquat. Bot. 2002, 72, 129–141. [Google Scholar] [CrossRef]
  22. Brochet, A.L.; Guillemain, M.; Fritz, H.; Gauthier-Clerc, M.; Green, A.J. The role of migratory ducks in the long-distance dispersal of native plants and the spread of exotic plants in Europe. Ecography 2009, 32, 919–928. [Google Scholar] [CrossRef]
  23. Fér, T.; Hroudová, Z. Genetic diversity and dispersal of Phragmites australis in a small river system. Aquat. Bot. 2009, 90, 165–171. [Google Scholar] [CrossRef]
  24. Stabile, J.; Lipus, D.; Maceda, L.; Maltz, M.; Roy, N.; Wirgin, I. Microsatellite DNA analysis of spatial and temporal population structuring of Phragmites australis along the Hudson River Estuary. Biol. Invasions 2016, 18, 2517–2529. [Google Scholar] [CrossRef]
  25. Kuprina, K.; Seeber, E.; Schnittler, M.; Landeau, R.; Lambertini, C.; Bog, M. Genetic diversity of common reed in the Southern Baltic Sea region—Is there an influence of disturbance? Aquat. Bot. 2022, 177, 103471. [Google Scholar] [CrossRef]
  26. Kettenring, K.M.; McCormick, M.K.; Baron, H.M.; Whigham, D.F. Phragmites australis (common reed) invasion in the Rhode River subestuary of the Chesapeake Bay: Disentangling the effects of foliar nutrients, genetic diversity, patch size, and seed viability. Estuaries Coast. 2010, 33, 118–126. [Google Scholar] [CrossRef]
  27. Belzile, F.; Labbé, J.; LeBlanc, M.C.; Lavoie, C. Seeds contribute strongly to the spread of the invasive genotype of the common reed (Phragmites australis). Biol. Invasions 2010, 12, 2243–2250. [Google Scholar] [CrossRef]
  28. Pyšek, P.; Skálová, H.; Čuda, J.; Guo, W.-Y.; Suda, J.; Doležal, J.; Kauzál, O.; Lambertini, C.; Lučanová, M.; Mandáková, T.; et al. Small genome separates native and invasive populations in an ecologically important cosmopolitan grass. Ecology 2018, 99, 79–90. [Google Scholar] [CrossRef]
  29. Oh, D.-H.; Kowalski, K.P.; Quach, Q.N.; Wijesinghege, C.; Tanford, P.; Dassanayake, M.; Clay, K. Novel genome characteristics contribute to the invasiveness of Phragmites australis (common reed). Mol. Ecol. 2022, 31, 1142–1159. [Google Scholar] [CrossRef]
  30. Tao, F.; Fan, C.; Liu, Y.; Sivakumar, S.; Kowalski, K.P.; Golenberg, E.M. Optimization and application of non-native Phragmites australis transcriptome assemblies. PLoS ONE 2023, 18, e0280354. [Google Scholar] [CrossRef]
  31. Coppi, A.; Lastrucci, L.; Cappelletti, D.; Cerri, M.; Ferranti, F.; Ferri, V.; Foggi, B.; Gigante, D.; Venanzoni, R.; Viciani, D.; et al. AFLP approach reveals variability in Phragmites australis: Implications for its dieback and evidence for genotoxic effects. Front. Plant Sci. 2018, 9, 386. [Google Scholar] [CrossRef]
  32. Erős, T.; Kuehne, L.; Dolezsai, A.; Sommerwerk, N.; Wolter, C. A systematic review of assessment and conservation management in large floodplain rivers—Actions postponed. Ecol. Indic. 2019, 98, 453–461. [Google Scholar] [CrossRef]
  33. Krokaitė, E.; Shakeneva, D.; Juškaitytė, E.; Rekašius, T.; Nemaniūtė-Gužienė, J.; Butkuvienė, J.; Patamsytė, J.; Rančelienė, V.; Vyšniauskienė, R.; Duchovskienė, L.; et al. Nitrogen concentration of the aquatic plant species in relation to land cover type and other variables of the environment. Zemdirb. Agric. 2019, 106, 203–212. [Google Scholar] [CrossRef]
  34. Liu, L.; Wang, J.; Ma, X.; Li, M.; Guo, X.; Yin, M.; Cai, Y.; Yu, X.; Du, N.; Wang, R.; et al. Impacts of the Yellow River and Qingtongxia dams on genetic diversity of Phragmites australis in Ningxia Plain, China. Aquat. Bot. 2021, 169, 103341. [Google Scholar] [CrossRef]
  35. Naugžemys, D.; Lambertini, C.; Patamsytė, J.; Butkuvienė, J.; Khasdan, V.; Žvingila, D. Genetic diversity patterns in Phragmites australis populations in straightened and in natural river sites in Lithuania. Hydrobiologia 2021, 848, 3317–3330. [Google Scholar] [CrossRef]
  36. Lambertini, C.; Gustafsson, M.H.G.; Frydenberg, J.; Speranza, M.; Brix, H. Genetic diversity patterns in Phragmites australis at the population, regional and continental scales. Aquat. Bot. 2008, 88, 160–170. [Google Scholar] [CrossRef]
  37. McCormick, M.K.; Kettenring, K.M.; Baron, H.M.; Whigham, D.F. Spread of invasive Phragmites australis in estuaries with differing degrees of development: Genetic patterns, Allee effects and interpretation. J. Ecol. 2010, 98, 1369–1378. [Google Scholar] [CrossRef]
  38. Anderson, N.O.; Jocienė, L.; Krokaitė, E.; Rekašius, T.; Paulauskas, A.; Kupčinskienė, E. Genetic diversity of Phalaris arundinacea populations in relation to river regulation in the Merkys basin, Lithuania. River Res. Appl. 2018, 34, 300–309. [Google Scholar] [CrossRef]
  39. Koppitz, H.; Kühl, H. To the importance of genetic diversity of Phragmites australis in the development of reed stands. Wetl. Ecol. Manag. 2000, 8, 403–414. [Google Scholar] [CrossRef]
  40. Engloner, A.I.; Major, Á. Clonal diversity of Phragmites australis propagating along water depth gradient. Aquat. Bot. 2011, 94, 172–176. [Google Scholar] [CrossRef]
  41. Hazelton, E.L.G.; McCormick, M.K.; Sievers, M.; Kettenring, K.M.; Whigham, D.F. Stand age is associated with clonal diversity, but not vigor, community structure, or insect herbivory in Chesapeake Bay Phragmites australis. Wetlands 2015, 35, 877–888. [Google Scholar] [CrossRef]
  42. Paul, J.; Kirk, H.; Freeland, J.R. Genetic diversity and differentiation of fragmented reedbeds (Phragmites australis) in the United Kingdom. Hydrobiologia 2011, 665, 107–115. [Google Scholar] [CrossRef]
  43. Vymazal, J.; Březinová, T. Accumulation of heavy metals in aboveground biomass of Phragmites australis in horizontal flow constructed wetlands for wastewater treatment: A review. Chem. Eng. J. 2016, 290, 232–242. [Google Scholar] [CrossRef]
  44. Uddin, M.N.; Robinson, R.W. Can nutrient enrichment influence the invasion of Phragmites australis? Sci. Total. Environ. 2018, 613–614, 1449–1459. [Google Scholar] [CrossRef] [PubMed]
  45. Prica, M.; Andrejić, G.; Šinžar-Sekulić, J.; Rakić, T.; Dželetović, Ž. Bioaccumulation of heavy metals in common reed (Phragmites australis) growing spontaneously on highly contaminated mine tailing ponds in Serbia and potential use of this species in phytoremediation. Bot. Serbica 2019, 43, 85–95. [Google Scholar] [CrossRef]
  46. Ahmad, S.S.; Reshi, Z.A.; Shah, M.A.; Rashid, I.; Ara, R.; Andrabi, S.M.A. Phytoremediation potential of Phragmites australis in Hokersar wetland—A Ramsar Site of Kashmir Himalaya. Int. J. Phytoremediation 2014, 16, 1183–1191. [Google Scholar] [CrossRef]
  47. Rodrigo, M.A.; Valentin, A.; Claros, J.; Moreno, L.; Segura, M.; Lassalle, M.; Vera, P. Assessing the effect of emergent vegetation in a surface-flow constructed wetland on eutrophication reversion and biodiversity enhancement. Ecol. Eng. 2018, 113, 74–87. [Google Scholar] [CrossRef]
  48. Carricondo, J.M.; Oliver-Villanueva, J.V.; Turégano, J.V.; González, J.A.; Mengual, J. Use of Phragmites australis for controlling phosphorus contamination in anthropogenic wetland ecosystems. Environ. Technol. 2021, 42, 3055–3064. [Google Scholar] [CrossRef]
  49. Bonanno, G.; Lo Giudice, R. Heavy metal bioaccumulation by the organs of Phragmites australis (common reed) and their potential use as contamination indicators. Ecol. Indic. 2010, 10, 639–645. [Google Scholar] [CrossRef]
  50. Chandra, R.; Yadav, S. Phytoremediation of CD, CR, CU, MN, FE, NI, PB and ZN from aqueous solution using Phragmites cummunis, Typha angustifolia and Cyperus esculentus. Int. J. Phytoremediation 2011, 13, 580–591. [Google Scholar] [CrossRef]
  51. Labra, M.; Di Fabio, T.; Grassi, F.; Regondi, S.M.G.; Bracale, M.; Vannini, C.; Agradi, E. AFLP analysis as biomarker of exposure to organic and inorganic genotoxic substances in plants. Chemosphere 2003, 52, 1183–1188. [Google Scholar] [CrossRef]
  52. Piqueras, J.; Klimes, L.; Redbo-Torstensson, P. Modelling the morphological response to nutrient availability in the clonal plant Trientalis europaea L. Plant Ecol. 1999, 141, 117–127. [Google Scholar] [CrossRef]
  53. Bai, W.M.; Sun, X.Q.; Wang, Z.W.; Li, L.H. Nitrogen addition and rhizome severing modify clonal growth and reproductive modes of Leymus chinensis population. Plant Ecol. 2009, 205, 13–21. [Google Scholar] [CrossRef]
  54. EPA (Environmental Protection Agency). Agriculture and Lithuanian Waters. Impact of Agricultural Activity on the Status of Lithuanian Rivers and Pollution Loads in the Baltic Sea. Vilnius. 41 (in Lithuanian). 2018. Available online: https://aaa.lrv.lt/lt/veiklos-sritys/vanduo/upes-ezerai-ir-tvenkiniai/valstybinis-upiu-ezeru-ir-tvenkiniu-monitoringas/upiu-monitoringo-rezultatai (accessed on 28 August 2023).
  55. Lambertini, C.; Guo, W.Y.; Ye, S.; Eller, F.; Guo, X.; Li, X.Z.; Sorrell, B.K.; Speranza, M.; Brix, H. Phylogenetic diversity shapes salt tolerance in Phragmites australis estuarine populations in East China. Sci. Rep. 2020, 10, 17645. [Google Scholar] [CrossRef] [PubMed]
  56. Tanhuanpää, P.; Erkkilä, M.; Kalendar, R.; Schulman, A.H.; Manninen, O. Assessment of genetic diversity in Nordic timothy (Phleum pratense L.). Hereditas 2016, 153, 5. [Google Scholar] [CrossRef] [PubMed]
  57. Zietkiewicz, E.; Rafalski, A.; Labuda, D. Genome fingerprinting by simple sequence repeat (SSR) anchored polymerase chain reaction amplification. Genomics 1994, 20, 176–183. [Google Scholar] [CrossRef] [PubMed]
  58. Gentili, R.; Fenu, G.; Mattana, E.; Citterio, S.; De Mattia, F.; Bacchetta, G. Conservation genetics of two island endemic Ribes spp. (Grossulariaceae) of Sardinia: Survival or extinction? Plant Biol. 2015, 17, 1085–1094. [Google Scholar] [CrossRef] [PubMed]
  59. Lopes, M.S.; Mendonça, D.; Bettencourt, S.X.; Borba, A.R.; Melo, C.; Baptista, C.; da Câmara Machado, A. Genetic diversity of an Azorean endemic and endangered plant species inferred from inter-simple sequence repeat markers. AoB Plants 2014, 6, plu034. [Google Scholar] [CrossRef]
  60. Cavanzón-Medrano, L.E.; Machkour-M’Rabet, S.; Chablé-Iuit, L.R.; Pozo, C.; Hénaut, Y.; Legal, L. Effect of climatic conditions and land cover on genetic structure and diversity of Eunica tatila (Lepidoptera) in the Yucatan Peninsula, Mexico. Diversity 2018, 10, 79. [Google Scholar] [CrossRef]
  61. Krokaitė, E.; Janulionienė, R.; Jocienė, L.; Rekašius, T.; Rajackaitė, G.; Paulauskas, A.; Marozas, V.; Kupčinskienė, E. Relating invasibility and invasiveness: Case study of Impatiens parviflora. Front. Ecol. Evol. 2022, 10, 845947. [Google Scholar] [CrossRef]
  62. Naugžemys, D.; Patamsytė, J.; Žilinskaitė, S.; Hoshino, Y.; Skridaila, A.; Žvingila, D. Genetic structure of native blue honeysuckle populations in the Western and Eastern Eurasian Ranges. Plants 2022, 11, 1480. [Google Scholar] [CrossRef]
  63. Lal, A.; Pant, M.; Pant, G.; Palni, L.M.S.; Kumar, A.; Kumar, G. ISSR marker assisted genetic diversity assessment in natural populations of two endemic orchids Aerides multiflora and Rhynchostylis retusa from Uttarakhand, India. S. Afr. J. Bot. 2023, 157, 151–158. [Google Scholar] [CrossRef]
  64. Saltonstall, K. Microsatellite variation within and among North American lineages of Phragmites australis. Mol. Ecol. 2003, 12, 1689–1702. [Google Scholar] [CrossRef] [PubMed]
  65. Patamsytė, J.; Naugžemys, D.; Čėsnienė, T.; Kleizaitė, V.; Demina, O.N.; Mikhailova, S.I.; Agafonov, V.A.; Žvingila, D. Evaluation and comparison of the genetic structure of Bunias orientalis populations in their native range and two non-native ranges. Plant Ecol. 2018, 219, 101–114. [Google Scholar] [CrossRef]
  66. Peakall, R.; Smouse, P.E. GenAlEx 6.5: Genetic analysis in Excel. Population genetic software for teaching and research—An update. Bioinformatics 2012, 28, 2537–2539. [Google Scholar] [CrossRef] [PubMed]
  67. Dorken, M.E.; Eckert, C.G. Severely reduced sexual reproduction in northern populations of a clonal plant, Decodon verticillatus (Lythraceae). J. Ecol. 2001, 89, 339–350. [Google Scholar] [CrossRef]
  68. Vekemans, X.; Beauwens, T.; Lemaire, M.; Roldán-Ruiz, I. Data from amplified fragment length polymorphism (AFLP) markers show indication of size homoplasy and of a relationship between degree of homoplasy and fragment size. Mol. Ecol. 2002, 11, 139–151. [Google Scholar] [CrossRef] [PubMed]
  69. Yeh, F.C.; Yang, R.; Boyle, T. POPGENE: Microsoft Windows-Based Freeware for Population Genetic Analysis: Release 1.31; University of Alberta: Edmonton, AB, Canada, 1999. [Google Scholar]
  70. Excoffier, L.; Lischer, H.E.L. Arlequin suite ver 3.5: A new series of programs to perform population genetics analyses under Linux and Windows. Mol. Ecol. Resour. 2010, 10, 564–567. [Google Scholar] [CrossRef]
  71. Pritchard, J.K.; Stephens, M.; Donnelly, P. Inference of population structure using multilocus genotype data. Genetics 2000, 155, 945–959. [Google Scholar] [CrossRef]
  72. Falush, D.; Stephens, M.; Pritchard, J.K. Inference of population structure using multilocus genotype data: Dominant markers and null alleles. Mol. Ecol. Notes 2007, 7, 574–578. [Google Scholar] [CrossRef]
  73. Evanno, G.; Regnault, S.; Goudet, J. Detecting the number of clusters of individuals using the software structure: A simulation study. Mol. Ecol. 2005, 14, 2611–2620. [Google Scholar] [CrossRef]
  74. Koppitz, H. Analysis of genetic diversity among selected populations of Phragmites australis world-wide. Aquat. Bot. 1999, 64, 209–221. [Google Scholar] [CrossRef]
  75. Jacquemyn, H.; Honnay, O.; Looy, K.V.; Breyne, P. Spatiotemporal structure of genetic variation of a spreading plant metapopulation on dynamic riverbanks along the Meuse River. Heredity 2006, 96, 471–478. [Google Scholar] [CrossRef] [PubMed]
  76. Gardner, S.N.; Mangel, M. Modeling investments in seed, clonal offspring, and translocation in a clonal plant. Ecology 1999, 80, 1202–1220. [Google Scholar] [CrossRef]
  77. Weppler, T.; Stocklin, J. Variation of sexual and clonal reproduction in the alpine Geum reptans in contrasting altitudes and successional stages. Basic Appl. Ecol. 2005, 6, 305–306. [Google Scholar] [CrossRef]
  78. Jampeetong, A.; Brix, H.; Kantawanichkul, S. Effects of inorganic nitrogen forms on growth, morphology, nitrogen uptake capacity and nutrient allocation of four tropical aquatic macrophytes (Salvinia cucullata, Ipomoea aquatica, Cyperus involucratus and Vetiveria zizanioides). Aquat. Bot. 2012, 97, 10–16. [Google Scholar] [CrossRef]
  79. Tho, B.T.; Lambertini, C.; Eller, F.; Brix, H.; Sorrell, B.K. Ammonium and nitrate are both suitable inorganic nitrogen forms for the highly productive wetland grass Arundo donax, a candidate species for wetland paludiculture. Ecol. Eng. 2017, 105, 379–386. [Google Scholar] [CrossRef]
Figure 1. The location of 42 common reed (Phragmites australis) sampling sites. Codes of the sites are explained in Table 1.
Diversity 15 01116 g001
Figure 2. The grouping of 38 polymorphic sampling sites in the PCoA plot. The site codes correspond to the codes explained in Table 1.
Diversity 15 01116 g002
Figure 3. Analysis of the genetic structure of common reed at the population level: (a) Most likely number (K = 2) of genetic pools among 16 populations of P. australis inferred by Evanno‘s Delta K method. (b) Genetic structure of P. australis populations (K = 2) revealed using the STRUCTURE program. Codes below the bar indicate populations according to Table 1 and Table 3. Each individual is represented by a thin vertical line and its color depends on its partitioning into the K clusters. Black lines separate plants from different populations.
Diversity 15 01116 g003
Figure 4. Analysis of the genetic structure of common reed at the level of sites: (a) Most likely number (K = 14) of genetic clusters of 42 sites of P. australis inferred by Evanno‘s Delta K method. (b) Genetic structure of P. australis sites (K = 14) revealed using the STRUCTURE program. Codes below the bar indicate sites according to Table 1. Each individual is represented by a thin line and its color depends on its partitioning into the K clusters. The plants of the same site are separated by black lines.
Diversity 15 01116 g004
Table 1. Phragmites australis 42 sampling sites name, code, number of analyzed samples and identified genets, location and some habitat characteristics.
No.River SiteCodeSamplesCoordinatesLMH
NGLatitudeLongitude
1.Varėnė 1VR124954.39161124.407747A+
2.Varėnė 2VR2161654.32904724.511211N+
3.Varėnė 3VR3281354.25061424.554161U
4.Merkys 1MR1242454.43697824.982144A++
5.Merkys 2MR28754.40911724.910669A++
6.Merkys 3MR38454.38819724.893189N+
7.Merkys 4MR47354.33796724.822267N+
8.Merkys 5MR512654.33608624.808022N+
9.Merkys 6MR611554.11810624.302706N+
10.SkroblusSK12154.10594224.279528N+
11.Grūda 1GR124454.02295624.333617A++
12.Grūda 2GR2141454.11004224.352975N+
13.Verseka 1VS124454.18035324.949422A++
14.Verseka 2VS2281354.31147524.815764A+
15.Šalčykščia 1SC110354.25596925.214581N
16.Šalčykščia 2SC218854.26688325.178094N+
17.Šalčia 1SL118254.31921925.403611U++
18.Šalčia 2SL212354.29191725.209867N+
19.Šalčia 3SL37454.29995025.202411N+
20.Šalčia 4SL43354.30485825.141147N+
21.BeržėBR41454.29888325.204058N++
22.Visinčia 1VN124354.32315025.507589A+
23.Visinčia 2VN212254.38605625.374642A+
24.Visinčia 3VN36154.37026425.271892N
25.Taurupis 1TR116754.28401424.850161A+
26.Taurupis 2TR220454.30064724.838781A+
27.Nevėžis 1NV110355.51153324.768736A++
28.Nevėžis 2NV217855.53381424.682608A++
29.Nevėžis 3NV324855.52726424.698569A++
30.Nevėžis 4NV424255.70028324.433556U+
31.Pienia 1PN1242355.51101924.771975A++
32.Pienia 2PN216155.43488124.928181U+
33.Širvinta 1SR118155.06215025.198025A++
34.Širvinta 2SR224355.02872525.008336N+
35.Siesartis 1ST124855.22711425.270822A+
36.Siesartis 2ST218455.29115824.893558N+
37.Siesartis 3ST36355.22687525.248489A+
38.Šešupė 1SP1201154.35686423.063047A++
39Šešupė 2SP2241854.40913323.225194U+
40.Šešupė 3SP3231754.41766423.250158N+
41.Kiauna 1KN1242455.30655025.88635N+
42.Kiauna 2KN2242455.29428325.898083N+
N—number of analyzed individuals per site; G—number of genets (genotypes); L—land cover type in the neighborhood of the stand (N—seminatural, A—agricultural, U—urbanized); M—riverbed modification status; H—availability of hydro-chemical and physical data.
Table 2. Sampling site genetic diversity parameters of Phragmites australis revealed using ISSR markers.
SitePLP, %RNaNeIHe
VR18144.510.3481.4451.3090.2560.174
VR27139.011.0001.3901.2410.2100.141
VR39552.200.4441.5221.3310.2840.191
MR15831.871.0001.3191.2040.1710.116
MR25530.220.8571.3021.2080.1710.117
MR33117.030.4291.1701.1090.0920.062
MR431.650.3331.0171.0130.0100.007
MR563.300.4551.0331.0200.0180.012
MR642.200.4001.0221.0180.0140.010
SK000.00011.0000.0000.000
GR131.650.1301.0171.0090.0080.005
GR26736.811.0001.3681.2620.2150.148
VS15731.320.1301.3131.2210.1890.130
VS27641.760.4441.4181.2850.2350.160
SC14826.370.2221.2631.1820.1530.104
SC26837.360.4121.3741.2660.2170.149
SL15128.020.0591.2801.1840.1530.103
SL263.300.1821.0331.0170.0170.011
SL33318.130.5001.1811.1280.1100.075
SL43519.231.0001.1921.1400.1140.078
BR5932.420.0751.3241.2130.1800.122
VN15027.470.0871.2751.1980.1620.111
VN221.100.0911.0111.0080.0070.005
VN3000.0000.0001.0000.0000.000
TR14223.080.4001.2311.1540.1290.088
TR23820.880.0531.2091.1480.1260.086
NV12111.540.2221.1151.0810.0670.046
NV27641.760.4381.4181.3040.2480.171
NV36133.520.3041.3351.2250.1930.131
NV44323.630.0431.2361.1670.1430.098
PN16032.970.9571.3301.2060.1770.119
PN2000.0000.0001.0000.0000.000
SR1000.0000.0001.0000.0000.000
SR24021.980.0871.2201.1550.1280.088
ST15731.320.3041.3131.2100.1780.121
ST23318.130.1761.1811.1260.1070.073
ST32513.740.2001.1371.1050.0830.058
SP15429.670.5261.2971.2010.1680.115
SP28043.960.7391.4401.2760.2360.160
SP38043.960.7271.4401.2910.2430.165
KN17943.411.0001.4341.2610.2280.153
KN29351.101.0001.5111.3020.2680.178
Average 143.8324.090.3991.1691.1610.1360.092
SE 14.482.460.0520.0550.0160.0140.009
Average 248.44726.620.4411.2661.1780.1500.102
SE 24.3002.360.0530.0240.0150.0130.009
PL—the number of polymorphic loci; P—the percentage of polymorphic loci; R—genotypic richness; Na—observed number of alleles; Ne—effective number of alleles’; I—Shannon’s information index; He—expected heterozygosity; SE—standard error; 1—all sites; 2—only multiclonal sites.
Table 3. Genetic diversity of Phragmites australis populations at ISSR loci.
PopulationPLP, %SamplesRNaNeIHe
TotalG
VR14780.7768380.5521.8081.4940.4300.288
MR13272.5370490.6961.7251.4580.3890.263
SK001210.0000.0001.0000.0000.000
GR9049.4538180.4591.4951.3580.2890.199
VS11362.0952170.3141.6211.4090.3400.231
SC11060.4428110.3701.6041.4120.3370.230
SL11965.3840130.3081.6541.4570.3720.254
BR5932.424140.0751.3241.2140.1800.122
VN9451.654260.1221.5171.3120.2770.185
TR7842.863690.2291.4291.2750.2350.158
NV13674.7375220.2841.7471.5000.4190.285
PN8345.6040240.5901.4561.2830.2410.162
SR6234.074240.0731.3411.2410.1990.136
ST11362.0948140.2771.6211.4200.3490.238
SP12970.8867460.6821.7091.4600.3890.263
KN11965.3848481.0001.6541.3930.3420.229
Average99.0054.4046.6920.250.3771.4821.3550.2990.203
SE9.255.084.164.090.0680.1050.0330.0280.019
PL—the number of polymorphic loci; P—the percentage of polymorphic loci; G—number of genets; R—genotypic richness; Na—observed number of alleles; Ne—effective number of alleles; I—Shannon’s information index; He—expected heterozygosity; SE—standard error.
Disclaimer/Publisher’s Note: The statements, opinions and data contained in all publications are solely those of the individual author(s) and contributor(s) and not of MDPI and/or the editor(s). MDPI and/or the editor(s) disclaim responsibility for any injury to people or property resulting from any ideas, methods, instructions or products referred to in the content.

