Article

Exploring the Genetic Diversity and Population Structure of Daphnia cucullata Sars, 1862 in Boreal Lakes (Latvian Lakeland) Based on Microsatellites

1
Laboratory of Hydroecology, Institute of Life Sciences and Technology, Daugavpils University, Parādes Str. 1A, LV-5401 Daugavpils, Latvia
2
Laboratory of Molecular Biology and Genetics, Institute of Life Sciences and Technology, Daugavpils University, Parādes Str. 1A, LV-5401 Daugavpils, Latvia
*
Author to whom correspondence should be addressed.
Diversity 2023, 15(11), 1128; https://doi.org/10.3390/d15111128
Submission received: 30 September 2023 / Revised: 26 October 2023 / Accepted: 30 October 2023 / Published: 31 October 2023
(This article belongs to the Special Issue Population Genetics of Animals and Plants)

Abstract

:
We have used Daphnia cucullata (Crustacea: Cladocera) as a model organism for the first time in the four deepest Latvian lakes from the Boreal biogeographical region in order to find the genetic diversity of these populations. During the research, we detected the most appropriate microsatellite markers for future genetic studies of Daphnia cucullata populations of lakes Svente, Riča, Dridzis and Geraņimovas-Ilzas in the Boreal biogeographical region. Based on these microsatellite markers, we determined the genetic diversity of these populations. The loci Dgm105 and Dgm101 had the maximum number of alleles and the maximum number of private alleles. The specific locus Dgm105 had five private alleles (62% of all detected alleles), and locus Dgm101 had four private alleles (57% of all detected alleles) in these loci. We determined the observed heterozygosity (Hobs) and the expected heterozygosity (Hexp) level (via Hardy–Weinberg equilibrium), the number of polymorphic loci, the number of detected alleles in each analyzed microsatellite locus, the average number of alleles at the locus (Na), the average effective number of alleles at the locus (Ne), the FST of the population’s genetic differentiation, the genetic distance (D) (following Nei) and the significance (χ2-test) of differences between the levels of observed and expected heterozygosity. It was shown that Daphnia cucullata populations from lakes with a low number of zooplankton taxa (Riča and Geraņimovas-Ilzas) have a higher genetic diversity compared to lakes with a high number of zooplankton taxa (Dridzis and Svente). It was found that Daphnia cucullata populations from lakes Dridzis and Svente have the least genetic distance, and these populations form a single genetic group, as confirmed via clustering.

1. Introduction

Zooplankton (e.g., Cladocera) plays an essential role in the transformation of substances and energy in water bodies and is an important stage in the food chain. Zooplankton representatives regulate bacterial and detrital quantity, and they are an important component of the feed for juvenile fish, adult plankton-feeding fish and many other aquatic animals [1,2,3,4]. Some Cladocera species, such as Daphnia magna, Daphnia pulex and Daphnia cucullata, are often used as bioindicators of water pollution and a good model organism of freshwater ecology. Research from Poland suggests that the body size of Daphnia cucullata seems to be a useful indicator of the ecological status of lakes [5,6,7,8,9,10,11]. Daphnia has been considered to be a control organism in freshwater as a kind of convergence model with adaptive features in radically different habitats [12,13]. To understand the adaptive processes in Daphnia populations under changing environmental conditions, investigations of the genetic structure of the population are necessary [14,15,16,17,18]. Cladocera are dominant in continental water bodies in all climatic zones, and also in lakes Svente, Riča, Dridzis and Geraņimovas-Ilzas of the Daugava River basin [19,20,21,22,23,24].
Microsatellite markers are useful for population genetics studies because they typically have a high allelic variation within and between populations, thus increasing the probability of distinguishing between populations and detecting changes over time [25]. Also, microsatellites are neutral markers (in the non-coding regions of the genome) and do not affect the fitness of the organism. This provides an opportunity to understand gene flow and to analyze the degree of connection among contemporary populations [26] or of populations through time from different waterbodies [27,28,29,30]. The microsatellite analysis method can be used to determine the genetic variability and genetic monitoring of populations of different Cladoceran species as well [14,27,31,32,33,34]. Microsatellite loci are frequently used in studies of the genetic structure of different species in the Daphnia genus (Daphnia pulex, Daphnia magna, Daphnia longispina, Daphnia galeata, Daphnia hyalina, Daphnia rosea, and Daphnia curvirostris) [14,15,27,30,31,35,36,37,38]. But there are relatively few studies investigating the genetic structure of Daphnia cucullata [14]. However, this study was in laboratory conditions.
Therefore, the aim of this study to describe for the first time the genetic structure of native Daphnia cucullata populations in the four deepest Latvian lakes of the Boreal zone using microsatellite markers.

2. Material and Methods

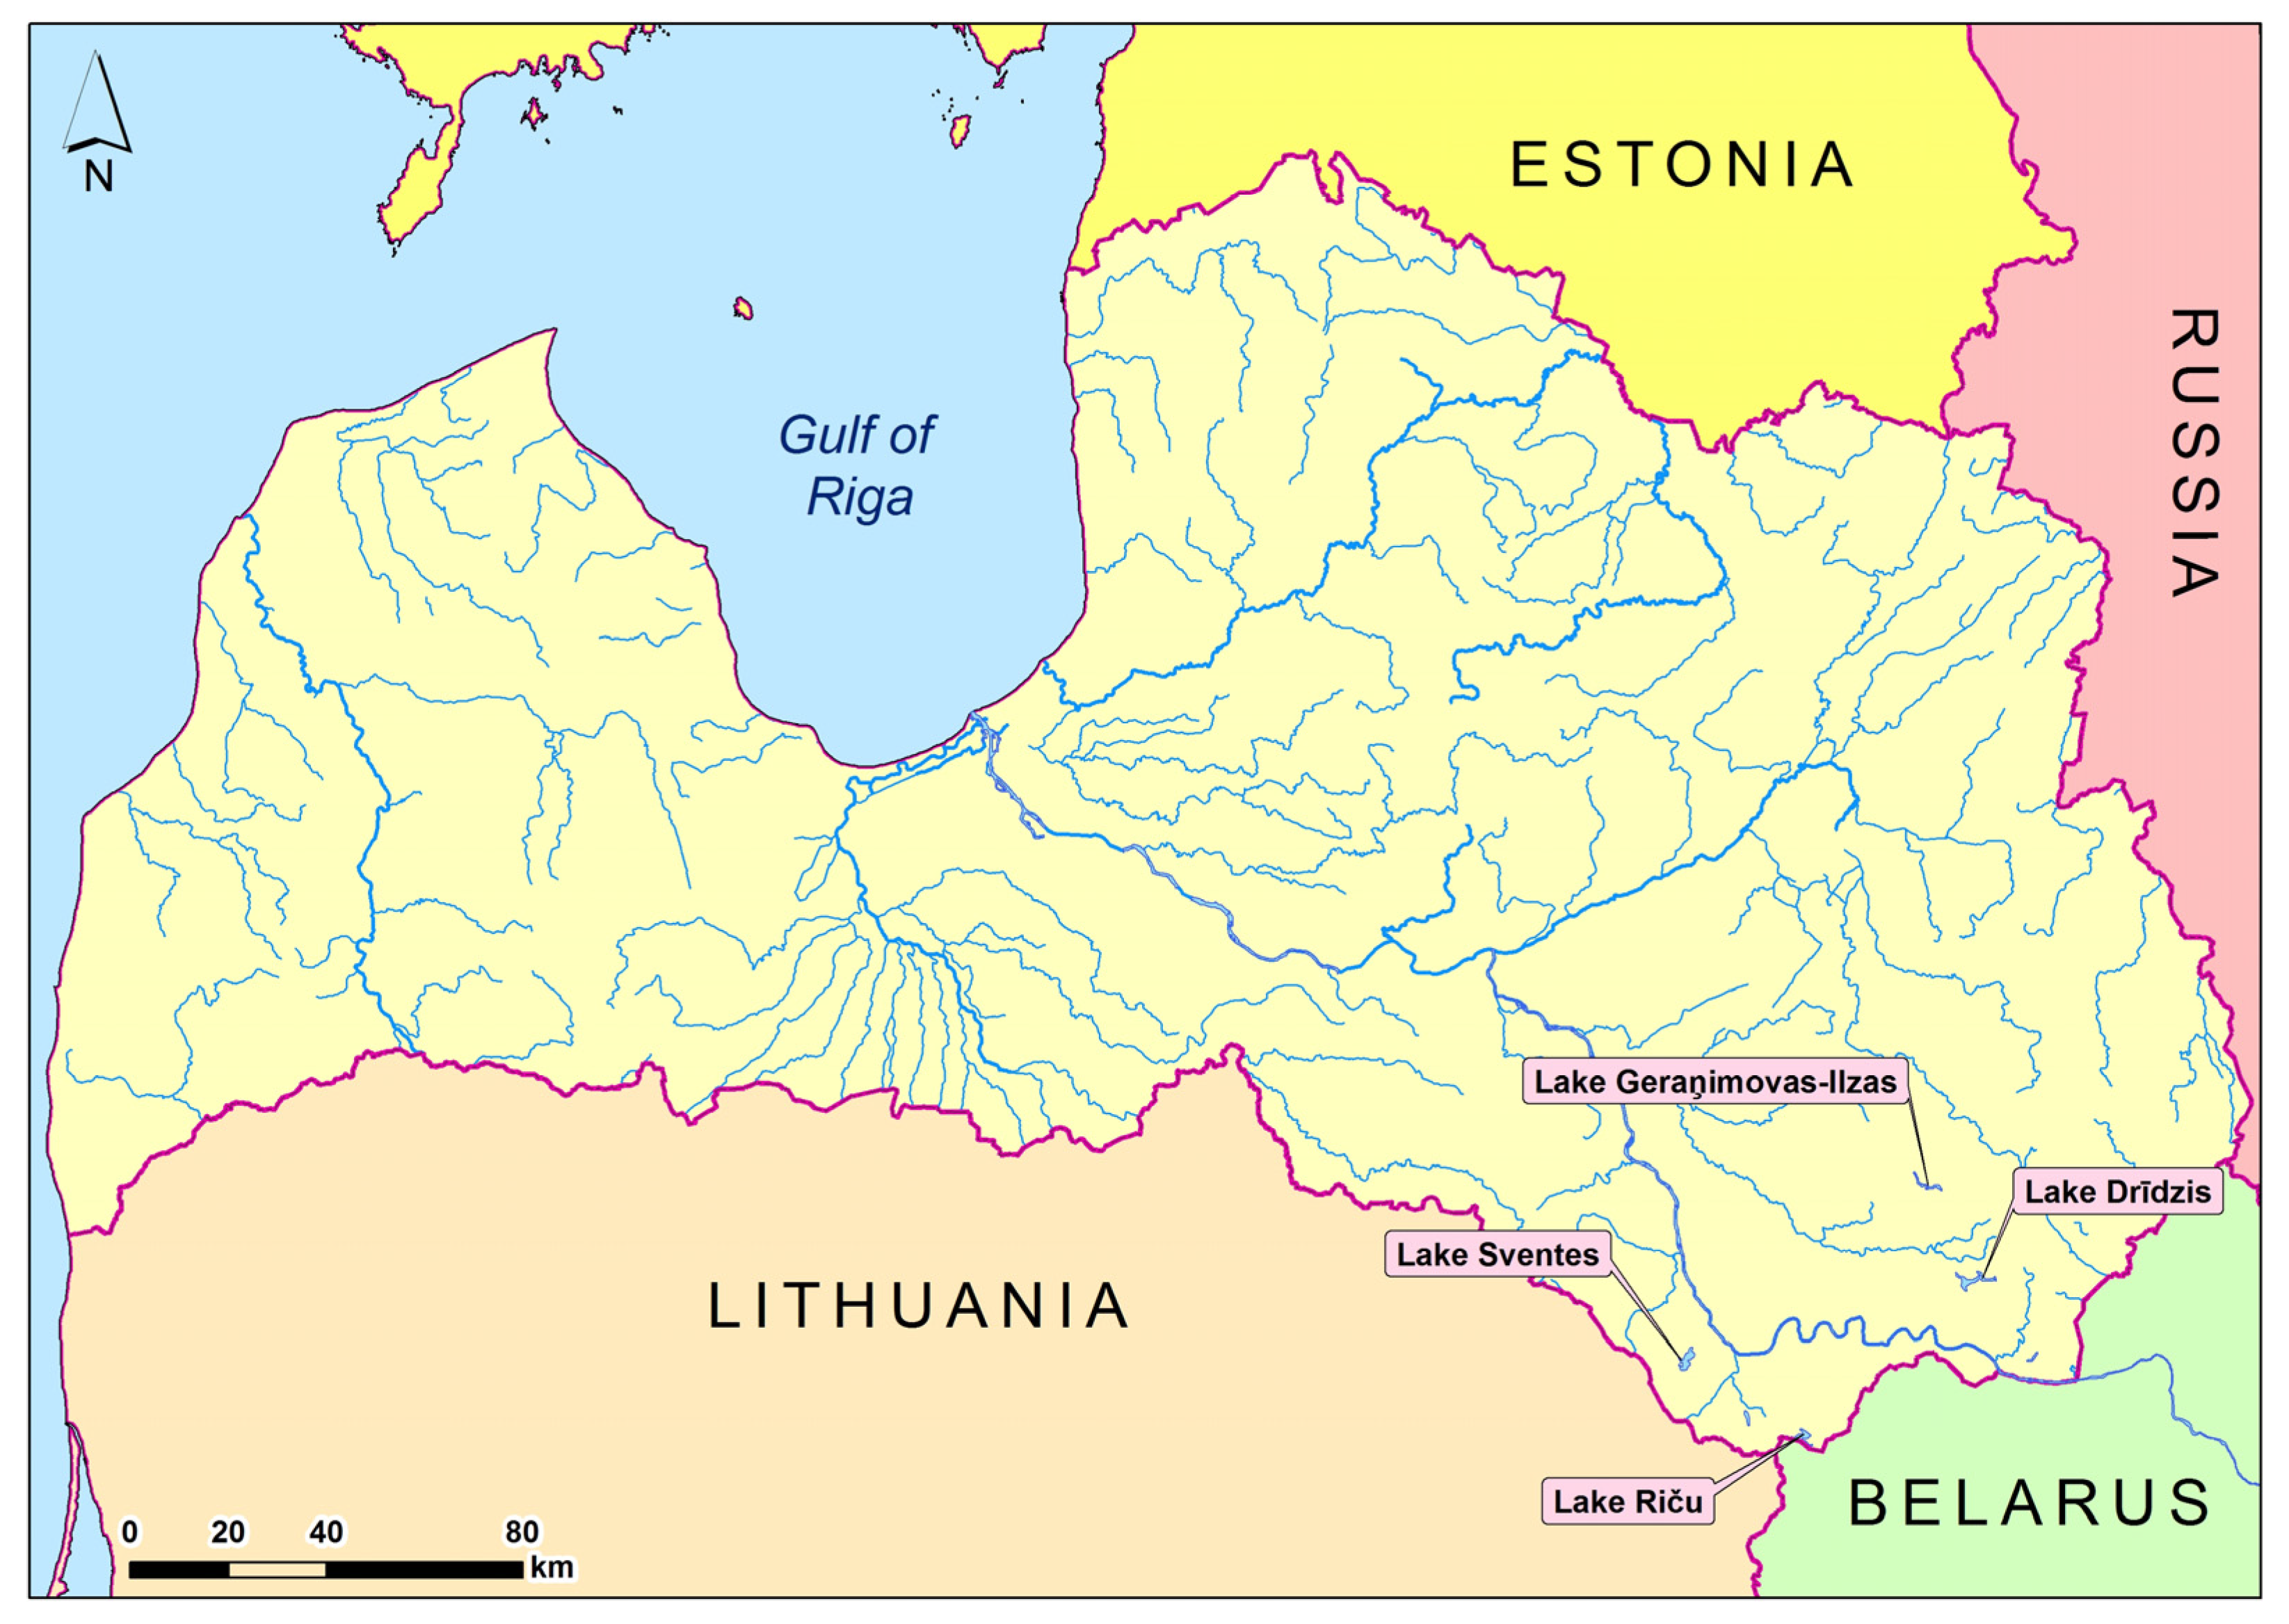
2.1. Sampling Sites and Material Collection of Daphnia cucullata

The material for our study was collected in four deep lakes, which belong to the deep, well-transparent mesotrophic and mesoeutrophic Latvian lakes of the Daugava River basin. Lakes Dridzis, Svente and Riča are mesotrophic, but Lake Geraņimovas-Ilzas is mesoeutrophic [39]. Samples were taken in the deepest zone in each lake.
These lakes are relatively similar in terms of their morphometric characteristics. Lake Dridzis is the deepest lake in Latvia and in Baltia [40]. Lake Geraņimovas-Ilzas is the fifth deepest, but Lake Svente is the tenth deepest lake in Latvia [40,41,42], and Lake Riča is the ninth deepest Lake in Latvia [43]. The investigated lake characteristics and locations are presented in Figure 1 and Table 1. Geographical data positions were obtained via echo sounders with GPS receiver LOWRANCE LMS-522C and TRIMBLE Juno SB.
Zooplankton samples were taken with a Hydro-bios Apstein-type plankton net with an opening–closing mechanism (mesh size: 64 µm) to filter the water column, which was taken from the deep water to the surface. The collection of the zooplankton samples was performed using the APHA standard methods procedure [44,45]. The collected samples were preserved immediately after collection through adding 98% ethanol to the water sample; hence, the final concentration in the sample is ±70%. Samples were stored at −20 °C. After splitting, the collected specimens of D. cucullata were stored in 96% ethanol. The samples had to be preserved immediately after harvesting to prevent individuals from biochemical and molecular degradation [17].

2.2. Genetic Analysis

2.2.1. DNA Extraction

Genomic DNA extraction from adult Daphnia cucullata individuals (20–30 specimens from each population) was performed using slightly modified ‘salting out’ extraction methodology earlier described by Fitzsimmons and Innes [46]. The method consists of the following steps: Zooplankton samples were transferred to 1.5 mL reaction tubes containing 100 μL of buffer A (100 mM Tris–HCl (pH 7.5), 100 mM ethylenediaminetetraacetic acid (EDTA), 100 mM NaCl and 0.5% SDS). Tubes were incubated at 70 °C for 35 min. Two hundred microliters of LiCl–KAc solution (one part 5 M KAc by volume with 2.5 parts 6 M LiCl) was added before tubes were incubated on ice for 15–20 min. Samples were spun at 13,700× g for 15 min. Supernatant was transferred into new tubes. One hundred and sixty microliters of cold (−20 °C) isopropanol was added, and the sample was mixed and then spun for 15 min. We aspirated away the supernatant via vacuum, spun, and then aspirated the remaining liquid. Samples were washed twice with cold (4 °C) 70% ethanol, being spun for 2 min before the supernatant was aspirated away each time. DNA was resuspended in 35 μL of double-distilled water and left at 4 °C overnight [46,47].

2.2.2. Determination of the Quantity and Quality of Isolated DNA

The concentration of DNA samples and quantity, quality and suitability for PCR were determined using the spectrophotometer BioSpec- Nano (Shimadzu, Japan). The dry DNA samples were dissolved in dd H2O for quantifying DNA. The ratio of absorbance at 260 and 280 nm (A260/280 > 1.8) and A260/230 were used to assess the purity of nucleic acids. The quality and suitability of the isolated DNA samples for PCR were checked on 1.5% agarose gel [17,47] with ethidium bromide.

2.2.3. Microsatellites Analysis

We used nine primers for the microsatellite loci of nuclear DNA (DaB10/15; Dp512; Dp519; DaB17/16; DaB17/17; SwiD1; Dgm101; Dgm105; Dgm109) [14] for genetic research on the Latvian Daphnia cucullata population, but six microsatellite primers with good representativity (SwiD1; Dgm105; Dgm101; DaB17/17; Dgm109; Dp519) were selected for the analysis. Three of them were dinucleotide microsatellite primers (SwiD1; Dgm101; Dp519), and two were trinucleotide microsatellite primers (Dgm105; Dgm109).
Microsatellite amplification was performed using the Eppendorf Mastercycler® proS (Eppendorf, Hamburg, Germany) automated polymerase chain reaction (PCR) system (Version 2.1, Free Software Foundation). PCR was performed in 10 µL for 0.2 mL PCR tubes. The PCR mixture components were 2.3 µL of genomic DNA sample (20 ng) in Dilution buffer (Thermo Fisher Scientific Baltics, Vilnius, Lithuania), 5 µL 2 × Phire Animal Tissue PCR Buffer (with dNTPs and MgCl2) (Thermo Fisher Scientific Baltics, Vilnius, Lithuania), 0.2 µL Phire Hot Start II DNA polimerase (Thermo Fisher Scientific Baltics, Vilnius, Lithuania), 1.25 µL–8 µmol/µL primers F, 1.25 µL–8 µmol/µL primers R. Primers were obtained with fluorescently-4-labeled TMR, HEX and FAM. PCR was performed using the thermal cycling program under the following amplification cycle: denaturation at 98 °C for 5 min and 40 cycles at 98 °C for 5 s (denaturation), X °C or 55 °C for 10 s (solicitation or primer annealing), 72 °C for 20 s (synthesis), 72 °C for 1 min and 4 °C (cooling). Amplification was repeated three times with each primer, including a positive and negative control. After the PCR amplification, the products were maintained at 4 °C until analytical separation using the automated sequencer GeneScan®Analysis ABI PRISM 3100 (Applied Biosystems, Foster City, CA, USA) as the international size standard.
Based on the obtained results, for future genetic diversity studies of D. cucullata populations, we selected only primers that provide high levels of good amplifications and informative DNA fragments.

2.2.4. Statistical Processing and Analysis of the Obtained Data

The obtained data were processed and analyzed using the computer software GeneAlex 6.41 [48] and POPGENE 1.32 [49]. The number of alleles per locus, the frequency, the private alleles in each population [50] Nei, 1987 and the observed (Hobs) and expected (Hexp) heterozygosity level in polymorphic loci (according to Hardy–Weinberg) [51] were measured, and their differences among Daphnia cucullata individuals from different sampling places were calculated, and their significance with χ2 criteria was calculated using GeneAlex 6.41 and POPGENE 1.32. The genetic relatedness of D. cucullata populations was estimated with genetic distance (D) [52]. Genetic differentiation among populations was estimated via principal component analysis (PCA) and pairwise FST values [50]. To estimate and visualizes the genetic structure and differentiation of the studied D. cucullata populations, STRUCTURE 2.3.4 [53] and STRUCTURE HARVESTER [54] were used.

3. Results

The size of the scored polymorphic DNA fragments ranged from 122 bp to 303 bp (Table 2). The highest number of base pairs were found in loci Dgm109 (250–303 bp) and Dgm105 (165–240 bp), but the lowest were in loci DaB17/17 (100–106 bp) and SwiD1 (122–127 bp) (Table 2).
The average level of polymorphism in all studied Daphnia cucullata populations was the same and amounted to 100%, because all six analyzed microsatellite loci were polymorphic in all studied D. cucullata populations. The number of polymorphic loci of D. cucullata populations in the lakes Svente, Riča, Dridzis and Geraņimovas-Ilzas ranged from 33% to 100%. The lowest number of polymorphic microsatellite loci of the D. cucullata population was found in the Lake Dridzis (33%), while the highest number of polymorphic microsatellite loci was found in the lakes Riča (100%) and Geraņimovas-Ilzas (83%) (Figure 2).
Analyzing the general parameters of the abundance of the obtained alleles (Table 3), it can be seen that the detected number of alleles in the investigated locus differs in each population. Also, the number of detected alleles in each analyzed microsatellite locus was different. The maximum number of alleles was found in the loci Dgm105 (eight alleles) and Dgm101 (seven alleles); moreover, it should be noted that the maximum number of private alleles was also found in these loci, where the Dgm105 locus had five private alleles (62% of all detected alleles), while the Dgm101 locus had four private alleles (57% of all detected alleles) in these loci (Table 3). On the other hand, the lowest number of alleles was found in locus Dp519 (two alleles). It is also characteristic that private alleles were not detected in this locus at all (Table 3).
Alleles in the investigated D. cucullata populations (Figure 3) show that the alleles’ abundance was different, but this difference is not statistically significant at (p > 0.05). The largest number of detected alleles per locus was for the D. cucullata population of Lake Geraņimovas-Ilzas (3.17), followed by the D. cucullata population of Lake Riča (3.00). The number of detected alleles per locus is relatively lower for the D. cucullata populations of lakes Dridzis (1.67) and Svente (1.83) (Figure 3).
The average number of alleles per locus with a frequency of more than 5% is equal to the average number of alleles per locus in all studied D. cucullata populations (Figure 3). The average number of rare alleles per loci of the D. cucullata specimens under research, which was found to be less than 50%, is the same for the populations of lakes Geraņimovas-Ilzas and Riča, respectively—it is 1—while for the D. cucullata populations of lakes Dridzis and Svente, respectively, it is 0.5; but, overall, these differences are not significant (p > 0.05) (Figure 3).
The number of average effective alleles per locus differs significantly from the average observed number of alleles in D. cucullata populations of lakes Riča and Svente (p < 0.05), while these differences are not significant for the D. cucullata populations of lakes Dridzis and Geraņimovas-Ilzas (p > 0.05) (Figure 3).
The average level of the observed heterozygosity (Ho) was high in all studied D. cucullata populations, ranging from 1.67 to 3.17. The minimum value of Ho was 1.67 in Lake Dridzis, and the maximum was 3.17 in Lake Geraņimovas-Ilzas. Meanwhile, the average level of the expected heterozygosity (He) ranged from 1.15 to 2.43. The minimum value of He was 1.15 in Lake Svente, and the maximum was 2.43 in Lake Geraņimovas-Ilzas. In general, in all D. cucullata populations under research, the average observed level and the average expected level of heterozygosity (according to Hardy–Weinberg) was different, but these differences were insignificant (p < 0.001) (Figure 3).
The analyzed loci (SwiD1; Dgm105; Dgm101; DaB17/17; Dgm109; Dp519) were polymorphic in the investigated D. cucullata populations, and the level of polymorphism was very high. Genetic diversity across the studied D. cucullata samples found in each studied loci and each location are presented in Table 4. The greatest number of alleles (19) was found at loci DaB17/17 and Dp519 in the population of Lake Riča, and the minimum number of alleles (1) at locus Dgm101 was found in the population of Lake Dridzis. It should be noted that no alleles were detected at loci Dgm101 and Dgm109 in the population of Lake Svente. Private alleles were found at the loci SwiD1, Dgm105, Dgm101, DaB17/17 and Dgm109.
A significant homozygote excess was observed in the D. cucullata population from Lake Dridzis at one locus, DaB17/17, p < 0.001; from Lake Riča at five loci (SwiD1, Dgm101, DaB17/17, Dgm109 and Dp519, p < 0.001); from Lake Svente at four loci (SwiD1 and Dgm105, p < 0.05; DaB17/17 and Dp519, p < 0.001) and from Lake Geraņimovas-Ilzas at three loci (SwiD1 and Dgm101, p < 0.01; DaB17/17, p < 0.001) (Table 5). Microsatellite locus DaB17/17 has maximal differentiation (p < 0.001) between the level of observed and expected heterozygosity in all investigated lakes. In addition, microsatellite loci SwiD1, Dgm101, Dgm109, Dp519 and DaB17/17 have maximal differentiation (p < 0.001) in Lake Riča (Table 5). It should be noted that microsatellite loci Dgm105, Dgm101, Dgm109 and Dp519 were monomorphic in Lake Dridzis. Whereas microsatellite loci Dgm101 and Dgm109 were monomorphic in Lake Svente, microsatellite locus Dp519 also was monomorphic in Lake Geraņimovas-Ilzas (Table 5).
The smallest genetic distance (D) [55] was observed between lakes Riča and Geraņimovas-Ilzas (0.16), while the greatest genetic distance was found between lakes Dridzis and Geraņimovas-Ilzas (0.70) and between lakes Geraņimovas-Ilzas and Svente (1.35) (Table 6).
By contrast, FST values for different D. cucullata populations under research ranged from 0.08 to 0.50. The highest values were between the D. cucullata populations of lakes Riča and Svente (0.50) and lakes Svente and Geraņimovas-Ilzas (0.49) (Table 6). The lowest FST values were between the D. cucullata populations of lakes Riča and Geraņimovas-Ilzas (0.08) (Table 6).
Principal component analysis (PCA), a graph of genetic structuring among four D. cucullata populations in lakes Svente, Riča, Dridzis and Geraņimovas-Ilzas, clearly showed the genetic structuring into different genetic groups (Figure 4). Stable groups of D. cucullata populations were formed between lakes Dridzis and Svente and between lakes Riča and Geraņimovas-Ilzas. In the principal component analysis plot, PC 1 and PC 2 explained 77.43% and 15.71% of the total genetic diversity. A similar result was obtained using Bayesian clustering analysis (STRUCTURE 2.3.4) [53] (Figure 5) and number of clusters of individuals using Evano et al.’s clustering approach (Figure 6).

4. Discussion

Daphnia cucullata is one of the most common specimens in the species composition of Lakeland (Latvia) in the Boreal biogeographical region of Europe [19,20,22,24,47,57]. The analysis of the genetic structure of a typical representative of the zooplankton, i.e., Daphnia, is important in terms of predicting the impact of anthropogenic and climatic factors both on zooplankton and aquatic ecosystems in general [14,27,31,32,33,34].
We used microsatellite loci, which are frequently used in studies of the genetic structure of other species in the Daphnia genus [14,27]. However, some primers that have been successfully used in the study of European populations have not been amplified in Latvian populations. For example, three of the microsatellite loci (DaB10/17; Dp512; DaB17/16), which were presented in D. cucullata populations from lakes in Switzerland and the Netherlands, did not appear in the D. cucullata population from these Latvian lakes. This may be indicated a significant difference between the genotypes of D. cucullata populations from Continental (Switzerland and Netherlands) and Boreal (Latvia) biogeographical regions in Europe.
The sizes of amplified loci in D. cucullata populations from Continental and Boreal (Latvia) regions were similar. A few microsatellite loci of D. cucullata populations in the Boreal region are generally slightly longer than those in the Continental region (for example, microsatellite loci Dgm105 (165–240 bp) and Dgm 109 (250–303 bp)). We assume that this can be explained by the fact that the samples of D. cucullata from the continental region were taken from cultured material in the laboratory, which was not exposed to the influence of various local and anthropogenic factors [14]. In our study, natural Daphnia populations were used directly from the lakes, and they had been regularly exposed to various anthropogenic factors, mainly to the impact of agriculture. Some relative differences between allele lengths among the D. cucullata populations in Boreal and Continental biogeographical regions in Europe most probably are the result of accidental genetic drift, but not of mutation [58].
The highest number of alleles was found in loci Dgm105 and Dgm101 (8 and 7); these loci also had the highest number of private alleles (62% and 57%) However, the number of alleles in loci Dgm105 and Dgm101 was much lower in D. cucullata populations in lakes in Switzerland and the Netherlands (2 and 3). These microsatellite loci can be considered the best to use in future studies of the genetic structure of D. cucullata populations in Latvia and maybe in Boreal biogeographical regions.
The number of alleles in loci DaB17/17 and Dgm109 was the same (4 and 5), but the number of alleles in locus Dp519 was lower compared to data from Switzerland and the Netherlands [14,27]. D. cucullata populations had the largest number of alleles per locus in lakes Geraņimovas-Ilzas and Riča (3.17 and 3.00, respectively), using microsatellites. The largest number of alleles was also in lakes Riča and Geraņimovas-Ilzas, and in Svente and Dridzis, using RAPD analysis [47]. The observed small differences between the allele lengths in the D. cucullata populations in the studied Latvian lakes and those found in Switzerland and the Netherlands are most likely the result of random genetic drift and not mutations [58]. It is possible that the increase in allelic diversity is influenced by various chemical compounds in the water. One of the main influencing factors may be different changes in temperature conditions in our studied lakes and lakes in Switzerland and the Netherlands [4,58,59,60,61]. The immigration of new individuals may introduce new genetic material and lead to the selection of closely related hybrids, which may lead to an increase in the frequency of “immigrant” alleles, thereby leading to an increase in genetic diversity in populations [47,62].
In our research, the highest level of genetic polymorphism in D. cucullata populations according to microsatellites in Lakeland (Latvia) of the Boreal region during the summer season was observed in lakes Riča (100%) and Geraņimovas-Ilzas (83%), and the lowest, in Lake Dridzis (33%). However, according to RAPD analysis, the highest level of genetic polymorphism was observed in lakes Dridzis (50%) and Geraņimovas-Ilzas (33%) [47]. The obtained results can probably be explained by the specificity of the selected nuclear DNA markers (RAPD and microsatellites).
Heterozygosity serves as an indicator of evolutionary potential and is important in determining population dynamics as well as population viability. A decrease in heterozygosity may lead to a decrease in adaptation in the population [6,34]. The average level of heterozygosity in the studied D. cucullata populations via microsatellites in lakes Svente, Riča, Dridzis and Geraņimovas-Ilzas was relatively high and ranges from 1.67 to 3.17. The average level of heterozygosity, based on RAPD analysis, in the studied D. cucullata populations in these lakes ranges from 0.18 to 0.20 [47]. However, a substantial difference between the observed and expected level of heterozygosity was found only in the locus SwiD1 in the D. cucullata population from Lake Geraņimovas-Ilzas (p < 0.01). In populations of D. cucullata that showed an extremely high level of heterozygosity, they were mostly hybrids, while morphological changes were not observed [6,63,64].
The data we obtained about the genetic distance and genetic differentiation of D. cucullata populations according to microsatellites in our studied lakes confirm our previous data about the genetic distance and genetic differentiation of D. cucullata populations via RAPD [47] and show that the studied populations of D. cucullata are different among themselves. In our study, the Bayesian and Evano clustering approaches showed that the populations of D. cucullata (Riča and Geraņimovas-Ilzas), which are relatively far from each other, form a separate genetic group. It is difficult to explain the fact that Daphnia populations in lakes that are distant from each other and are not connected to each other are the most similar. It has been assumed that migrating waterfowl can carry zooplankton ephippia up to 50 km per day when flying between feeding or roosting sites. The maximum distance that waterfowl can fly from one water body to another is 1500 km [65,66,67]. The distribution of Daphnia taxa coincides with the flight directions of migratory waterfowl [65]. A different spreading mechanism was shown in Bythotrephes (Cladocera), as their ephippia are less viable in the intestinal tract of birds than Daphnia lumholtzi [65]. Ephippia can also be carried by wind [68,69,70,71]. Ephippia can withstand harsh environmental conditions (freezing, desiccation), and in spring, under favorable conditions, young parthenogenetic females hatch from winter eggs [4,59,60,61,72,73,74].
The characteristics of Daphnia biology may influence the genetic diversity of populations. D. cucullata is a cyclic parthenogenic organism. Parthenogenetic reproduction continues until adverse weather conditions occur, when some eggs develop into males and others develop into haploid eggs that require fertilization [4,58,74]. Males appear when there is a high population density or a rapid depletion of nutrients. In this case, diploids produce winter eggs, or ephippia [15,26]. Depending on the relative importance of recombination and parthenogenetic reproduction, populations of D. cucullata will have different local diversity and genetic population structures [58,73]. The length of the clonal phase and the frequency of sexual reproduction appear also to be related to the size and permanency of the habitat [4,58,60,61,71,75,76,77,78,79,80]. In cyclic parthenogenetic zooplankton, large habitats will have a larger stock of resting eggs than smaller habitats and, hence, a higher recruitment of sexual eggs from the resting egg bank at the beginning of the growing season. The recruitment of sexual eggs from the resting egg bank will increase genetic diversity and, thus, have a profound impact on the genetic structure of cyclical parthenogenetic Daphnia populations [71,77,80,81].
A very interesting fact in our previous study [24] was found: lakes Riča and Geraņimovas-Ilzas have a low number of zooplankton taxa (47 and 43, respectively), but the lakes Dridzis and Svente have a large number of zooplankton taxa (72 and 69, respectively) [24]. In the present study, we found that D. cucullata populations from lakes Riča and Geraņimovas-Ilzas have a higher genetic diversity compared to populations from lakes Dridzis and Svente, with a large number of zooplankton taxa. Thus, a higher genetic diversity in populations was observed in lakes which have a low number of zooplankton taxa. A small number of taxa possibly affects the ecological existence niche of D. cucullata taxa. Since larger biotopes often contain more ecological niches than smaller ones, this may favor the coexistence of ecologically distinct genotypes, because in this case, D. cucullata has less interaction and competition with other taxa, it adapts more to different conditions, it interbreeds, etc. Therefore, it has more genetic diversity. It was shown that the number of sampled exemplars per population and the number of scored microsatellite DNA alleles are correlated with some of the population genetics parameters. The geographical distance between sampled populations may also have a strong positive effect on among-population diversity [76,77,78,80,82,83,84].
Thus, we used these microsatellite markers, especially Dgm105 and Dgm101, for the analysis of natural populations of D. cucullata in Latvian Lakeland in the Boreal region for the first time.
Our use of markers turned out to be very successful. Molecular genetic markers are widely used in population studies, and their utility depends on the degree of sequence variation. The nuclear and mitochondrial rRNA genes were the best possible genetic markers for molecular systematics, whereas the mitochondrial protein-coding and rRNA genes were suitable for molecular identification. Estimates derived from the dominantly inherited nuclear markers are very similar and may be directly comparable. Mitochondrial DNA (mtDNA) has been a marker for reconstructing the evolution patterns of populations, admixture, biogeography and speciation. Microsatellites have a higher mutation rate than others, leading to high genetic diversity because the microsatellites can be used to analyze rapid changes in the genetic structure of populations over a short period of time. We were able to detect subtle differences between populations that exist in hydrologically similar conditions of natural reservoirs with their help. Therefore, these microsatellites can be useful for larger-scale studies on the geographic ranges of D. cucullata in the Boreal region.

Author Contributions

Conceptualization, A.B. and N.Š.; methodology, A.B. and N.Š.; formal analysis, A.B. and N.Š.; investigation, A.B.; resources, A.B. and N.Š.; writing—original draft preparation, A.B. and N.Š.; writing—review and editing, all authors. All authors have read and agreed to the published version of the manuscript.

Funding

This research was partly supported by the projects ESF Project No. 8.2.2.0/20/I/003 “Strengthening of Professional Competence of Daugavpils University Academic Personnel of Strategic Specialization Branches 3rd Call” and ESF Project No. 2009/0214/1DP/1.1.1.2.0/09/APIA/VIAA/089 “Formation of Interdisciplinarity Research Group for Securing the Sustainibility of Salmonid Lakes in Latvia”.

Institutional Review Board Statement

Not applicable.

Informed Consent Statement

Not applicable.

Data Availability Statement

Data on zooplankton species diversity are publicly available in my publications in internationally peer-reviewed scientific journals. The genetic sequences should be uploaded to GenBank.

Acknowledgments

We thank Jana Paidere for their help in zooplankton sample collection.

Conflicts of Interest

The authors declare no conflict of interest.

References

  1. Hebert, P.D.N. Competition in zooplankton communities. Ann. Zool. Fenn. 1982, 19, 349–356. [Google Scholar]
  2. Malone, B.J.; McQueen, D.J. Horizontal patchiness in zooplankton populations in two Ontario kettle lakes. Hydrobiologia 1983, 99, 101–124. [Google Scholar] [CrossRef]
  3. Pinel-Alloul, B. Spatial heterogeneity as a multiscale characteristic of zooplankton community. Hydrobiologia 1995, 300, 17–42. [Google Scholar] [CrossRef]
  4. Wetzel, R.G. Limnology. In Lake and River Ecosystems, 3rd ed.; Academic Press: Cambridge, MA, USA, 2001; p. 1006. [Google Scholar]
  5. Karpowicz, M.; Sługock, Ł.; Kozłowska, J.; Ochocka, A.; López, C. Body size of Daphnia cucullata as an indicator of the ecological status of temperate lakes. Ecol. Indic. 2020, 117, 1–10. [Google Scholar] [CrossRef]
  6. Adamowicz, S.J.; Hebert, P.D.N.; Marinone, M.C. Species diversity and endemism in the Daphnia of Argentina: A genetic investigation. Zool. J. Linn. Soc. Lond. 2004, 140, 171–205. [Google Scholar] [CrossRef]
  7. Colbourne, J.K.; Hebert, P.D.N. The systematics of North American Daphnia (Crustacea: Anomopoda): A molecularphylogenetic approach. Philos. Trans. R. Soc. Lond. Ser. B 1996, 351, 349–360. [Google Scholar]
  8. Colbourne, J.K.; Wilson, C.C.; Hebert, P.D.N. The systematics of Australian Daphnia and Daphniopsis (Crustacea: Cladocera): A shared phylogenetic history transformed by habitat-specific rates of evolution. Biol. J. Linn. Soc. 2006, 89, 469–488. [Google Scholar] [CrossRef]
  9. Dussart, B.H.; Defaye, D. Introduction to the Copepoda. Guides to the Identification of the Microinvertebrates of the Continental Waters of the World, 2nd ed.; Backhuys Publishers: Leiden, The Netherlands, 2001; p. 344. [Google Scholar]
  10. Harris, K.D.M.; Bartlett, N.J.; Lloyd, V.K. Daphnia as an emerging epigenetic model organism. Genet. Res. Int. 2012, 2012, 147892. [Google Scholar] [CrossRef]
  11. Lampert, W. Daphnia: Model herbivore, predator and prey. Pol. J. Ecol. 2006, 54, 607–620. [Google Scholar]
  12. Colbourne, J.K.; Hebert, P.D.N.; Taylor, D.J. Evolutionary origins of phenotypic diversity in Daphnia. In Molecular Evolution and Adaptive Radiation; Givnish, T.J., Sytsma, K.J., Eds.; Cambridge University Press: London, UK, 1997; pp. 163–188. [Google Scholar]
  13. Dodson, S.I.; Hanazato, T. Commentary on effects of anthropogenic and natural organic-chemicals on development, swimming behavior and reproduction of Daphnia, a key member of aquatic ecosystems. Environ. Health Perspect. 1995, 103, 7–11. [Google Scholar]
  14. Brede, N.; Thielsch, A.; Sandrock, C.; Spaak, P.; Keller, B.; Streit, B.; Schwenk, K. Microsatellite markers for European Daphnia. Mol. Ecol. Notes 2006, 6, 536–539. [Google Scholar] [CrossRef]
  15. Cousyn, C.; De Meester, L.; Colbourne, J.K.; Brendonck, L.; Verschuren, D.; Volckaert, F. Rapid, local adaptation of zooplankton behavior to changes in predation pressure in the absence of neutral genetic changes. Proc. Natl. Acad. Sci. USA 2001, 98, 6256–6260. [Google Scholar] [CrossRef] [PubMed]
  16. De Meester, L.; Weider, L.J.; Tollrian, R. Alternative antipredator defences and genetic polymorphism in a pelagic predator-prey system. Nature 1995, 378, 483–485. [Google Scholar] [CrossRef]
  17. Harris, R.P.; Wiebe, P.H.; Lenz, J.; Skjoldal, H.R.; Huntley, M. Zooplankton Methodology Manual; Elsevier Academic Press: Cambridge, MA, USA, 2005; pp. 533–570. [Google Scholar]
  18. Hellsten, M.E.; Sundberg, P. Genetic variation in two sympatric European populations of Bosmina spp. (Cladocera) tested with RAPD markers. Hydrobiologia 2000, 421, 157–164. [Google Scholar] [CrossRef]
  19. Brakovska, A. Daphnia cucullata Sars, 1862 (CRUSTACEA: CLADOCERA) distribution and location in composition of zooplankton cenosis in Lake Dridzis. Acta Biol. Univ. Daugavp. 2014, 14, 1–19. [Google Scholar]
  20. Brakovska, A.; Škute, R. Ecological characterization of zooplankton groups in the deepest lakes of East Latvia. Acta Biol. Univ. Daugavp. 2007, 7, 165–174. [Google Scholar]
  21. Brakovska, A.; Škute, R. Ecological evaluation of zooplankton groups in Lake Geranimovas-Ilzas and Lake Garais. Proc. 7th Int. Sci. Pract. Conf. Environment. Technol. Resour. 2009, 2, 43–50. [Google Scholar] [CrossRef]
  22. Brakovska, A.; Škute, R.; Škute, A. Heterogeneity of distribution and community composition of zooplankton in upper layers of Lake Svente. Zool. Ecol. 2012, 22, 172–180. [Google Scholar] [CrossRef]
  23. Brakovska, A.; Škute, N. Optimisation of DNA extraction and RAPD-PCR amplification for population genetic analysis of Daphnia cucullata Sars, 1862 (Crustacea: Cladocera). Acta Biol. Univ. Daugavp. 2013, 13, 11–20. [Google Scholar]
  24. Brakovska, A.; Paidere, J.; Škute, A. Dynamics and factors influencing zooplankton in the lakes Svente, Riča, Dridzis and Geraņimovas-Ilzas (Eastern Latvia). Acta Biol. Univ. Daugavp. 2020, 20, 71–94. [Google Scholar]
  25. Selkoe, K.A.; Toonen, R.J. Microsatellites for ecologists: A practical guide to using and evaluating microsatellite markers. Ecol. Lett. 2006, 9, 615–629. [Google Scholar] [CrossRef] [PubMed]
  26. Haag, T.; Santos, A.S.; Sana, D.A.; Morato, R.G.; Cullen, L., Jr.; Crawshaw, P.G., Jr.; De Angelo, C.; Di Bitetti, M.S.; Salzano, F.M.; Eizirik, E. The effect of habitat fragmentation on the genetic structure of a top predator: Loss of diversity and high differentiation among remnant populations of Atlantic Forest jaguars (Panthera onca). Mol. Ecol. 2010, 22, 4906–4921. [Google Scholar] [CrossRef] [PubMed]
  27. Colbourne, J.K.; Robison, B.; Bogart, K.; Lynch, M. Five hundred and twenty-eight microsatellite markers for ecological genomic investigations using Daphnia. Mol. Ecol. Notes 2004, 4, 485–490. [Google Scholar] [CrossRef]
  28. Frisch, D.; Morton, P.K.; Roy Chowdhury, P.; Culver, B.W.; Colbourne, J.K.; Weider, L.J.; Jeyasingh, P.D. A millennial-scale chronicle of evolutionary responses to cultural eutrophication in Daphnia. Ecol. Lett. 2014, 17, 360–368. [Google Scholar] [CrossRef] [PubMed]
  29. Forest, F.; Chase, M.W.; Persson, C.; Crane, P.R.; Hawkins, J.A. The role of biotic and abiotic factors in evolution of ant dispersal in the milkwort family (polygalaceae). Evolution 2007, 61, 1675–1694. [Google Scholar] [CrossRef] [PubMed]
  30. Pálsson, S. Microsatellite variation in Daphnia pulex from both sides of the Baltic Sea. Mol. Ecol. 2000, 9, 1075–1088. [Google Scholar] [CrossRef]
  31. Ender, A.; Schwenk, K.; Stadler, T.; Streit, B.; Schierwater, B. RAPD identification of microsatellites in Daphnia. Mol. Ecol. 1996, 5, 437–441. [Google Scholar] [CrossRef]
  32. Fox, J.A. New microsatellite primers for Daphnia galeata mendotae. Mol. Ecol. Notes 2004, 4, 544–546. [Google Scholar] [CrossRef]
  33. Lynch, M.; Spitze, K. Evolutionary genetics of Daphnia. In Ecological Genetics; Real, L., Ed.; Princeton University Press: Princeton, NJ, USA, 1994; pp. 109–128. [Google Scholar]
  34. Schwenk, K.; Spaak, P. Evolutionary and ecological consequences of interspecific hybridization in cladocerans. Experientia 1995, 51, 465–481. [Google Scholar] [CrossRef]
  35. Lynch, M.; Pfrender, M.; Spitze, K.; Lehman, N.; Hicks, J.; Allen, D.; Latta, L.; Ottene, M.; Bogue, F.; Colbourne, J. The quantitative and molecular genetic architecture of a subdivided species. Evolution 1999, 53, 100–110. [Google Scholar] [CrossRef]
  36. Mergeay, J.; Verschuren, D.; De Meester, L. Cryptic invasion and dispersal of an American Daphnia in East Africa. Limnol. Ocean. 2005, 50, 1278–1283. [Google Scholar] [CrossRef]
  37. Silva, R.M.; Pereira, F.; Carneiro, J.; Sobral, O.; Ribeiro, R.; Amorim, A.; Soares, A.M.V.M.; Lopes, I. Microevolution in a Natural Population of Daphnia longispina Exposed to Acid Mine Drainage. In Interdisciplinary Studies on Environmental Chemistry—Biological Responses to Contaminants; Hamamura, N., Suzuki, S., Mendo, S., Barroso, C.M., Iwata, H., Tanabe, S., Eds.; Terrapub: Pozzuoli, Italy, 2010; pp. 213–218. [Google Scholar]
  38. Reid, V.A.; Carvalho, G.R.; George, D.G. Molecular genetic analysis of Daphnia in the English Lake District: Species identity, hybridisation and resting egg banks. Freshw. Biol. 2020, 44, 247–253. [Google Scholar] [CrossRef]
  39. Urtāne, L. Cladocera as types and trophic status indicators of Latvian Lakes. Thesis 1998, 168. Not published (In Latvian) [Google Scholar]
  40. Available online: https://www.ezeri.lv/database (accessed on 24 January 2023).
  41. Eipurs, I. Lake Geraņimovas-Ilzas. The Nature of Latvia. Riga Encycl. Latv. 1995, 2, 106. (In Latvian) [Google Scholar]
  42. Tidriķis, A. Lake Svente. In The Nature of Latvia; Riga, Publishing House: Riga, Latvia, 1998; Volume 5, p. 180. (In Latvian) [Google Scholar]
  43. Tidriķis, A. Lake Riču. In The Nature of Latvia; Riga, Publishing House: Riga, Latvia, 1997; Volume 4, pp. 243–244. (In Latvian) [Google Scholar]
  44. APHA. Standart Methods for the Examination of Waters and Wastewater, 21st ed.; American Public Health Association: Washington, DC, USA, 2005. [Google Scholar]
  45. Wetzel, R.G.; Likens, G.E. Limnological Analyses; Springer Science, Business Media: New York, NY, USA, 2000; p. 429. [Google Scholar]
  46. Fitzsimmons, J.M.; Innes, D.M. No evidence of Wolbachia among Great Lakes area populations of Daphnia pulex (Crustacea: Cladocera). J. Plankton Res. 2005, 27, 121–124. [Google Scholar] [CrossRef]
  47. Brakovska, A.; Paidere, J.; Škute, R.; Škute, N.; Škute, A. Occurrence of Cladocera and genetic diversity of Daphnia cucullata in pelagic zone of the Latvian salmonid lakes. Est. J. Ecol. 2013, 62, 244–264. [Google Scholar] [CrossRef]
  48. Peakall, R.; Smouse, P.E. GENALEX 6: Genetic analysis in Excel. Population genetic software for teaching and research. Mol. Ecol. Notes 2006, 6, 288–295. [Google Scholar] [CrossRef]
  49. Yeh, F.C.; Yang, R.C.; Boyle, T. Population Genetics Software, POPGENE 32-version 1.31: Microsoft Window-Based Freeware for Population Genetics Analysis; University of Alberta: Edmonton, AB, Canada, 1999.
  50. Nei, M. Molecular Evolutionary Genetics; Columbia University Press: New York, NY, USA, 1987; p. 512. [Google Scholar]
  51. Nei, M. Analysis of gene diversity in subdivided populations. Proc. Natl. Acad. Sci. USA 1973, 70, 3321–3323. [Google Scholar] [CrossRef]
  52. Nei, M.; Tajima, F.; Tateno, Y. Accurancy of estimated phylogenetic trees from molecular data. 2 Genefrequency data. J. Mol. Evol. 1983, 19, 153–170. [Google Scholar] [CrossRef]
  53. Hubisz, M.J.; Falush, D.; Stephens, M.; Pritchard, A.J. Interring weak population structure with the assistance of sample group information. Mol. Ecol. Resour. 2009, 9, 1322–1332. [Google Scholar] [CrossRef]
  54. Earl, D.A.; vonHoldt, B.M. STRUCTURE HARVESTER: A website and program for visualizing STRUCTURE output and implementing the Evanno method. Conserv. Genet. Resour. 2012, 4, 359–361. [Google Scholar] [CrossRef]
  55. Nei, M. Estimation of Average Heterozygosity and Genetic Distance from a small number of Individuals. Genetics 1978, 89, 583–590. [Google Scholar] [CrossRef] [PubMed]
  56. Evanno, G.; Regnaut, S.; Goudet, J. Detecting the number of clusters of individuals using the software STRUCTURE: A simulation study. Mol. Ecol. 2005, 14, 2611–2620. [Google Scholar] [CrossRef] [PubMed]
  57. Biogeographical Regions in Europe—European Environment Agency. Available online: europa.eu (accessed on 24 January 2023).
  58. De Meester, L.; Vanoverbeke, J.; De Gelas, K.; Ortells, R.; Spaak, P. Genetic structure of cyclic parthenogenetic zooplankton populations—A conceptual framework. Arch. Für Hydrobiol. 2006, 167, 217–244. [Google Scholar] [CrossRef]
  59. De Meester, L.; Gómez, A.; Simon, J.C. Evolutionary and ecological genetics of cyclical parthenogens. In Evolution from Molecules to Ecosystems; Moya, A., Font, E., Eds.; Oxford University Press: Oxford, UK, 2004; pp. 122–134. [Google Scholar]
  60. Kalff, J. Limnology: Inland Water Ecosystems; Prentice-Hall: Upper Saddle River, NJ, USA, 2002; p. 592. [Google Scholar]
  61. Lampert, W.; Sommer, U. Limnoecology: The Ecology of Lakes and Streams; Oxford University Press: New York, NY, USA; Oxford, UK, 1997; p. 382. [Google Scholar]
  62. Haag, C.R.; Riek, M.; Hottinger, J.W.; Pajunen, V.I.; Ebert, D. Genetic diversity and genetic differentiation in Daphnia metapopulations with subpopulations of known age. Genetics 2005, 170, 1809–1820. [Google Scholar] [CrossRef] [PubMed]
  63. Taylor, D.J.; Hebert, P.D.N. Habitat dependent hybrid parentage and differential introgression between neighboringly sympatric Daphnia species. Proc. Natl. Acad. Sci. USA 1993, 90, 7079–7083. [Google Scholar] [CrossRef]
  64. Taylor, D.J.; Hebert, P.D.N. A reappraisal of phenotypic variation in Daphnia galeata mendotae: The role of interspecific hybridization. Can. J. Fish. Aquat. Sci. 1993, 50, 2137–2146. [Google Scholar] [CrossRef]
  65. Green, A.J.; Figuerola, J. Recent advances in the study of longdistance dispersal of aquatic invertebrates via birds. Divers. Distrib. 2005, 11, 149–156. [Google Scholar] [CrossRef]
  66. Figuerola, J.; Green, A.J.; Santamaria, L. Passive internal transport of aquatic organisms by waterfowl in Doñana, south-west Spain. Glob. Ecol. Biogeogr. 2003, 12, 427–436. [Google Scholar] [CrossRef]
  67. Figuerola, J.; Green, A.J.; Michot, T.C. Invertebrate eggs can fly: Evidence of waterfowl-mediated gene flow in aquatic invertebrates. Am. Nat. 2005, 165, 274–280. [Google Scholar] [CrossRef]
  68. Hebert, P.D.N.; Moran, C. Enzyme variability in natural populations of Daphnia carinata King. Heredity 1980, 45, 313–321. [Google Scholar] [CrossRef] [PubMed]
  69. Crease, T.J.; Lynch, M.; Spitze, K. Hierarchical analysis of population genetic variation in mitochondrial and nuclear genes of Daphnia pulex. Mol. Biol. Evol. 1990, 7, 444–458. [Google Scholar] [PubMed]
  70. Gomez, A.; Carvalho, G.R. Sex, parthenogenesis and genetic structure of rotifers: Microsatellite analysis of contemporary and resting egg bank populations. Mol. Ecol. 2000, 9, 203–214. [Google Scholar] [CrossRef] [PubMed]
  71. Vanoverbeke, J.; De Meester, L. Among-populational genetic differentiation in the cyclical parthenogen Daphnia magna (Crustacea: Anomopoda) and its relation to geographic distance and clonal diversity. Hydrobiologia 1997, 126, 135–142. [Google Scholar] [CrossRef]
  72. Decaestecker, E.; De Meester, L.; Mergeay, J. Cyclical Parthenogenesis in Daphnia: Sexual Versus Asexual Reproduction. Lost Sex 2009, 295–316. [Google Scholar]
  73. Hughes, R.N. A Functional Biology of Clonal Animals; Chapman & Hall: London, UK; New York, NY, USA, 1989. [Google Scholar]
  74. Hobæk, A.; Larsson, P. Sex determination in Daphnia magna. Ecology 1990, 71, 2255–2268. [Google Scholar] [CrossRef]
  75. Hebert, P.D.N. Genetics of Daphnia. In Daphnia; Peters, R.H., De Bernardi, R., Eds.; Mem Inst Ital Idrobiol: Verbania Pallanza, Italia, 1987; Volume 45, pp. 439–460. [Google Scholar]
  76. De Meester, L. Local genetic differentiation and adaptation in freshwater zooplankton populations: Patterns and processes. Ecoscience 1996, 3, 385–399. [Google Scholar] [CrossRef]
  77. Vanoverbeke, J.; De Gelas, K.; De Meester, L. Habitat size and the genetic structure of a cyclical parthenogen, Daphnia magna. Heredity 2007, 98, 419–426. [Google Scholar] [CrossRef]
  78. Deng, H.W.; Lynch, M. Change of genetic architecture in response to sex. Genetics 1996, 143, 203–212. [Google Scholar] [CrossRef]
  79. Hairston, N.G.; Holtmeier, C.L.; Lampert, W.; Weider, L.J.; Post, D.M.; Fischer, J.M.; Cáceres, C.E.; Fox, J.A.; Gaedke, U. Natural selection for grazer resistance to toxic cyanobacteria: Evolution of phenotypic plasticity? Evolution 2001, 55, 2203–2214. [Google Scholar] [CrossRef]
  80. Lynch, M.; Deng, H.W. Genetic slippage in response to sex. Am. Nat. 1994, 144, 242–261. [Google Scholar] [CrossRef]
  81. Michels, E.; Audenaert, E.; Ortells, R.; De Meester, L. Population genetic structure of three pond-inhabiting Daphnia species on a regional scale (Flanders, Belgium). Freshw. Biol. 2003, 48, 1825–1839. [Google Scholar] [CrossRef]
  82. Spaak, P.; Denk, A.; Boersma, M.; Weider, L.J. Spatial and temporal patterns of sexual reproduction in a hybrid Daphnia species complex. J. Plankton Res. 2004, 26, 625–635. [Google Scholar] [CrossRef]
  83. Wolf, H.G. Interspecific hybridization between Daphnia hyalina, D. galeata and D. cucullata and seasonal abundances of these species and their hybrids. Hydrobiologia 1987, 145, 213–217. [Google Scholar] [CrossRef]
  84. Nybom, H. Comparison of different nuclear DNA markers for estimating intraspecific genetic diversity in plants. Mol. Ecol. 2004, 13, 1143–1155. [Google Scholar] [CrossRef]
Figure 1. Location of lakes Svente, Riča, Dridzis and Geraņimovas-Ilzas (map author: E. Iliško; a basemap was used from Open Sources).
Diversity 15 01128 g001
Figure 2. Portion of polymorphic loci of Daphnia cucullata populations in lakes Svente, Riča, Dridzis and Geraņimovas-Ilzas. GERANIM—Lake Geraņimovas-Ilzas.
Diversity 15 01128 g002
Figure 3. Allelic patterns across Daphnia cucullata populations between lakes Svente, Riča, Dridzis and Geraņimovas-Ilzas using microsatellites-PCR analysis (Na—the average number of alleles at the locus; Ne—the average effective number of alleles at the locus; Na ≥ 5%—average number of alleles with an incidence of more than 5%; No ≤ 50%—average number of alleles with an incidence of less than 50%; No—average number of private alleles; ± standard deviation).
Diversity 15 01128 g003
Figure 4. Principal component analysis (PCA). Plot of genetic structuring after Nei genetic distance data among Daphnia cucullata populations in lakes Svente, Riča, Dridzis and Geraņimovas-Ilzas.
Diversity 15 01128 g004
Figure 5. Bayesian clustering of individuals using STRUCTURE 2.3.4 [53] In the STRUCTURE analysis, color lines separate individuals from different sampling sites, and each individual is represented by a vertical line, which is partitioned into K-colored segments representing an individual’s estimated membership in K clusters (1—Dridzis, 2—Riča, 3—Svente, 4—Geraņimovas-Ilzas).
Diversity 15 01128 g005
Figure 6. The number of clusters of individuals using Evano et al.’s clustering approach [56], assuming two genetic clusters (K = 2; ∆K = 1.59; InP(K) ± SD = −298.76 ± 78.73).
Diversity 15 01128 g006
Table 1. Geographical, hydrological and morphological parameters of investigated lakes.
LakesCoordinates
X/Y
Elevation of Lakes above Sea Level, mSurface Area with Island, km2Surface Area without Island, km2Max. Depth, m *Mean Depth, m *Catchment Basin, km2Shore Length, km
Dridzis705,390.852/
208,462.077
159.87.727.566412.84642
Riča670,715.594/
175,721.067
145.813.1213.07399.7123 */130 **34
Svente647,412.511/
192,388.091
136.97.067.03387.82026
Geraņimovas-Ilzas696,251.015/
228,167.042
150.73.173.17469.86624
* Catchment basin in the territory of Latvia. ** Catchment basin in the territory of Belarus.
Table 2. Characteristics of the 9 microsatellites: locus name, primer sequences, repeat motif, modification, fragment size range and annealing temperature (Ta).
LocusPrimer Sequences (5′−3′)Repeat
Unit
Label DyeSize
Range
(bp)
(Our Data)
Size
Range
(bp)
(Data after Brede et al.)
T (°C)
SwiD1F:GCCGTGTTCGAAAGCTAGTC
R: AGCCGAACGAAAAACATGC
(TG)185’TAM122–127116–14259.4
Dgm105F:ATGTGAGCGCGCGAGCATTT
R:GTCCAGCCGGCCCATTTCAGTT
(CAG)8AG5’FAM165–240172–19759.4
Dgm101F: TCTTGCTCGAATTCTCTCC
R: CCTGTCTCACACGGAGC
(GA)10AGA5’HEX165–180162–17754.5
DaB17/17F:GAGAACCTTTTATCAGCTTCG
R:ACTCATCTGGTGAGATGGATC
T95’TAM100–106100–10955.9
Dgm109F: CCAGCTGTTGACCACCTG
R: TGCGCGAGGATTTCCAACAC
(ACC)7AC5’FAM250–303247–26658.2
Dp519F:AGTCGCGACGACATAAAGC
R:GTGGTAGTTGTGGAATCCG
(TG)6(GA)75’HEX140–142144–16056.7
DaB10/15F:AGAGAAGTGTTTGCGTTTC
R:TGTTTCCTATATCCCTCGG
TC65’TAMNo result75–8952.4
Dp512F:TTTCGTTCTACCCAGGGAAG
R:TTTGCTCGTCTGTGATAGGC
(TG)4…(GT)85’HEXNo result125–14157.3
DaB17/16F: AGGGAACGAGCGGCGATAAG
R:TCTTTGGCAGGCCACTGCCAAGG
GA105’FAMNo result189–19561.4
Table 3. Abundance of alleles in the studied microsatellite loci.
LocusTotal Number of Alleles in the LocusNumber of Private Alleles in the LocusProportion of Private Alleles (%)Number of Populations in Which Private Alleles Have Been Detected
SwiD151201
Dgm10585623
Dgm10174573
DaB17/1742502
Dgm10953602
Dp5192000
Table 4. Genetic diversity across studied Daphnia cucullata samples found in each studied locus and each studied lake.
Sample SwiD1Dgm105Dgm101DaB17/17Dgm109Dp519
DridzisN44114414
Na411211
No001000
Ho000000
He0.75000.1300
RičaN131212191119
Na245232
No112010
Ho00.250000
He0.140.510.680.460.310.1
SventeN48015016
Na340202
No020100
Ho00.250000
He0.620.3300.1200.37
Geranimovas-IlzasN7671468
Na254341
No021120
Ho00.17000.170
He0.240.740.730.360.680
Na, the average number in a locus; Ne, the average effective number of alleles in a locus; No, the average number of private alleles; Ho, observed heterozygosity; He, expected heterozygosity.
Table 5. Significance (χ2-test) of differences between the levels of observed and expected heterozygosity in studied Daphnia cucullata populations in lakes Svente, Riča, Dridzis and Geraņimovas-Ilzas.
Population/Microsatellite LociSwiD1Dgm105Dgm101DaB17/17Dgm109Dp519
DridzisnsMM***MM
Riča***ns************
Svente**M***M***
Geraņimovas-Ilzas**ns*****nsM
ns—not significant, M—monomorphic loci, * p < 0.05, ** p < 0.01, *** p < 0.001.
Table 6. Genetic distance (D) [55] and genetic differentiation (after FST values) among Daphnia cucullata populations between lakes Svente, Riča, Dridzis and Geraņimovas-Ilzas.
PopulationDridzisRičaSventeGeraņimovas-Ilzas
Dridzis 0.290.450.37
Riča0.56 0.500.08
Svente0.501.14 0.49
Geraņimovas-Ilzas0.700.161.35
genetic distance (D) values below diagonal; genetic differentiation (FST values) over diagonal.
Disclaimer/Publisher’s Note: The statements, opinions and data contained in all publications are solely those of the individual author(s) and contributor(s) and not of MDPI and/or the editor(s). MDPI and/or the editor(s) disclaim responsibility for any injury to people or property resulting from any ideas, methods, instructions or products referred to in the content.

