Article

Temporal Variation of Genetic Diversity in Rutilus rutilus Populations from Lithuania Using mtDNA Markers in the Context of Anthropogenic Activities

by
Dalius Butkauskas
*,
Ieva Ignatavičienė
,
Adomas Ragauskas
and
Vytautas Rakauskas
Nature Research Centre, Akademijos Str. 2, 08412 Vilnius, Lithuania
*
Author to whom correspondence should be addressed.
Diversity 2023, 15(11), 1113; https://doi.org/10.3390/d15111113
Submission received: 21 September 2023 / Revised: 23 October 2023 / Accepted: 24 October 2023 / Published: 26 October 2023
(This article belongs to the Special Issue Population Genetics of Animals and Plants)

Abstract

:
One of the most abundant fish species, Rutilus rutilus, is widely distributed in Lithuania and its potential to adapt to environmental changes attracted our interest. Unfortunately, it is not properly understood how anthropogenic activities can affect the genetic diversity within this species. We studied three populations of roaches (samples collected in the Neris and Žeimena rivers, and Lake Drūkšiai) over a period of five years (from 2017 to 2022) to determine genetic diversity using mtDNA D-loop and ATP6 genetic markers. Genetic diversity parameters, AMOVA analysis, haplotype network, and PCoA analysis revealed a greater genetic variability in roach samples collected in 2017, and the greatest differences were noticed in the population inhabiting Lake Drūkšiai, as compared with other samples studied over a five-year period. Differences in genetic diversity detected after a five-year period led us to the assumption that roach populations may be related to the effects of natural (changing climatic conditions) and anthropogenic (operating nuclear power plant) origin.

1. Introduction

The genetic variation and population genetic structure of species can be affected by many factors, such as climate change, natural barriers, migration behavior, or human activities [1]. For instance, the fragmentation of river networks by dams induces changes in fish communities, such as the loss of genetic diversity within populations, differentiation among populations [2], and reduction of the opportunity for migration [3]. Over the long term, anthropogenic structures have been shown to have a high impact on gene flow and genetic drift [4]. The fragmentation may isolate populations, reduce gene flow, and decrease genetic diversity through the processes of genetic drift, suggesting that there are strong anthropogenic influences on population genetic structure [5]. Similarly, other anthropogenic activities, such as rising temperatures of water, can change the freshwater ecosystem [6]. Power plants and industrial factories are major sources that increase water temperature. Cool water is withdrawn from streams, used for cooling generators or other machinery, and then returned to the stream at higher temperatures [7]. In general, water from cooling systems increases water temperature from 8 to 12 °C, which is enough to potentially impact aquatic life [8]. Water temperature has many direct and indirect effects on aquatic organisms, including physiological heat stress, water column stability, dissolved oxygen concentrations, and nutrient dynamics [9]. The response of organisms to anthropogenic impacts can reduce biological processes such as growth, development, and reproduction [10], and they commonly result in changing genetic variation [11]. However, previous reports showed that some natural populations can rapidly adapt to environmental changes [12,13,14,15].
Fish are among the taxonomic groups of aquatic organisms that are most vulnerable to hydrologic alteration because they need larger water volumes, have lower abundance, and have a longer generation time than macroinvertebrates or algae [16]. Rutilus rutilus, also known as the common roach, belongs to the Cyprinidae family [17]. They are widely distributed throughout Europe [18] and can be found in various Lithuanian water bodies [19]. Their spread is dependent on hydrological changes such as weirs or dams that create large extensions of habitat [20]. Roaches are adapted to various types of habitats, from freshwater ponds smaller than 0.01 km2 to large water areas such as the Baltic Sea coast. R. rutilus tolerates organic pollution and is one of the last species to disappear from polluted waters [21]. They can survive in temperatures from close to freezing 4 °C (39 °F) up to around 31 °C (88 °F) [20]. Due to its low economic value, this species does not receive much attention. Therefore, little is known about their genetic diversity and how they respond to anthropogenic impacts. Only a few studies have investigated the genetic diversity in R. rutilus using AFLP [22], microsatellite [23] markers, or the mitochondrial cytochrome b gene fragment [24].
In this study, we used two mitochondrial regions including D-loop and ATP6 gene fragment to investigate the genetic diversity and differentiation among three geographically separated populations of R. rutilus over a five-year period. Our attention was drawn to Drūkšiai Lake, the largest freshwater lake in Lithuania, located in the northeastern part of Lithuania and partly in the Vitebsk Voblast in Belarus. Water from the lake was used to cool the reactors of the Ignalina Nuclear Power Plant (NPP) [25]. Research into genetic diversity in the roaches inhabiting Lake Drūkšiai and other water bodies distributed in the same geographic region of Lithuania—focusing on the changes in the genetic structure of the population of this fish species over a five-year period dependent on the anthropogenic impact or climatic changes—was the main goal of this study aimed at establishing the basis for future genetic monitoring of selected fish species.

2. Materials and Methods

2.1. Sampling, DNA Extraction

A total of 84 individuals of R. rutilus (average 51.6 ± 6.7 g) were collected from 3 different locations in Lithuania (Figure 1) using the appropriate permit issued by the State Fish Monitoring Program. All fish specimens were caught by net and transferred to the Laboratory of Molecular Ecology, Nature Research Centre (Vilnius, Lithuania). Fish age (average 4 ± 1 years) was determined from scales [26]. All fish specimens (Table 1) were stored at −20 °C prior to DNA extraction. Total genomic DNA was extracted from frozen muscle tissues following the universal and rapid salt-extraction method [27]. The quality and quantity of genomic DNA extracted were assessed using the “NanoPhotometer P330” (IMPLEN, Munich, Germany). Total DNA obtained was analyzed on 1.5% agarose gel in 1X Tris-acetate-EDTA (TAE) buffer using Thermo Scientific Gene-Ruler DNA ladder (Thermo Fisher Scientific, Vilnius, Lithuania) and visualized by ethidium bromide staining. DNA extracts were frozen at −20 °C until further use.

2.2. PCR Conditions and Sequencing

Amplifications were performed with the help of the following polymerase chain reactions (PCRs) protocol presented in Table S1. PCR was performed in 10 µL of final solution volume containing 2 µL of DNA (50 ng/µL), 1 μL of forward and 1 μL of reverse primer (10 μM), 5 µL of DreamTaq DNA polymerase mix (Thermo Fisher Scientific Baltics, Vilnius, Lithuania), and 1 µL of nuclease-free water in an Eppendorf Mastercycler thermocycler. The amplified products were analyzed by electrophoresis in 1.5% agarose gel in 1X Tris-acetate-EDTA (TAE) buffer using a Thermo Scientific Gene-Ruler DNA ladder (Thermo Fisher Scientific, Vilnius, Lithuania) and visualized by ethidium bromide staining. The PCR products were purified with exonuclease I and FastAP Thermosensitive Alkaline Phosphatase (Thermo Fisher Scientific Baltics, Vilnius, Lithuania) and then sequenced using 3500 Genetic Analyser (Applied Biosystems, Waltham, MA, USA).

2.3. Molecular Data Analysis

Sequenced mtDNA fragments were aligned using the MUSCLE [28] option in the MEGA-X program [29]. The number of haplotypes (h), unique haplotypes (h’), haplotype diversity (Hd), nucleotide diversity (π), the average number of haplotype differences (K), and variable sites (S) were calculated by means of DnaSP 4.2 software [30] based on the mtDNA D-loop, ATP6 partial gene, and ATP6-D-loop sequences. The median-joining haplotype networks were constructed using Network 4.6 software [31]. The analysis of molecular variance (AMOVA), population differentiation (PhiPT) assessed with 1000 permutations, and principal coordinates analysis (PCoA) of genetic variation were performed using GenAlEx software (Ver. 6.50) [32]. Fu’s Fs [33] and Tajima’s D [34] neutrality tests were performed with the help of Arlequin v3.5 software [35]. Statistical significance was calculated by performing 1000 random permutations.

3. Results

3.1. Sequence Variation and Genetic Diversity

A total of 84 R. rutilus specimens, collected from three different locations in 2017 and in 2022, were successfully sequenced determining 466 bp of the mtDNA partial D-loop sequence and 460 bp of the ATP6 gene fragment. The highest values of h, h’, S, π, and K parameters were observed in the D17 population (h = 10, h’ = 6, S = 8; Pi = 0.0038, K = 1.8011), whereas the lowest ones were detected in Z22 population (h = 4, h’ = 2, S = 6; Hd = 0.4416, π =0.0010, K = 0.4833) (Table 2). For the ATP6 partial gene sequences, the results of the genetic diversity showed a lower haplotype diversity and nucleotide diversity (Hd = 0.3207; π = 0.0008) as compared with D-loop sequences (Hd = 0.7938; π = 0.0033). The average number of haplotype differences was lowest in Z17 (K = 0.1666) and highest in N17 (K = 0.5090). The highest number of unique haplotypes was detected in the D17 population (h’ = 4), whereas only one unique haplotype was found in the N17, Z17, and Z22 populations. By combining sequences of the ATP6 partial gene and the D-loop region, most populations exhibited a relatively high haplotype diversity (0.6476–0.9142) due to the large number of unique haplotypes. However, nucleotide diversity was relatively low, ranging from 0.0011 in the Z22 population to 0.0024 in the D17 and Z17 populations. Overall, the results showed a decrease in values of genetic diversity over a five-year period in each population studied.
Based on D-loop sequences, the neutrality test showed mostly negative and non-significant values of the Tajima’s D test (D = −0.6334, p > 0.1; Table 3), and significantly negative values of Fu’s Fs test were obtained in the D17, D22, N17, N22, and Z22 populations. Similarly, negative values of neutrality tests were obtained in most populations using ATP6 partial gene sequences. Significant values of Tajima’s D and Fu’s Fs tests were detected in the D17 (Tajima’s D = −1.8612, Fu’s Fs = −3.5705, p < 0.05) and Z22 (Tajima’s D = −1.4905, Fu’s Fs = −1.5463, p < 0.05) populations, suggesting the effects of either positive selection or population expansion in D17 and Z22. Based on the concatenated ATP6 partial gene and D-loop region sequences, non-significant values of Tajima’s D and significantly negative values of Fu’s Fs were obtained for most populations studied, indicating a departure from neutrality. Additionally, both neutrality tests showed significantly negative values in Z22 (Tajima’s D = −1.8487, Fu’s Fs = −2.6661, p < 0.05), suggesting the largest population expansion.

3.2. Haplotype Network Analysis

The D-loop haplotype network was constructed based on sequences of roaches collected in 2017, which displayed two common haplotypes (HD_5 and HD_8) separated by a single mutational step (Figure 2A). The common haplotype HD_5 was detected in 11 (26.2%) individuals from all three different locations, and HD_8 was found in 10 individuals (23.8%) from two locations (the Žeimena River and Lake Drūkšiai). Five years later, however, the number of detected haplotypes decreased in Lake Drūkšiai and the Neris River, but it remained unchanged in the Žeimena River (Figure 2B). A total of 15 variable sites were identified, and 26 haplotypes—based on mtDNA D-loop region sequences of the roaches from three locations (the Žeimena and Neris rivers and Drūkšiai Lake) collected in 2017 and 2022—were defined (Figure S1). The haplotype HD_5 was the core haplotype in roaches and appeared in 33 (39.3%) individuals representing all populations studied, including 2 individuals of D17, 4 of D22, 4 of N17, 7 of N22, 5 of Z17, and 11 of Z22. The second most abundant haplotype, HD_8, was detected in 10 individuals (11.9%) representing only the D17 and N17 populations collected in 2017. The lowest numbers of haplotypes and unique haplotypes were detected in the Z17 and Z22 (h = 4; h’ = 2) populations. The largest numbers of haplotypes and unique haplotypes were observed in D17 (h = 10; h’ = 6). Analyzing the haplotype networks of the roaches collected in 2017 and 2022 in each location, the results showed a classic star-like pattern with HD_5 as a center haplotype in the Neris and Žeimena rivers (Figure S2). In the case of Lake Drūkšiai, based on the mtDNA D-loop region sequences, fifteen different haplotypes, with two shared haplotypes among the 2017 and 2022 samples (HD_5 and HD_6), were detected. Eight unique haplotypes were observed in the D17 population and five in the D22 population.
The haplotype network was constructed based on sequences of the roaches collected in 2017 (Figure 3A). The results showed seven unique haplotypes, four of which belonged to the D17 population (Figure 3A). Five years later, two haplotypes (HA_3 and HA_6) were observed in all locations studied, and only one singleton was detected in Z22 (Figure 3B). Based on ATP6 partial gene sequences, only eight variable sites were identified, and 9 haplotypes were defined among all of the 84 roach specimens studied (Figure S3). The haplotype network showed a star-like pattern with the main haplotype HA_3 identified in 69 (82.1%) individuals from all the populations studied. The largest number of haplotypes was also detected in D17 (h = 5) with four unique singletons. Classic star-like haplotype networks were observed in all studied locations (Figure S4). The haplotype network of Lake Drūkšiai and the Žeimena River displayed one common haplotype (HA_3), while two common haplotypes (HA_3 and HA_6) among the samples collected in 2017 and 2022 were detected in the Neris River.
Comparing the haplotype networks constructed based on sequences of the concatenated ATP6 partial gene and the D-loop region of the roaches collected in 2017 and 2022, a similar trend was observed; the number of unique haplotypes is significantly larger in 2017 than that in 2022, especially in Lake Drūkšiai (Figure 4). Overall, 26 variable sites were identified, with 6 shared haplotypes from 84 individuals of roaches (Figure S5). The haplotype HC_5 was detected in 24 out of 84 (28.6%) individuals distributed among all the populations studied. The second most common haplotype, HC_19, was detected in the Neris (2017 and 2022) and Žeimena (2022) rivers. Four other haplotypes occurred in two locations, and another 29 haplotypes were unique to specific localities. Similarly, in the case of the D-loop and the ATP6 partial gene sequences, the largest number of haplotypes and unique haplotypes were detected in D17 (h = 12; h’ = 8). It should be noted that the third most common haplotype, HC_8, found that distributed with 77.78% and 22.22% frequency among the roach samples collected in 2017 representing Lake Drūkšiai and the Neris River populations, respectively, was not detected in these populations in 2022. The other two haplotypes (HC_19 and HC_25) were found only in two river populations in 2022. Haplotype networks of the R. rutilus collected in 2017 and 2022 displayed star-like haplotype networks with the main haplotype HC_5 in the Neris and Žeimena Rivers, whereas two common haplotypes (HC_5 and HC_6) were detected in Lake Drūkšiai (Figure S6).

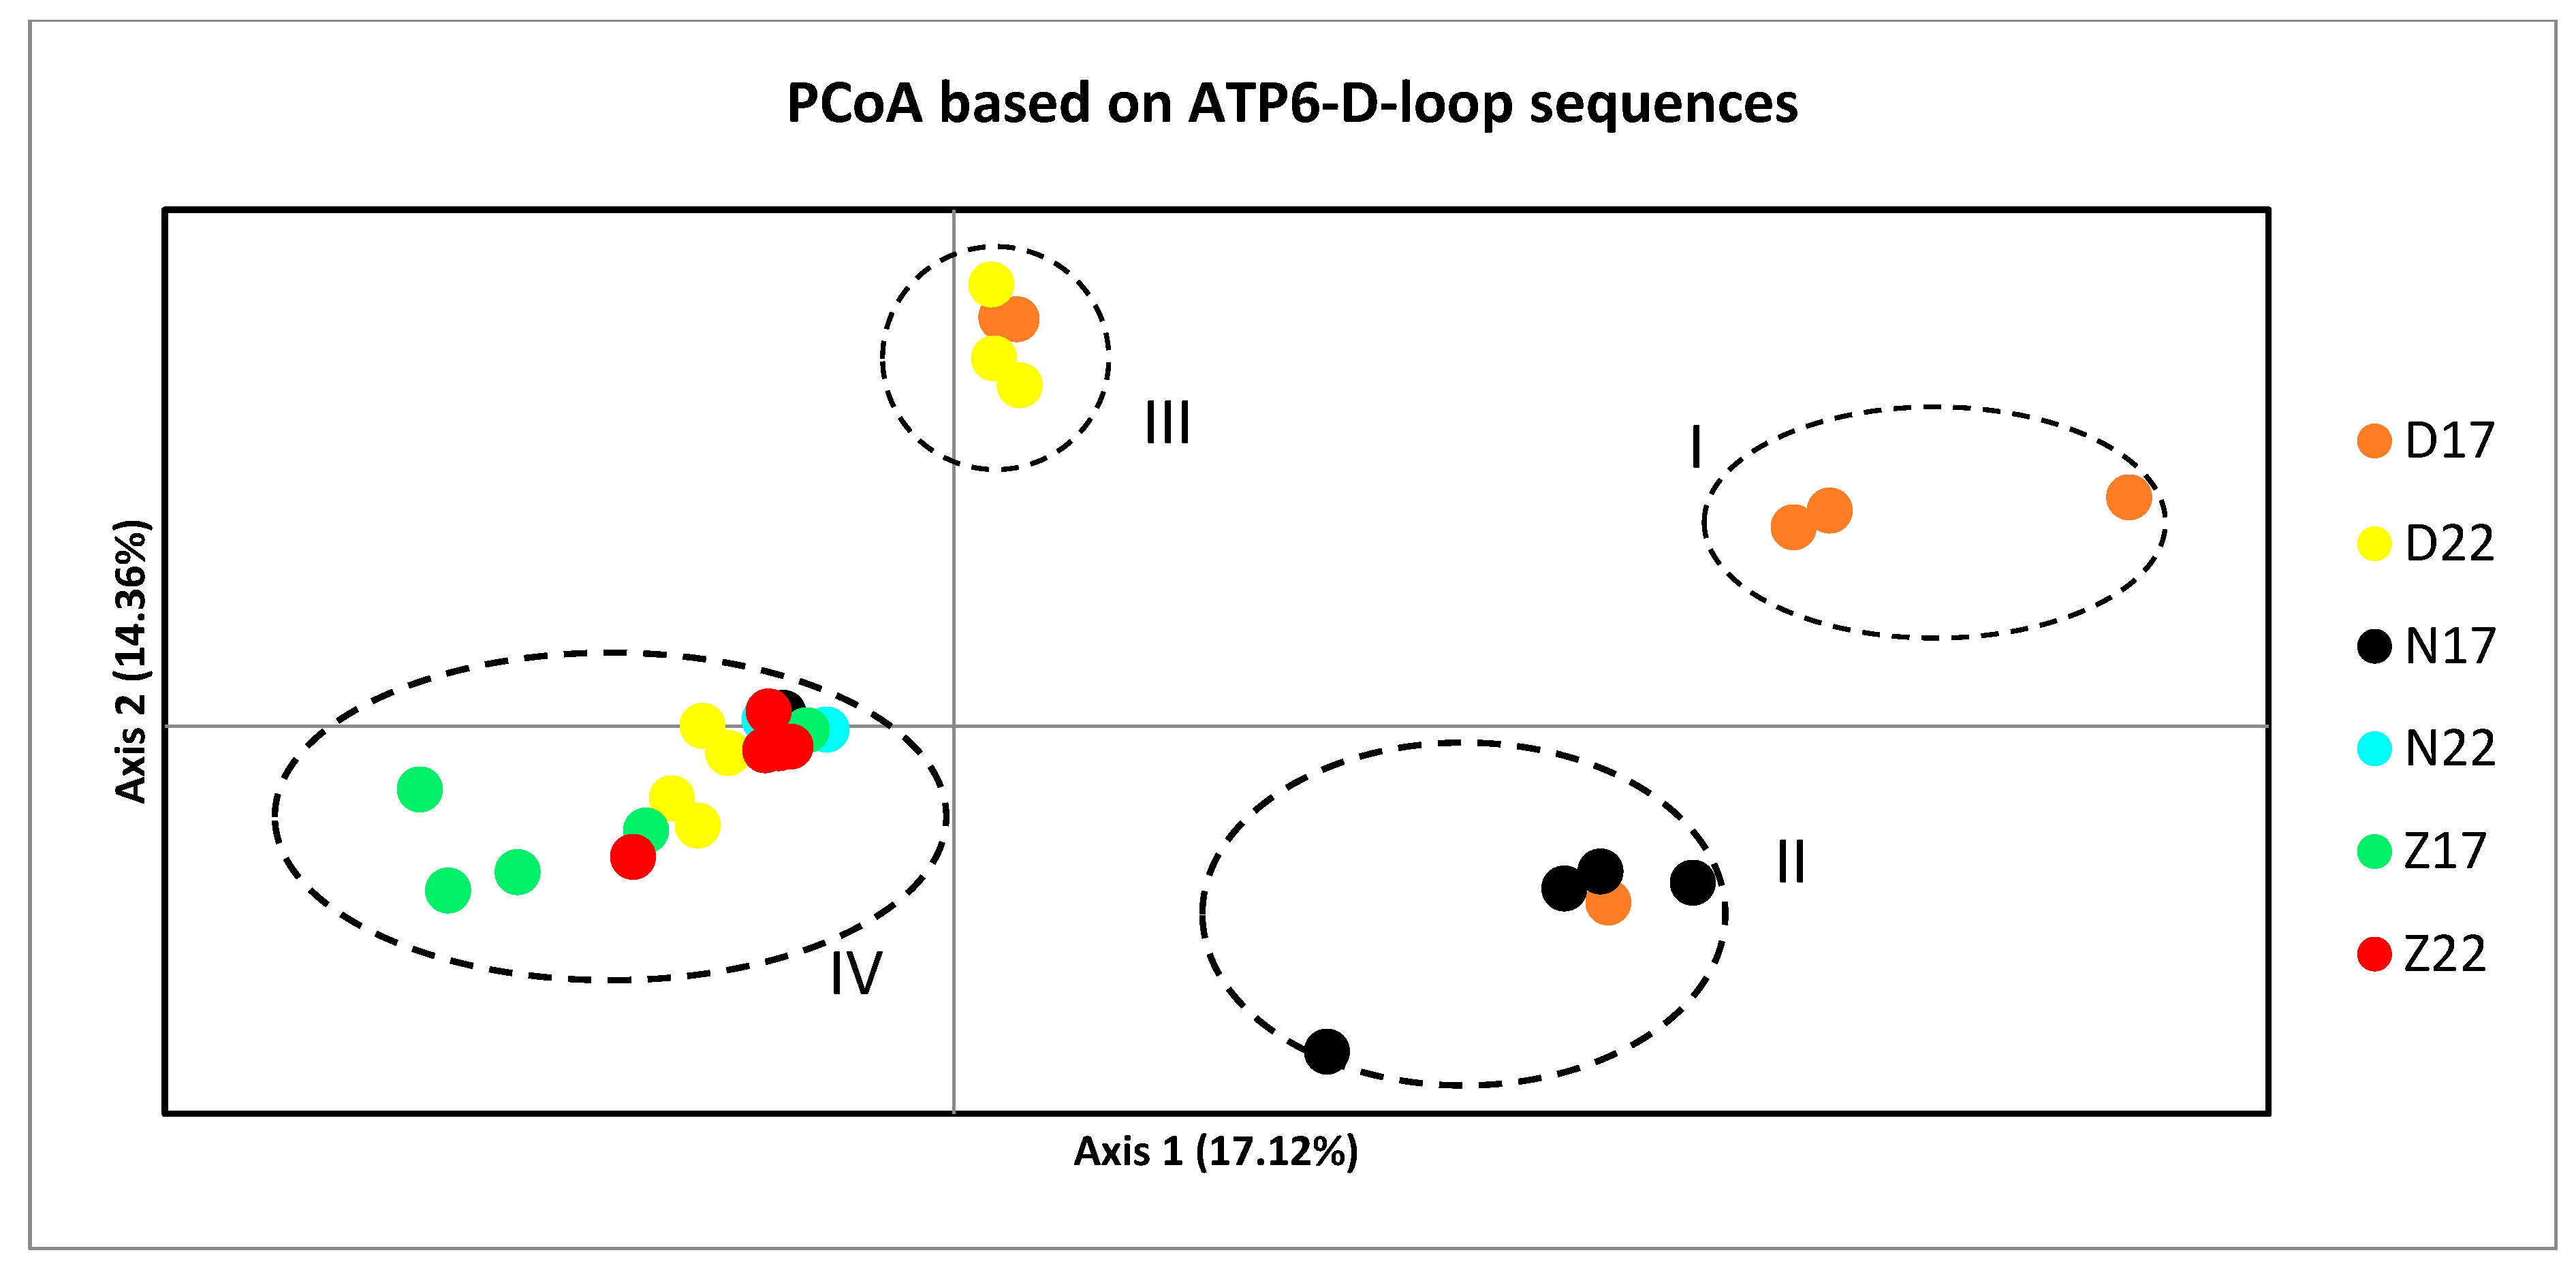
3.3. Population Genetic Structure

Molecular variance parameters (AMOVA results) were calculated based on mtDNA D-loop region sequences among six hypothetical populations of roaches (Table 3). The results of AMOVA showed significant differentiation (p < 0.001), with 82% of molecular differences within the populations and 18% of the molecular differences among the populations. A significant differentiation was also observed among populations studied at a group level based on year and population (Table S2). The highest level of genetic differentiation among populations (21%) was detected in Lake Drūkšiai over a period of five years. Based on ATP6 partial gene sequences, the AMOVA results revealed that most of the genetic variation observed could be attributed to differences within the populations (98%) rather than to the variation among the populations (2%). The PhiPT values were not significant, and lower than those when D-loop sequences were used. The genetic variation among the populations was not detected in 2022 (0%), while only 2% of genetic variation among the populations was observed in 2017. The highest level of genetic variation between years was detected in Lake Drūkšiai (3%) compared with that in other locations. The AMOVA results were obtained using concatenated ATP6 partial gene and D-loop region sequences with 82% of the molecular differences within the populations studied, and a significant genetic differentiation among populations studied was observed (PhiPT = 0.177, p < 0.001). A significant genetic differentiation was also detected in all locations studied at the group level based on the year and population (Table S2).
Genetic distance between 84 individual roaches was visualized through principal coordinates analysis (PCoA) based on concatenated ATP6 partial gene and D-loop region sequences (Figure 5). The first two principal coordinates explained 31.48% of the variation (17.12% and 14.36%, respectively). The results revealed that sampled specimens could be divided into four main groups. The first two groups consisted only of individual roaches collected in 2017 (D17 and D17, N17, respectively). The third group consisted only of fishes from Lake Drūkšiai collected in 2017 and 2022. The fourth group comprised representatives of all studied populations except the D17 population. Generally, D17 showed a separation from other populations, indicating a strong genetic differentiation from other populations.

4. Discussion

This study, for the first time, analyzed the genetic diversity and population structure of roaches over a five-year period, from 2017 to 2022, in two rivers (Žeimena and Neris) and Lake Drūkšiai in Lithuania based on mtDNA markers.

4.1. Genetic Diversity

mtDNA markers are the most widely used molecular markers and play an important role in genetic research, including information about population decline or explosion [36]. Previous reports have explored the genetic diversity within different R. rutilus populations based on microsatellite loci [21,23,37,38] or using the mtDNA cytochrome b gene [24]. The D-loop region, with a high nucleotide substitution rate, was indicated as an effective genetic marker for genetic structure studies in fish populations [39]. To the best of our knowledge, there are no previous studies into genetic diversity analysis of the roach population using the D-loop region or ATP6 gene sequences. However, both the D-loop [40,41,42] and ATP6 gene [43,44,45] sequences are widely used as genetic markers to study the genetic structure of other fish species. Our results showed that genetic diversity values were higher based on the D-loop region than those using the ATP6 partial gene fragment. The difference may be attributed to a higher mutation and evolutionary rate in the D-loop region than that in ATP6 gene sequences [46]. Therefore, the D-loop region is more sensitive to detecting genetic variability in species and may provide an explanation for differences between the genetic variability data obtained using various mtDNA markers. In this study, haplotype 8 (HC_8 and HD_8) was detected in 10 roach specimens collected in the Neris River in 2017 (two samples of roaches) and especially in Lake Drūkšiai (eight specimens of roaches). However, haplotype 8 was not observed in the roach samples collected in 2022. The absence of haplotype 8 in the samples collected in 2022 can be interpreted as a disappearance of current point mutation due to a drift, negative selection, or the small sample size selected in this study. Since the mtDNA D-loop region has a higher mutation frequency, to analyze the results obtained in more detail, ATP6 gene sequences as a genetic marker—which is less affected by random mutations—was also used. The results obtained in this study showed that both the mtDNA D-loop region and ATP6 partial gene markers can be very helpful in analyzing the genetic variation of R. rutilus.
Genetic diversity is influenced by many factors, including natural barriers or anthropogenic activities. For instance, damming and isolation of populations can reduce the population size, leading to genetic differentiation via increased genetic drift [47]. Comparing the results obtained over a five-year period, it was observed that the level of genetic diversity decreased in most populations studied in 2022. The populations of roaches studied may have experienced a decline in population, resulting in the loss of genetic diversity [48] due to a partial elimination of genetic variability that was represented in 2017 in three roach populations studied. The samples studied are not large enough to reflect a significant decrease in the genetic diversity of the population in 2022. However, after comparing haplotype networks constructed using samples collected in 2017 and 2022 in Lake Drūkšiai, twelve haplotypes in 2017 and eight haplotypes in 2022 were observed. Only two common haplotypes were detected in both years using the ATP6-D-loop marker (Figure S6). This relatively large difference was not detected between the samples collected in the Neris (seven haplotypes in 2017 and six haplotypes in 2022, with two of them being common haplotypes detected in both years) and the Žeimena (seven haplotypes in 2017 and six haplotypes in 2022, of which only one common haplotype was detected in both years) rivers when comparing the samples collected in 2017 and 2022 from the same location. This change in genetic diversity could be attributed to the drift, negative natural selection of most sensitive haplotypes eliminated from the population due to environmental stresses, or the impacts of over-fishing [49]. Since roaches are one of the most abundant species—though not a very popular type in fishing—it is more likely that such a change in genetic variability was caused by the modification of the environment. Previous reports also showed the abundance of unique haplotypes in the perch population inhabiting Lake Drūkšiai [50], indicating that the environmental conditions of Lake Drūkšiai that served as a cooling source for NPP were different from other water bodies. One of the reasons could be increased water temperature that affected the fish population of Lake Drūkšiai during a period of longer than twenty years. A reduction in genetic diversity in Lake Drūkšiai in 2022 may be related to restoring water quality condition after decommissioning NPP. However, to confirm or deny the possible effects of anthropogenic activities in Lake Drūkšiai, it is necessary to investigate a larger number of roach samples, including samples of fishes directly affected by increased water temperature.

4.2. Population Genetic Structure

Based on the outcome of AMOVA, the genetic differentiation within the population of R. rutilus, which accounted for from 82% (D-loop and ATP6-D-loop) to 98% (ATP6) of the total genetic variance, was much higher than that among other populations (Table 3). The highest genetic difference over a five-year period detected in Lake Drūkšiai varied from 7% (ATP6) to 21% (D-loop) (Table S2). The PCoA analysis showed that in 2017, individuals were divided into four clear groups; however, in 2022, only two groups were detected using the concatenated ATP6 partial gene and D-loop region sequences (Figure 5). Similarly, the greatest separation from other populations was found in D17, which was detected in three clusters, but not in the fourth group that comprised other populations studied. The third group consisted only of the samples from Lake Drūkšiai collected in 2017 and 2022. The genetic differentiation pattern of fish is usually consistent with the water system pattern of distribution [51,52]. Demandt [37] showed that detected changes to R. rutilus in genetic diversity were related to geographic isolation lasting for 23 years, using microsatellite markers. In this study, Lake Drūkšiai is the largest water body studied and differs from other locations studied; this may account for the appearance of the third group consisting only of D17 and D22 populations. However, a considerable difference was identified between the samples collected in 2017 and 2022 in Lake Drūkšiai; this may be related to environmental changes in Lake Drūkšiai after the decommissioning of NPP, and subsequently this caused changes in the population genetic structure of the roach recorded during a five-year period. Population genetic differentiation can be driven by ecological and evolutionary factors. In this region, no information is available on the studies related to the impact of anthropogenic activities on the genetic variability of roaches and how it changes within a short period of time—in this case, five years. The association of the results obtained with the anthropogenic activity is tentative as we did not perform a real-time analysis of water quality parameters during the study period. The cyprinid fish roach has developed a high degree of adaptability to the environment during its long evolution [53]. Genetic diversity reflects evolutionary biology and is linked to biological complexity, ecosystem restoration, and the ability of species to respond to environmental changes [54]. Previous studies showed that the modification of ecological environments by human activities can affect fish population genetic structure [55,56]. One of the anthropogenic activities is NPPs, usually located near the coast or even rivers or lakes to guarantee the required water supply during the operational stage [57]. Near Lake Drūkšiai, the Ignalina NPP was built and started supplying electricity to its users in 1983 and was in operation until 2009 [58]. The nuclear power plant used Lake Drūkšiai as a natural reservoir for cooling water. The temperature of the lake increased by about 3 °C (5.4 °F), causing thermal pollution [59,60]. Despite the fact that freshwater fish can be negatively affected by thermal pollution [61], several studies showed that due to higher water temperature in Lake Drūkšiai, the population of widely distributed fish such as perch and roach has increased [62,63]. Our study showed a higher level of genetic diversity in roaches collected in Lake Drūkšiai in 2017, which may also be related to an increase in water temperature, especially during the period between 1983 and 2009. Previous studies already indicated that higher temperature could affect the mutation rates of organisms, resulting in more abundant genetic diversity [64,65,66].

5. Conclusions

The decreasing genetic diversity in roach populations over a five-year period was established in all locations studied using D-loop and ATP6 genetic markers in Eastern Lithuania. However, based on comparisons between samples of roaches over a five-year period, the highest genetic variation among roaches was detected in the Lake Drūkšiai population in 2017. Also, the results of genetic diversity, AMOVA analysis, haplotype network analysis, and PCoA analysis suggested that a significantly greater genetic variability was established in Lake Drūkšiai in 2017. Although this study has some limitations, our results point to the possibility of revealing the impact of anthropogenic activities in Lake Drūkšiai, which may be related to the earlier operating Ignalina Nuclear Power Plant.

Supplementary Materials

The following supporting information can be downloaded at: https://www.mdpi.com/article/10.3390/d15111113/s1.

Author Contributions

Conceptualization, I.I. and D.B.; methodology, I.I. and A.R.; software, I.I. and D.B.; validation, I.I., D.B. and A.R.; formal analysis, I.I. and D.B.; investigation, I.I.; resources, V.R.; data curation, I.I., A.R. and D.B.; writing—original draft preparation, I.I.; writing—review and editing, D.B. and A.R.; visualization, I.I.; supervision, D.B.; project administration, D.B. All authors have read and agreed to the published version of the manuscript.

Funding

This research received no external funding.

Institutional Review Board Statement

Not applicable.

Data Availability Statement

The mtDNA D-loop region and ATP6 region sequences retrieved in the current investigation were submitted to the NCBI GenBank database under accession numbers DQ455036.1 and OM736800.1, respectively.

Conflicts of Interest

The authors declare no conflict of interest.

References

  1. Nater, A.; Arora, N.; Greminger, M.P.; van Schaik, C.P.; Singleton, I. Marked population structure and recent migration in the critically endangered Sumatran orangutan (Pongo abelii). J. Hered. 2013, 104, 2–13. [Google Scholar] [CrossRef] [PubMed]
  2. Frankham, R.; Ballou, J.D.; Briscoe, D.A. Introduction to Conservation Genetics; Cambridge University Press: Cambridge, UK, 2002. [Google Scholar] [CrossRef]
  3. Baranyi, C.; Gollmann, G.; Bobin, M. Genetic and morphological variability in roach Rutilus rutilus, from Austria. Hydrobiologia 1997, 350, 13–23. [Google Scholar] [CrossRef]
  4. Raeymaekers, J.A.; Maes, G.E.; Geldof, S.; Hontis, I.; Nackaerts, K.; Volckaert, F.A. Modeling genetic connectivity in sticklebacks as a guideline for river restoration. Evol. Appl. 2008, 1, 475–488. [Google Scholar] [CrossRef] [PubMed]
  5. Morita, K.; Yamamoto, S. Effects of habitat fragmentation by damming on the persistence of stream-dwelling charr populations. Conserv. Biol. 2002, 16, 1318–1323. [Google Scholar] [CrossRef]
  6. Dudgeon, D. Multiple threats imperil freshwater biodiversity in the Anthropocene. Curr. Biol. 2019, 29, R960–R967. [Google Scholar] [CrossRef] [PubMed]
  7. Coulter, D.P.; Sepúlveda, M.S.; Troy, C.D.; Höök, T.O. Thermal habitat quality of aquatic organisms near power plant discharges: Potential exacerbating effects of climate warming. Fish. Manag. Ecol. 2014, 21, 196–210. [Google Scholar] [CrossRef]
  8. Langford, T.E. Thermal discharges and pollution. In Encyclopedia of Ocean Sciences; Academic Press: Cambridge, MA, USA, 2001; pp. 2933–2940. [Google Scholar] [CrossRef]
  9. Dokulil, M.T. Impact of climate warming on European inland waters. Inland Waters 2013, 4, 27–40. [Google Scholar] [CrossRef]
  10. Hester, E.T.; Doyle, M.W. Human impacts to river temperature and their effects on biological processes: A quantitative synthesis. J. Am. Water Resour. Assoc. 2011, 47, 571–587. [Google Scholar] [CrossRef]
  11. Borell, Y.J.; Bernardo, D.; Blanco, G.; Vásquez, E.; Sánchez, J.A. Spatial and temporal variation of genetic diversity and estimation of effective population sizes in Atlantic salmon (Salmo salar, L.) populations from Asturias (Northern Spain) using microsatellites. Conserv. Gen. 2008, 9, 807–819. [Google Scholar] [CrossRef]
  12. Klerks, P.L.; Levinton, J.S. Rapid evolution of metal resistance in a benthic oligochaete inhabiting a metal-polluted site. Biol. Bull. 1989, 176, 135–141. [Google Scholar] [CrossRef]
  13. Oziolor, E.M.; Bigorgne, E.; Aguilar, L.; Usenko, S.; Matson, C.W. Evolved resistance to PCB- and PAH-induced cardiac teratogenesis, and reduced CYP1A activity in Gulf killifish (Fundulus grandis) populations from the Houston Ship Channel, Texas. Aquat. Toxicol. 2014, 150, 210–219. [Google Scholar] [CrossRef] [PubMed]
  14. Reid, N.M.; Proestou, D.A.; Clark, B.W.; Warren, W.C.; Colbourne, J.K.; Shaw, J.R.; Karchner, S.I.; Hahn, M.E.; Nacci, D.; Oleksiak, M.F.; et al. The genomic landscape of rapid repeated evolutionary adaptation to toxic pollution in wild fish. Science 2016, 354, 1305–1308. [Google Scholar] [CrossRef] [PubMed]
  15. Campbell-Staton, S.C.; Cheviron, Z.A.; Rochette, N.; Catchen, J.; Losos, J.B.; Edwards, S.V. Winter storms drive rapid phenotypic, regulatory, and genomic shifts in the green anole lizard. Science 2017, 357, 495–498. [Google Scholar] [CrossRef] [PubMed]
  16. Hermoso, V.; Clavero, M. Threatening processes and conservation management of endemic freshwater fish in the Mediterranean basin: A review. Mar. Freshw. Res. 2011, 62, 244–254. [Google Scholar] [CrossRef]
  17. Movchan, Y.V.; Smirnov, A.I. Fauna of Ukraine. Fishes. Cyprinid Fishes (Roach, Dace, Minnow, Rudd, Grass Carp, Asp, Verchovka, Tench, Undermouth, Gudgeon, Barbel). (Fauna Ukrainy. Ryby. Koropovi (Plitka, Yalets, Golijan, Krasnopirka, Amur, Bilyzna, Verkhova, Lyn, Chebachok Amurskyi); Kiev Naukova Dumka Publishing House: Kyiv, Ukraine, 1981; Volume 8, Part 1. [Google Scholar]
  18. Svanbäck, R.; Eklöv, P.; Fransson, R.; Holmgren, K. Intraspecific competition drives multiple species resource polymorphism in fish communities. Oikos 2008, 117, 114–124. [Google Scholar] [CrossRef]
  19. Virbickas, J. Lietuvos žuvys (Fishes of Lithuania); Ekologijos Institutas: Vilnius, Lithuania, 2000. [Google Scholar]
  20. Kawamura, K. “Handbook of European freshwater fishes” by M. Kottelat and J. Freyhof (2007). Ichthyol. Res. 2008, 55, 99. [Google Scholar] [CrossRef]
  21. Lappalainen, A.; Rask, M.; Koponen, H.; Vesala, S. Relative abundance, diet and growth of perch (Perca fluviatilis) and roach (Rutilus rutilus) at Tvärminne, northern Baltic Sea, in 1975 and 1997: Responses to eutrophication? Boreal Env. Res 2001, 6, 107–108. [Google Scholar]
  22. Faulks, L.; Svanbäck, R.; Eklöv, P.; Östman, Ö. Genetic and morphological divergence along the littoral–pelagic axis in two common and sympatric fishes: Perch, Perca fluviatilis (Percidae) and roach, Rutilus rutilus (Cyprinidae). Biol. J. Linn. Soc. 2015, 114, 929–940. [Google Scholar] [CrossRef]
  23. Crookes, S.; Shaw, P.W. Isolation by distance and non-identical patterns of gene flow within two river populations of the freshwater fish Rutilus rutilus (L. 1758). Conserv. Genet. 2016, 17, 861–874. [Google Scholar] [CrossRef]
  24. Larmuseau, M.H.D.; Freyhof, J.; Volckaert, F.A.M.; Van Houdt, J.K.J. Matrilinear phylogeography and demographical patterns of Rutilus rutilus: Implications for taxonomy and conservation. J. Fish Biol. 2009, 75, 332–353. [Google Scholar] [CrossRef]
  25. Nedveckaite, T.; Motiejunas, S.; Kucinskas, V.; Mazeika, J.; Filistovic, V.; Jusciene, D.; Maceika, E.; Morkeliunas, L.; Hamby, D.M. Environmental releases of radioactivity and the incidence of thyroid disease at the Ignalina Nuclear Power Plant. Health Phys. 2000, 79, 666–674. [Google Scholar] [CrossRef]
  26. Thoresson, G. Guidelines for Coastal Monitoring. Kustrapport 1. National Board of Fisheries; Institute of Coastal Research: Öregrund, Sweden, 1993. [Google Scholar]
  27. Aljanabi, S.M.; Martinez, I. Universal and rapid salt-extraction of high quality genomic DNA for PCR-based techniques. Nucleic Acids Res. 1997, 25, 4692–4693. [Google Scholar] [CrossRef]
  28. Edgar, R.C. MUSCLE: Multiple sequence alignment with high accuracy and high throughput. Nucleic Acids Res. 2004, 32, 1792–1797. [Google Scholar] [CrossRef] [PubMed]
  29. Kumar, S.; Stecher, G.; Li, M.; Knyaz, C.; Tamura, K. MEGA X: Molecular Evolutionary Genetics Analysis across Computing Platforms. Mol. Biol. Evol. 2018, 35, 1547–1549. [Google Scholar] [CrossRef] [PubMed]
  30. Rozas, J.; Sánchez-Delbarrio, J.C.; Messeguer, X.; Rozas, R. DnaSP, DNA polymorphism analyses by the coalescent and other methods. Bioinformatics 2003, 19, 2496–2497. [Google Scholar] [CrossRef] [PubMed]
  31. Polzin, T.S.; Daneschmand, S.V. On Steiner trees and minimum spanning trees in hypergraphs. Oper. Res. Lett. 2003, 31, 12–20. [Google Scholar] [CrossRef]
  32. Peakall, R.O.D.; Smouse, P.E. GENALEX 6: Genetic analysis in Excel. Population genetic software for teaching and research. Mol. Ecol. Notes. 2006, 6, 288–295. [Google Scholar] [CrossRef]
  33. Fu, Y.X. Statistical tests of neutrality of mutations agai nst population growth, hitchhiking and background selection. Genetics 1997, 147, 915–925. [Google Scholar] [CrossRef]
  34. Tajima, F.V. Statistical method for testing the neutral mutation hypothesis by DNA polymorphism. Genetics 1989, 123, 585–595. [Google Scholar] [CrossRef]
  35. Excoffier, L.; Lischer, H.E. Arlequin suite ver 3.5: A new series of programs to perform population genetics analyses under linux and windows. Mol. Ecol. Resour. 2010, 10, 564–567. [Google Scholar] [CrossRef]
  36. Petit-Marty, N.; Vázquez-Luis, M.; Hendriks, I.E. Use of the Nucleotide Diversity in COI Mitochondrial Gene as an Early Diagnostic of Conservation Status of Animal Species. Conserv. Lett. 2021, 14, e12756. [Google Scholar] [CrossRef]
  37. Demandt, M.H. Temporal changes in genetic diversity of isolated populations of perch and roach. Conserv. Genet. 2010, 11, 249–255. [Google Scholar] [CrossRef]
  38. Hamilton, P.B.; Nicol, E.; De-Bastos, E.S.; Williams, R.J.; Sumpter, J.P.; Jobling, S.; Stevens, J.R.; Tyler, C.R. Populations of a cyprinid fish are self-sustaining despite widespread feminization of males. BMC Biol. 2014, 12, 1. [Google Scholar] [CrossRef] [PubMed]
  39. Ryota, Y.; Akira, G. Phylogeography of a freshwater Sculpin, Cottusnozawae from the northeastern part of Honshu Island, Japan. Ichthyol. Res. 2002, 49, 147–155. [Google Scholar] [CrossRef]
  40. Pourkazemi, M.; Skibinski, D.O.F.; Beardmore, J. Application of mtDNA d-loop region for the study of Russian sturgeon population structure from Iranian coastline of the Caspian Sea. J. Appl. Ichthyol. 1999, 15, 23–28. [Google Scholar] [CrossRef]
  41. Iervolino, F.; de Resende, E.K.; Hilsdorf, A.W.S. The lack of genetic differentiation of pacu (Piaractus mesopotamicus) populations in the Upper-Paraguay Basin revealed by the mitochondrial DNA D-loop region: Implications for fishery management. Fish. Res. 2010, 101, 27–31. [Google Scholar] [CrossRef]
  42. Padhi, A. Geographic variation within a tandemly repeated mitochondrial DNA D-loop region of a North American freshwater fish, Pylodictis olivaris. Gene 2014, 538, 63–68. [Google Scholar] [CrossRef] [PubMed]
  43. Yan, J.; Guo, X.; Liu, S.; Xiao, J.; Liu, Z.; Chen, Y.; Liu, Y. Maternal inheritance in polyploid fish inferred from mitochondrial ATPase genes analysis. Prog. Nat. Sci. 2009, 19, 693–698. [Google Scholar] [CrossRef]
  44. Garcia, D.A.; Lasso, C.A.; Morales, M.; Caballero, S.J. Molecular systematics of the freshwater stingrays (myliobatiformes: Potamotrygonidae) of the Amazon, Orinoco, Magdalena, Esequibo, Caribbean, and Maracaibo basins (Colombia–Venezuela): Evidence from three mitochondrial genes. Mitochondrial DNA Part A 2016, 27, 4479–4491. [Google Scholar] [CrossRef]
  45. Baltazar-Soares, M.; de Araújo Lima, A.R.; Silva, G. Targeted Sequencing of Mitochondrial Genes Reveals Signatures of Molecular Adaptation in a Nearly Panmictic Small Pelagic Fish Species. Genes 2021, 12, 91. [Google Scholar] [CrossRef]
  46. Yan, T.; Wang, X.; Li, S.; He, Z.; Luo, J.; Zhang, Q.; Yang, D.; He, Z. Genetic analysis of wild Ancherythroculter nigrocauda in tributaries and the main stream of the upper Yangtze River basin of China. Mitochondrial DNA A 2020, 31, 17–24. [Google Scholar] [CrossRef] [PubMed]
  47. Jager, H.I.; Chandler, J.A.; Lepla, K.B.; Winkle, W.V. A theoretical study of river fragmentation by dams and its effects on white sturgeon populations. Environ. Biol. Fishes 2001, 60, 347–361. [Google Scholar] [CrossRef]
  48. Avise, J.C. Phylogeography, the History and Formation of Species; Harvard University Press: Cambridge, MA, USA, 2000. [Google Scholar]
  49. Allan, J.D.; Abell, R.; Hogan, Z.; Revenga, C.; Taylor, B.W.; Welcomme, R.L.; Winemiller, K. Overfishing of inland waters. BioScience 2005, 55, 1041–1051. [Google Scholar] [CrossRef]
  50. Ragauskas, A.; Butkauskas, D.; Sruoga, A. Investigation into genetic diversity of perch inhabiting Lake Drūkšiai and other water bodies of Lithuania on the basis of mtDNA analysis. Zool. Ecol. 2014, 24, 154–159. [Google Scholar] [CrossRef]
  51. Yang, L.; Hu, J.; Qin, C.; Zhang, Y.; Lu, R.; Meng, X.; Yang, G.; Yan, X.; Zhi, S.; Nie, G. Genetic structure analysis of Pseudorasbora parva in the four major river systems in Yunnan based on mitochondrial Cyt b. JFC 2020, 3, 339–350. [Google Scholar] [CrossRef]
  52. Soliman, T.; Aly, W.; Fahim, R.M.; Berumen, M.L.; Jenke-Kodama, H.; Bernardi, G. Comparative population genetic structure of redbelly tilapia (Coptodon zillii (Gervais, 1848)) from three different aquatic habitats in Egypt. Ecol. Evol. 2017, 7, 11092–11099. [Google Scholar] [CrossRef] [PubMed]
  53. Goldspink, C.R. The return of marked roach (Rutilus rutilus L.) to spawning grounds in Tjeukemeer, The Netherlands. J. Fish Biol. 1977, 11, 599–603. [Google Scholar] [CrossRef]
  54. Rowe, G.; Sweet, M.; Beebee, T.J.C. An Introduction to Molecular Ecology; Oxford University Press: Oxford, UK, 2017. [Google Scholar]
  55. Zhang, F.; Duan, Y.; Cao, S.; Wang, J.; Tan, D. High genetic diversity in population of Lepturichthys fimbriata from the Yangtze River revealed by microsatellite DNA analysis. Chin. Sci. Bull. 2012, 57, 487–491. [Google Scholar] [CrossRef]
  56. Meldgaard, T.; Nielsen, E.E.; Loeschcke, V. Fragmentation by weirs in a riverine system: A study of genetic variation in time and space among populations of European grayling (Thymallus thymallus) in a Danish river system. Conserv. Genet. 2003, 4, 735–747. [Google Scholar] [CrossRef]
  57. Argüelles, R.; Toledo, M.; Martín, M.A. Study of the Tagus River and Entrepeñas reservoir ecosystem around the Trillo nuclear power plant using chemometric analysis: Influence on water, sediments, algae and fish. Chemosphere 2021, 279, 130532. [Google Scholar] [CrossRef]
  58. Rettman, A. Lithuania Nuclear Shutdown to Test EU-Russia Relations. Available online: EUobserver.com (accessed on 31 December 2009).
  59. Björn, H. Science and Politics of Foreign Aid: Swedish Environmental Support to the Baltic States; Springer Science & Business Media: Berlin/Heidelberg, Germany, 2003. [Google Scholar] [CrossRef]
  60. Mažeika, J.; Taminskas, J. Water system of the lake Druksiai Transboundary Catchment under anthropogenic pressure. Pol. Geol. Inst. Spec. Pap. 2005, 18, 71–78. [Google Scholar]
  61. Verones, F.; Hanafiah, M.M.; Pfister, S.; Huijbregts, M.A.J.; Pelletier, G.J.; Koehler, A. Characterization factors for thermal pollution in freshwater aquatic environments. Environ. Sci. Technol. 2010, 44, 9364–9369. [Google Scholar] [CrossRef] [PubMed]
  62. Astrauskas, A.; Bernotas, E.; Didrikas, T. The impacts of the Ignalina Nuclear Power Plant effluent on fishes in Lithuania. Ital. J. Zool. 1998, 65, 461–464. [Google Scholar] [CrossRef]
  63. Kesminas, V.; Olechnovičienė, J. Fish community changes in the cooler of the Ignalina Nuclear Power Plant. Ekologija 2008, 54, 124–131. [Google Scholar] [CrossRef]
  64. Rohde, K. Latitudinal gradients in species diversity: The search for the primary cause. Oikos 1992, 65, 514–527. [Google Scholar] [CrossRef]
  65. Dowle, E.J.; Morgan-Richards, M.; Trewick, S.A. Molecular evolution and the latitudinal biodiversity gradient. Heredity 2013, 110, 501–510. [Google Scholar] [CrossRef] [PubMed]
  66. Pereira, H.M. A latitudinal gradient for genetic diversity. Science 2016, 353, 1494–1495. [Google Scholar] [CrossRef]
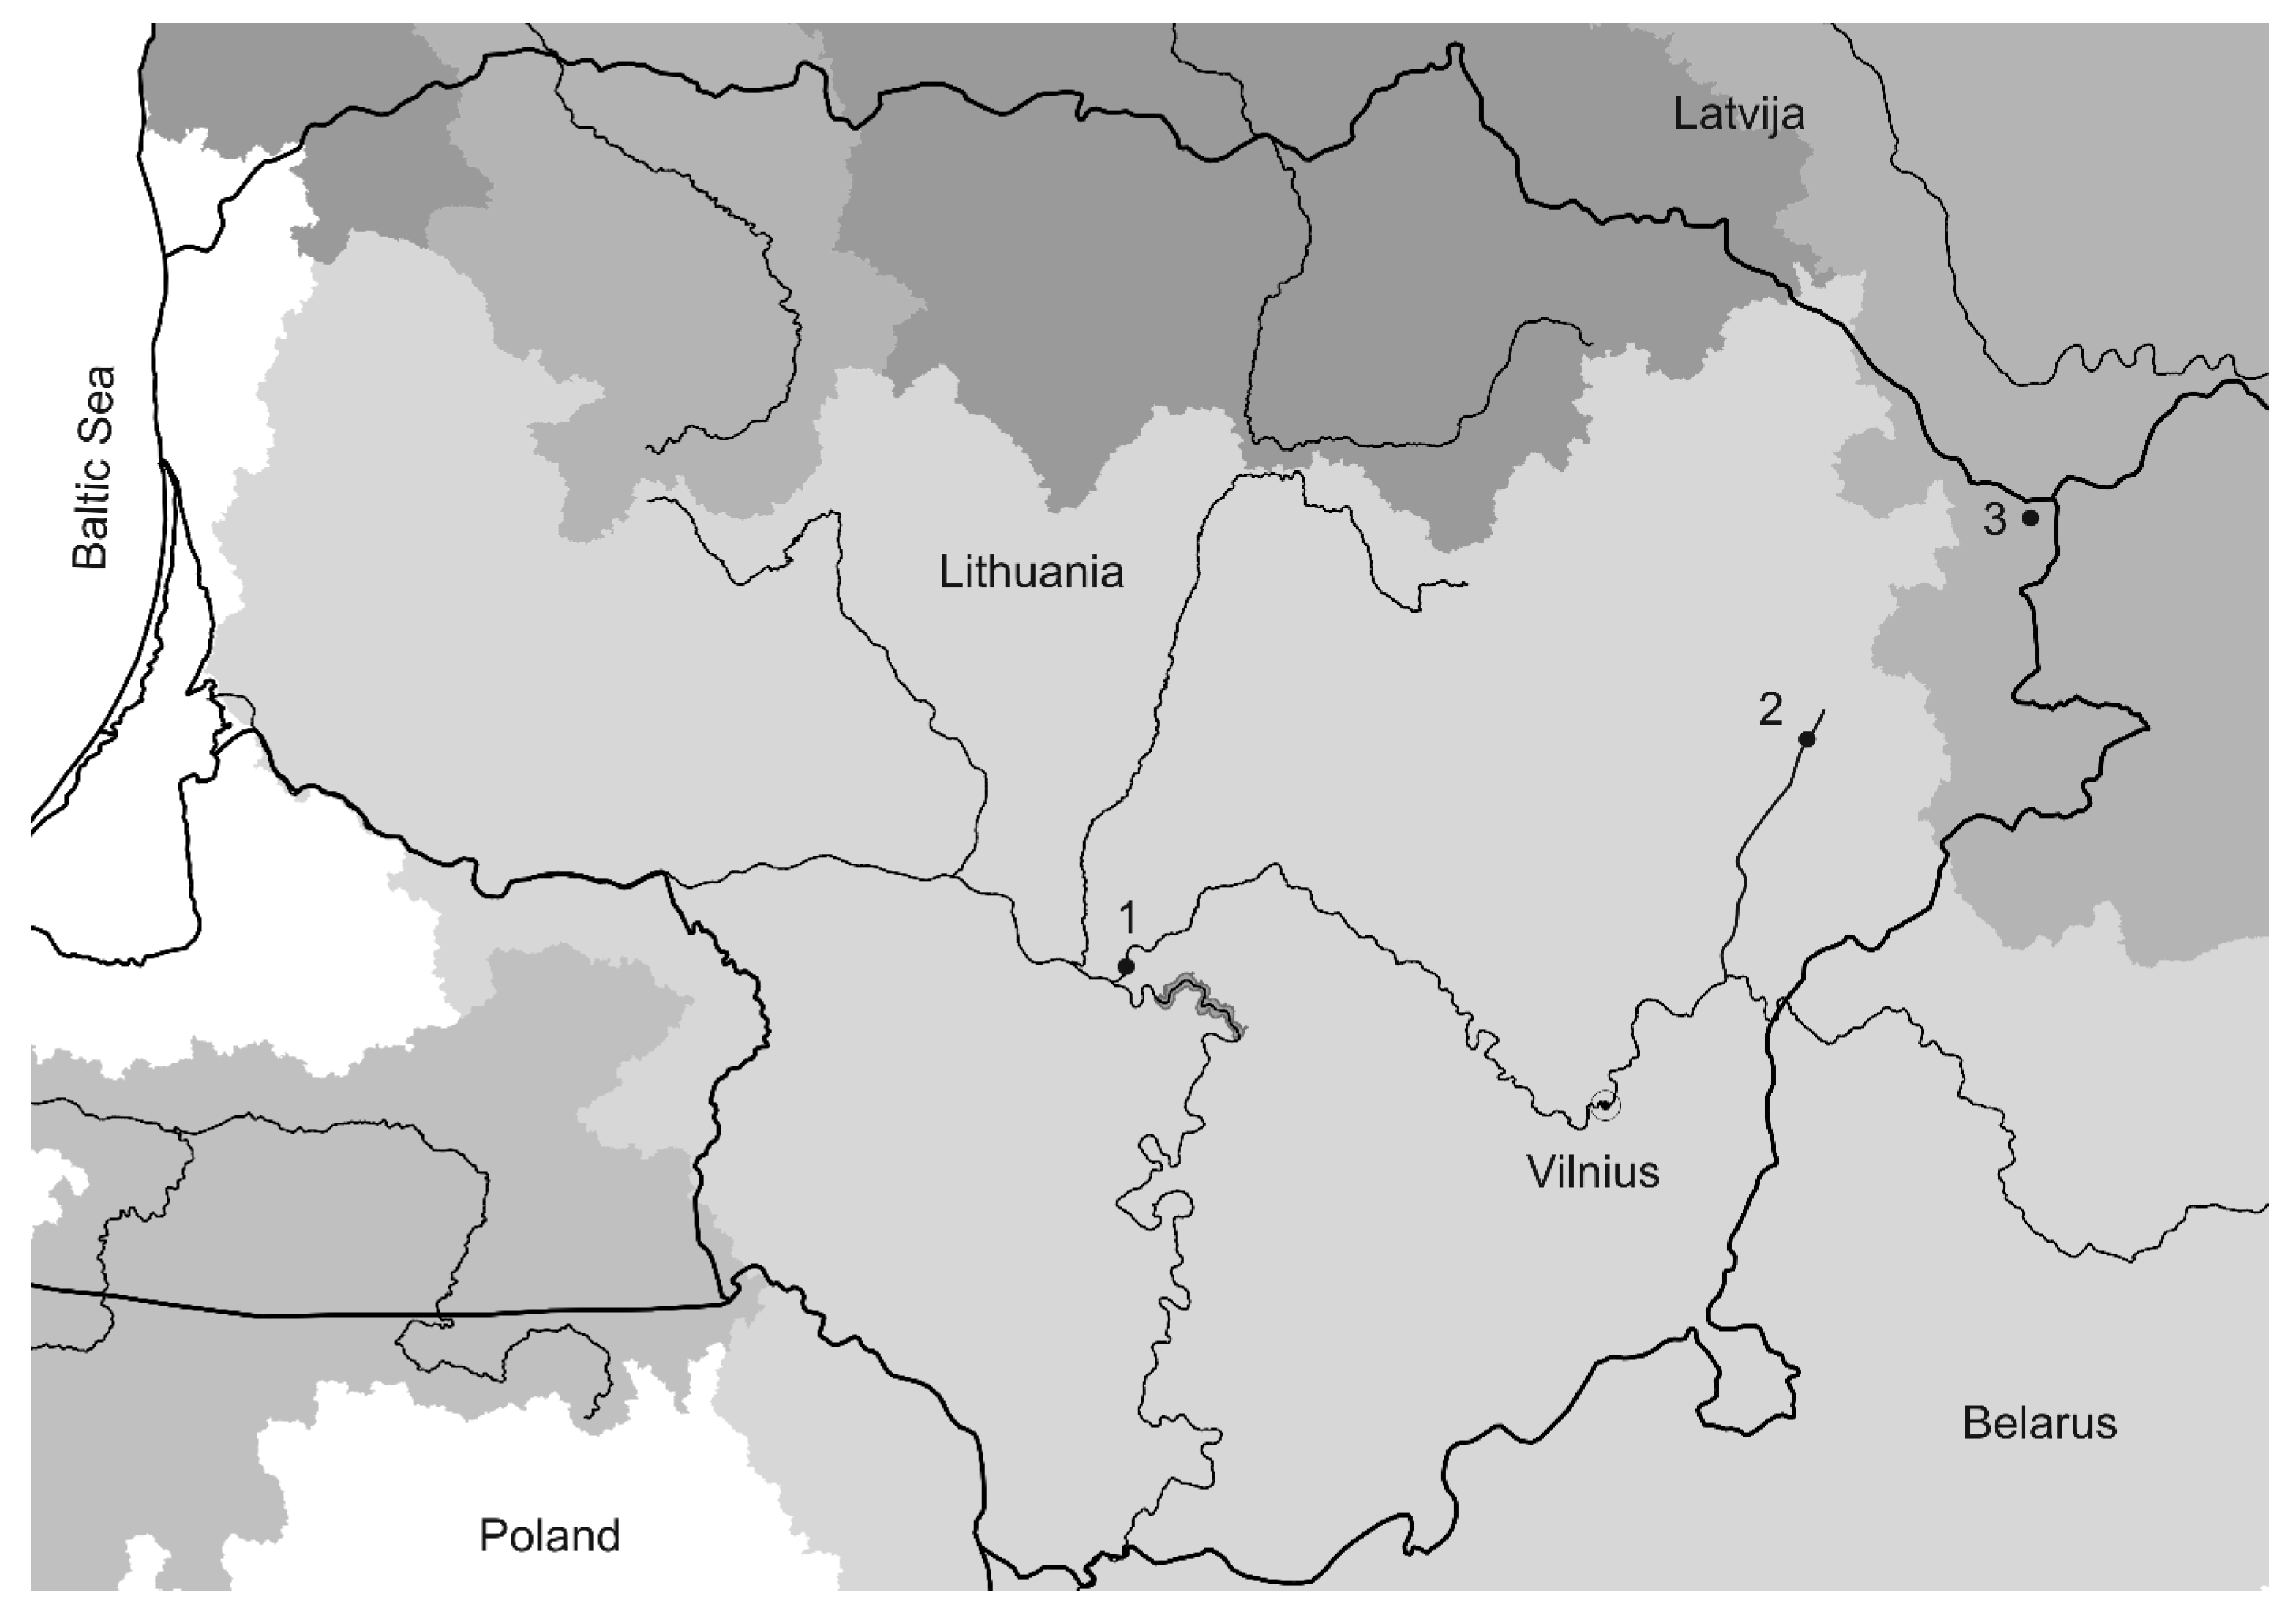
Figure 1. Drainage basins of the main rivers in Lithuania. Different river basins are highlighted in different shades. The locations of roach samples collected are represented by dots: the Neris River—1, Žeimena River—2, and Lake Drūkšiai—3.
Diversity 15 01113 g001
Figure 2. Median-joining haplotype networks of R. rutilus using mtDNA D-loop region sequences. (A) Haplotype network of roaches collected from three different locations in 2017; (B) Haplotype network of roaches collected from three different locations in 2022. Each circle represents a haplotype, and the size of a circle is proportional to the number of sequences assigned to that haplotype. The location from which the sequence was obtained is indicated by color in the legend. The number of hatch marks indicates the number of nucleotide differences that separate the haplotypes.
Diversity 15 01113 g002
Figure 3. Median-joining haplotype networks of R. rutilus using the mtDNA ATP6 gene marker. (A) Haplotype network of roaches collected from three different locations in 2017; (B) Haplotype network of roaches collected from three different locations in 2022. Each circle represents a haplotype, and the size of a circle is proportional to the number of sequences assigned to that haplotype. The location from which the sequence was obtained is represented by color in the legend. The number of hatch marks indicates the number of nucleotide differences that separate the haplotype.
Diversity 15 01113 g003
Figure 4. Median-joining haplotype networks of R. rutilus using the mtDNA ATP6_D-loop marker. (A) Haplotype network of roaches collected from three different locations in 2017; (B) Haplotype network of roaches collected from three different locations in 2022. Each circle represents a haplotype, and the size of a circle is proportional to the number of sequences assigned to that haplotype. The location from which the sequence was obtained is indicated by color in the legend. The number of hatch marks indicates the number of nucleotide differences that separate the haplotype.
Diversity 15 01113 g004
Figure 5. Principal component analysis of roaches based on ATP6-D-loop markers. Individuals are color-coded by sampled population and plotted on the first two coordinates.
Diversity 15 01113 g005
Table 1. Sampling information of R. rutilus collected from three different locations in Lithuania.
Sampling LocationsCollection DatePopulation CodeNumber of SamplesLocation
Lake Drūkšiai2017D171955°38′45.7″ N 26°35′53.3″ E
2022D2215
Neris River2017N171154°57′24.8″ N 23°55′41.9″ E
2022N2212
Žeimena River2017Z171255°14′26.6″ N 25°58′48.3″ E
2022Z2215
Table 2. Genetic diversity and neutrality test for R. rutilus by sampling localities, years, and markers.
Population
Code
hh’HdSπKNeutrality Test
Tajima’s DFu’s Fs
D-loopD171060.824580.00381.8011−0.7288−5.3827 **
D22740.876140.00251.6190 0.8942−2.5570 *
N17740.872760.00331.5636−0.9370−3.7031 **
N22620.681870.00301.4090−1.5344−2.2953 *
Z17420.742440.00271.2575−0.1778−0.1272
Z22420.466730.00110.5142−1.3165−1.7972 *
Total26200.7938140.00331.5140−0.6334−2.6438
ATP6D17540.385940.00090.4210−1.8612 *−3.5705 *
D22200.342810.00070.34280.23500.5966
N17310.472720.00110.5090−0.7781−0.6587
N22200.303010.00060.3030−0.19490.2973
Z17210.166610.00030.1666−1.1405−0.4756
Z22310.257120.00050.2666−1.4905 *−1.5463 *
Total970.320780.00080.3445−0.8717−0.8928 *
ATP6-D-loopD171280.8713120.00242.2222−1.2836−7.4378 **
D22860.914250.00161.96190.8148−3.1514 *
N17740.872770.00191.7818−1.0325−3.2539 *
N22620.818150.00131.2424−0.9201−2.6663 **
Z17760.909070.00242.2727−0.0763−2.1626
Z22630.647670.00111.0476−1.8487 *−2.6661 *
Total35290.9036260.00222.0981−0.7244−3.5564 *
h = number of haplotypes; h’ = number of unique haplotypes; Hd = haplotype diversity; π = nucleotide diversity; K = average number of haplotype differences; S = variable sites. * p < 0.05; ** p < 0.01.
Table 3. Results of AMOVA using mtDNA D-loop, ATP6 partial gene, and ATP6-D-loop sequences for populations of R. rutilus.
SequenceSource of Variationd.f.Sum of SquaresPercentage of Variance, %PhiPT
D-loop
WholeAmong populations513.681180.177 ***
Within populations7853.62982
Total8367.310100
2017-year groupAmong populations26.126170.174 ***
Within populations3930.94583
Total4137.071100
2022-year groupAmong populations23.531130.128 ***
Within populations3922.68387
Total4126.214100
ATP6
WholeAmong populations51.11320.022
Within populations7813.18598
Total8314.298100
2017-year groupAmong populations20.51030.027
Within populations397.25297
Total417.762100
2022-year groupAmong populations20.1860−0.029
Within populations395.933100
Total416.119100
ATP6-D-loop
WholeAmong populations517.762180.177 ***
Within populations7869.30982
Total8387.071100
2017-year groupAmong populations28.615180.184 ***
Within populations3941.40982
Total4150.024100
2022-year groupAmong populations23.862110.109 ***
Within populations3927.90089
Total4131.762100
d.f. = degrees of freedom; *** p < 0.001.
Disclaimer/Publisher’s Note: The statements, opinions and data contained in all publications are solely those of the individual author(s) and contributor(s) and not of MDPI and/or the editor(s). MDPI and/or the editor(s) disclaim responsibility for any injury to people or property resulting from any ideas, methods, instructions or products referred to in the content.

