

Environmental Factors Affecting Distribution and Diversity of Phytoplankton in the Irkutsk Reservoir Ecosystem in June 2023

 , , ,
, , ,
Abstract
:1. Introduction
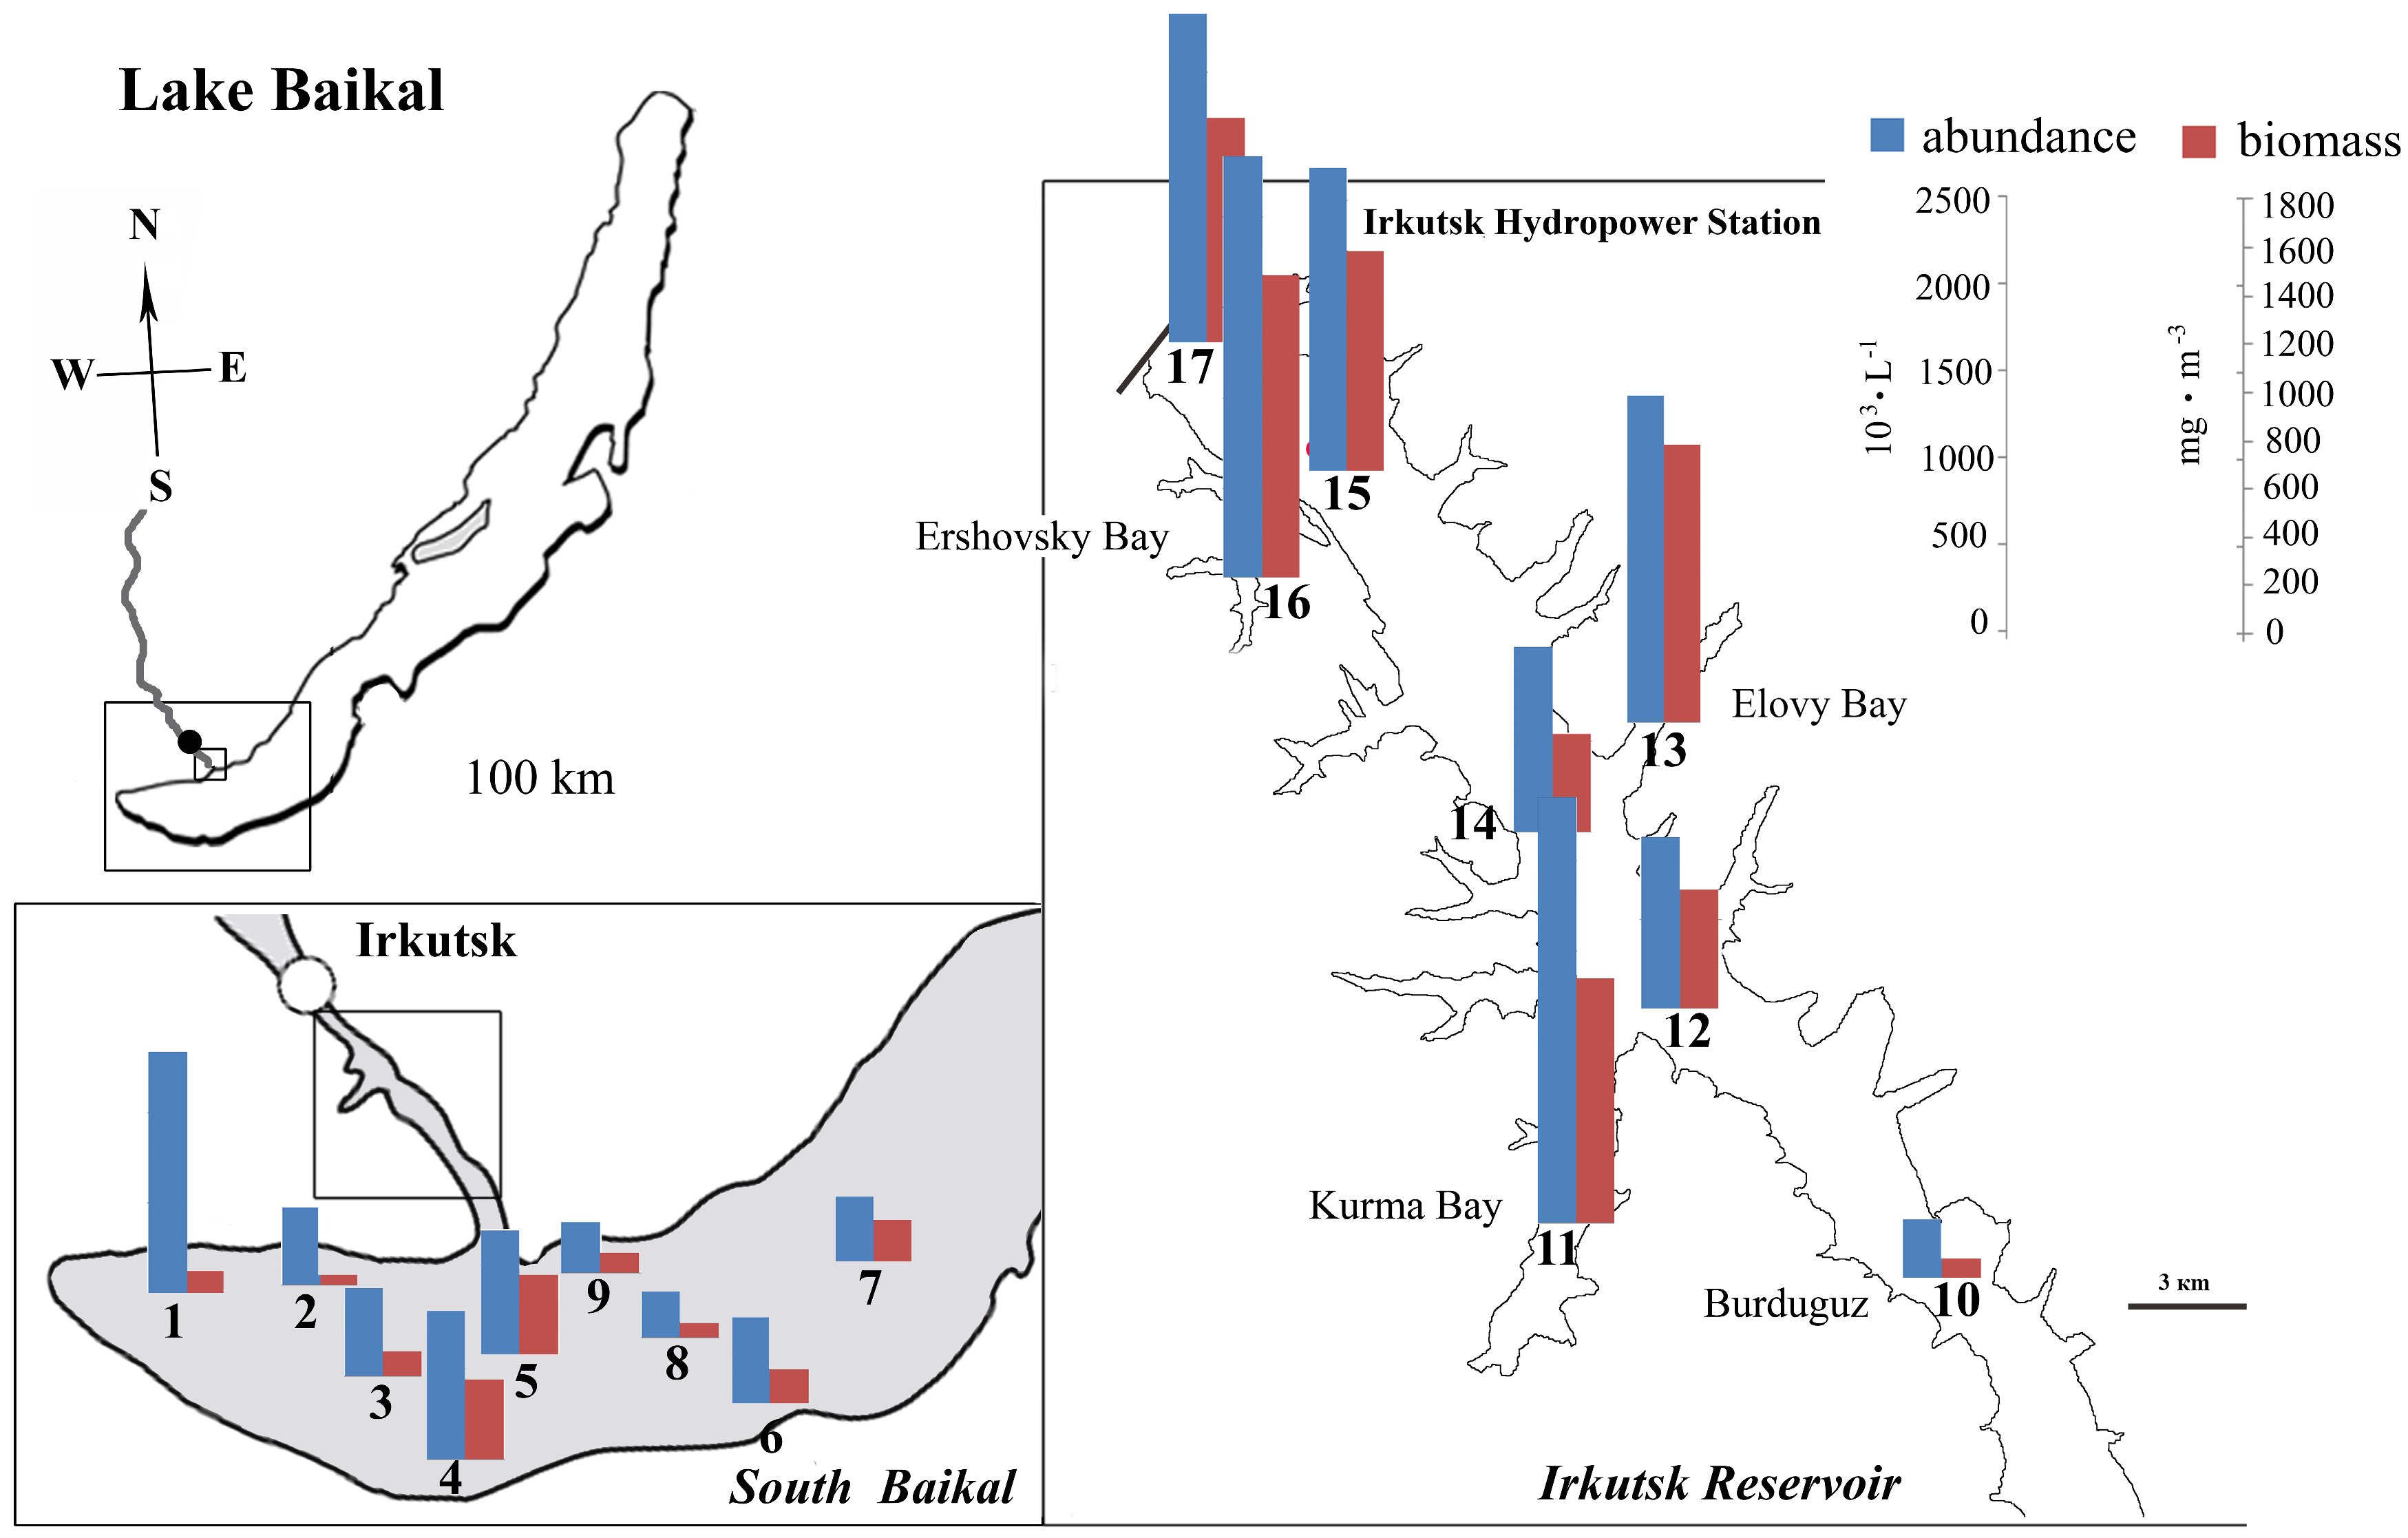
2. Site Description
3. Materials and Methods
3.1. Sampling and Microscopy
3.2. Hydrochemistry
3.3. Statistical Analysis
4. Results
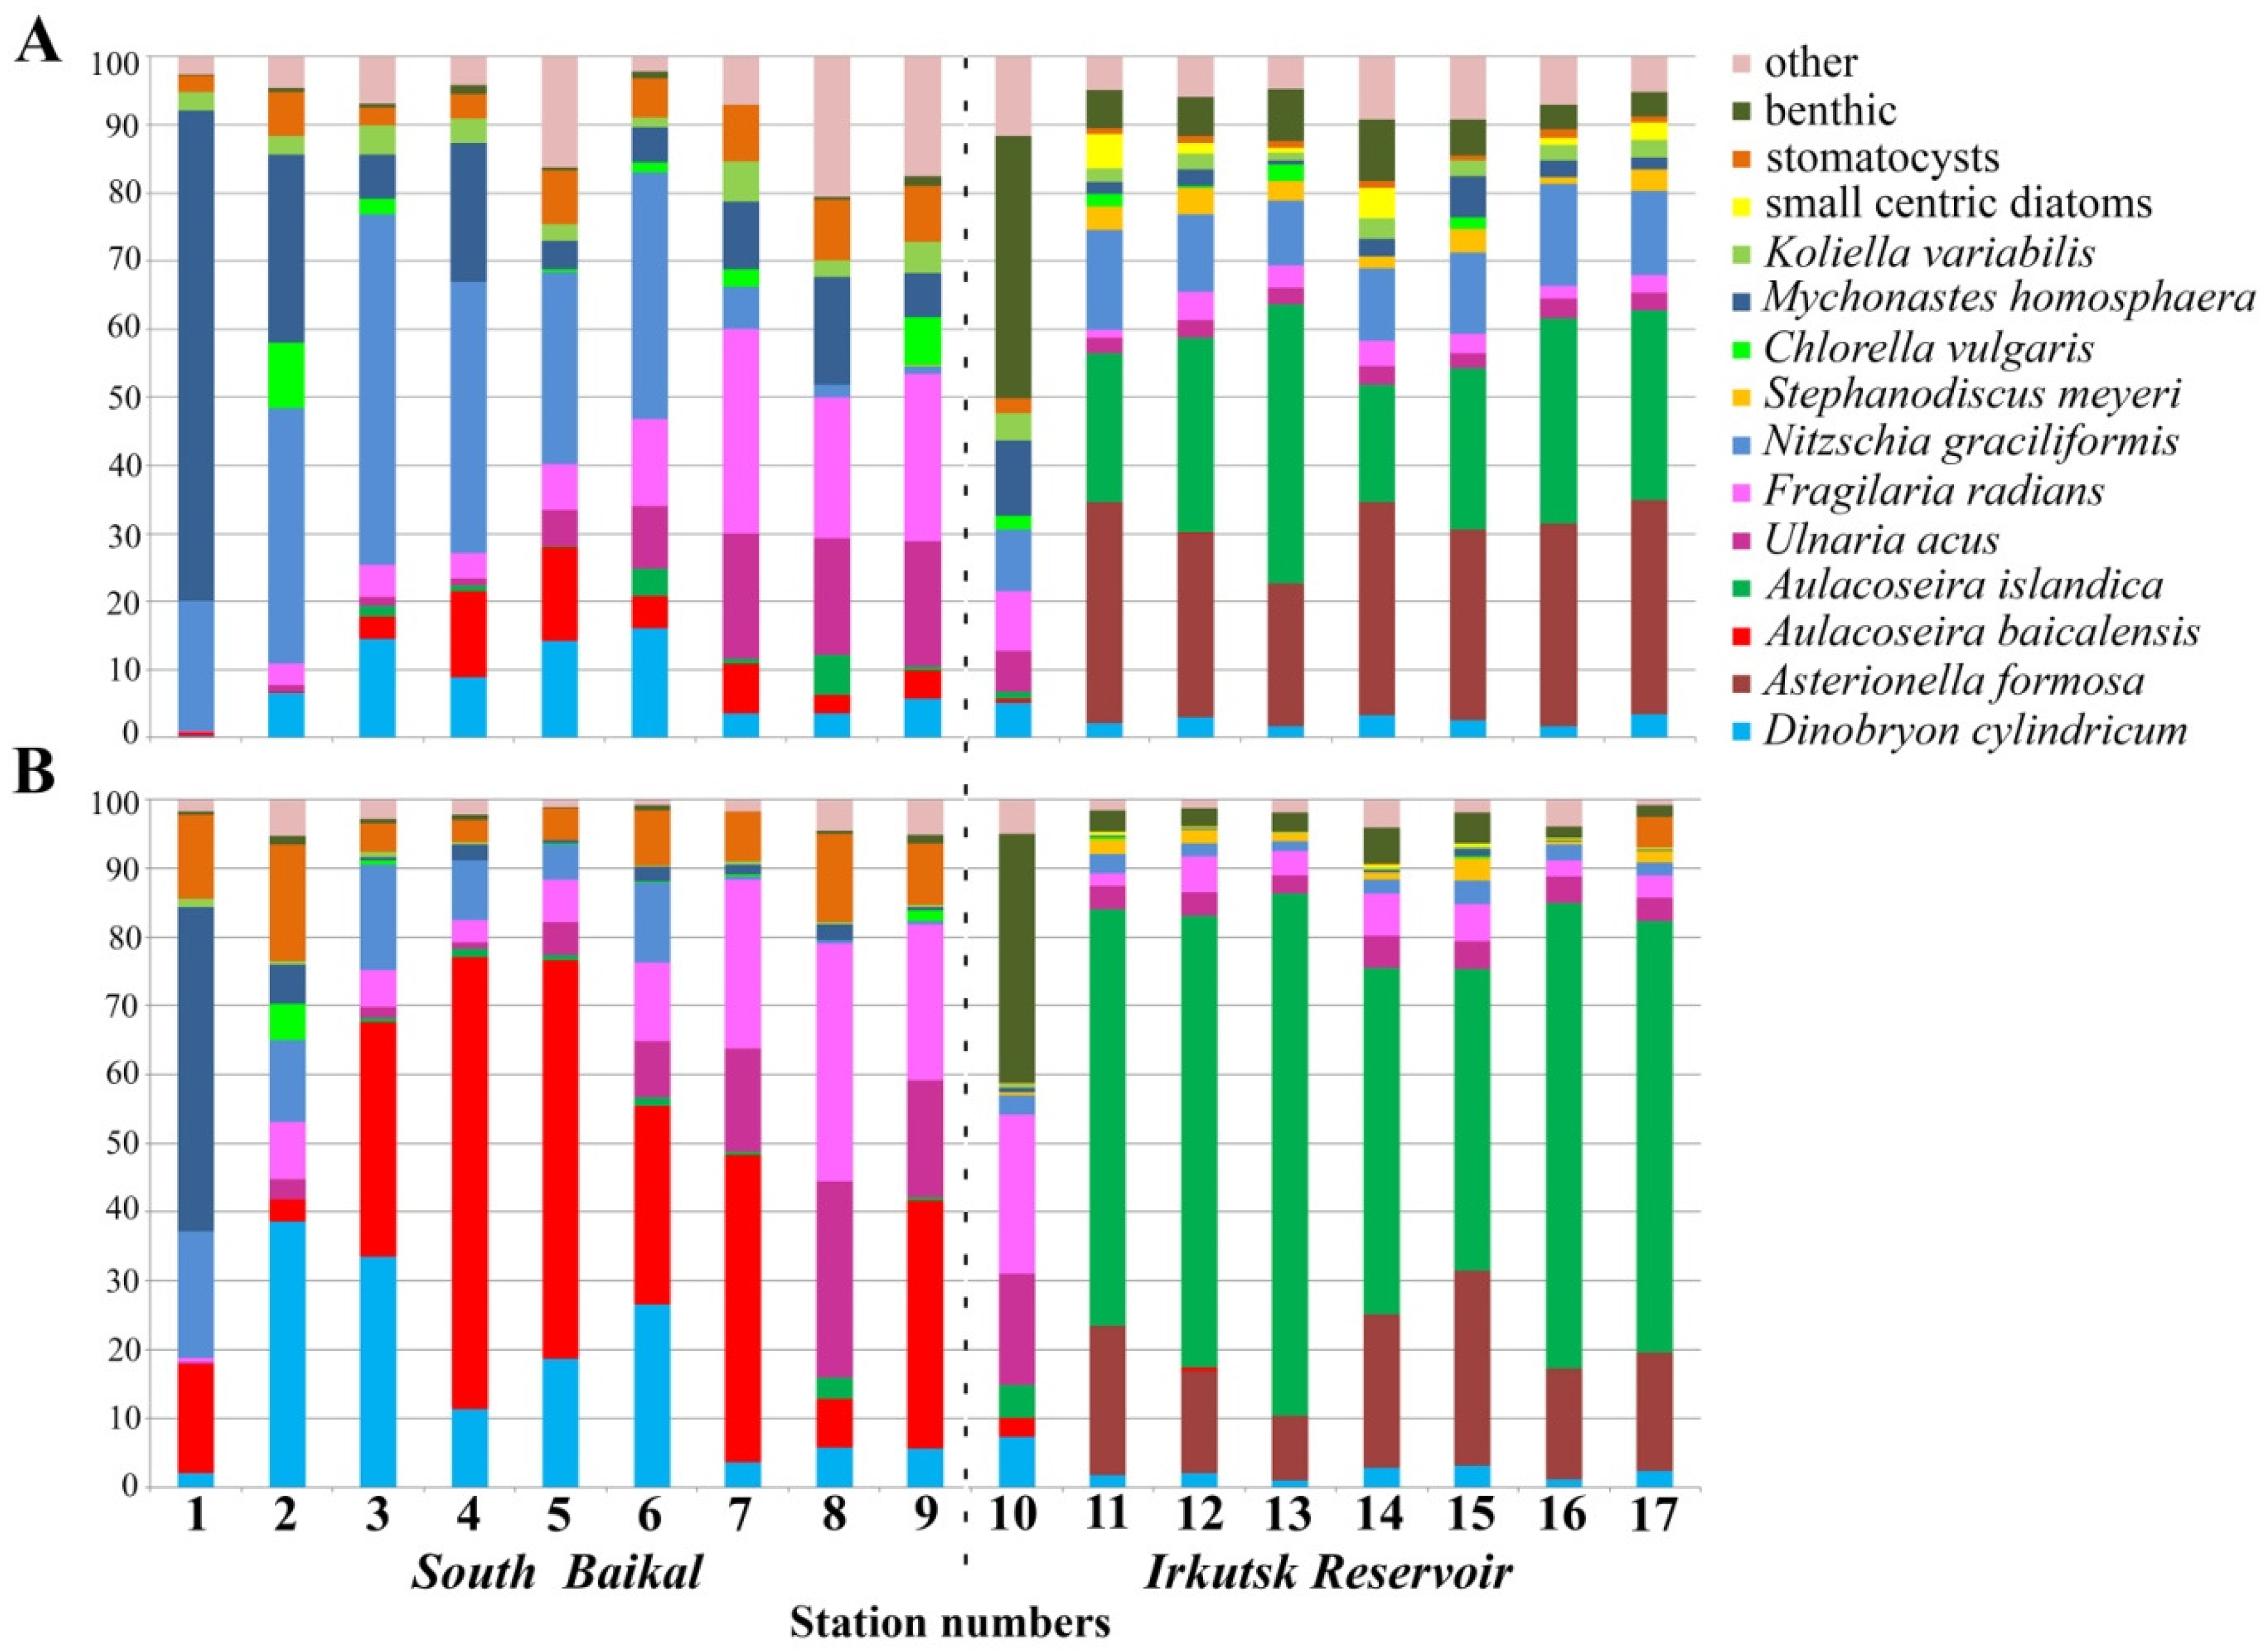
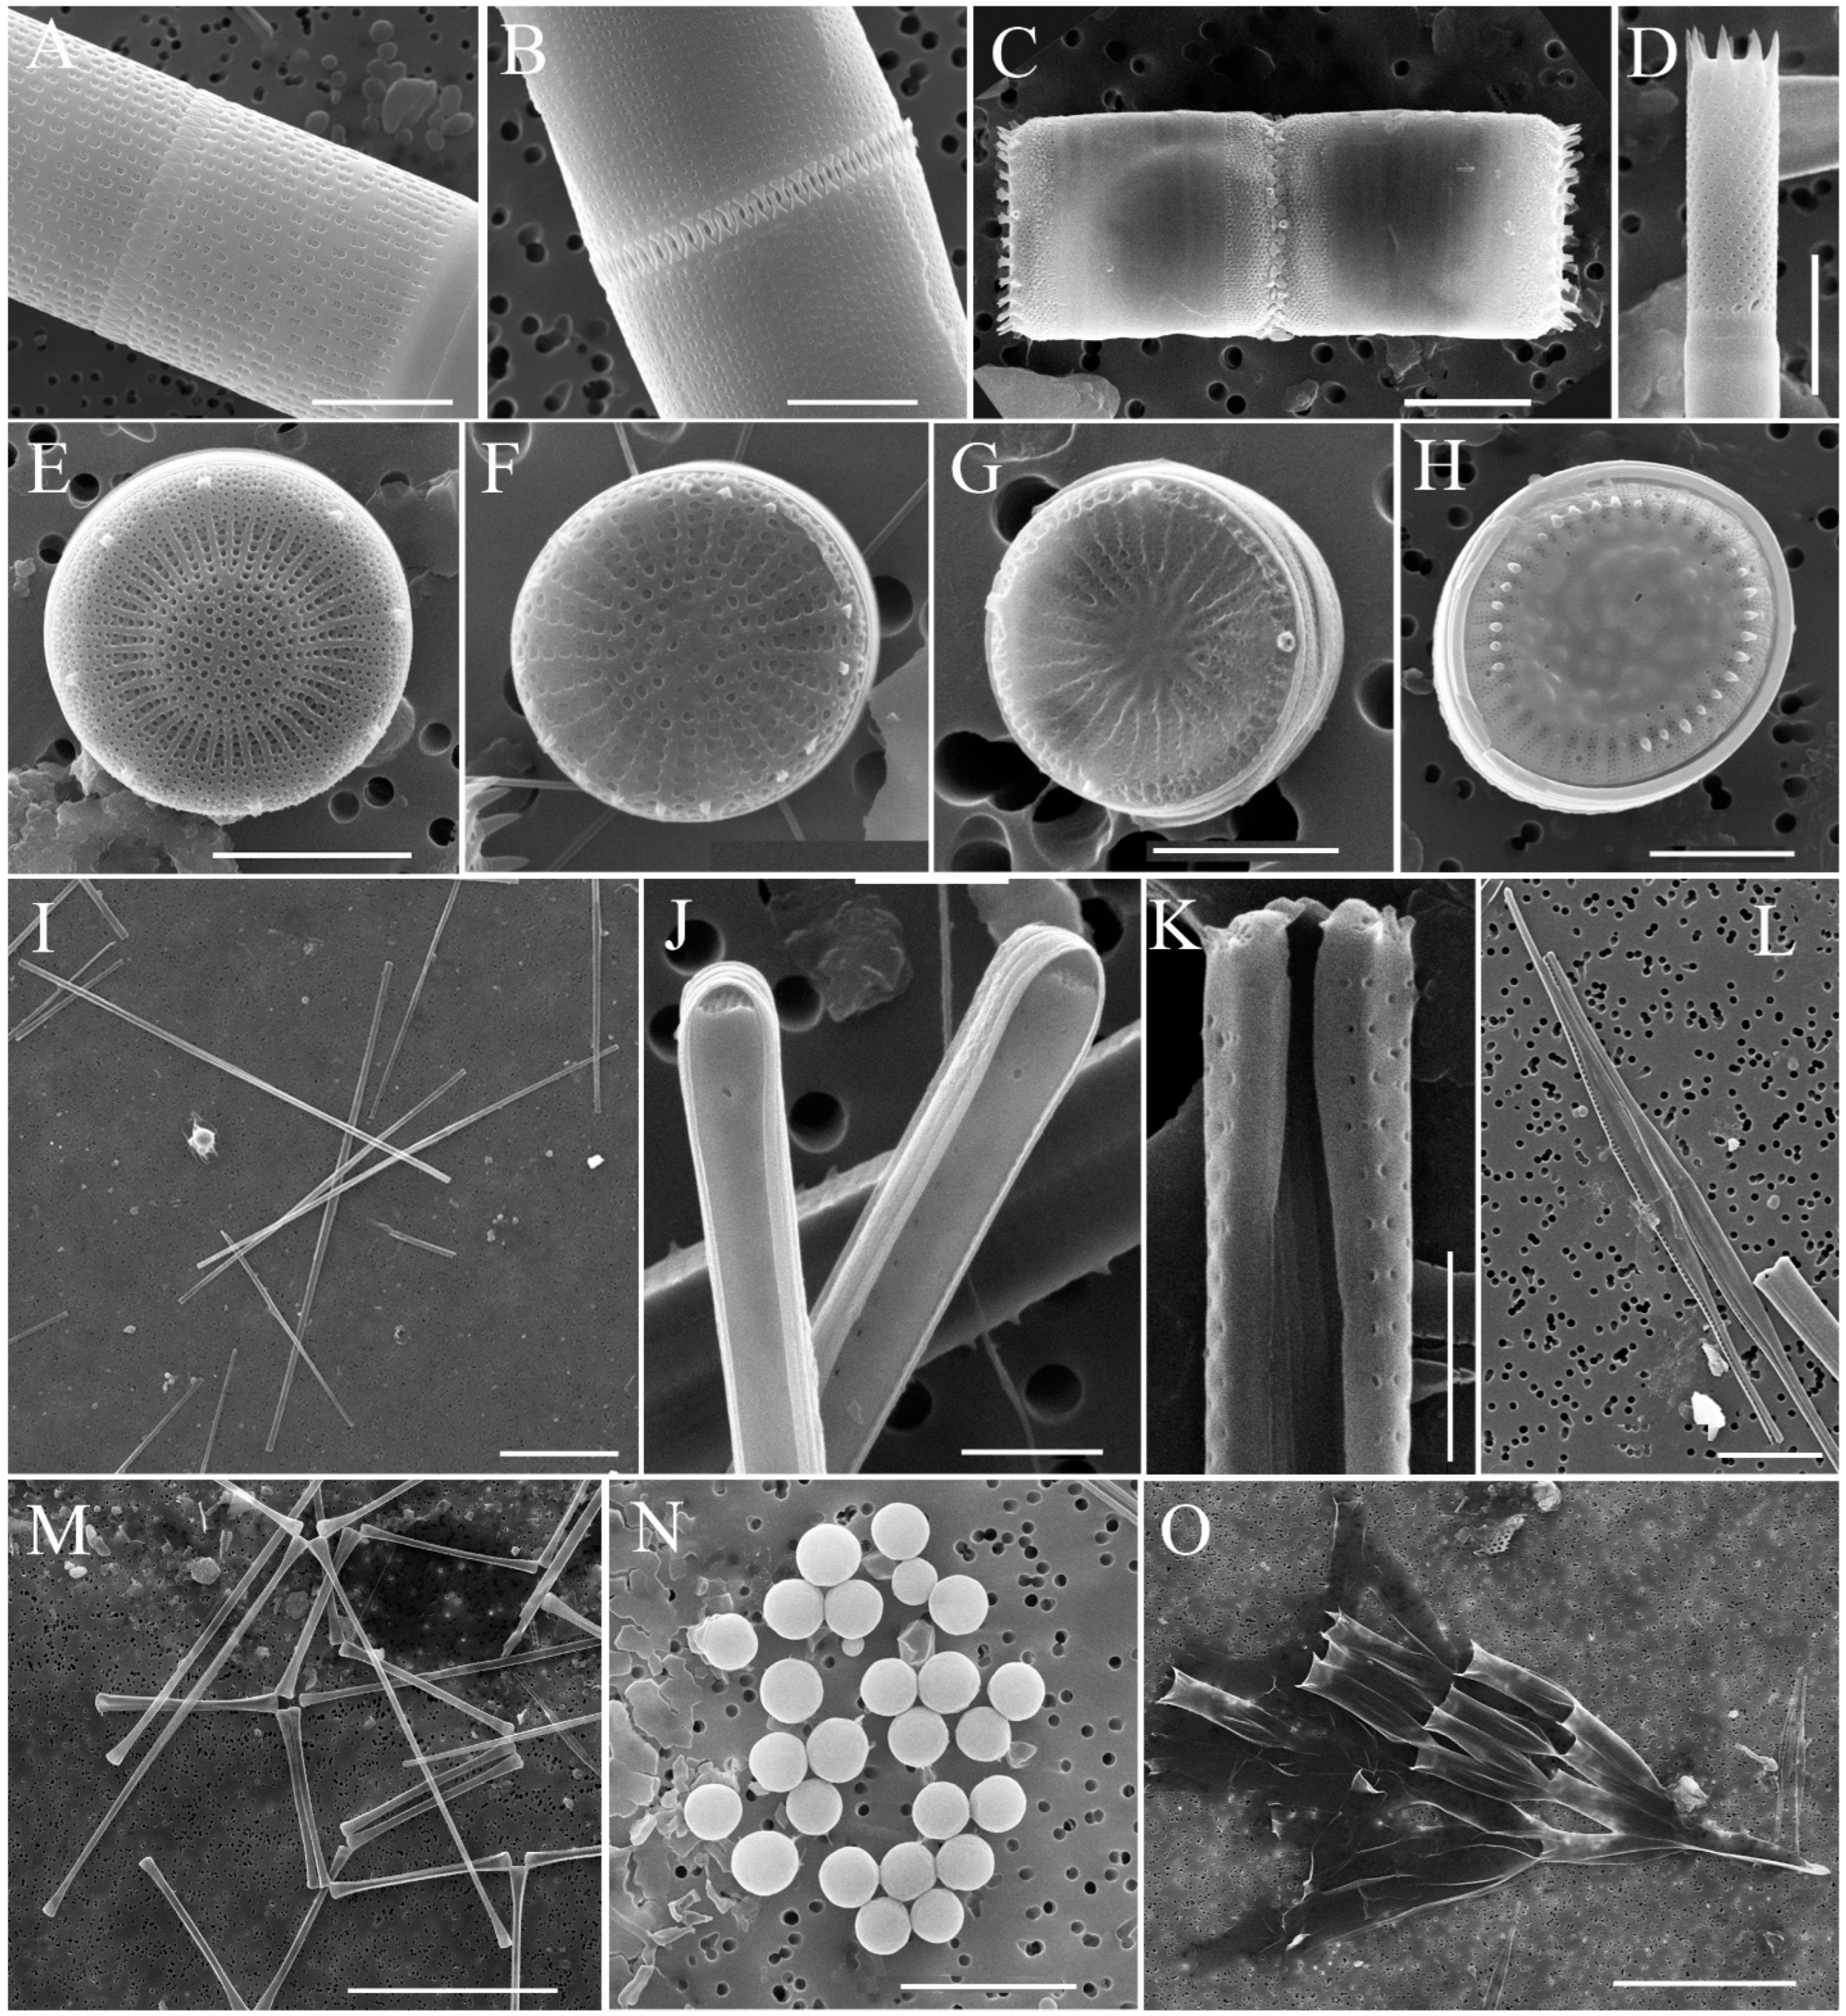
4.1. Species Composition
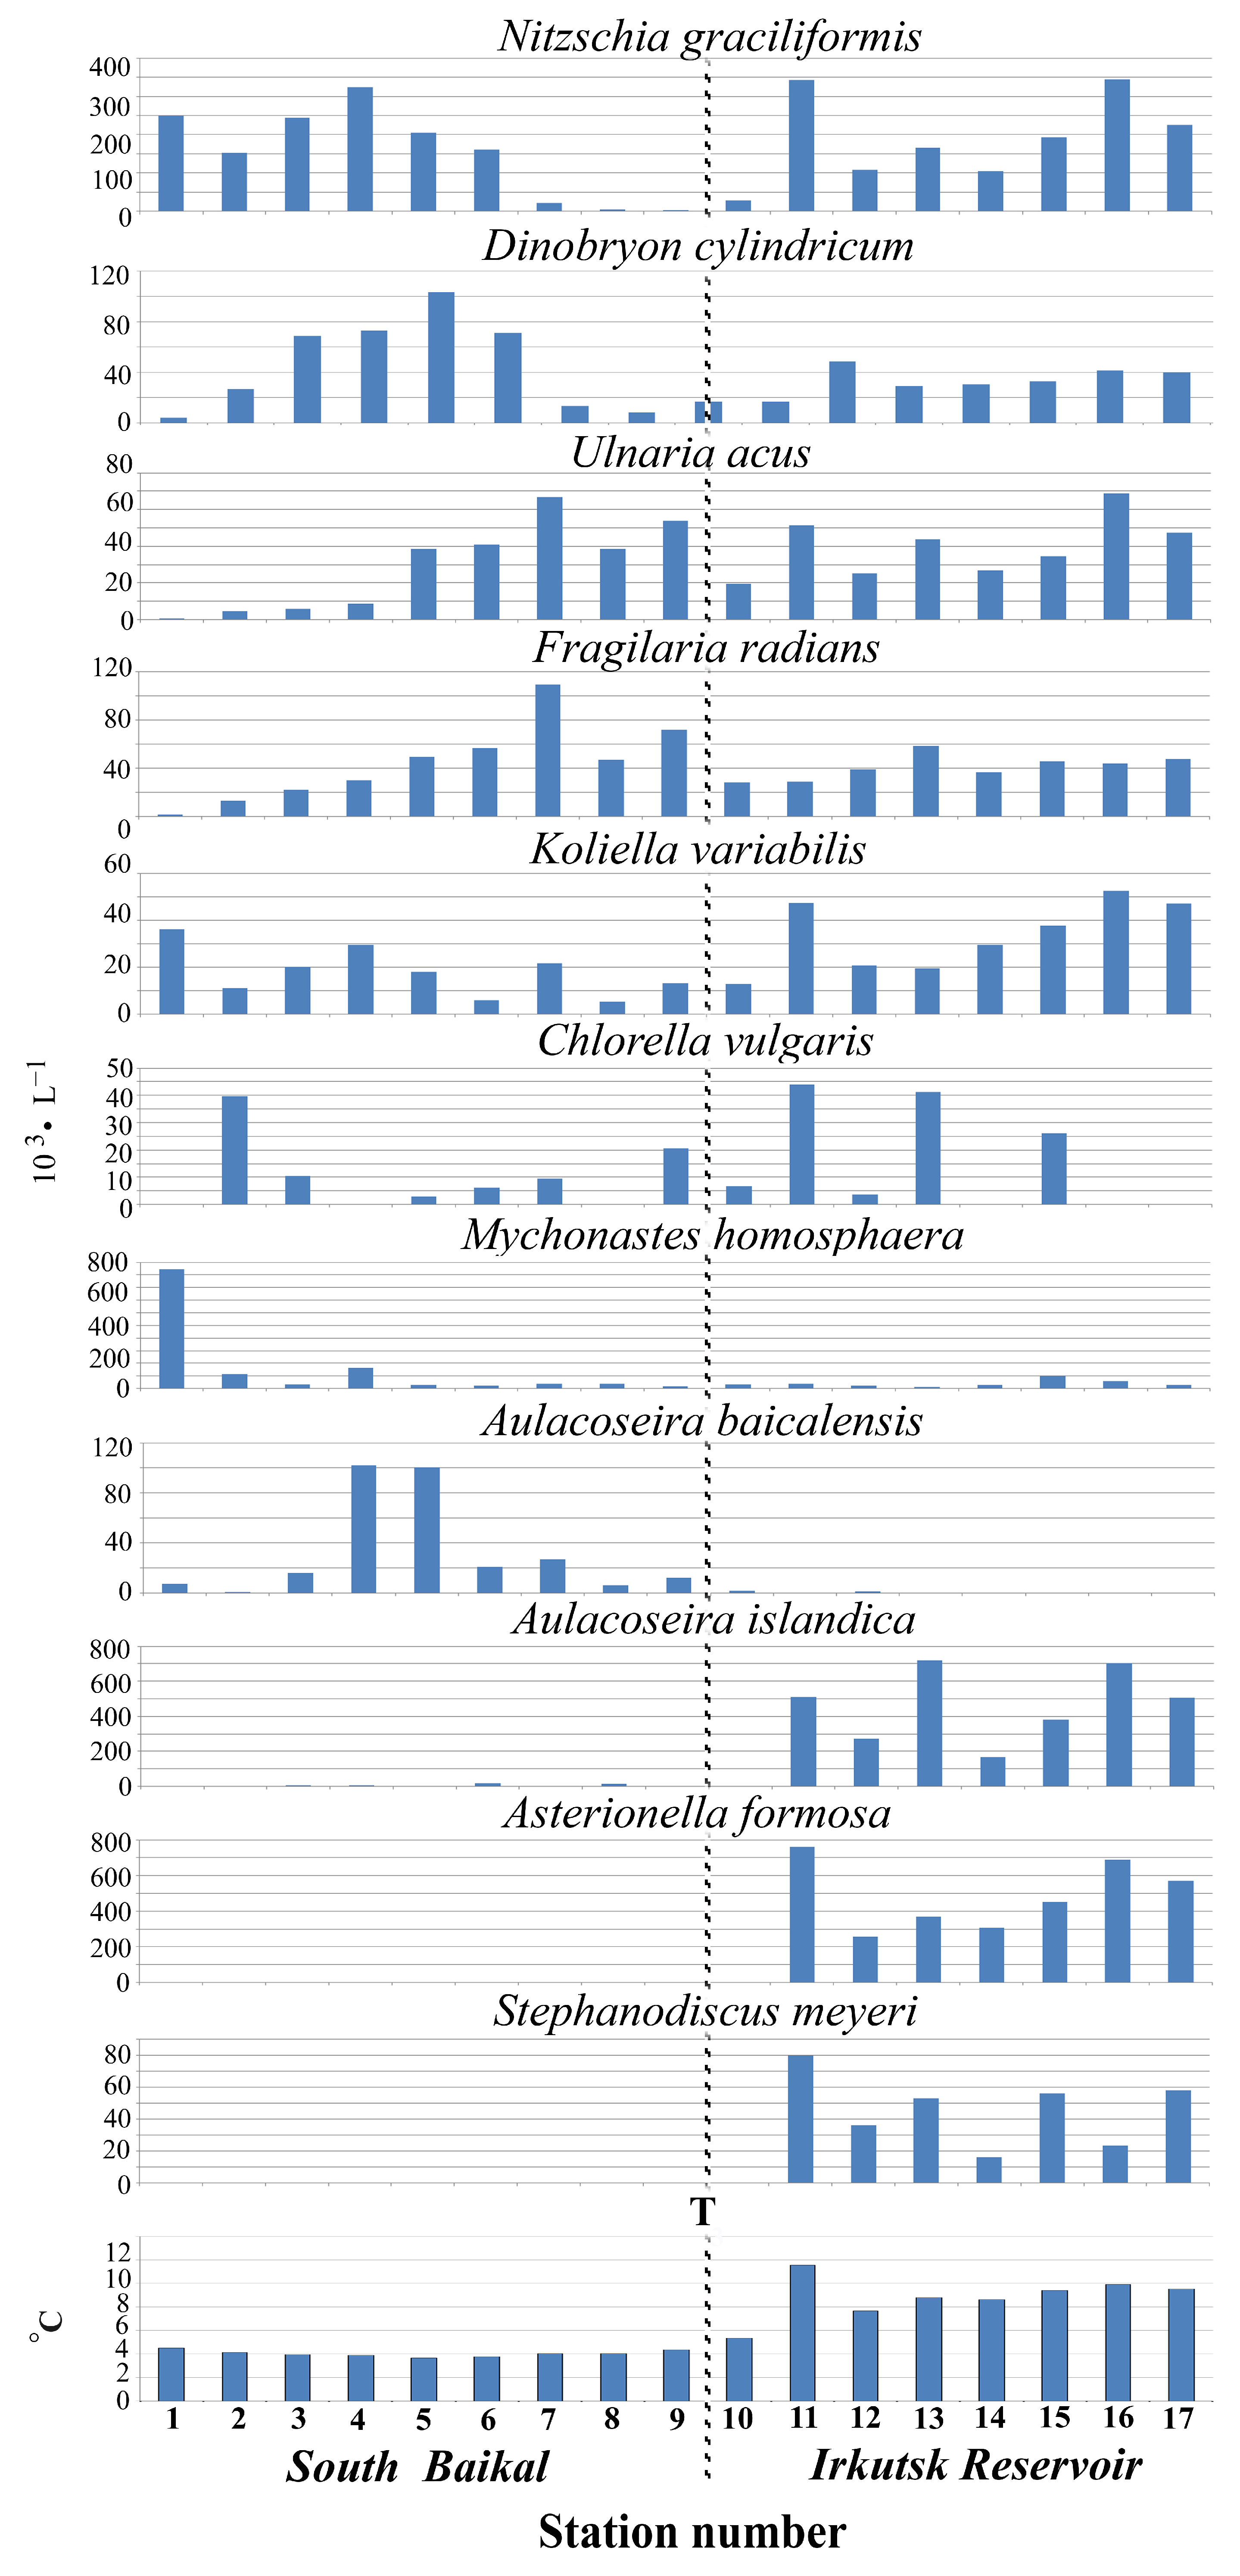
4.2. Abundance of Phytoplankton and Dominant Species
4.3. Peculiarities of Phytoplankton in the Bays of the Irkutsk Reservoir
4.4. Analysis of Factors Affecting the Species Structure of Phytoplankton Communities
5. Discussion
6. Conclusions
Author Contributions
Funding
Institutional Review Board Statement
Data Availability Statement
Acknowledgments
Conflicts of Interest
References
- Tarasova, N.G.; Burkova, T.N. Phytoplankton of the Kuibyshev reservoir in August 2008. Proc. Samara Sci. Cent. Russ. Acad. Sci. 2012, 12, 174–178. (In Russian) [Google Scholar]
- Krivina, E.S.; Tarasova, N.G. Phytoplankton of the Saratov reservoir: Taxonomic composition and ecological and geographical characteristics. Samar. Luka Probl. Reg. Glob. Ecol. 2013, 22, 47–62. (In Russian) [Google Scholar]
- Khaliullina, L.Y.; Yakovlev, V.A. Phytoplankton of Shallow Waters in the Upper Reaches of the Kuibyshev Reservoir; Publishing House of the Academy of Sciences of the Republic of Tatarstan: Kazan, Russia, 2015; p. 171. (In Russian) [Google Scholar]
- Korneva, L.G. Phytoplankton of Reservoirs of the Volga Basin; Kostroma Printing House: Kostroma, Russia, 2015; p. 284. [Google Scholar]
- Ivanova, E.A. Dynamics and Functional Role of Phytoplankton in Ecosystems of Reservoirs in the Upper Yenisei Basin. Ph.D. Thesis, FGOU VPO “Krasnoyarsk State Agrarian University”, Krasnoyarsk, Russia, 2004. (In Russian). [Google Scholar]
- Ponomareva, Y.A. Structure and Dynamics of Potamophytoplankton of the Yenisei River in the Lower Pool of the Krasnoyarsk HPP. Ph.D. Thesis, FGAOU VPO “Siberian Federal University” and FGBUN “Institute for Computational Modeling of the Siberian Branch of the Russian Academy of Sciences”, Krasnoyarsk, Russia, 2015. (In Russian). [Google Scholar]
- Jayani, E.A. Spatial and Temporal Dynamics of Phytoplankton of the Semiarid Zone Reservoir under Conditions of Significant Fluctuations in Weather and Hydrological Factors (on the Example of the Iriklinsky Reservoir). Ph.D. Thesis, Saratov Branch of the Federal State Budgetary Scientific Institution “All-Russian Research Institute of Fisheries and Oceanography”, Nizhny Novgorod, Russia, 2022. (In Russian). [Google Scholar]
- Mikhailov, V.V. Evaluation of the Current Ecological State of the Novosibirsk Reservoir Based on Indicators of Phytoplankton Development. Ph.D. Thesis, Federal State Budgetary Educational Institution Higher Education “Omsk State Agrarian University. P.A. Stolypin”, Tyumen, Russia, 2020. (In Russian). [Google Scholar]
- Bazhenova, O.P.; Mikhailov, V.V. Phytoplankton as an indicator of the modern ecological state of the Novosibirsk reservoir. Inland Water Biol. 2021, 14, 670–678. [Google Scholar] [CrossRef]
- Vorobyova, S.S. Phytoplankton of the Ust’-Ilimsk Reservoir. In Biology of the Ust’-Ilimsk Reservoir; Skryabin, A.G., et al., Eds.; Nauka: Novosibirsk, Russia, 1987; pp. 8–75. (In Russian) [Google Scholar]
- Vorobyova, S.S. Fitoplankton Vodoemov Angary (Phytoplankton of Water Bodies Formed on the Angara River); Nauka: Novosibirsk, Russia, 1995; p. 126. (In Russian) [Google Scholar]
- Kozhova, O.M.; Shirobokova, N.P. Phytoplankton of the Bratsk Reservoir and Prediction of Its State: Long-Term Forecasting of the State of Ecosystems; Nauka: Novosibirsk, Russia, 1988; pp. 69–92. (In Russian) [Google Scholar]
- Popovskaya, G.I.; Firsova, A.D.; Bessudova, A.Y.; Sakirko, M.V.; Suturin, A.N.; Likhoshway, Y.V. Phytoplankton of the Irkutsk Reservoir As an Indicator of Water Quality. Oceanol. Hydrobiol. Stud. 2012, 41, 29–38. [Google Scholar] [CrossRef]
- Guo, S.; Zhu, D.; Chen, Y. Modelling and Analyzing a Unique Phenomenon of Surface Water Temperature Rise in a Tropical, Large, Riverine Reservoir. Water Resour. Manag. 2023, 37, 1711–1727. [Google Scholar] [CrossRef]
- Pham, T.L.; Tranb, T.H.Y.; Thanh, T.T. Factors affecting the seasonal succession of phytoplankton functional groups in a tropical floodplain reservoir in Vietnam. AQUA Water Infrastruct. Ecosyst. Soc. 2022, 71, 401. [Google Scholar] [CrossRef]
- Ochieng, B.; Mbao, E.O.; Zhang, Z.; Shi, L.; Liu, Q. Phytoplankton community structure of Tang-Pu Reservoir: Status and ecological assessment in relation to physicochemical variability. Environ. Monit. Assess. 2022, 194, 382. [Google Scholar] [CrossRef]
- Njine, T.; Kemka, N.; Togouet, S.H.Z.; Nola, M.; Niyitegeka, D.; Etoundi, A.T.P.; Menbohan, S.F. Peuplement phytoplanctonique et qualité des eaux en milieu lacustre anthropisé: Cas du lac municipal de Yaoundé (Cameroun). Afr. J. Sci. Technol. 2007, 8, 3951. [Google Scholar]
- Kouassi, B.A.T.; Komoé, K.; N’guessan, K.R. Relationships between Phytoplankton Structure and Environmental Variables in an African Tropical Reservoir. Int. J. Sci. Res. 2023, 10, 356–362. [Google Scholar] [CrossRef]
- Meshcherskaya, A.V.; Golod, M.P.; Belyankina, I.G. Fluctuations in the level of the Caspian Sea in connection with the features of the general circulation of the atmosphere in the twentieth century. In Climate Change and Its Consequences; Nauka: St. Petersburg, Russia, 2002; pp. 180–194. (In Russian) [Google Scholar]
- Climate Change 2007: The Physical Science Basis: Contribution of Working Group I to the Fourth Assessment Report of the Intergovernmental Panel on Climate Change; Cambridge University Press: Cambridge, UK; New York, NY, USA, 2007; pp. 1–996.
- Sterner, R.W.; Elser, J.J.; Fee, E.J.; Guildford, S.J.; Chrzanowski, T.H. The light: Nutrient ratio in lakes: The balance of energy and materials affects ecosystem structure and process. Am. Nat. 1997, 150, 663–684. [Google Scholar] [CrossRef]
- Fadel, A.; Atoui, A.; Lemaire, B.J.; Vincon-Leite, B.; Slim, K. Environmental factors associated with phytoplankton succession in a Mediterranean Reservoir with a highly fluctuating water level. Environ. Monit. Assess. 2015, 187, 633. [Google Scholar] [CrossRef] [PubMed]
- Butorin, N.V.; Litvinov, A.S.; Trifonova, N.A. Abiotic Factors of Formation of Water Quality of the Upper Volga Reservoirs: Structure and Functioning of Freshwater Ecosystems; Nauka: Leningrad, Russia, 1988; pp. 24–41. [Google Scholar]
- Kozhova, O.M. Fitoplankton Irkutskogo Vodokhranilishcha (Phytoplankton of the Irkutsk Reservoir); Nauka: Moscow, Russia, 1964; pp. 41–114. (In Russian) [Google Scholar]
- Sladeček, V. System of Water Quality from the Biological Point of View; Ergebnisse der Limnologie; Schweizerbart Science Publishers: Stuttgart, Germany, 1973; Volume 7, pp. 1–128. [Google Scholar]
- Makrushin, A.V. Biological Analysis of Water Quality; Nauka: Leningrad, Russia, 1974; p. 64. (In Russian) [Google Scholar]
- Barinova, S.S.; Medvedeva, L.A.; Anissimova, O.V. Diversity of Algal Indicators in Environmental Assessment; Pilies Studio: Tel Aviv, Israel, 2006; p. 498. [Google Scholar]
- Zanmenskii, V.A.; Yanter, N.N. (Eds.) Irkutskoe Vodokhranilishche: Gidrometeorologicheskii Rezhim Ozer and Vodokhranilishch (The Irkutsk Reservoir: Hydrochemical Regimes in Lakes and Reservoirs); Gidrometeoizdat: Leningrad, Russia, 1980; p. 140. (In Russian) [Google Scholar]
- Grachev, M.A. On the Current State of Lake Baikal Ecosystem; Sibirskoe Otdelenie Rossiyskoy Akademii Nauk: Novosibirsk, Russia, 2002; pp. 1–153. (In Russian) [Google Scholar]
- Sadchikov, A.P. Metody Izucheniya Presnovodnogo Fitoplanktona: Metodicheskoe Rukovodstvo; Universitet i Shkola: Moscow, Russia, 2003; p. 157. (In Russian) [Google Scholar]
- Kiselev, I.A. Phytoplankton of Seas and Continental Water Bodies; Nauka: Leningrad, Russia, 1969; p. 439. (In Russian) [Google Scholar]
- Makarova, I.V.; Pichkily, L.O. On some aspects of methods for calculating the biomass of phytoplankton. Bot. Zh. 1970, 55, 1488–1495. (In Russian) [Google Scholar]
- Belykh, O.I.; Bessudova, A.Y.; Gladkih, A.S.; Kuz’mina, A.E.; Pomazkina, G.V.; Popovskaya, G.I.; Sorokovikova, E.G.; Tihonova, I.V.; Usol’ceva, M.V.; Firsova, A.D. Guidelines for Determining the Biomass of Phytoplankton Species of Lake Baikal Pelagial: A Methodological Guide; Izd-vo IGU: Irkutsk, Russia, 2011; p. 53. (In Russian) [Google Scholar]
- Bessudova, A.; Galachyants, Y.; Firsova, A.; Hilkhanova, D.; Nalimova, M.; Marchenkov, A.; Mikhailov, I.; Sakirko, M.; Likhoshway, Y. Changes in diversity of silica-scaled Chrysophytes during the lake–river–reservoir transition (Baikal–Angara–Irkutsk Reservoir). Life, 2023; 13, in press. [Google Scholar]
- ISO 7890-3:1988; Water Quality—Determination of Nitrate—Part 3: Spectrometric Method Using Sulfosalicylic Acid. International Organization for Standardization: Geneva, Switzerland, 1988.
- Wetzel, R.; Likens, G. Limnological Analysis, 3rd ed.; Springer: New York, NY, USA, 2000; pp. 57–112. [Google Scholar]
- ISO 6878:2004; Water Quality—Determination of Phosphorus—Ammonium Molybdate Spectrometric Method. International Organization for Standardization: Geneva, Switzerland, 2004.
- Oksanen, J.; Simpson, G.L.; Blanchet, G.F.; Kindt, R.; Legendre, P.; Minchin, P.R.; O’Hara, R.B.; Solymos, P.; Stevens, M.H.H.; Szoecs, E.; et al. Vegan: Community Ecology Package. R Package Version 2.5-6. 2022. Available online: https://CRAN.R-project.org/package=vegan (accessed on 29 August 2023).
- Legendre, P.; Gallagher, E.D. Ecologically meaningful transformations for ordination of species data. Oecologia 2001, 129, 271–280. [Google Scholar] [CrossRef] [PubMed]
- CRAN—Package ggpubr. Available online: https://cran.r-project.org/web/packages/ggpubr/index.html (accessed on 29 August 2023).
- Shimaraev, M.N.; Verbolov, V.I.; Granin, N.G.; Sherstayankin, P.P. Physical Limnology of Lake Baikal: A Review; Baikal International Center for Ecological Research: Irkutsk, Russia, 1994; p. 81. [Google Scholar]
- Pomazkina, G.V.; Belykh, O.I.; Domysheva, V.M.; Sakirko, M.V.; Gnatovsky, R.Y. Structure and dynamics of phytoplankton of Southern Baikal (Russia). Int. J. Algae 2010, 12, 64–79. [Google Scholar] [CrossRef]
- Popovskaya, G.I.; Usoltseva, M.V.; Domysheva, V.M.; Sakirko, M.V.; Blinov, V.V.; Hodger, T.V. The spring phytoplankton in the pelagic zone of Lake Baikal during 2007–2011. Geogr. Nat. Resour. 2015, 36, 253–262. [Google Scholar] [CrossRef]
- Mikhailov, I.S.; Galachyants, Y.P.; Bukin, Y.S.; Petrova, D.P.; Bashenkhaeva, M.V.; Sakirko, M.V.; Blinov, V.V.; Titova, L.A.; Zakharova, Y.R.; Likhoshway, Y.V. Seasonal succession and coherence among bacteria and microeukaryotes in Lake Baikal. Microb. Ecol. 2022, 84, 404–422. [Google Scholar] [CrossRef]
- Bessudova, A.; Domysheva, V.M.; Firsova, A.D.; Likhoshway, Y.V. Silica-scaled chrysophytes of Lake Baikal. Acta Biol. Sib. 2017, 3, 47–56. [Google Scholar] [CrossRef]
- Popovskaya, G.I.; Genkal, S.I.; Likhoshway, Y.V. Diatoms of the Plankton of Lake Baikal: Atlas and Key; Nauka: Novosibirsk, Russia, 2016; p. 180. [Google Scholar]
- Trifonova, I.S. Phytoplankton Composition and Production in Lakes of Different Types on the Karelian Isthmus; Nauka: Leningrad, Russia, 1979; p. 168. (In Russian) [Google Scholar]
- Kitaev, S.P. Ecological Bases of Biological Production in Lakes of Different Natural Zones; Nauka: Moscow, Russia, 1984; p. 207. (In Russian) [Google Scholar]
- Methods for Assessing Water Quality by Hydrobiological Indicators: Educational and Methodological Development for the Course “Hydrobiology”; KFU: Kazan, Russia, 2015; p. 44. (In Russian)
- Du, Y.-Y.; Liao, C.-S.; Yang, Z.-Y.; Lou, Z.-Y.; Zhang, Y.-P.; Wang, H.; Wang, T. Community structures of phytoplankton and its relationship with environmental factors in the liujiaxia reservoir. Acta Hydrobiol. Sin. 2021, 45, 1299–1307. [Google Scholar] [CrossRef]
- Zhang, Y.; Peng, C.; Wang, J.; Huang, S.; Hu, Y.; Zhang, J.; Li, D. Temperature and silicate are significant driving factors for the seasonal shift of dominant diatoms in a drinking water reservoir. J. Oceanol. Limnol. 2019, 37, 568–579. [Google Scholar] [CrossRef]
- Shen, H.; Li, B.; Cai, Q.; Han, Q.; Gu, Y.; Qu, Y. Phytoplankton functional groups in a high spatial heterogeneity subtropical reservoir in China. J. Great Lakes Res. 2014, 40, 859–869. [Google Scholar] [CrossRef]


| Station Number | Station Name | Coordinates N/E | Max Depth, m | S, m | Water T, °C | pH | Si, mg·L−1 | PO43−, mg·L−1 | NO3−, mg·L−1 |
|---|---|---|---|---|---|---|---|---|---|
| 1. | 12 km from Kultuk | 51° 40.578/ 103° 52.309 | 1250 | 22.0 | 4.51 | 7.18 | 0.52 | 0.022 | 0.41 |
| 2. | 3 km from Marituy | 51° 45.546/ 104° 13.222 | 1337 | 18.0 | 4.13 | 7.90 | 0.53 | 0.023 | 0.40 |
| 3. | Marituy-Solzan | 51° 38.710/ 104° 13.715 | 1243 | 21.0 | 3.95 | 8.02 | 0.43 | 0.020 | 0.36 |
| 4. | 3 km from Solzan | 51° 31.428/ 104° 14.417 | 350 | 12.0 | 3.98 | 8.24 | 0.17 | 0.015 | 0.29 |
| 5. | Cape Tolsty-Snezhnaya River | 51° 36.402/ 104° 44.147 | 1120 | - | 3.66 | 8.17 | 0.20 | 0.018 | 0.29 |
| 6. | 3 km from Tankhoi | 51° 35.440/ 105° 06.968 | 1402 | 10.0 | 3.76 | 8.06 | 0.40 | 0.018 | 0.34 |
| 7. | Cape Kadilny-Mishikha | 51° 46.731/ 105° 22.528 | 1424 | 18.0 | 4.03 | 8.06 | 0.49 | 0.022 | 0.40 |
| 8. | Listvyanka-Tankhoi | 51° 42.262/ 105° 00.720 | 700 | 17.0 | 4.02 | 8.04 | 0.50 | 0.023 | 0.40 |
| 9. | 3 km from Listvyanka | 51° 49.033/ 104° 54.616 | 1434 | 18.0 | 4.35 | 8.02 | 0.53 | 0.023 | 0.41 |
| 10. | Burduguz | 52° 04.105/ 104° 59.451 | 15.5 | - | 5.33 | 8.10 | 0.56 | 0.019 | 0.37 |
| 11. | Kurma Bay | 52° 06.845/ 104° 45.926 | 9.7 | 4.0 | 11.55 | 8.57 | 0.42 | 0.007 | 0.04 |
| 12. | center against Kurma Bay | 52° 10.874/ 104 °47.935 | 17 | 5.0 | 7.66 | 8.27 | 0.52 | 0.016 | 0.22 |
| 13. | Elovy Bay | 52° 09.906/ 104° 29.172 | 10 | 3.5 | 8.8 | 8.52 | 0.48 | 0.012 | 0.15 |
| 14. | center against Elovy Bay | 52° 14.548/ 104° 45.243 | 25 | - | 8.63 | 8.29 | 0.52 | 0.015 | 0.24 |
| 15. | center against Ershovsky Bay | 52° 21.511/ 104° 37.550 | 27 | 4.5 | 9.4 | 8.39 | 0.49 | 0.011 | 0.15 |
| 16. | Ershovsky Bay | 52° 20.851/ 104° 34.439 | 16 | 3.0 | 9.9 | 8.42 | 0.40 | 0.011 | 0.12 |
| 17. | head water | 52° 23.478/ 104° 33.722 | 25 | 3.5 | 9.53 | 8.48 | 0.47 | 0.010 | 0.11 |
| Species | Sap | Station Number | ||||||||||||||||
|---|---|---|---|---|---|---|---|---|---|---|---|---|---|---|---|---|---|---|
| South Baikal | Irkutsk Reservoir | |||||||||||||||||
| 1 | 2 | 3 | 4 | 5 | 6 | 7 | 8 | 9 | 10 | 11 | 12 | 13 | 14 | 15 | 16 | 17 | ||
| Cyanobacteria | ||||||||||||||||||
| Cyanodictyon planctonicum Mayer | + | + | + | + | + | + | + | |||||||||||
| Gomphosphaeria aponina Kützing | ο | + | ||||||||||||||||
| Limnococcus limneticus (Lemmermann) Komárková, Jezberová, Komárek & Zapomelová | + | + | ||||||||||||||||
| Lyngbya sp. | + | |||||||||||||||||
| Merismopedia tenuissima Lemmermann | β-α | + | + | |||||||||||||||
| Microcystis sp. | + | + | + | + | + | + | + | + | + | |||||||||
| Pseudanabaena galeata Böcher | α | + | + | + | + | + | ||||||||||||
| Romeria sp. | + | + | + | |||||||||||||||
| Synechocystis limnetica Popovskaja | ο | + | + | + | + | + | + | + | + | + | ||||||||
| Spirulina minima var. baicalia Kobanova | + | + | ||||||||||||||||
| Cryptophyta | ||||||||||||||||||
| Cryptomonas gracilis Skuja | ο | + | + | |||||||||||||||
| C. ovata Ehrenberg | β-α | + | + | + | ||||||||||||||
| Komma caudata (Geitler) Hill | β | + | + | + | + | + | ||||||||||||
| Rhodomonas lens Pascher & Ruttner | + | + | + | + | + | + | + | |||||||||||
| R. pusilla (Bachmann) Javornický | β-ο | + | + | + | + | + | + | + | + | + | + | + | + | + | ||||
| Dinophyta | ||||||||||||||||||
| Apocalathium baicalense (Kisselev & Zvetkov) Craveiro, Daugbjerg, Moestrup & Calado | ο | + | ||||||||||||||||
| Dinophyta sp. | + | + | + | + | + | + | + | |||||||||||
| Glenodinium sp. | + | + | + | + | + | + | + | + | + | + | + | + | + | + | + | + | ||
| Gymnodinium baicalense Antipova | ο | + | + | + | ||||||||||||||
| G. helveticum (Penard) Takano & Horiguchi | + | + | ||||||||||||||||
| Haptophyta | ||||||||||||||||||
| Chrysochromulina parva Lackey | + | + | + | + | + | + | + | + | + | + | + | + | + | + | + | + | ||
| Chrysophyta | ||||||||||||||||||
| Chrysococcus rufescens Klebs | ο-β | + | + | + | + | |||||||||||||
| Chrysolykos planctonicus Mack | ο | + | + | + | ||||||||||||||
| Chrysosphaera melosirae (Meyer) Bourrelly | + | |||||||||||||||||
| Chrysosphaerella baicalensis Popovskaya | + | + | + | + | + | + | + | + | + | + | + | + | + | + | + | + | ||
| C. brevispina Korshikov | + | + | + | + | + | + | + | + | + | + | ||||||||
| C. coronacircumspina Wujek & Kristiansen | + | + | ||||||||||||||||
| Dinobryon bavaricum Imhof | ο | + | ||||||||||||||||
| D. cylindricum Imhof | ο-β | + | + | + | + | + | + | + | + | + | + | + | + | + | + | + | + | + |
| D. divergens Imhof | ο-α | + | + | + | + | |||||||||||||
| D. korshikovii Matvienko ex Kapustin | + | + | + | + | + | + | + | |||||||||||
| D. sertularia Ehrenberg | ο-α | + | + | + | + | |||||||||||||
| D. sociale (Ehrenberg) Ehrenberg | β | + | + | + | + | + | + | + | + | + | ||||||||
| D. suecicum Lemmermann | ο | + | + | + | + | + | + | + | + | + | + | + | + | + | ||||
| Kephyrion littorale Lund | + | |||||||||||||||||
| Paraphysomonas bandaiensis Takahashi | + | |||||||||||||||||
| Paraphysomonas sp. 1 | + | |||||||||||||||||
| Paraphysomonas sp. 2 | + | |||||||||||||||||
| Spiniferomonas abrupta Nielsen | + | + | + | + | ||||||||||||||
| S. bourrellyi Takahashi | + | + | + | + | + | |||||||||||||
| S. cornuta Balonov | + | |||||||||||||||||
| S. silverensis Nicholls | + | + | + | + | ||||||||||||||
| S. triangularis Siver | + | + | ||||||||||||||||
| S. trioralis Takahashi | + | + | + | + | + | + | + | + | + | + | ||||||||
| S. trioralis f. cuspidata Balonov | + | + | + | + | + | + | + | + | + | + | + | + | + | + | + | + | ||
| Mallomonas acaroides Perty | ο-α | + | + | + | + | |||||||||||||
| M. alpina Pascher & Ruttner | + | + | + | + | + | + | + | + | + | + | + | + | + | + | + | + | + | |
| M. crassisquama (Asmund) Fott | + | + | + | + | + | + | + | |||||||||||
| M. elongata Reverdin | + | |||||||||||||||||
| M. grachevii Bessudova | + | + | + | |||||||||||||||
| M. punctifera Korshikov | ο-β | + | + | + | ||||||||||||||
| M. striata var. getseniae Voloshko | + | |||||||||||||||||
| M. striata Asmund | + | + | ||||||||||||||||
| M. tonsurata Teiling | ο-α | + | ||||||||||||||||
| M. trummensis Cronberg | + | |||||||||||||||||
| M. vannigera Asmund | ο-α | + | + | + | + | + | + | + | + | + | ||||||||
| Mallomonas sp. | + | + | ||||||||||||||||
| Synura echinulata Korshikov | ο-β | + | ||||||||||||||||
| S. cf. glabra (Korshikov) Škaloud & Kynclová | + | + | + | + | + | + | + | + | ||||||||||
| S. punctulosa Balonov | + | + | + | |||||||||||||||
| S. spinosa f. longispina Petersen & Hansen | + | |||||||||||||||||
| Synura sp. 1 | + | + | ||||||||||||||||
| Synura sp. 2 | + | + | + | + | + | + | + | + | ||||||||||
| Bacillariophyta | ||||||||||||||||||
| Asterionella formosa Hassall | + | + | + | + | + | + | + | |||||||||||
| Aulacoseira baicalensis (Meyer) Simonsen | χ | + | + | + | + | + | + | + | + | + | + | + | ||||||
| A. granulata (Ehrenberg) Simonsen | β-α | + | ||||||||||||||||
| A. islandica (Müller) Simonsen | ο-χ | + | + | + | + | + | + | + | + | + | + | + | + | + | + | + | + | |
| A. ambigua (Grunow) Simonsen | ο-β | + | + | |||||||||||||||
| Crateriportula inconspicua (Makarova & Pomazkina) Flower & Hakansson | ||||||||||||||||||
| Cyclostephanos dubius (Hustedt) Round | ο-β | + | + | + | + | + | + | |||||||||||
| Discostella pseudostelligera (Hustedt) Houk & Klee | + | + | + | + | + | + | + | |||||||||||
| Fragilaria radians (Kützing) Williams & Round | ο | + | + | + | + | + | + | + | + | + | + | + | + | + | + | + | + | + |
| Nitzschia graciliformis Lange-Bertalot & Simonsen emend Genkal & Popovskaya | ο | + | + | + | + | + | + | + | + | + | + | + | + | + | + | + | + | + |
| Stephanodiscus meyeri Genkal & Popovskaya | + | + | + | + | + | + | + | + | ||||||||||
| S. minutulus (Kützing) Cleve & Möller | ο-β | + | + | + | + | + | + | + | + | + | ||||||||
| Lindavia costata (Loginova, Lupikina & Khursevich) Nakov, Guillory, Julius, Theriot & Alverson | + | |||||||||||||||||
| L. minuta (Skvortzov) Nakov et al. | ο | + | + | + | + | + | + | + | + | + | + | + | + | + | ||||
| Fragilaria capucina Desmazières | ο | + | + | + | ||||||||||||||
| Hannaea baicalensis Genkal, Popovskaya & Kulikovskiy | ο | + | + | |||||||||||||||
| Tabellaria flocculosa (Roth) Kützing | ο-α | + | + | + | ||||||||||||||
| Ulnaria acus (Kützing) Aboal | β | + | + | + | + | + | + | + | + | + | + | + | + | + | + | + | + | + |
| U. ulna (Nitzsch) Compère | ο-α | + | + | + | + | + | + | |||||||||||
| Urosolenia eriensis (Smith) Round & Crawford | + | + | + | + | + | |||||||||||||
| Chlorophyta | ||||||||||||||||||
| Ankistrodesmus arcuatus Korshikov | β | + | + | + | + | + | + | + | + | + | + | + | + | + | + | + | + | |
| Chlorella vulgaris Beijerinck | + | + | + | + | + | + | + | + | + | + | + | |||||||
| Chlamydomonas proboscigera var. conferta (Korshikov) Ettl | + | |||||||||||||||||
| Coelastrum pseudomicroporum Korshikov | β | + | + | |||||||||||||||
| Desmodesmus communis (Hegewald) Hegewald | β-ο | + | + | + | + | + | ||||||||||||
| Elakatothrix genevensis (Reverdin) Hindák | ο-α | + | + | + | + | + | + | + | + | + | + | + | ||||||
| Koliella longiseta (Vischer) Hindák | β | + | + | + | + | |||||||||||||
| K. variabilis (Nygaard) Hindák | + | + | + | + | + | + | + | + | + | + | + | + | + | + | + | + | + | |
| Mucidosphaerium pulchellum (Wood) Bock, Proschold & Krienitz | β | + | + | + | + | + | + | + | ||||||||||
| Monoraphidium contortum (Thuret) Komárková-Legnerová | β | + | + | + | + | + | + | + | + | + | + | + | + | + | ||||
| M. griffithii (Berkeley) Komárková-Legnerová | β | + | + | + | + | + | + | + | + | + | + | + | + | + | + | + | ||
| M. minutum (Nägeli) Komárková-Legnerová | β | + | + | + | + | + | + | + | ||||||||||
| Mychonastes homosphaera (Skuja) Kalina & Puncochárová | α | + | + | + | + | + | + | + | + | + | + | + | + | + | + | + | + | + |
| Scenedesmus ecornis (Ehrenberg) Chodat | ο-β | + | + | |||||||||||||||
| Sphaerocystis planctonica (Korshikov) Bourrelly | + | + | ||||||||||||||||
| S. schroeteri Chodat | β-ο | + | + | |||||||||||||||
| Total number of species | 49 | 26 | 27 | 29 | 28 | 27 | 24 | 26 | 29 | 26 | 32 | 59 | 41 | 50 | 53 | 42 | 49 | 42 |
| Station number | 1 | 2 | 3 | 4 | 5 | 6 | 7 | 8 | 9 | 10 | 11 | 12 | 13 | 14 | 15 | 16 | 17 | |
| South Baikal | Irkutsk Reservoir | |||||||||||||||||
| ANOVA | Kruskal–Wallis | |||||
|---|---|---|---|---|---|---|
| p | padj | Padj Sign | p | padj | Padj Sign | |
| Physical and chemical environmental variables | ||||||
| Si | 5.0 × 10⁻¹ | 5.3 × 10⁻¹ | 7.0 × 10⁻¹ | 7.0 × 10⁻¹ | ||
| PO43− | 2.1 × 10⁻⁵ | 8.0 × 10⁻⁵ | *** | 1.0 × 10⁻³ | 2.1 × 10⁻³ | ** |
| NO3− | 9.2 × 10⁻⁷ | 6.9 × 10⁻⁶ | *** | 6.0 × 10⁻⁴ | 1.9 × 10⁻³ | ** |
| Temperature | 3.0 × 10⁻⁹ | 4.5 × 10⁻⁸ | *** | 6.4 × 10⁻⁴ | 1.9 × 10⁻³ | ** |
| pH | 2.0 × 10⁻³ | 3.0 × 10⁻³ | ** | 6.3 × 10⁻⁴ | 1.9 × 10⁻³ | ** |
| Summary numerical variables | ||||||
| Total phytoplankton abundance | 7.0 × 10⁻⁵ | 2.1 × 10⁻⁴ | *** | 1.3 × 10⁻³ | 2.1 × 10⁻³ | ** |
| Total phytoplankton biomass | 5.6 × 10⁻⁶ | 2.8 × 10⁻⁵ | *** | 6.4 × 10⁻⁴ | 1.9 × 10⁻³ | ** |
| Abundance of small centric diatoms | 8.3 × 10⁻³ | 1.0 × 10⁻² | * | 1.3 × 10⁻³ | 2.1 × 10⁻³ | ** |
| Abundance of stomatocists | 9.4 × 10⁻² | 1.1 × 10⁻¹ | 7.1 × 10⁻² | 7.6 × 10⁻² | . | |
| Abundance of benthic diatoms | 5.1 × 10⁻⁴ | 1.1 × 10⁻³ | ** | 3.4 × 10⁻³ | 4.3 × 10⁻³ | ** |
| Abundance of minor species | 1.2 × 10⁻³ | 2.2 × 10⁻³ | ** | 2.5 × 10⁻³ | 3.7 × 10⁻³ | ** |
| Biomass of small centric diatoms | 1.3 × 10⁻³ | 2.2 × 10⁻³ | ** | 1.3 × 10⁻⁴ | 1.9 × 10⁻³ | ** |
| Biomass of stomatocists | 6.3 × 10⁻¹ | 6.3 × 10⁻¹ | 6.3 × 10⁻² | 7.3 × 10⁻² | . | |
| Biomass of benthic diatoms | 5.1 × 10⁻⁴ | 1.1 × 10⁻³ | ** | 3.4 × 10⁻³ | 4.3 × 10⁻³ | ** |
| Biomass of minor species | 7.1 × 10⁻³ | 9.6 × 10⁻³ | ** | 9.1 × 10⁻⁴ | 2.1 × 10⁻³ | ** |
Disclaimer/Publisher’s Note: The statements, opinions and data contained in all publications are solely those of the individual author(s) and contributor(s) and not of MDPI and/or the editor(s). MDPI and/or the editor(s) disclaim responsibility for any injury to people or property resulting from any ideas, methods, instructions or products referred to in the content. |
© 2023 by the authors. Licensee MDPI, Basel, Switzerland. This article is an open access article distributed under the terms and conditions of the Creative Commons Attribution (CC BY) license (https://creativecommons.org/licenses/by/4.0/).
Share and Cite
Firsova, A.; Galachyants, Y.; Bessudova, A.; Titova, L.; Sakirko, M.; Marchenkov, A.; Hilkhanova, D.; Nalimova, M.; Buzevich, V.; Mikhailov, I.; et al. Environmental Factors Affecting Distribution and Diversity of Phytoplankton in the Irkutsk Reservoir Ecosystem in June 2023. Diversity 2023, 15, 1070. https://doi.org/10.3390/d15101070
Firsova A, Galachyants Y, Bessudova A, Titova L, Sakirko M, Marchenkov A, Hilkhanova D, Nalimova M, Buzevich V, Mikhailov I, et al. Environmental Factors Affecting Distribution and Diversity of Phytoplankton in the Irkutsk Reservoir Ecosystem in June 2023. Diversity. 2023; 15(10):1070. https://doi.org/10.3390/d15101070
Chicago/Turabian StyleFirsova, Alena, Yuri Galachyants, Anna Bessudova, Lubov Titova, Maria Sakirko, Artyom Marchenkov, Diana Hilkhanova, Maria Nalimova, Vasilisa Buzevich, Ivan Mikhailov, and et al. 2023. "Environmental Factors Affecting Distribution and Diversity of Phytoplankton in the Irkutsk Reservoir Ecosystem in June 2023" Diversity 15, no. 10: 1070. https://doi.org/10.3390/d15101070