Article

What Does It Take to Further Our Knowledge of Plant Diversity in the Megadiverse South Africa?

by
Mashudu Patience Mamathaba
1,
Kowiyou Yessoufou
2,* and
Annah Moteetee
1
1
Department of Botany and Plant Biotechnology, University of Johannesburg, Auckland Park, Johannesburg 2006, South Africa
2
Department of Geography, Environmental Management and Energy Studies, University of Johannesburg, Auckland Park, Johannesburg 2006, South Africa
*
Author to whom correspondence should be addressed.
Diversity 2022, 14(9), 748; https://doi.org/10.3390/d14090748
Submission received: 5 June 2022 / Revised: 6 September 2022 / Accepted: 8 September 2022 / Published: 11 September 2022
(This article belongs to the Special Issue Biodiversity and Human-Environment Interactions)

Abstract

:
In the context of biodiversity crisis, targeted efforts are required to accelerate the discovery and description of the still-unknown species. In the present study, we collected data on current knowledge of plant richness in South Africa and used a statistical modeling technique to predict what might still be missing in the country. We found that we might be missing 1400–1575 plant species, and it might take 40–45 years to identify and describe these species aided by 64–315 taxonomists. Surveyed taxonomists spent USD 95,559, on average, to describe one species. At this rate, USD 150,506,142 would be required to describe the 1575 species (modeling) or USD 133,783,237 for the 1400 remaining species (expert opinion). However, these estimates do not correspond to what is specifically required for only species description but does integrate connected activities, e.g., running cost, bursary, salaries, grants, etc. Furthermore, these estimates do not account for the possibility of taxonomic revision, which, on its own, needs to be funded, nor do they account for molecular laboratory requirement. Nevertheless, if we consider that 15% of the predicted funds are solely spent on taxonomic activities, we would need ~USD 14,334 on one species. Overall, our study provides figures that can inform attempts to fuel efforts toward a comprehensive assessment of the unique South Africa’s biodiversity.

1. Introduction

How many species are there on Earth? This is an important question for all conservation biologists, as it is not possible to effectively conserve biodiversity if we have a biased knowledge of its extent [1,2,3,4]. Several studies have investigated the question [1,3,4,5] not only to estimate species diversity on Earth but also to quantify the remaining efforts to be deployed to maximize the chance of discovering and describing currently unknown species. These studies reported strikingly different estimates that are, in all cases, dramatically greater than the currently known 1.5 million species [6]. Early studies variously predicted species richness to be ~100 million [5,7,8,9], 8.7 million [3], or ~2 million species [10]. More recent studies escalated the predictions to ~1 trillion [11] or 1–6 billion species on Earth [4].
The striking difference in estimates is due to the fact that some studies preferentially focused on certain taxonomic groups, and they mostly did not use the same predictive tools. For example, in their analysis, Larsen et al. [4] incorporated for the first time morphologically cryptic species discovered through molecular analyses, and this exponentially increases the predicted global species richness in comparison with previous studies (e.g., [3]). Interestingly, even with these dramatic changes in predictions, one constant remains across all predictions; for example, Mora et al.’s [3] prediction for plant species richness on Earth (298,000 species) is similar to the number of plant species currently described, which is roughly ~300,000 species [6]. In addition, Mora et al.’s [3] predictive model has a strong power (R2 = 96%), suggesting that, in a given taxonomic level (e.g., genera, families or orders, etc.), 96 out of 100 of its species richness are correctly predicted by the model.
While these studies are assisting us in picturing the extent of biodiversity at the global scale, the estimate of biodiversity at a local scale, e.g., at a country level, receives relatively less attention. This is an important knowledge gap that needs to be addressed, given that conservation efforts start from the country level toward the global conservation effort. Although the ecosystem services provided by biodiversity strongly contribute to human well-being [12,13,14,15], species providing these services are being lost at an unprecedented rate, corresponding to the modern biodiversity crisis or the sixth mass extinction [16,17]. This crisis is characterized by an exponential loss of biodiversity, irrespective of the scenarios adopted—highly conservative or conservation scenarios [17]. Ceballos et al.’s [17] study revealed that species loss that occurred in the last 114 years could have taken 800 to 10,000 years to go extinct under a scenario of sustainable biodiversity management. An earlier report indicated that the current biodiversity loss may be 1000–10,000 times greater than the background rate of species loss [13].
However, the vast majority of studies that demonstrate this biodiversity crisis focus on vertebrates. For example, 800 bird species in the islands of Oceania went extinct in the last 2000 years due to anthropogenic pressure [18]. In the 1600s, extinctions of various vertebrate taxonomic groups (e.g., large mammals, birds, reptiles, amphibians, and fishes) were also reported [17,19,20,21]. For plant species, there is less information about the pattern of the extinction rate as compared with vertebrates, and only 5% of described plant species are IUCN-assessed for their extinction status [22]. In addition, among the IUCN-assessed plant species, over 70% are at risk of extinction, a much higher proportion than the 22% reported for vertebrates [22]. The much conservative estimate of species loss suggests that the proportion of at-risk plant species might be similar to that of vertebrates. Specific predictions also suggest that some entire ecosystems may even go extinct in only 110 years (e.g., mangrove forests) if current anthropogenic pressures are maintained on the environment [23]. The loss of species is perhaps the most critical concern of our times, given that species loss would drive the loss of valuable ecosystem services and thus compromising human well-being [14,24,25].
In light of the alarming statistics of this biodiversity crisis, preemptive and urgent actions are required to prevent species loss at all costs. However, how can such actions take place in an effective way if we have limited knowledge of the extent of existing species diversity? More concerning is the fact that the currently known extinction rate may be greater than the reality because several unknown species are undoubtedly sliding into extinction unnoticed, and we would not be able to account for them in our current estimate of the extent of biodiversity crisis since these species are not known to science. This calls for strong commitments to estimate the potential number of currently unknown species so that appropriate efforts (number of taxonomists, funds, time, and resources required) can be estimated, planned for, and deployed [3,26]. Given the ongoing biodiversity crisis and the tremendous ecosystem services that may be at risk (due to loss of biodiversity), integrating taxonomic efforts into policy development documents becomes a national priority for all countries, particularly those that are known as megadiverse, e.g., South Africa, due to their incredible species richness.
South Africa has about 24,000 plant species and is home to 10% of the world’s plant species richness [27,28] with more than 50% being endemic plant species. The terrestrial vegetation is classified into nine (09) biomes, including the Albany thicket, Dessert Forest, Fynbos, Grassland, Indian Ocean Coastal Belt, Nama Karoo, Savannah, and Succulent Karoo [29]. Furthermore, from the six renowned global floral kingdoms, South Africa hosts one in its entirety, that is, the Cape Floral Kingdom. This floral kingdom is deemed the smallest, richest, and most threatened of all [27,30]. Moreover, South Africa also has three recognized biodiversity hotspots i.e., the Cape Floristic Region, Succulent Karoo, and Maputaland–Pondoland–Albany hotspot [27]. Unfortunately, 9% of South African plants are threatened, and these threatened plants are mostly found in the Fynbos biome, the most threatened biome on Earth [30]. In addition, an early assessment of 427 vegetation types revealed that 5% of them are critically endangered, 12% are endangered, and 16% are vulnerable, mostly in the Cape Floristic Region [31].
This South African context of plant and biome conservation status means that there is an urgent need to accelerate taxonomic assessment so that measures and plans can be put in place not only for conservation but also for the development of ethnobotanical knowledge (since knowledge cannot be developed about species we do not know). Although South Africa has a long rich history of taxonomic assessment, “there is still a need for further exploration of South Africa’s biodiversity, so that improved foundational biodiversity information can be provided to end-users” [32]. Efforts toward such improvement cannot be randomly performed; they have to be focused, targeted, prioritized, and informed with knowledge of what potentially remains to be discovered and described. In response to these requirements, the present study aimed to estimate not only the number of unknown vascular plant species in South Africa’s flora but also the efforts required (time, funds, and number of taxonomists) for a comprehensive botanical assessment of the megadiverse South Africa.

2. Materials and Methods
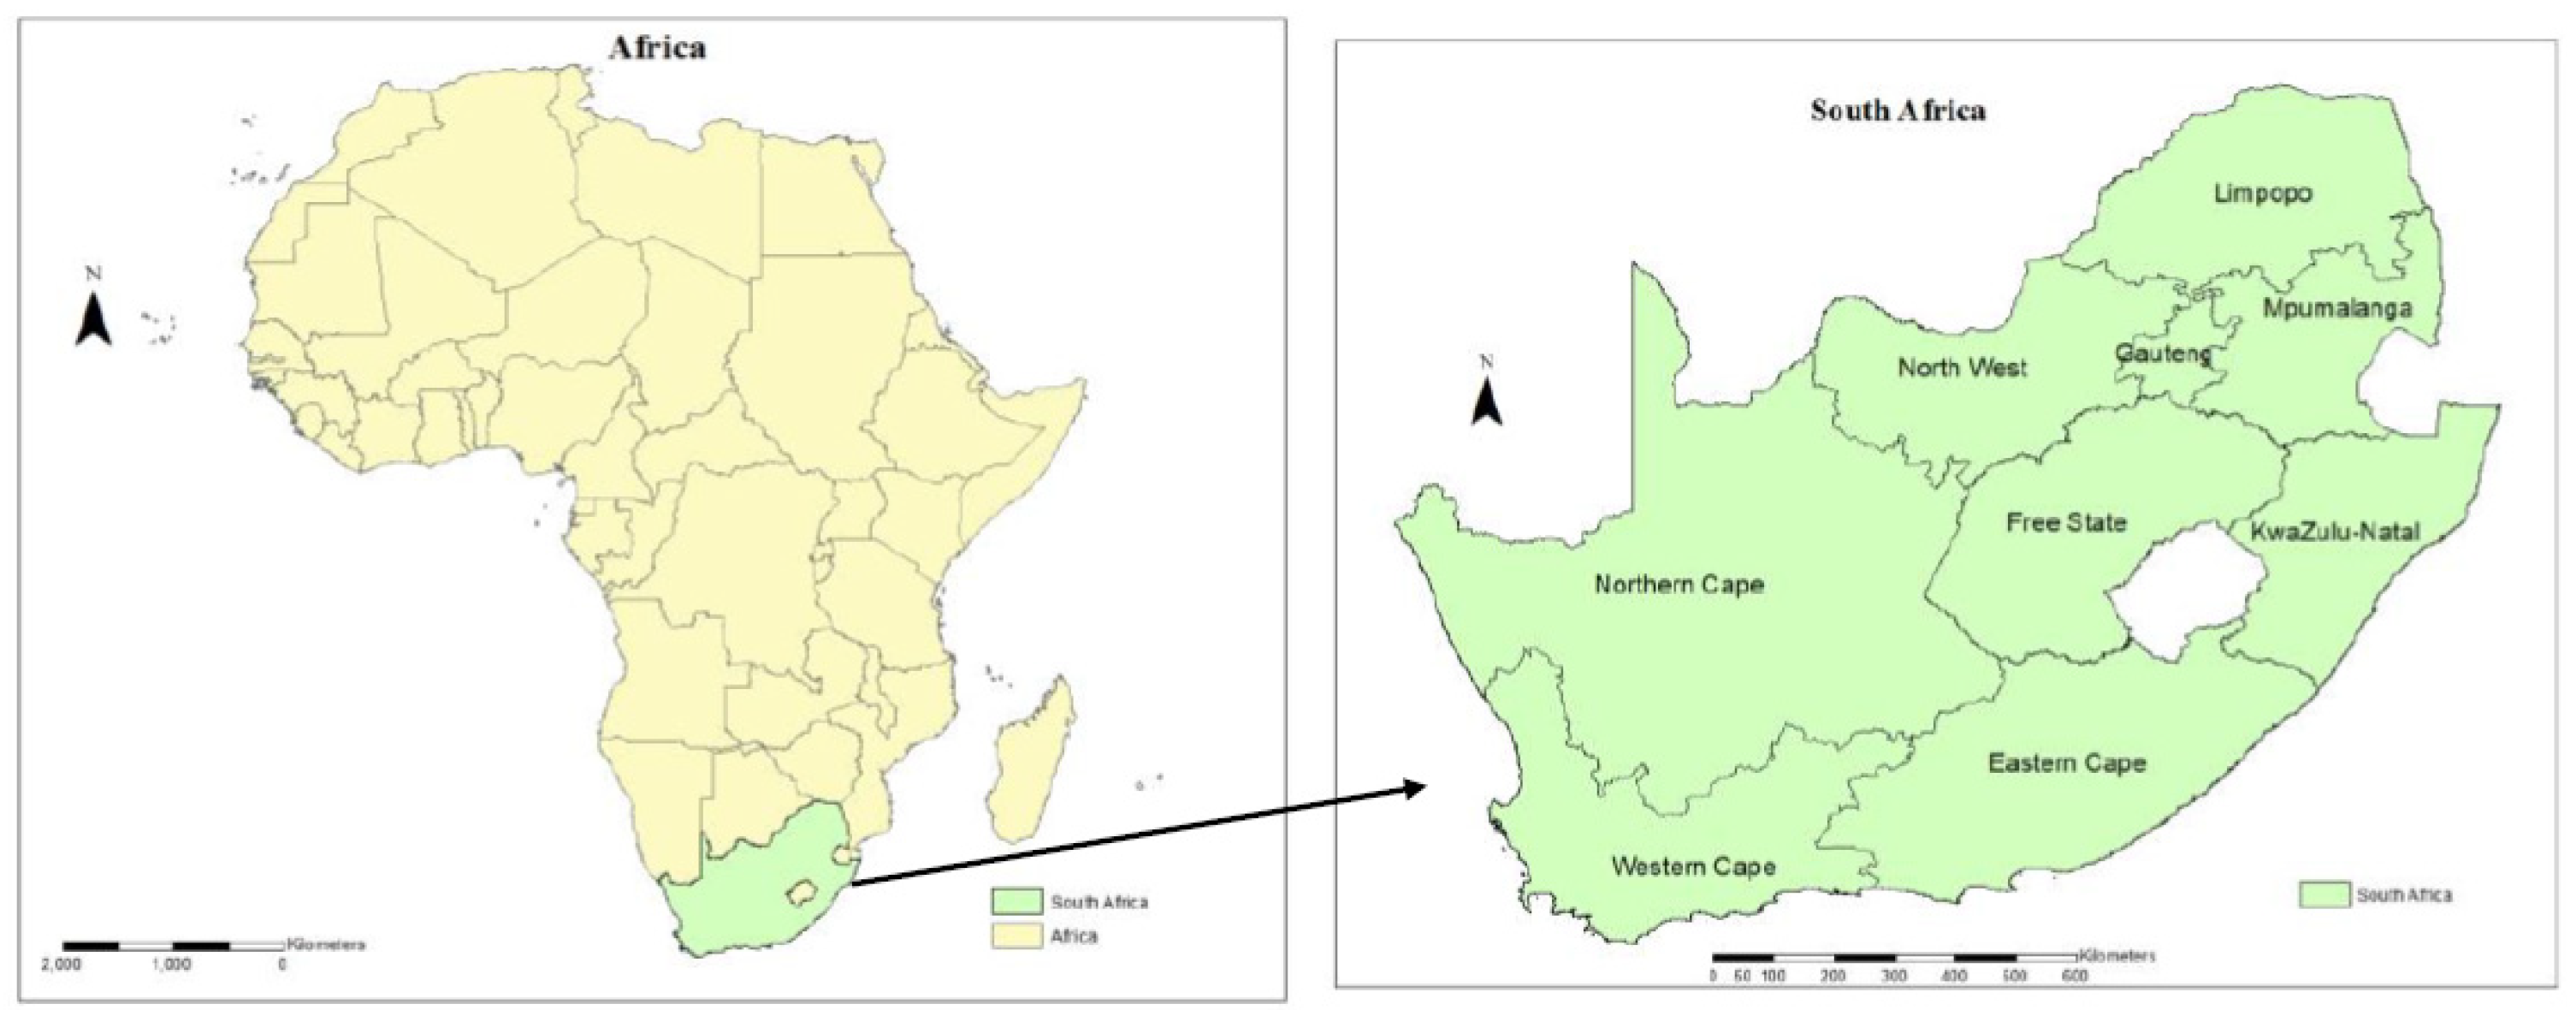
2.1. Study Area

South Africa, with its area of 1,219,602 km2, is located at the southernmost tip of the African continent (Figure 1), from 22° S to 35° S latitude and from 17° E to 33° E longitude [33]. Climatically, South Africa is a moderately dry country: ~67% of the country receives less than 500 mm annual rainfall [34], and this rainfall generally occurs in summer, except around Cape Town, which witnesses a winter rainfall [35]. South Africa’s climatic conditions generally range from Mediterranean in the southwestern corner of the country to subtropical in the northeast corner [33]. In terms of biodiversity, around 8% of the world plant species is found in South Africa (i.e., ~24,000 species), making it one of the 17 megadiverse countries in the world. This huge biodiversity is found across nine biomes, namely Nama Karoo, Succulent Karoo, Fynbos, Forest, Albany Thicket, Savannah, Dessert, Indian Ocean Coastal Belt, and Grassland [29]. A vast network of protected areas is delimited in South Africa, including 1527 national parks, nature reserves, wilderness areas, mountain catchment areas, and world heritage sites [36]. Three major biodiversity hotspots are identified in South Africa, namely the Cape Floristic Region, Succulent Karoo, and Maputaland–Pondoland–Albany biodiversity hotspot. South Africa is the only country that hosts an entire floral kingdom, the Cape Floral Kingdom, which is the smallest of the world’s six floral kingdoms [37]. The Cape Floral Kingdom harbors >9000 plant species with ~70% endemic plants. However, evidence points to more species to be described, especially from biomes that are botanically less explored, e.g., the Indian Ocean Coastal Belt. Revealing the extent of the country’s diversity is key for policy development in the field of taxonomy and conservation.

2.2. Data Collection

To predict the number of unknown plant species, we collected two types of data: the number of native plant species currently known and catalogued in South Africa collected from the South African National Biodiversity Institute (SANBI, https://www.sanbi.org/, accessed 1 June 2021) and the publication years (Supplementary Material Table S1) of all catalogued South African native plant species collected from the International Plant Name Index (https://www.ipni.org/, accessed 1 May 2020). A database consisting of the list of native species and their corresponding dates of publication was then created on an Excel spreadsheet.
Next, we estimated the effort required to identify and describe the unknown species. In this study, effort is defined as the time, fund, and number of taxonomists that could be required for the discovery and taxonomic description of unknown species. To collect data on these variables (time, fund, and the number of taxonomists), we relied on expert knowledge collected through questionnaires (Supplemental Information), cell phone discussions, and office visits. These experts were identified from a SANBI record known as “SANBI biodiversity series 26” [38]. This record identified 34 plant taxonomists; these taxonomists are certified professionals currently employed in academic, private, or governmental (e.g., SANBI) research institutions. We also considered retired taxonomists, some of whom were suggested by taxonomists that we contacted during data collection, which resulted in the total number of taxonomists being 42. However, the challenge was that we could not reach the retired taxonomists even after contacting the institutions in which they were based prior to retirement. Prior to the questionnaire being distributed, a pilot study was conducted with two of the highly ranked taxonomists in South Africa. We used the outcomes of the pilot study to revise our questionnaire. To reach potential international taxonomists and collaborators who have at least described one species in South Africa, a Google survey was created and the link was shared. Unfortunately, there were no international respondent even with all the efforts made to reach them. The goal was to collect quantitative data on the efforts required to identify and describe a new species, including time, money, and work force.
The questionnaire was divided into two parts; the first part focused on the demography, which highlighted the relevant qualifications and current employment status of the taxonomist (active or retired), etc. The second part of the questionnaire focused on the taxonomic activities of the experts, which required the taxonomists to highlight the history of their job as a taxonomist, how many species they have identified during their career, and, most importantly, their estimation of the average efforts it took to identify a single species (Supplemental Information). All data collected are shown in Table S2.

2.3. Data Analysis

All quantitative analyses in this research project were carried out in R version 3.5.3 [39].

2.3.1. Number of Unknown Plant Species in South Africa

We first tested, using the Dickey–Fuller test [40], whether the number of species described in South Africa over time (1696–2019) follows a nonconstant variance. After confirming the nonconstant variance, we fitted a generalized autoregressive conditional heteroskedasticity (GARCH) model to the data. The GARCH model was developed by Engle [41] to model volatile time-series data, i.e., data with a nonconstant variance. Different GARCH models were fitted with various starting time intervals for the modeling ((0,0), (1,1), (2,2), …). The best GARCH model was selected using Akaike information criteria (AIC). The selected model was then used to predict the future trend of the number of species over the next 120 years. This trend allows for the identification of the year Y1 where the number of species to describe becomes 0 (Y1 means the year all species are described). The difference between Y1 and Y0 (the present) corresponds to how long it will take to describe the remaining species in the country (see R-Script in Supplemental Information).
Apart from the modeling approach, an expert’s opinion approach was also used to estimate the number of unknown species. This method was also used in a similar study that Carbayo and Marques [42] conducted in Brazil. In their study, Carbayo and Marques surveyed 44 taxonomists (almost 9% of the employed and doctoral taxonomists in Brazil) to estimate the resources required to describe the entire animal kingdom. In the present study, a question was included in the questionnaire asking taxonomists to estimate, given their respective experiences as taxonomists, the number of the remaining species that they believe are yet to be discovered in South Africa.

2.3.2. Determination of Efforts Required to Identify and Describe the Unknown Plant Species

2.3.2.1. Time

For the time variable, the total number of respondents to our questionnaire (N) was considered as well as the respondent’s career duration (∆t) and the number of species described by the respondents during their respective careers (ni). Then, the estimated time required to describe the remaining unknown plant species (Ts) was estimated as summarized below:
N = total number of respondents (taxonomists)
∆t = duration of career
ni = number of species described during the career of a taxonomist (i)
If a taxonomist i describes ni species during his or her career that lasts the time ti, this implies that this taxonomist takes, on average, the time ti/ni to describe 1 species. As a result, for all the N taxonomists, the time ts to describe 1 species is
ts = (1/N)∑(ti/ni) = average time to describe 1 species, considering all respondents.
Then the total time Ts required to describe all the unknown species Nunknown is
Ts = ts × Nunknown (estimated time required to describe the remaining unknown plant species).

2.3.2.2. Funds

The funds variable (fi) was determined by adding three factors (grants, salaries, and training fund of taxonomists). Research grants are the grants awarded to run and maintain a lab, salaries are the net salary per month of the principal investigator of the lab, and training funds are the total funds used to obtain a relevant qualification by a student (undergraduate to PhD in taxonomy). The fund required to describe all unknown species was estimated as follows:
fi = (grants + salaries + training fund) = total fund spent by a taxonomist i to describe ni species during his or her entire career.
fi/ni = funds to describe 1 species by a taxonomist i.
f = (1/N)∑(fi/ni) = average fund to describe 1 species by all N respondents.
F = f × Nunknown = (total funds required to describe all unknown species)
Since this fund is not solely used for taxonomic studies, we also calculated 15% of the fund reported elsewhere as the portion of the fund F specifically used for taxonomic projects [42].

2.3.2.3. Number of Taxonomists

To determine the number of taxonomists needed to identify and describe Nunknown species, the following was carried out:
The total number of species described by N respondents is ∑ni, ni being the number of species described by a taxonomist i during his or her career.
As such, the number of taxonomists required to describe Nunknown species is
Number of taxonomists = N   ×   Nunknown ni .

3. Results

3.1. Structure of the Population of Taxonomists Who Took Part in This Study

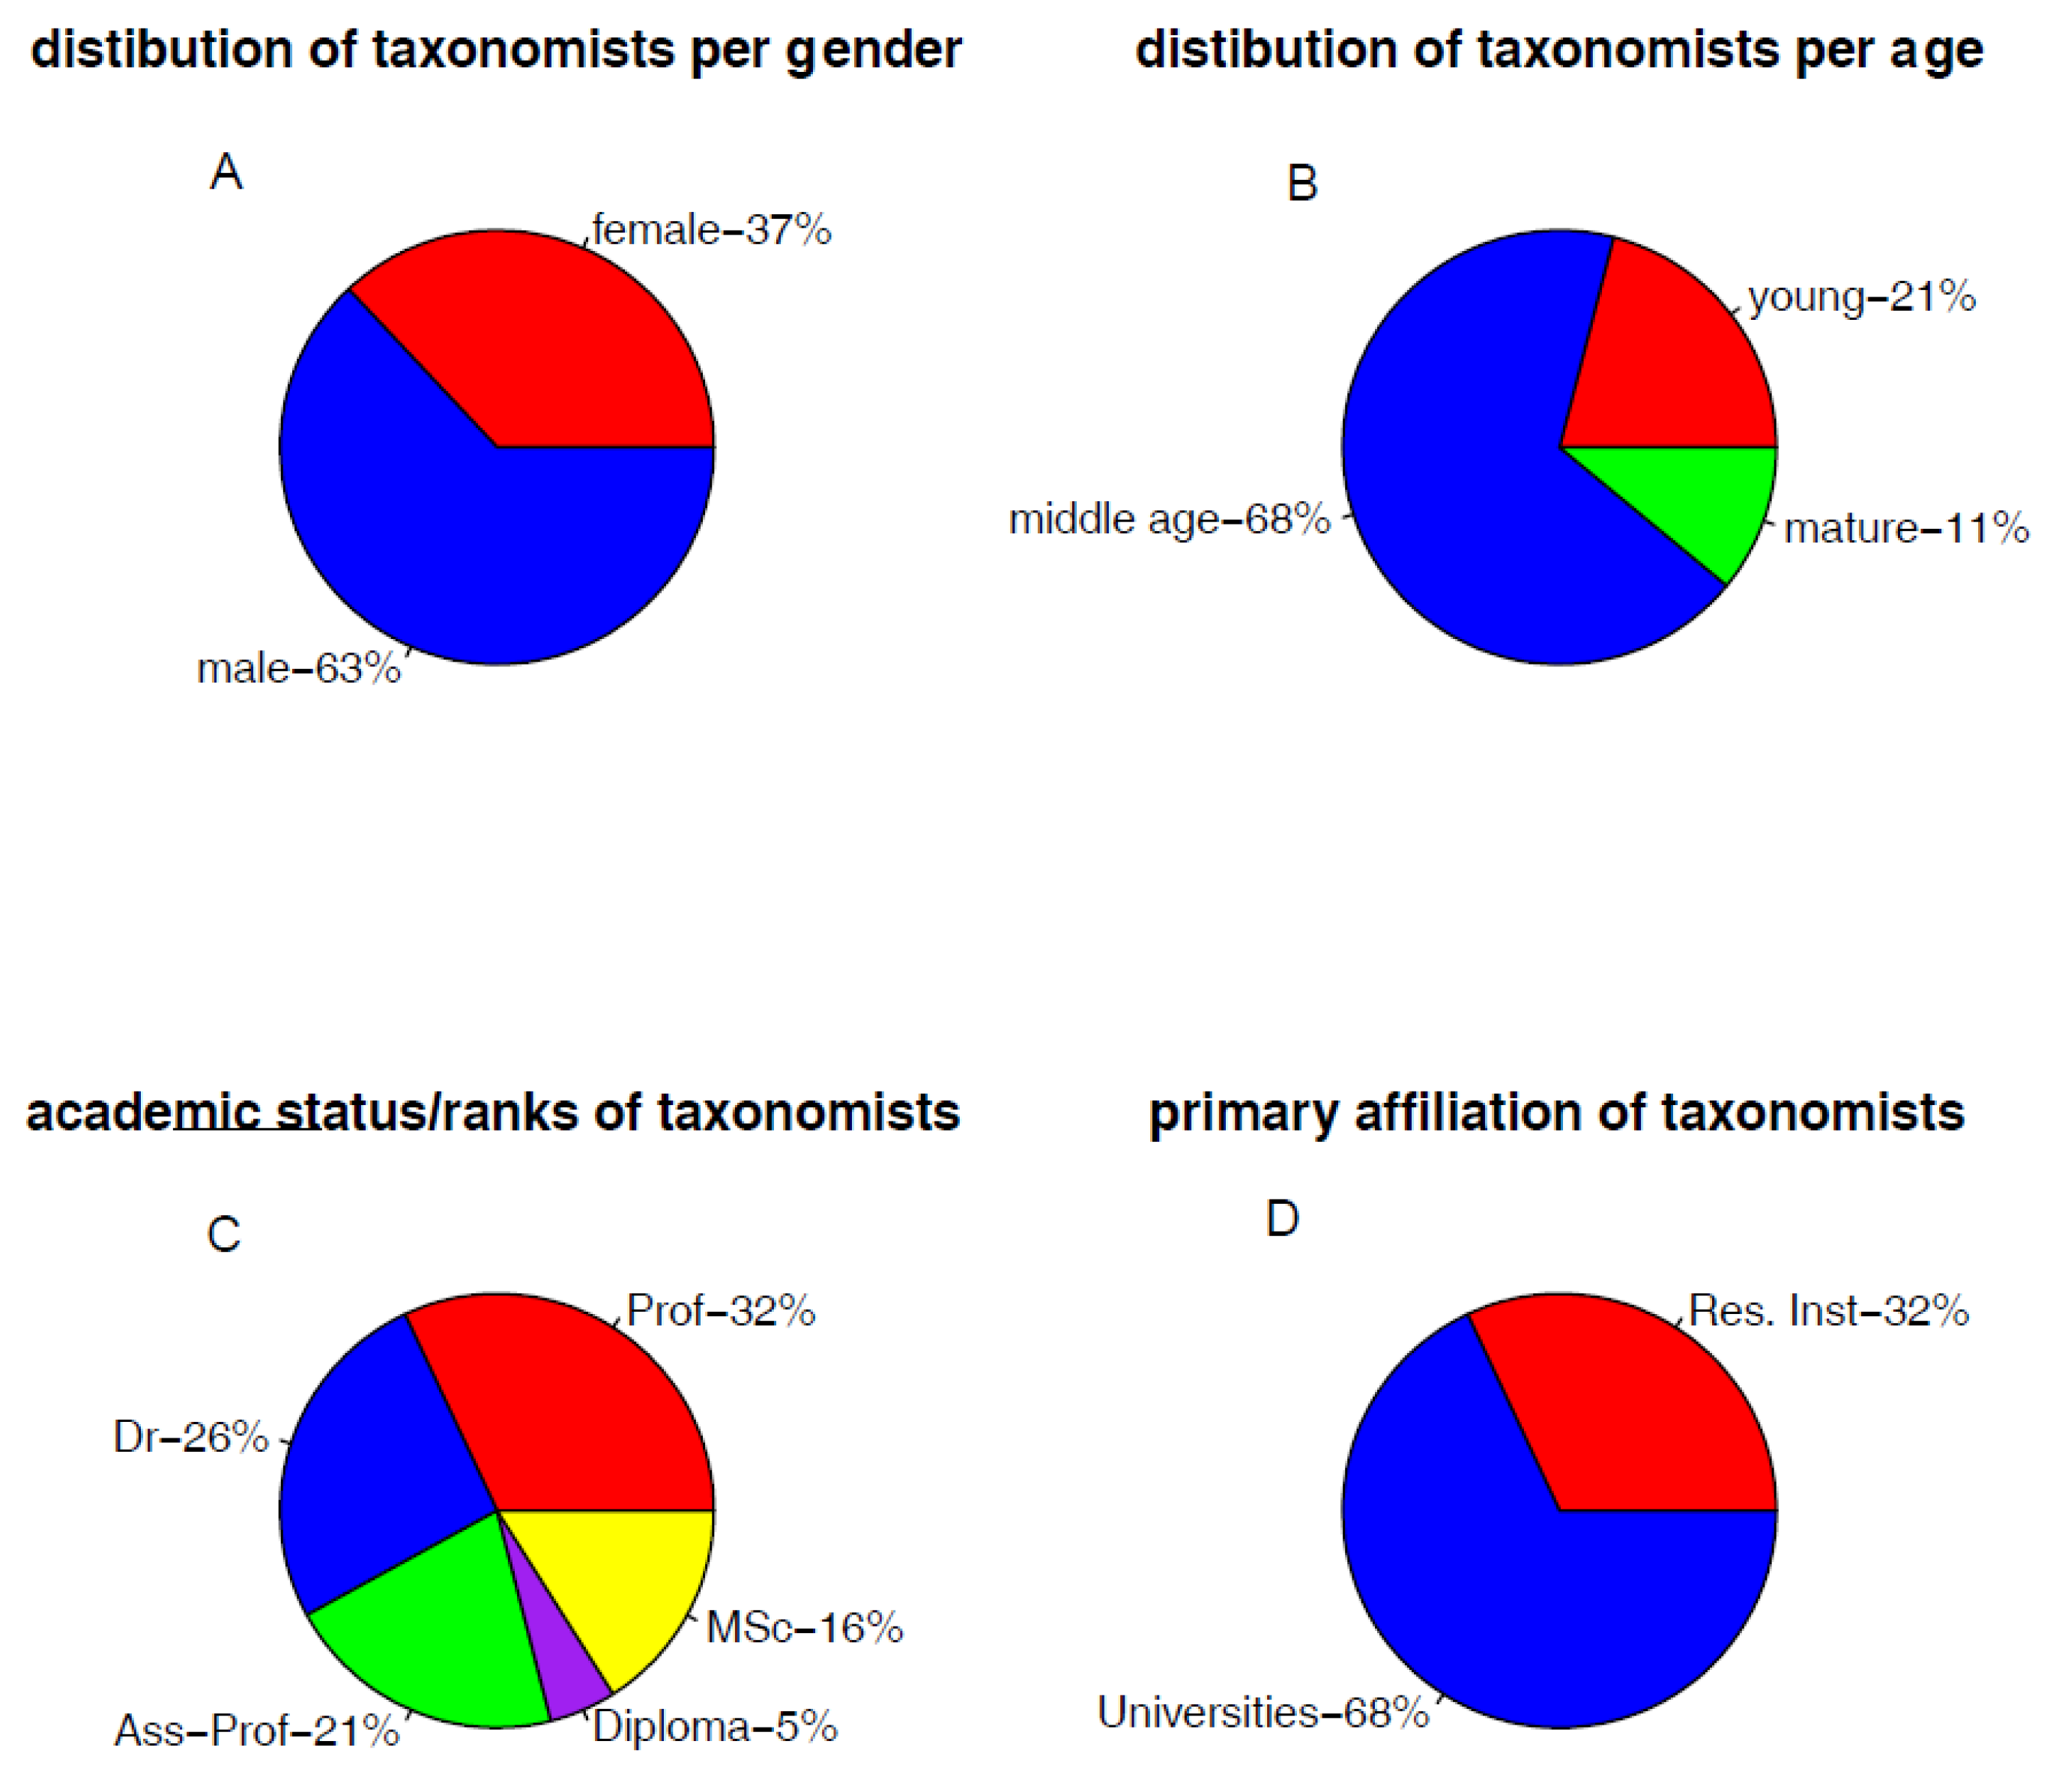
3.1.1. Demography of Taxonomists

The population of plant taxonomists (Figure 2A) who took part in this study is made up of a majority of men (63%). The vast majority of this pool of taxonomists is categorized as of middle age (68%); a few of them are in their youth (20–40 years old), and a low percentage of currently active taxonomists are categorized as reaching a mature age (11%; Figure 2B). Interestingly, these taxonomists are of high academic rank: professors (32%), associate professors (21%), and PhD graduates (26%; Figure 2C) who are mostly affiliated with universities (68%) or research institutions (32%; Figure 2D).

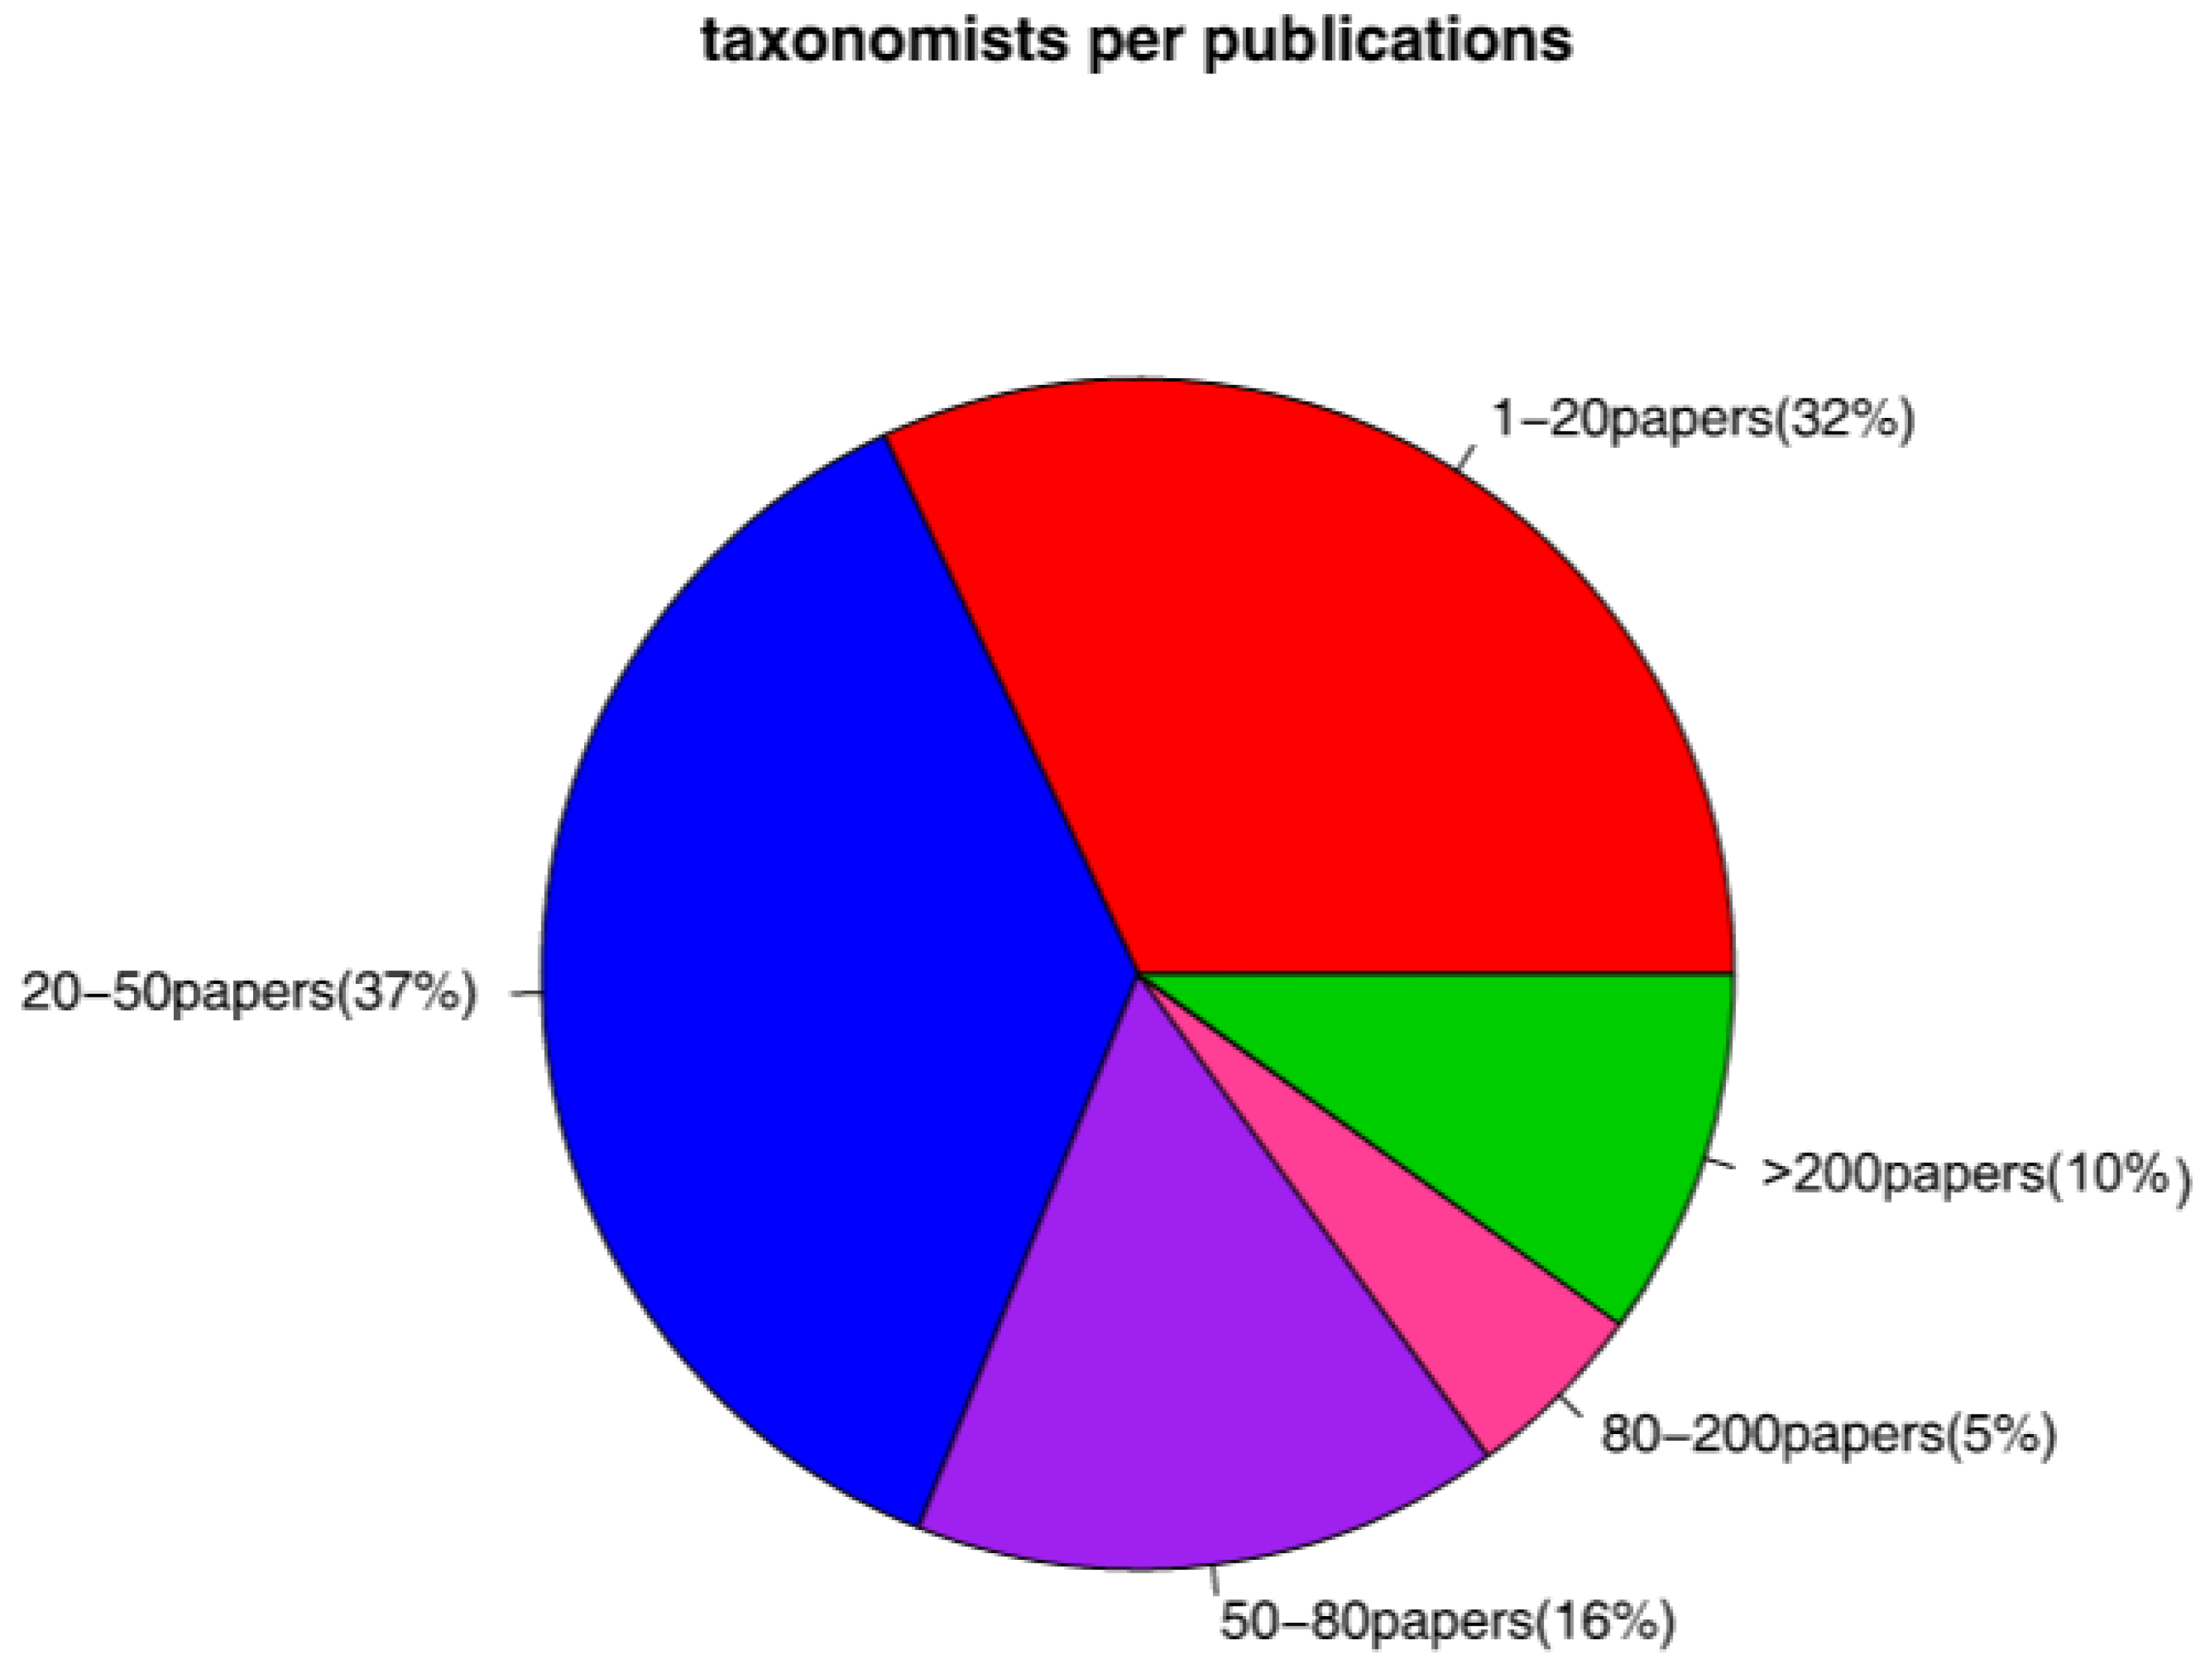
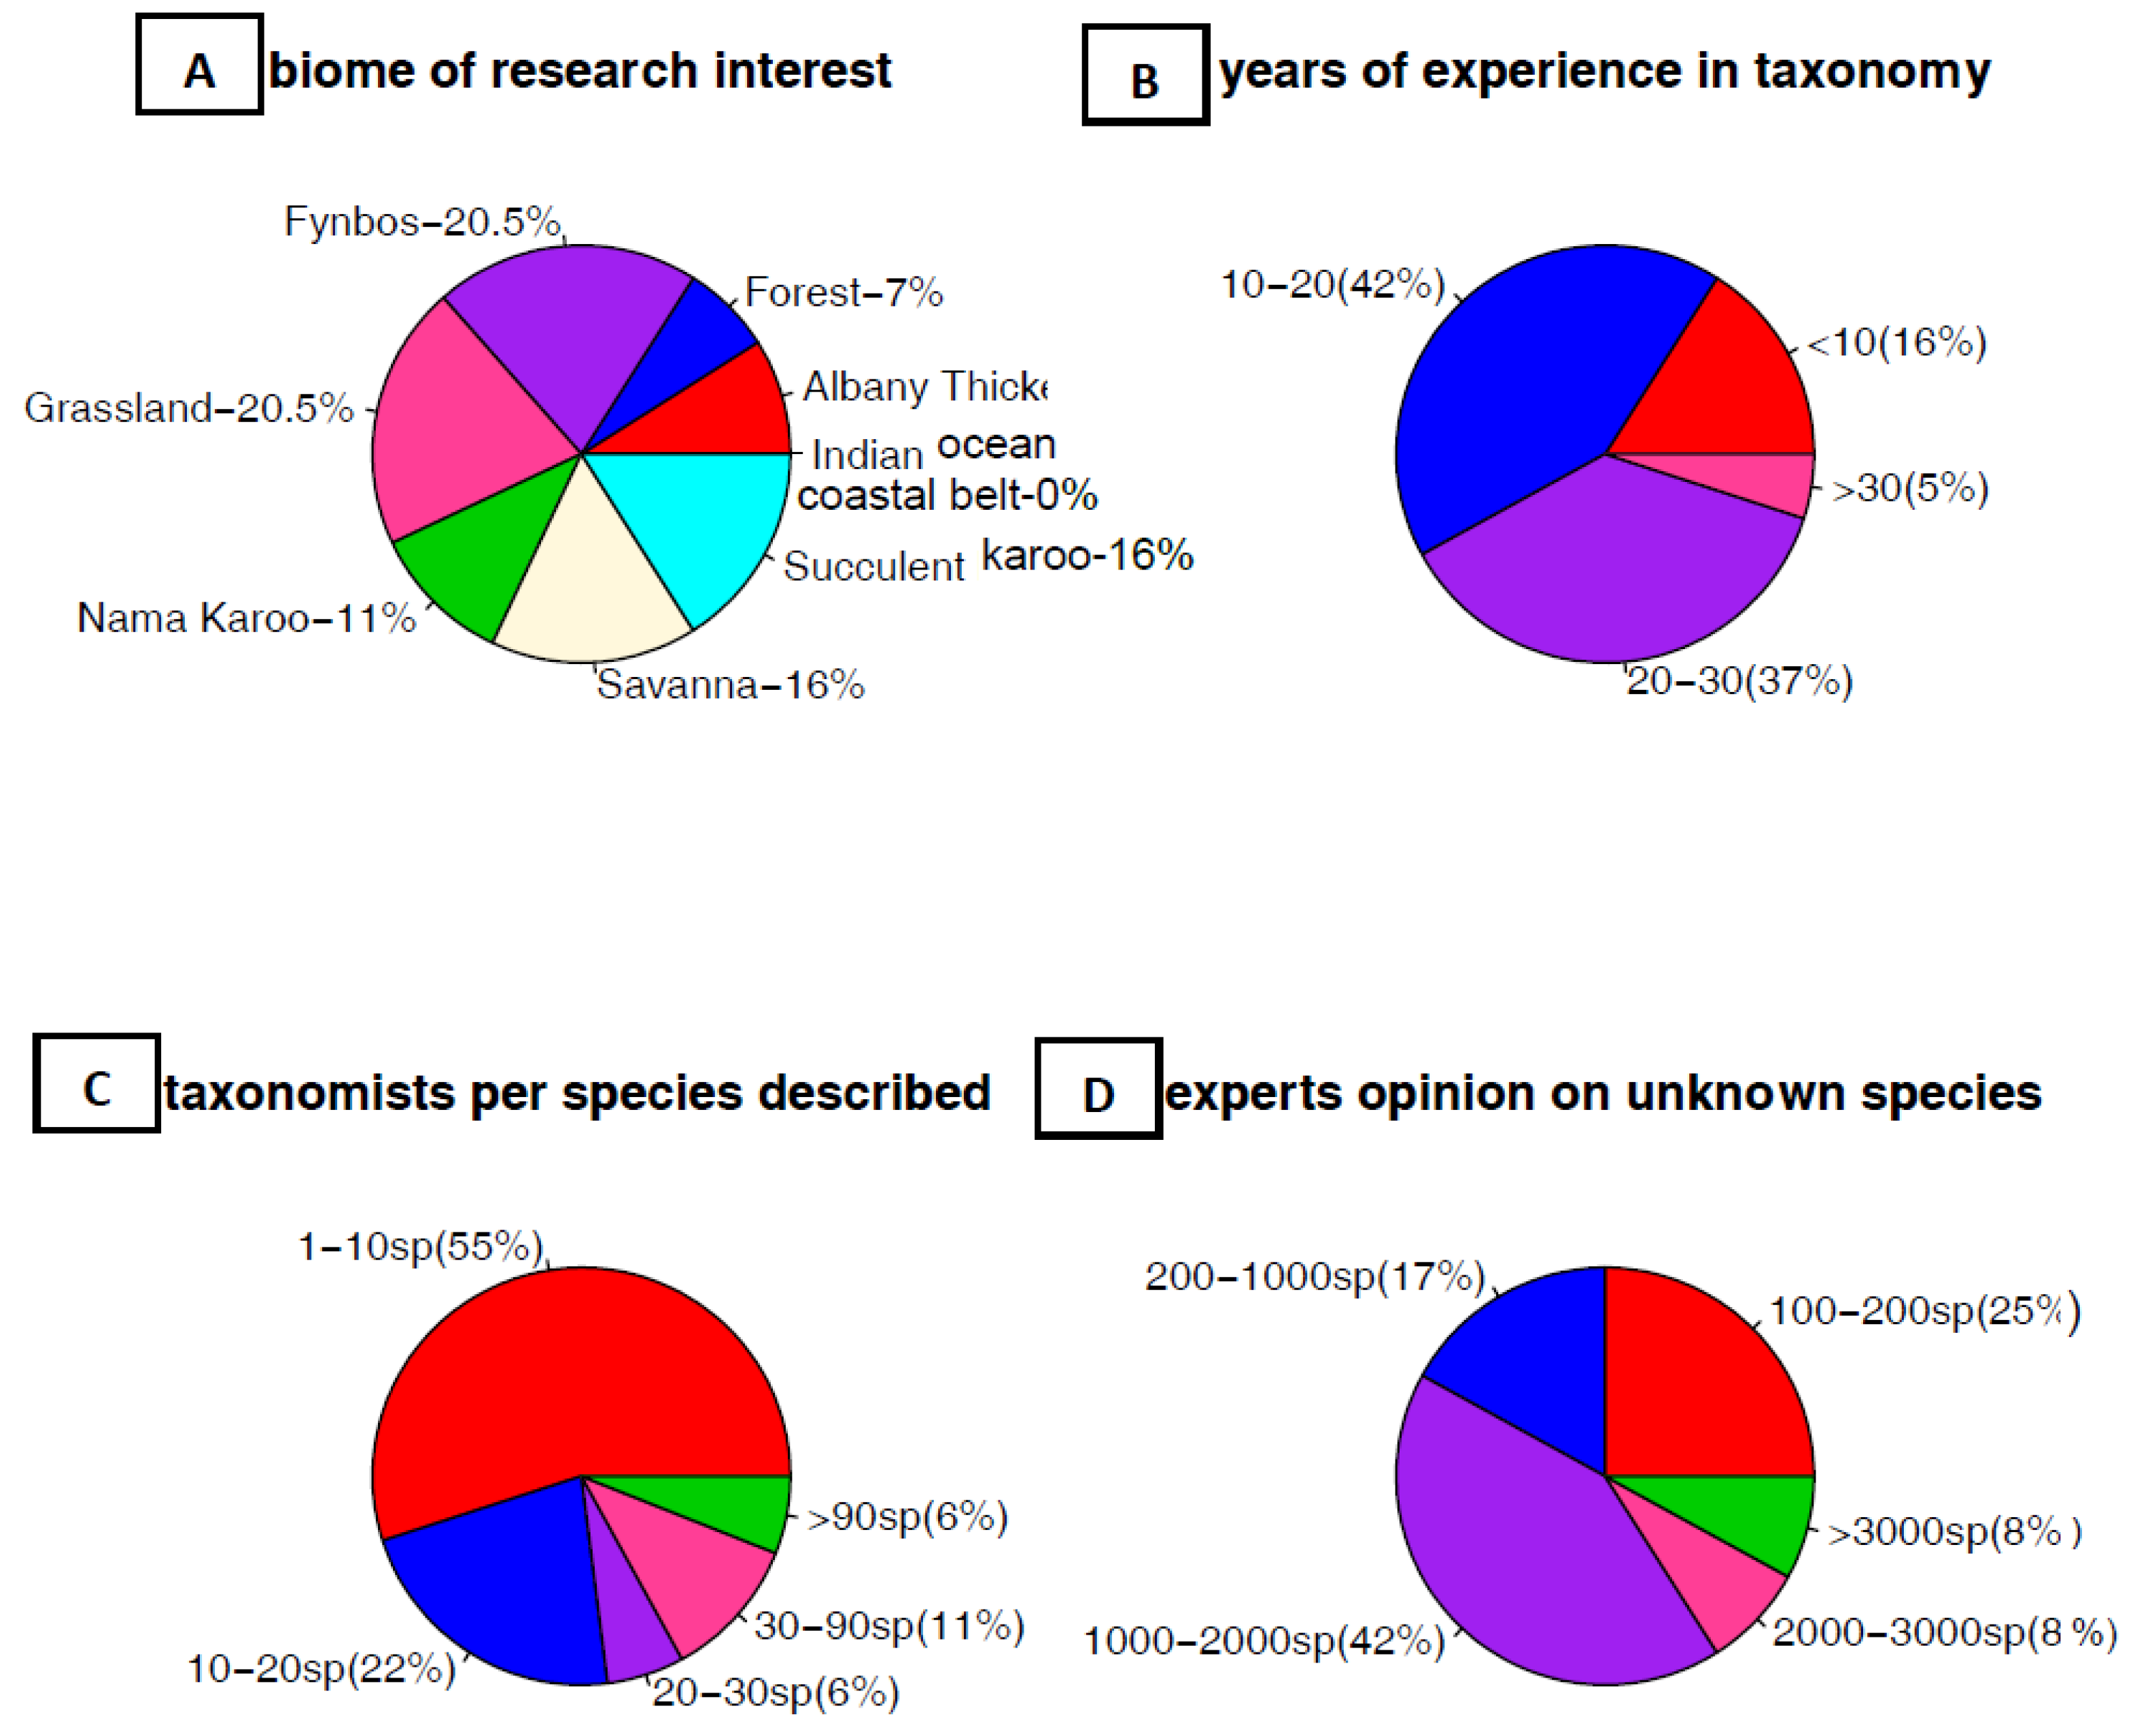
3.1.2. Taxonomic Activities

The results of the analysis of the data collected through questionnaires show that taxonomists in South Africa are very active. In terms of publications, some have published over 200 papers in taxonomy, others have published 50–80 papers, and many have published 20–50 papers (Figure 3).
Furthermore, taxonomists in South Africa work on almost all biome types found in the country (Figure 4A). Fynbos and Grasslands were the most cited biomes of interest for taxonomists, followed by Savannah and Nama Karoo. However, no one published taxonomic research on Indian Ocean Coastal Belt and Desert. Most of the taxonomists have accumulated 10–20 years of experience in taxonomy (42%), whereas some taxonomists have accumulated 20–30 years of experience (37%) and a low percentage over 30 years (Figure 4B). In terms of species description, most taxonomists have described 1–10 species (55%), some have described 10–20 species (22%), and 6% of the taxonomists have described more than 90 species in their career (Figure 4C).

3.2. Prediction of the Richness of Potentially Unknown Species

This number was predicted in two ways: experts’ opinions and statistical modeling. According to experts’ opinions, the number of missing species varies between 100 and 3000 (Figure 4D). The average of all experts’ predictions is 1400 species.
Prior to statistical modeling, we first showed that the 11,208 species in our dataset have been described in a very inconsistent way over the 323 years (Figure 5) that it took for those species to be described.
This means that, on average, 35 species are annually described. The GARCH model predicts that it would take 45 years for all remaining species in South Africa to be described (Figure 6). This implies that, if the current description rate is maintained (35 species/year), in those 45 years, 1575 species would have been described (i.e., it remains potentially 1575 species still to be described).

3.3. Efforts Required for a Comprehensive Plant Diversity Assessment

Taking into consideration the fact that, in the past 323 years, 11,208 species have been described, implying a description rate of 35 species per year on average, it would take 45 years to describe the remaining 1575 species. This timeframe would be reduced to 40 years to describe the 1400 species predicted as unknown by experts.
According to the results obtained from experts in this study, taxonomists have spent a total of ZAR 680,670,000 (USD 40,039,411) to describe 419 species. This implies that, in theory, ZAR 1,624,510.74 (USD 95,559) was spent, on average, to describe 1 species. At this rate, ZAR 2,558,604,415.00 (USD 150,506,142) would be required to describe the 1575 (modeling) remaining species or ZAR 2,274,315,036.00 (USD 133,783,237) for the 1400 (expert) remaining species. Since this estimated fund is not solely used for taxonomic studies, we applied the estimated 15% reported elsewhere as the portion used for taxonomic studies: this means that approximately ZAR 243,673 (USD 14,334) is used on average for 1 species description.

3.4. Number of Taxonomists Required for a Comprehensive Plant Taxonomic Assessment

In the data collected using the questionnaire, 19 taxonomists have described 419 species during their careers; this means that 64 or 71 taxonomists would be required to describe the 1400 species (expert opinion) or 1575 species (modeling) remaining to be described in South Africa, respectively. However, the data collected from IPNI indicate that 2239 taxonomists have described the 11,208 native species in South Africa. The number of authors who did this massive species description has tremendously changed over time (Figure 7). The number first increases until around the year 1920, after which it starts decreasing until today (Figure 7). At the rate of description, the description of the 1400 species (expert opinion) or 1575 species (modeling) that remain to be described would require 280 or 315 taxonomists, respectively.

4. Discussion

4.1. Population of Taxonomists Involved in This Study

This study highlighted an unequal representation of sex in plant taxonomy in South Africa: 63% male and 37% female taxonomists. This inequality seems to be a global issue in both plant and animal taxonomy [43]. This observation is too a reality in South Africa given that 41% of the pool of taxonomists involved in the present study are women and 59% men (see also [44,45,46,47]). Fortunately, in South Africa, SANBI is committed to promoting the employment priority of women over men as part of strategies to address the existing sex inequality [48].
Apart from sex inequality, it seems that age representation is a global dilemma (South Africa included). The vast majority of taxonomists in this study (68%) are categorized as of middle age (40–60 years old), and 11% of currently active taxonomists are categorized as reaching a maturity age (>60 years). This quick statistic implies that most of the current active taxonomists in South Africa will be at the retirement age in 10 years. When this happens, it will have negative implications on the plant taxonomic and conservation activities unless plans are in place to mitigate the negative impacts of massive retirement of experienced taxonomists. Our data revealed that there are only a few young taxonomists (20%) already in the pipeline, and this shows that the future of plant taxonomy in South Africa in the next 10–15 years may not be looking good.
Interestingly, this study, among others (e.g., [49]), showed that age does not necessarily decrease publication activity. Specifically, the annual description rate of species during the careers of the particularly prolific taxonomists shows high taxonomic activity during the last 15 years of the career at the age of about 50–60 years [38,50]. Overall, the decreasing number of professional taxonomists is a global challenge [51]. If proactive actions are not taken, taxonomy will undoubtedly lose the battle of inventorying the diversity of life [52], prompting Wägele et al., to refer to taxonomists as “an endangered race” [53].

4.2. Prediction of the Richness of Potentially Unknown Species in South Africa

According to the opinion of taxonomist experts, we might be missing 1400 species in South Africa, whereas the modeling approach predicted that there are 1575 missing species. However, irrespective of the approach used (expert opinions or modeling), the estimates should be considered as conservative for the following reasons. Firstly, the present study focused only on vascular plants, which means that the missing species would be higher than predicted in the present study if nonvascular plants were included. Secondly, new species that may arise from the needed taxonomic revisions of some genera are not factored in the estimate. For example, Victor et al. [54] estimated that, on average, there might be 2200 new species in South African plant genera that have not been revised since 1980, particularly those with a predominantly small habit. Furthermore, the estimates reported here do not include the molecular or DNA-sequences approach, which is known to increase the discovery of new species [55,56], although an early study called for caution on the tremendous increase in new species due to molecular data [57]. Overall, it is likely that the remaining species (1400–1575 species predicted here) are rare species with narrow-ranged geographic distributions [56], making them difficult to find. More efforts (manpower, funds, time, etc.) than usual are therefore required if we are to comprehensively find, describe, and catalogue the plant diversity in the country. Such efforts required qualified taxonomists, which, unfortunately, are becoming rare owing to what Stroud et al. [58] recently referred to as “the botanical education extinction and the fall of plant awareness”.

4.3. Estimate of Remaining Time for a Comprehensive Assessment of Plant Diversity

Our data suggest that, on average, 1.07 species are described in South Africa on an annual basis. This rate of description implies that it would take 1308 years to describe all the remaining 1400 (expert opinion) vascular plant species or 1472 years to describe the remaining 1575 vascular plant species (modeling approach). This is scary given that the risk that unknown species slide into extinction is very high [10,59,60]. However, the true rate should be higher than 1.07 species/year given that all native species described are not always carried out by taxonomists based in South Africa alone but through collaborations with international taxonomists; however, our study involved only taxonomists based in South Africa.
Globally, according to an early study, the rate of species loss is currently 1000 times greater than the past rate, and if nothing is done, the rate may become 10,000 times greater [61,62] due to climate change, anthropogenic pressure characterized by habitat loss, pollution, and alien invasive species [16,63]. In a biosphere reserve in Canada, Elliot and Davies [64] reported the loss of 70 different species in only 50 years, suggesting the need to accelerate efforts toward a comprehensive assessment of biodiversity before its extinction. Specifically, in South Africa, 20% of all endemic plant species (2165) are at high risk of extinction, and the risk status of 8% (902 species) is still unknown due to lack of taxonomic and ecological information [65]. Even protected areas that are supposed to prevent the loss of species seem to be performing poorer than expected, given that 163 threatened species in South Africa occur outside all protected areas [65]. This pattern of extinction risk and limited effectiveness of protected areas [65] mean that we cannot afford to take longer time than we have already taken before serious efforts and commitments are made to identify and describe all unknown species in the country before they go extinct.
Interestingly, this long duration of more than 1000 years can be drastically reduced to only 40 to 45 years to identify the remaining unknown species. These 40–45 years would be required if we consider the rate of 35 species annually described (from IPNI source, 11,208 species native to South Africa were described in 323 years). For this to happen, massive efforts have to be deployed in training [58], funding, and recruitment of taxonomists who will be exclusively devoted to taxonomic activities. It is also important that such taxonomic activities be focused on poorly sampled biomes, e.g., Nama Karoo and Savannah biomes [66] and Indian Ocean Coastal Belt biome. Only such focused activities could accelerate species discoveries and descriptions [67]. Such efforts should be global if we are to considerably reduce the unaffordable timeframe (1200 years) predicted for a global assessment of biodiversity (see [3]).

4.4. Funds Required for a Comprehensive Taxonomic Plant Diversity Assessment

According to the results obtained from experts in this study, taxonomists have spent a total of ZAR 680,670,000 (USD 40,039,411) to describe 419 species. This implies that, in theory, ZAR 1,624,510.74 (USD 95,559) was spent, on average, to describe 1 species. At this rate, ZAR 2,558,604,415.00 (USD 150,506,142) would be required to describe the 1575 (modeling) remaining species or ZAR 2,274,315,036.00 (USD 133,783,237) for the 1400 (expert) remaining species. On these estimates, it is important to note the following.
First, our estimated funds are not exclusively for those spent on taxonomic activities since most of the respondents to our questionnaire are not full-time taxonomists; they are mostly primarily academics, and as such, the funding reported includes funding to run their laboratories, to cover student scholarships, and even for activities that may not be strictly taxonomy-related [42]. For example, in Brazil (animal taxonomists), 15% of the funding secured is allocated for taxonomist training, 50% for the salaries of full-time taxonomists in scientific institutions, and only 15% for the taxonomic project itself [42]. If this 15% is applied to South Africa’s case (15% of ZAR 1,624,510.74), it means that we should expect ZAR 243,677 to be exclusively spent for a species description.
However, if taxonomic activities are to be led in majority by academic taxonomists, the estimates reported in the present study (ZAR 1,624,510.74 per species) could be considered a true reflection of what would be needed. This is because academic taxonomists cannot be detached from their other academic duties, which also need to be concomitantly funded with their taxonomic works. One major issue raised by the respondents is that it is very difficult nowadays to obtain funding exclusively for taxonomic studies, and this seems to be a global issue [43] in comparison with activities that primarily focus on ecological and conservation studies. This is surprising since it is impossible to effectively conserve biodiversity and related ecosystem services [61] if we do not know the extent of what needs to be conserved.
One possible solution to this general lack of funding for exclusive taxonomic projects is for South Africa to establish, through SANBI, an exclusive taxonomic funding for training, targeted botanical expeditions, and incentive for taxonomic studies. Another solution would be to promote full-time taxonomists in research institutions, e.g., SANBI, to complement what academic taxonomists are currently doing to accelerate biodiversity assessment in the country. This would considerably reduce the funding required for taxonomic works. This reduction could even be more pronounced given the increased number of amateur taxonomists, molecular identification tools, increased international collaborations, and access to new areas of exploration [3].

4.5. Number of Taxonomists Required for a Comprehensive Plant Taxonomic Assessment

In the results obtained through a survey of expert taxonomists in South Africa, 19 taxonomists have described 419 species during their careers. This gives an average rate of 22.05 species per taxonomist, which is not far off from the Brazil rate of 24.8 species described per taxonomist [42]. The South African rate of species description is quite impressive considering that the Brazil description rate is for animals. It is easier to describe animals than plants mainly because of their difference in size. Applying the South African rate of description, 64 taxonomists would be required to describe the 1400 (expert) species. To describe 1575 species (modeling), 74 taxonomists would be needed. South Africa has over 10 university institutions that offer taxonomy as a field of study. However, 64 to 74 taxonomists seem to be a very low number especially because the missing species are rare and will be difficult to find.
The data collected from the IPNI indicate that 2239 taxonomists have described 11,208 species native to South Africa. Using the rate of description from the data from the IPNI, our model predicted that it would require 315 taxonomists to describe 1575 (modeling) species. Applying this rate to the 1400 (expert) species, it would require 280 taxonomists. The number of taxonomists predicted from the model seems to be more realistic compared with what the questionnaire survey suggested.
Unfortunately, there has been a shift from a balance between basic and applied research to a strong focus on revenue-generating science in the past few decades, with governments rarely allocating up to 30% of their research budgets to basic science [68,69]. This has particularly affected taxonomy [49,70]). Globally, the classic paid position of a full-time taxonomist practically does not exist anymore, and institutions that still maintain such slots are likely waiting for their personnel to retire [71].
Overall, there might be +/− 1500 species to be found in South Africa. The present study provides estimates of what it might take to advance toward a comprehensive plant diversity assessment in the country. To move toward a comprehensive assessment, Carbayo and Marques [42] suggested that “the most essential action now would be a concerted effort to raise the image of taxonomy from being seen merely as an ‘old’ and ‘simple’ task of biologists that is unfashionable and horribly constricted to low-impact-factor journals to being viewed instead as a fundamental, indispensable, and vibrant branch of the life sciences”.

Supplementary Materials

The following supporting information can be downloaded at: https://www.mdpi.com/article/10.3390/d14090748/s1, Table S1. All data collected through questionnaire; Table S2. Time series data on number of species described and number of authors who did the description (1696–2019); Questionnaire; R script; Ethics approval.

Author Contributions

Conceptualization, K.Y.; methodology, K.Y.; validation, K.Y. and A.M.; formal analysis, K.Y.; investigation, K.Y., M.P.M. and A.M.; resources, K.Y. and A.M.; data curation, M.P.M.; writing—original draft preparation, K.Y. and M.P.M.; writing—review and editing, K.Y. and A.M.; visualization, K.Y.; supervision, K.Y. and A.M.; project administration, K.Y.; funding acquisition, M.P.M. and K.Y. All authors have read and agreed to the published version of the manuscript.

Funding

This research was funded by the National Research Foundation granted to K.Y. (grant # 146104).

Institutional Review Board Statement

The study was conducted in accordance with the Declaration of Helsinki and approved by the Institutional Review Board (or Ethics Committee) of the University of Johannesburg at a meeting held on 4 March 2020 (evidence submitted as supplemental information).

Informed Consent Statement

Informed consent was obtained from all subjects involved in the study.

Data Availability Statement

Data analyzed are submitted as supplemental information.

Acknowledgments

We thank all those colleagues who responded to our questionnaires. We also thank three anonymous reviewers who contributed to the improvement of an initial draft of the paper.

Conflicts of Interest

The authors declare no conflict of interest.

References

  1. May, R.M. How many species are there on earth? Science 1988, 241, 1441–1449. [Google Scholar] [CrossRef] [PubMed]
  2. Wilson, D.E.; Reeder, D.M. Mammal Species of the World: A Taxonomic and Geographic Reference, 2nd ed.; Smithsonian Institution Press: Washington, DC, USA, 1993. [Google Scholar]
  3. Mora, C.; Derek, P.; Tittensor, S.A.; Alastair, G.B.; Simpson, B.; Boris, W. How many species are there on earth and in the ocean? PloS Biol. 2011, 9, 1001127. [Google Scholar] [CrossRef] [PubMed]
  4. Larsen, B.B.; Miller, E.C.; Rhodes, M.K.; Wiens, J.J. Inordinate fondness multiplied and redistributed the number of species on earth and the new pie of life. Q. Rev. Biol. 2017, 92, 229–265. [Google Scholar] [CrossRef]
  5. Wilson, D.S. Complex interactions in metacommunities, with implications for biodiversity and higher levels of selection. Ecology 1992, 73, 1984–2000. [Google Scholar] [CrossRef]
  6. Roskov, Y.; Kunze, T.; Paglinawan, L.; Orrell, T.; Nicolson, D.; Culham, A.; Bailly, N.; Kirk, P.; Bourgoin, T.; Baillargeon, G.; et al. Available online: http://www.catalogueoflife.org/annual-checklist/2014/info/ac (accessed on 1 January 2021).
  7. Ehrlich, P.R. Biodiversity studies: Science and policy. Science 1991, 253, 758–762. [Google Scholar] [CrossRef]
  8. Gaston, K.; May, R. Taxonomy of taxonomists. Nature 1992, 356, 281–282. [Google Scholar] [CrossRef]
  9. Lambshead, P.J.D. Recent developments in marine benthic biodiversity research. Océanis 1993, 19, 5–24. [Google Scholar]
  10. Costello, M.J.; Wilson, S.; Houlding, B. Predicting total global species richness using rates of species description and estimates of taxonomic effort. Syst. Biol. 2012, 61, 871. [Google Scholar] [CrossRef]
  11. Locey, K.J.; Lennon, J.T. Scaling laws predict global microbial diversity. Proc. Natl. Acad. Sci. USA 2016, 113, 5970–5975. [Google Scholar] [CrossRef]
  12. Mace GNorris, K.; Fitter, A. Biodiversity and ecosystem services: A multilayered relationship. Trends Ecol. Evol. 2012, 27, 19–26. [Google Scholar] [CrossRef]
  13. Sarukhán, J.; Whyte, A.; Hassan, R.; Scholes, R.; Ash, N.; Carpenter, S.T.; Pingali, P.L.; Bennett, E.M.; Zurek, M.B.; Chopra, K.; et al. Millenium Ecosystem Assessment: Ecosystems and Human Well-Being; Island Press: Washington, DC, USA, 2005. [Google Scholar]
  14. Daily, G.C.; Matson, P.A. Ecosystem services: From theory to implementation. Proc. Natl. Acad. Sci. USA 2008, 105, 9455–9456. [Google Scholar] [CrossRef] [PubMed] [Green Version]
  15. Mace, G.; Revenga, C.; Ken, B. Biodiversity, in Ecosystems and Human Well-Being: Current State and Trends; Ceballos, G., Orians, G., Pacala, S.L., Eds.; Island Press: Washington, DC, USA, 2015; Volume 4, pp. 77–121. [Google Scholar]
  16. Barnosky, A.D.; Matzke, N.; Tomiya, S.; Wogan, G.O.; Swartz, B.; Quental, T.B.; Marshall, C.; McGuire, J.L.; Lindsey, E.L.; Maguire, K.C.; et al. Has the Earth’s sixth mass extinction already arrived? Nature 2011, 471, 51–57. [Google Scholar] [CrossRef]
  17. Ceballos, G.; Ehrlich, P.R.; Barnosky, A.D.; García, A.; Pringle, R.M.; Palmer, T.M. Accelerated modern human–induced species losses: Entering the sixth mass extinction. Sci. Adv. 2015, 1, e1400253. [Google Scholar] [CrossRef]
  18. Steadman, D.W. Extinction and Biogeography of Tropical Pacific Birds; University of Chicago Press: Chicago, IL, USA, 2006. [Google Scholar]
  19. Hughes, B.J.; Daily, C.G.; Ehrlich, P.R. Population diversity: Its extent and extinction. Science 1997, 278, 689–692. [Google Scholar] [CrossRef]
  20. IUCN. The IUCN Red List of Threatened Species (IUCN, 2014). 2014. Available online: http://www.iucnredlist.org (accessed on 11 March 2019).
  21. Ceballos, G.; Ehrlich, P.R. The misunderstood sixth mass extinction. Science 2018, 360, 1080–1081. [Google Scholar] [CrossRef] [PubMed]
  22. Davies, T.J.; Smith, G.F.; Bellstedt, D.U.; Boatwright, J.S.; Bytebier, B. Extinction Risk and Diversification are Linked in a Plant Biodiversity. PLoS Biol. 2011, 9, e1000620. [Google Scholar] [CrossRef] [PubMed]
  23. Polidoro, B.A.; Carpenter, K.E.; Collins, L.; Duke, N.C.; Ellison, A.M.; Ellison, J.C.; Farnsworth, E.J.; Fernando, E.S.; Kathiresan, K.; Koedam, N.E.; et al. The loss of species: Mangrove extinction risk and geographic areas of global concern. PLoS ONE 2010, 5, 10095. [Google Scholar] [CrossRef] [PubMed]
  24. Dirzo, R.; Raven, P. Global state of biodiversity and loss. Annu. Rev. Environ. Resour. 2003, 28, 137–167. [Google Scholar] [CrossRef]
  25. Ceballos, G.; Garcia, A.; Ehrlich, P.R. The sixth extinction crisis: Loss of animal populations and species. J. Cosmol. 2010, 8, 31. [Google Scholar]
  26. Álvarez-Presas, M.; Carbayo, F.; Rozas, J.; Riutort, M. Land planarians (Platyhelminthes) as a model organism for fine-scale phylogeographic studies: Understanding patterns of biodiversity in the Brazilian Atlantic Forest hotspot. J. Evol. Biol. 2011, 24, 887–896. [Google Scholar] [CrossRef]
  27. Rouget, M.; Reyers, B.; Jonas, Z.; Desmet, P.; Driver, A.; Maze, K.; Egoh, B.; Cowling, R.M. National Spatial Biodiversity Assessment 2004, Technical Report Volume 1: Terrestrial Component; South African National Biodiversity Institute: Pretoria, South Africa, 2004. [Google Scholar]
  28. SANBI South African National Biodiversity Institute. National Biodiversity Monitoring & Reporting Framework; SANBI: Silverton, South Africa, 2007. [Google Scholar]
  29. Rutherford, M.; Mucina, L.; Powrie, L. Biomes and Bioregions of Southern Africa. In The vegetation of South Africa, Lesotho and Swaziland; SANBI: Silverton, South Africa, 2006. [Google Scholar]
  30. Cox, R.L.; Underwood, E. C The importance of conserving biodiversity outside of protected areas in Mediterranean ecosystems. PLoS ONE 2011, 6, 0014508. [Google Scholar]
  31. Driver, A.; Maze, K.; Rouget, M.; Lombard, A.T.; Nel, J.; Turpie, J.K.; Cowling, R.M.; Desmet, P.; Goodman, P.; Harris, J.; et al. National Spatial Biodiversity Assessment 2004: Priorities for Biodiversity Conservation in South Africa; SANBI: Silverton, South Africa, 2005. [Google Scholar]
  32. Victor, J.E.; Smith, G.F.; Van Wyk, A.E.V. History and drivers of plant taxonomy in South Africa. Phytotaxa 2016, 269, 193. [Google Scholar] [CrossRef]
  33. RSA (Republic of South Africa). Geography and Climate. 2021. Available online: https://www.gov.za/about-sa/geography-and-climate (accessed on 1 June 2022).
  34. Rodda, S.N.; Stenström, T.A.; Schmidt, S.; Dent, M.; Bux, F.; Hanke, N.; Buckley, C.A.; Fennemore, C. Water security in South Africa: Perceptions on public expectation and municipal obligations, governance and water re-use. Water SA 2016, 42, 456–465. [Google Scholar]
  35. Tyson, P.D.; Preston-Whyte, R.A. Weather and Climate of Southern Africa; Oxford University Press: Oxford, UK, 2000. [Google Scholar]
  36. Bezeng, B.S.; Yessoufou, K.; Taylor, P.J.; Tesfamichael, S.G. Expected spatial patterns of alien woody plants in South Africa’s protected areas under current scenario of climate change. Sci. Rep. 2020, 10, 1–12. [Google Scholar] [CrossRef] [PubMed]
  37. Germishuizen, G.; Meyer, N.L.; Steenkamp, Y.; Keith, M. A checklist of south African plants. In Southern African Botanical Diversity Network Report; SABONET: Pretoria, South Africa, 2006. [Google Scholar]
  38. Victor, J.; Smith, G.; Van Wyk, A.; Ribeiro, S. Plant taxonomic capacity in South Africa. Phytotaxa 2015, 238, 149. [Google Scholar] [CrossRef]
  39. R Development Core Team. R: A Language and Environment for Statistical Computing; R Foundation for Statistical Computing: Vienna, Austria, 2019. [Google Scholar]
  40. Dickey, D.A.; Fuller, W.A. Distribution of the estimators for autoregressive time series with a unit root. J. Am. Stat. Assoc. 1979, 74, 427–431. [Google Scholar]
  41. Engle, R. Autoregressive Conditional Heteroskedasticity With Estimates of the Variance of U.K. Inflation. Econometrica 1982, 50, 987–1008. [Google Scholar] [CrossRef]
  42. Carbayo, F.; Marques, A.C. The costs of describing the entire animal kingdom. Trends Ecol. Evol. 2011, 26, 154–155. [Google Scholar] [CrossRef]
  43. Morgan, D.J. Gender issues in taxonomy: More than just Latin. 2015. Available online: http://www.biodiversityinfocus.com/blog/2015/05/07/gender-issues-in-taxonomy-more-than-just-latin/ (accessed on 1 June 2022).
  44. Huang, J.; Gates, A.J.; Sinatra, R.; Barabási, A.L. Historical comparison of gender inequality in scientific careers across countries and disciplines. Proc. Natl. Acad. Sci. USA 2020, 117, 4609–4616. [Google Scholar] [CrossRef]
  45. Zookeys2020. Available online: https://zookeys.pensoft.net/browse_journal_issues.php?journal_name=zookeys&journal_id=2&p=2 (accessed on 1 November 2020).
  46. Cho, H.A.; Schuman, C.; Jennifer, E.; Adler, M.; Gonzalez, O.; Graves, S.; Jana, J.; Huebner, R.; Marchant, D.B.; Rifai, S.; et al. Women are underrepresented on the editorial boards of journals in environmental biology and natural resource management. Peer Rev. J. 2014, 2, e542. [Google Scholar] [CrossRef]
  47. Lindon, H.L.; Gardiner, L.M.; Brady, A.; Vorontsova, M.S. Fewer than three percent of land plant species named by women: Author gender over 260 years. Taxon 2015, 64, 209–215. [Google Scholar] [CrossRef]
  48. SANBI. Biodiversity Mainstreaming and Policy Advice Assessment. 2020. Available online: http://opus.sanbi.org/bitstream/20.500.12143/6990/1/Biodiversity%20mainstreaming%20assessment%20with%20annexures.pdf (accessed on 1 April 2021).
  49. Drew, L.W. Are We Losing the Science of Taxonomy? As need grows, numbers and training are failing to keep up. Biol. Sci. 2011, 61, 942–946. [Google Scholar]
  50. Coleman, C.O. Taxonomy in times of the taxonomic impediment–examples from the community of experts on amphipod crustaceans. J. Crustacean Biol. 2015, 35, 729–740. [Google Scholar] [CrossRef]
  51. Britz, R.; Hundsdorfer, A.; Fritz, U. Funding, training, permits—The three big challenges of taxonomy. Megataxa 2020, 1, 49–52. [Google Scholar] [CrossRef]
  52. Pyke, G.H.; Ehrlich, P.R. Biological collections and ecological/environmental research: A review, some observations and a look to the future. Biol. Rev. 2010, 85, 247–266. [Google Scholar] [CrossRef] [PubMed]
  53. Wägele, H.; Klussmann-Kolb, A.; Kuhlmann, M.; Haszprunar, G.; Lindberg, D.; Koch, A.; Wägele, J.W. The taxonomist—An endangered race. A practical proposal for its survival. Front. Zool. 2011, 8, 25. [Google Scholar] [CrossRef] [PubMed] [Green Version]
  54. Victor, J.E.; Smith, G.; Van Wyk, A.E.V. Strategy for Plant Taxonomic Research in South Africa 2015–2020. SANBI Biodiversity Series; South African National Biodiversity Institute: Pretoria, South Africa, 2015. [Google Scholar]
  55. Hebert, P.D.N.; Cywinska, A.; Ball, S.L.; deWaard, J.R. Biological identifications through DNA barcodes. Proc. R. Soc. Biol. 2003, 270, 313–322. [Google Scholar] [CrossRef]
  56. Cao, X.; Liu, J.; Chen, J.; Zheng, G.; Kuntner, M.; Agnarsson, I. Rapid dissemination of taxonomic discoveries based on DNA barcoding and morphology. Sci. Rep. 2016, 6, 1–13. [Google Scholar] [CrossRef]
  57. Meiri, S.; Mace, G.M. New taxonomy and the origin of species. Public Libr. Sci. Biol. 2007, 5, 194. [Google Scholar] [CrossRef]
  58. Stroud, S.; Fennell, M.; Mitchley, J.; Lydon, S.; Peacock, J.; Bacon, K.L. The botanical education extinction and the fall of plant Awareness. Ecol. Evol. 2022, 12, e9019. [Google Scholar] [CrossRef]
  59. Edwards, D.P.; Laurance, W.F. Biodiversity despite selective logging. Science 2013, 339, 646–647. [Google Scholar] [CrossRef]
  60. Mora, C.; Caldwell, I.R.; Caldwell, J.M.; Fisher, M.R.; Genco, B.M.; Running, S.W. Disappearing suitable days for plant growth under projected climate change and potential human and biotic vulnerability. Public Libr. Sci. Biol. 2015, 13, 1002167. [Google Scholar]
  61. Millennium Ecosystem Assessment. Ecosystems and Human well-being: Wetlands and water Synthesis; World Resources Institute: Washington, DC, USA, 2005. [Google Scholar]
  62. Ceballos, G.; Ehrlich, P.R.; Dirzo, R. Biological annihilation via the ongoing sixth mass extinction signaled by vertebrate population losses and declines. Proc. Natl. Acad. Sci. USA 2017, 114, 6089–6096. [Google Scholar] [CrossRef] [PubMed]
  63. Davies, T.J. The macroecology and macroevolution of plant species at risk. New Phytol. 2019, 222, 708–713. [Google Scholar] [CrossRef] [PubMed]
  64. Elliott, T.L.; Davies, T.J. Phylogenetic attributes, conservation status and geographical origin of species gained and lost over 50 years in a UNESCO Biosphere Reserve. Biodivers. Conserv. 2019, 28, 711–728. [Google Scholar] [CrossRef]
  65. Hoveka, L.N.; van der Bank, M.; Bezeng, B.S.; Davies, T.J. Identifying biodiversity knowledge gaps for conserving South Africa’s endemic flora. Biodivers. Conserv. 2020, 29, 1–17. [Google Scholar] [CrossRef]
  66. Hoveka, L.N.; van der Bank, M.; Davies, T.J. Evaluating the performance of a protected area network in South Africa and its implications for megadiverse countries. Biol. Conser. 2020, 248, 108577. [Google Scholar] [CrossRef]
  67. Joppa, L.N.; Roberts, D.L.; Pimm, S.L. How many species of flowering plants are there? Proc. R. Soc. B Biol. Sci. 2011, 278, 554–559. [Google Scholar] [CrossRef]
  68. Nelson, R.R. The simple economics of basic scientific research. J. Political Econ. 1959, 67, 297–306. [Google Scholar] [CrossRef]
  69. Hutchings, P. Why are taxonomists often regarded as second class citizens? a misclassification that threatens the basic infrastructure of biodiversity. In Grumpy Scientists: The Ecological Conscience of a Nation; Lunney, D., Hutchings, P., Recher, H.F., Eds.; Royal Zoological Society of New South Wales: Mosman, NSW, Australia, 2013; pp. 26–30. [Google Scholar]
  70. UNESCO. Available online: https://en.unesco.org/gem-report/taxonomy/term/199 (accessed on 30 November 2019).
  71. Lucking, R. Three challenges to contemporaneous taxonomy from a licheno-mycological perspective. Megataxa 2020, 1, 78–103. [Google Scholar] [CrossRef] [Green Version]
Figure 1. Location of South Africa.
Diversity 14 00748 g001
Figure 2. Summary of demographic structure of population of taxonomists who took part in this study. Dr = doctor; Ass-Prof. = associate professor; Prof. = professor; Res. Inst = research institutions.
Diversity 14 00748 g002
Figure 3. Distribution of taxonomists according to taxonomic papers published.
Diversity 14 00748 g003
Figure 4. Summary of taxonomic activities of plant experts in South Africa.
Diversity 14 00748 g004
Figure 5. Change in number of native plant species described over time in South Africa.
Diversity 14 00748 g005
Figure 6. Prediction of trend in number of species to be described over time in South Africa. This prediction was carried out by fitting GARCH model to the number of South Africa’s native species described from 1696 to 2019. Red line corresponds to prediction of how the number of species to be described would be changing over the next 150 years. Vertical dashed bold line indicates number of years in which the number of species to be described would be 0, meaning that total number of species in the country would have been described. On the figure, this number corresponds to 45 years. Clearly, after 45 years, the number of species to be described (red line) does not change anymore, implying after 45 years the total number of species in the country would have been described. Horizontal bold dashed line shows the 0 value on the Y axis. The dotted lines indicate confidence intervals.
Diversity 14 00748 g006
Figure 7. Changes in number of authors who describe all South Africa’s native species.
Diversity 14 00748 g007
Publisher’s Note: MDPI stays neutral with regard to jurisdictional claims in published maps and institutional affiliations.

