Article

Characterization of Okra (Abelmoschus esculentus L.) Accessions with Variable Drought Tolerance through Simple Sequence Repeat Markers and Phenotypic Traits

by
Sonto Silindile Mkhabela
1,2,*,
Hussein Shimelis
1,3,
Abe Shegro Gerrano
2,
Jacob Mashilo
1,3 and
Admire Shayanowako
3
1
Discipline of Crop Science, School of Agricultural, Earth and Environmental Sciences, University of KwaZulu-Natal, Pietermaritzburg 3209, South Africa
2
Industrial and Medicinal Plants, Agricultural Research Council—Vegetable, Private Bag X293, Pretoria 0001, South Africa
3
African Centre for Crop Improvement (ACCI), University of KwaZulu-Natal, Pietermaritzburg 3209, South Africa
*
Author to whom correspondence should be addressed.
Diversity 2022, 14(9), 747; https://doi.org/10.3390/d14090747
Submission received: 11 August 2022 / Revised: 6 September 2022 / Accepted: 7 September 2022 / Published: 11 September 2022
(This article belongs to the Special Issue Ecology, Evolution and Diversity of Plants)

Abstract

:
Genetic diversity analysis of crop genetic resources is a prerequisite for parental selection with suitable and complementary profiles for breeding. The objectives of this study were to determine genetic diversity present among okra accessions using simple sequence repeat (SSR) and complementary phenotypic markers and to select genetically divergent and superior parental accessions for pre-breeding. Twenty-six preliminarily selected okra accessions were assessed using nine highly polymorphic SSR markers and phenotyped under drought-stressed (DS) and non-stressed (NS) environmental conditions using a 13 × 2 alpha lattice design with two replications. Data were collected on the following eleven phenotypic traits: plant height (PH), days to 50% maturity (DTM), fresh pod length (FPL), dry pod weight (DPW), dry pod length (DPL), number of pods per plant (NPPP), pod yield per plant (PYPP), total above-ground biomass (AGB), harvest index (HI), root weight (RW), and root to shoot ratio (RSR). The SSR markers revealed an expected mean heterozygosity value of 0.54, indicating moderate genetic diversity among the tested okra accessions. Cluster analysis based on phenotypic and SSR markers differentiated the accessions into three distinct genetic groups. Wide phenotypic variation was observed for PH, FPL, NPPP, and PYPP under NS and DS conditions. PYPP was positively and significantly correlated with FPL (r = 0.81), ABG (r = 0.69), and HI (r = 0.67) under DS conditions, and FPL (r = 0.83) and AGB (r = 0.60) under NS conditions. Genetically complementary accessions such as LS04, LS05, LS06, LS07, LS08, LS10, LS11, LS15, LS18, LS23, LS24, and LS26 were identified for their high yield potential and related yield-improving traits under DS conditions. The identified accessions are recommended as parents for hybridization and selection programs to improve the yield potential of okra under drought-stressed environments.

1. Introduction

Okra (Abelmoschus esculentus L., 2n = 130) is an allotetraploid derived from the natural hybridization of a wild progenitor A. tuberculatus (2n = 58), with another yet unidentified species with 2n = 72 chromosomes. Okra is a vegetable crop that is widely cultivated for its fresh and succulent pods [1,2]. Okra is an autogamous species and predominantly a self-pollinating crop. However, varying levels of cross-pollination have also been reported depending on the activity of insect pollinators and the growing environment [1]. The tender green pod is the most economical and vital source of vitamins A, B1, B3, B6, folic acid, C, and K, essential for the human diet [3]. Potassium, magnesium, phosphorus, and calcium are the principal and essential mineral elements present in the green and immature pods of okra [4]. In addition, the pod contains 9.7% carbohydrate, 2.2 % protein, and 1% fibre [5]. Okra grains contain 22.14% protein, rare amino acids (such as lysine and tryptophan), fat, and fibre. The seed oil content varies from 20–40%, and the major fatty acids of the seed are linoleic acid (49.54%), palmitic acid (28.60%), and oleic acid [6]. These nutritional attributes make okra an important food security crop, especially in sub-Saharan Africa (SSA), where malnutrition is the highest. Africa accounts for 32.8% of the world’s okra production. West and Central African countries contribute to over 75% of total okra production in SSA [7]. Despite the significant contribution by SSA toward global okra production, the average crop yields are low and variable in the region due to a lack of improved and modern varieties.
Okra is drought-tolerant crop and can successfully grow under water-limited conditions with minimal supplemental irrigation. Despite being relatively drought-tolerant, the crop fails to reach its maximum yield potential, resulting in low marketable pod yields, primarily when drought stress occurs at the flowering and pod development stages. For example, 37 to 83% yield losses attributed to drought stress occurred during the reproductive stage [8,9]. The low yield performance is related with the cultivation of low-yielding and drought-sensitive varieties.
The crop exhibits extensive morphological variation for traits such as plant height, fresh pod length, number of days to 50% flowering and maturity, number of branches, number of pods per plant, and pod yield [1,2]. Phenotypic traits such as plant height, number of branches, fresh pod length, number of pods per plant, total biomass, and seed yield exhibit positive associations with pod yield [4,9,10]. Hence, these traits could serve as useful product profiles for breeding of improved okra accessions for high yield and related traits. Therefore, rigorous phenotypic assessment of okra genetic resources will identify beneficial traits for future breeding. However, phenotypic traits are influenced by the genotype, environment, and genotype-by-environment interaction, confounding trait heritability and genotype performances [10,11]. To complement phenotypic assessment and for detailed genetic analysis, molecular markers are eminent genetic tools [1,6,12]. Molecular markers improve selection efficiency through phenotypic traits and accelerate genetic gains for desired traits.
Markers such as random amplified polymorphic DNA (RAPD) inter-simple sequence repeat (ISSR) [10,12,13], amplified fragment length polymorphism (AFLP) [14,15], sequence-related amplified polymorphism (SRAP), and simple sequence repeats (SSR) [16,17] have been successfully used. The marker systems were applied to explore genetic diversity and relatedness among okra genetic resources. These allowed for delineating heterotic groups among core collections of the crop and assisted in the selection and variety design. Among the molecular markers, the SSRs are highly polymorphic and reproducible markers useful for effective genotyping and selection programs [9,18,19].
Improved varieties of okra are yet to be developed and marketed for food security, better nutrition, and economic gains. There are limited drought-adapted varieties in SSA, which necessitates developing high-yielding and drought-tolerant okra genotypes adapted to the region. Therefore, the objectives of this study were to determine the genetic diversity present among okra accessions using simple sequence repeat and complementary phenotypic markers and to identify heterotic groups to select genetically divergent and superior parental accessions for pre-breeding.

2. Materials and Methods

2.1. Plant Materials

The present study used 25 okra landrace accessions sourced from the Agricultural Research Council, Vegetable, Industrial and Medicinal Plants (ARC-VIMP)/South Africa. Locally adapted and grown okra variety “Clemson Spineless” was also included as a comparative control. The code and number and geographical origin of the okra accessions used in the study are presented in Table 1.

2.2. DNA Extraction, Purification, and Quantification

Okra seeds were sent to SciCorp Laboratories (SciCorp-lab, SA Pty Ltd., Pietermaritzburg, South Africa) for SSR analysis. Genomic DNA was extracted from 20 seeds per genotype using modified CTAB method [20]. The quantity and quality of total genomic DNA were determined by 0.7% Tris-Borate-EDTA (TBE) agarose gel electrophoresis and spectrophotometer, respectively. A working concentration of 20 ng μL−1 was standardized for all extracted DNA.

2.3. Polymerase Chain Reaction (PCR) and SSR Analysis

Okra seeds were found to be better for DNA sampling and analysis due to the mucilaginous material present in the leaves. Bulked DNA was used for amplification and analysis. SSR sequences were amplified through PCR using 9 selected diagnostic polymorphic SSR markers developed for okra (Table 2). These markers were selected based on their high polymorphic information content (PIC) and that they were developed and recommended for okra genetic diversity studies [18,21,22,23]. PCR amplification reaction contained 20 μL of PCR mix. The mix contained 1x PCR buffer, 3 mM MgCl, 1.25 U Taq polymerase, 0.2 mM dNTPs, 4pM each primer, and 5 ng genomic DNA (Bioline, Meridian, MI, USA). A PCR profile of initial denaturation for 2 min at 94 °C and 33 cycles of denaturation for 1 min at 94 °C, the annealing temperature of 63 °C for 2 min, and extension for 2 min at 72 °C was used. PCR products were fluorescently labelled and separated by capillary electrophoresis on ABI 3130 automatic sequencer (Applied Biosystems, Johannesburg, South Africa) and analysis was performed using GeneMapper 4.1 (Applied Biosynthesis, Johannesburg, South Africa). A 36 cm capillary and 3130 POP-7 polymer (Applied Biosystem, Johannesburg, South Africa) were used.

2.4. Marker Data Analysis

2.4.1. Computation of Principal Coordinate Analysis (PCoA) and Genetic Parameters

The GenAlex software version 6.5 [24] was used for data analyses and to summarize PCoA and genetic diversity parameters. Two approaches were adopted to investigate the genetic diversity and structure among the accessions. The first approach treated DNA polymorphisms as binary data (presence or absence). To determine the genetic structure within and among landraces, a second approach was adopted based on the co-dominant nature of the marker. Genetic parameters such as number of alleles per locus (Na), number of effective alleles per locus (Ne), allelic richness (Ar), Shannon’s information index (I), observed heterozygosity (Ho), and expected heterozygosity (He) were calculated using GenAlex version 6.5 according to Nei and Li [25]. Polymorphic information content (PIC) was calculated using the formula PIC = 1 − ΣPij2, where Pij is the frequency of the jth allele of the ith locus [25]. The number of polymorphic loci was estimated for each pre-determined group based on pedigree information. Online-based ClustVis (https://biit.cs.ut.ee/clustvis_large/, accessed on 22 May 2022) was used to visualize the heatmap, and plots of total genetic variation were analysed using pairwise genetic distance for haploid and co-dominant SSR markers [26].

2.4.2. Cluster Analysis

The binary data were used to obtain a dissimilarity matrix using the Jaccard index. The matrix was used to perform cluster analysis based on the unweighted pair group method using the arithmetic mean algorithm (UPGMA) in DARwin 5.0 software [27]. A dendrogram was then generated on the dissimilarity matrix to determine genetic relationships among the tested accessions. Bootstrap analysis was performed for node construction using 10,000 bootstrap values to estimate the reliability of the clustering pattern. A joint hierarchical cluster was generated to determine the association between genotypic and phenotypic data for both stressed and non-stressed conditions. The clusters were constructed using the “Cluster” package in R software [28].

2.5. Phenotyping Okra Accessions

2.5.1. Experimental Design and Crop Establishment

Two seeds of each genotype were grown in 5 L capacity plastic pots filled with composted pine bark growing media. Two plants were established per pot for each genotype. The day/night temperatures in the greenhouse (GH) were 30 °C/20 °C and the relative humidity ranged between 45 and 55% during the study. Inorganic fertilizers consisting of nitrogen (N), phosphorus (P), and potassium (K) were applied at a rate of 120, 30, and 30 kg ha−1, based on soil fertility recommendations using urea (46-0-0), phosphorus pentoxide (P2O5), and potassium oxide (P2O), respectively. The okra accessions were evaluated using a 13 × 2 alpha lattice design under drought-stressed (DS) and non-stressed (NS) conditions with two replications. DS was imposed at 50% flowering until physiological maturity to mimic terminal drought stress by withholding irrigation until the soil water content reached 30% field capacity. In addition, plots were irrigated at field capacity to allow for continued plant growth and development. The NS conditions involved maintaining soil moisture content at field capacity by supplying water through the dripper irrigation system until physiological maturity under GH environment. Tensiometers (Spectrum Technologies, Inc., Aurora, IL, USA) were used to monitor soil moisture status during the experiment.

2.5.2. Phenotypic Data Collection

Data were collected from three randomly selected and tagged plants for each genotype. At physiological maturity, data were collected on the following phenotypic traits. Plant height (PH) was measured in cm from the ground level to the apex of the plant on the main stem. Pods were harvested when 50% of the pods were 3–5 cm long, which is regarded as a marketable size [9]. Harvesting was conducted every third day by hand. At each harvest, the number of pods per plant (NPPP) were counted, and fresh pod length (FPL) was measured in cm. At the end of the experiment, data were computed on the number of pods per plant (NPPP), fresh pod length (FPL), and pod yield per plant (PYPP). Plants from the second pots were left until maturity to collect data on dry pod length (DPL) which was measured in cm, and mature dry pod weight (DPW) was determined by weighing dry pods harvested per plant and expressed in grams. Yield per plant was determined by weighing fresh pods harvested per plant and expressed in grams. The plants were cut at the soil surface to separate shoots and roots biomass. Total above-ground biomass (AGB) was determined in grams by weighing the stem and the pod of the plants per pot. Root weight (RW) was determined in grams by weighing all roots. Root to shoot ratio (RSR) was calculated as the ratio of shoot to root biomass. Harvest index (%) was calculated as HI = (pod weight/total above − ground biomass) ×100.

2.5.3. Phenotypic Data Analysis

Phenotypic data were subjected to analysis of variance (ANOVA) using a lattice procedure with GenStat 18th Edition (VSN International, Hempstead, UK). Treatment means were separated using the least significant difference (LSD) at the 5% significance level. Pearson’s correlation coefficients were calculated using IBM SPSS Statistics 25.0 (SPSS Inc., Chicago, IL, USA, 2008) to determine the magnitude of the relationship among phenotypic traits. Principal component analysis (PCA) was used to identify influential traits under NS and DS conditions using R Studio version 4.0, ggplot2(R Core Team, 2020, Vienna, Austria). Biplots were constructed using R version 4.0, ggplot2 (R Core Team, 2020) to determine relationships between the accessions and the assessed phenotypic traits. Hierarchical clusters were generated using phenotypic data based on the Gower method [29], using the Cluster package in R software [28].

3. Results and Discussion

3.1. Marker Characterization

Understanding the genetic diversity present among diverse okra accessions is useful for identifying and selecting suitable and contrasting parental genotypes for breeding, leading to the accelerated development of improved varieties. The estimated genetic parameters derived using SSR markers are presented in Table 3. The SSR markers amplified 24 putative alleles among the tested okra accessions, ranging from 2 for the markers AVRDC-OKRA64, Okra 152, Okra 162, Okra 111, and AVRDC-Okra57 to 5 for the marker AVRDC-Okra 9 with a mean value of 2.70 alleles per locus. Out of 10 selected SSRs used in this study, 9 SSR primers could amplify successfully. The level of amplification in the present study was higher compared to the 75% reported in okra by Kumar et al. [30]. This indicates the suitability of the sampled SSR markers for the analysis of genetic variation and relationship in okra. A total of 24 alleles were amplified, with an average of 2.70 alleles per locus (Table 3), and this average number of alleles indicates that this genetic diversity would be relatively moderate [31]. This was lower than the value of 71 alleles per locus reported by Mohammed et al. [18] when assessing 32 okra accessions genotypes with 16 SSR markers. The variability in the number of alleles observed could be attributed to the genetic differences in the tested lines and the difference in the sampled SSR markers. Effective allele number (Ne) ranged from 2 for markers AVRDC-OKRA64, Okra 152, Okra 162, Okra 111, and AVRDC-Okra57 to 2.76 for marker AVRDC-Okra9 with a mean of 2.24, indicating that this genetic diversity would be relatively small. However, greater diversity has been reported [16], indicating a mean number of 4.8 effective alleles after evaluating 20 okra accessions using SSR markers. This corroborates with the results of two to seven (mean = four) alleles per locus reported by Kpodo et al. [15]. The mean Shannon information index value of the test population was 0.83, ranging from 0.69 for markers AVRDC-OKRA64, Okra 152, Okra 162, Okra 111, and AVRDC-Okra57 to 1.16 for marker AVRDC-Okra9. The observed heterozygosity value was 1, suggesting that all the accessions reached 100% heterozygosity. The expected heterozygosity ranged from 0.50 to 0.64 with a mean value of 0.54. Marker AVRDC-Okra9 had the highest He of 0.64. The inbreeding coefficient varied from −0.57 to −1.00, with a mean of −0.85. Nine markers (100%) were highly polymorphic with PIC > 0.50, indicating their high discriminating ability and their utility for genetic analysis studies in okra. PIC values ranged from 0.50 to 0.64 with a mean of 0.55, which is relatively higher than the mean PIC value of 0.51 reported by Kpodo et al. [15] and lower than the PIC value of 0.81 reported by Mohammed et al. [18] in okra. The average PIC value of 0.55 indicates that these markers are informative for genetic diversity analysis [22]. High polymorphism values suggest that the selected markers are suitable for distinguishing the genetic diversity among the tested accessions. The high polymorphism values observed when using the sampled SSR markers may be due to the amphipolyploid nature of Abelmoschus species. In addition, there is a higher frequency of mutations in polyploids, such as in okra, than diploids [21], leading to increased genetic diversity and genetic plasticity [10].

3.2. Principal Coordinate Analysis (PCoA) of 26 Okra Accessions Genotyped Using 9 SSR Markers

The genetic structure of the assessed accessions was inferred with the PCoA based on the genetic matrix (Figure 1). The first principal coordinate (PC) accounted for 25.19% of variation present among accessions. The coordinate analysis indicated higher genetic diversity among the two accessions LS02 and LS11 compared to other genotypes, due to their inherent genetic variation. The second principal component suggests a further separation between LS02, LS11, and LS13, accounting for 18.24% of the total variation. The grouping of LS01, LS03, LS04, LS09, and LS26 into the same cluster may indicate the genetic similarity among these accessions. Hence, the genetic information generated can be useful to design crosses and exploit genetic diversity through selection programs.

3.3. Heatmap Cluster

A heatmap based on SSR marker transcription was constructed using the hierarchical clustering method discerning the genetic relationship of 26 okra accessions based on Jaccard’s coefficient (Figure 2). The assayed okra accessions and SSR markers each were grouped into two main clusters. The first cluster had one subcluster consisting of eight accessions, of which four were collected from Malaysia (LS02 and LS10), Myanmar (LS11), and Cambodia (LS16) in Asia and two from Mali (LS19) and Zambia in Africa (LS08). The second cluster contained two subclusters with seven accessions, including LS24, LS13, LS07, LS22, LS23, LS09, and LS20 on the first subcluster, which was dominated by accessions collected from Nigeria, Malaysia, Taiwan, Turkey, Brazil, Zambia, and Tanzania, respectively, and eleven accessions LS06, LS01, LS26, LS25, LS12, LS17, LS04, LS21, LS15, LS05, and LS14 on the second subcluster, of which nine were sampled from Asia and one each from South Africa (LS26) and Nigeria (LS25). The observed genetic dissimilarity indicates that these accessions are related to different geographic locations and most of the cultivated accessions in each geographic region were uniquely differentiated. This may be due to the limited outcrossing rate among the geographic regions of the evaluated okra accessions. Genetic variability among okra accessions was also reported by Massucato et al. [12]. Information on the genetic grouping of the accessions is essential in selecting contrasting parents based on the breeding history and genetic relationship of the assessed population and test environment.

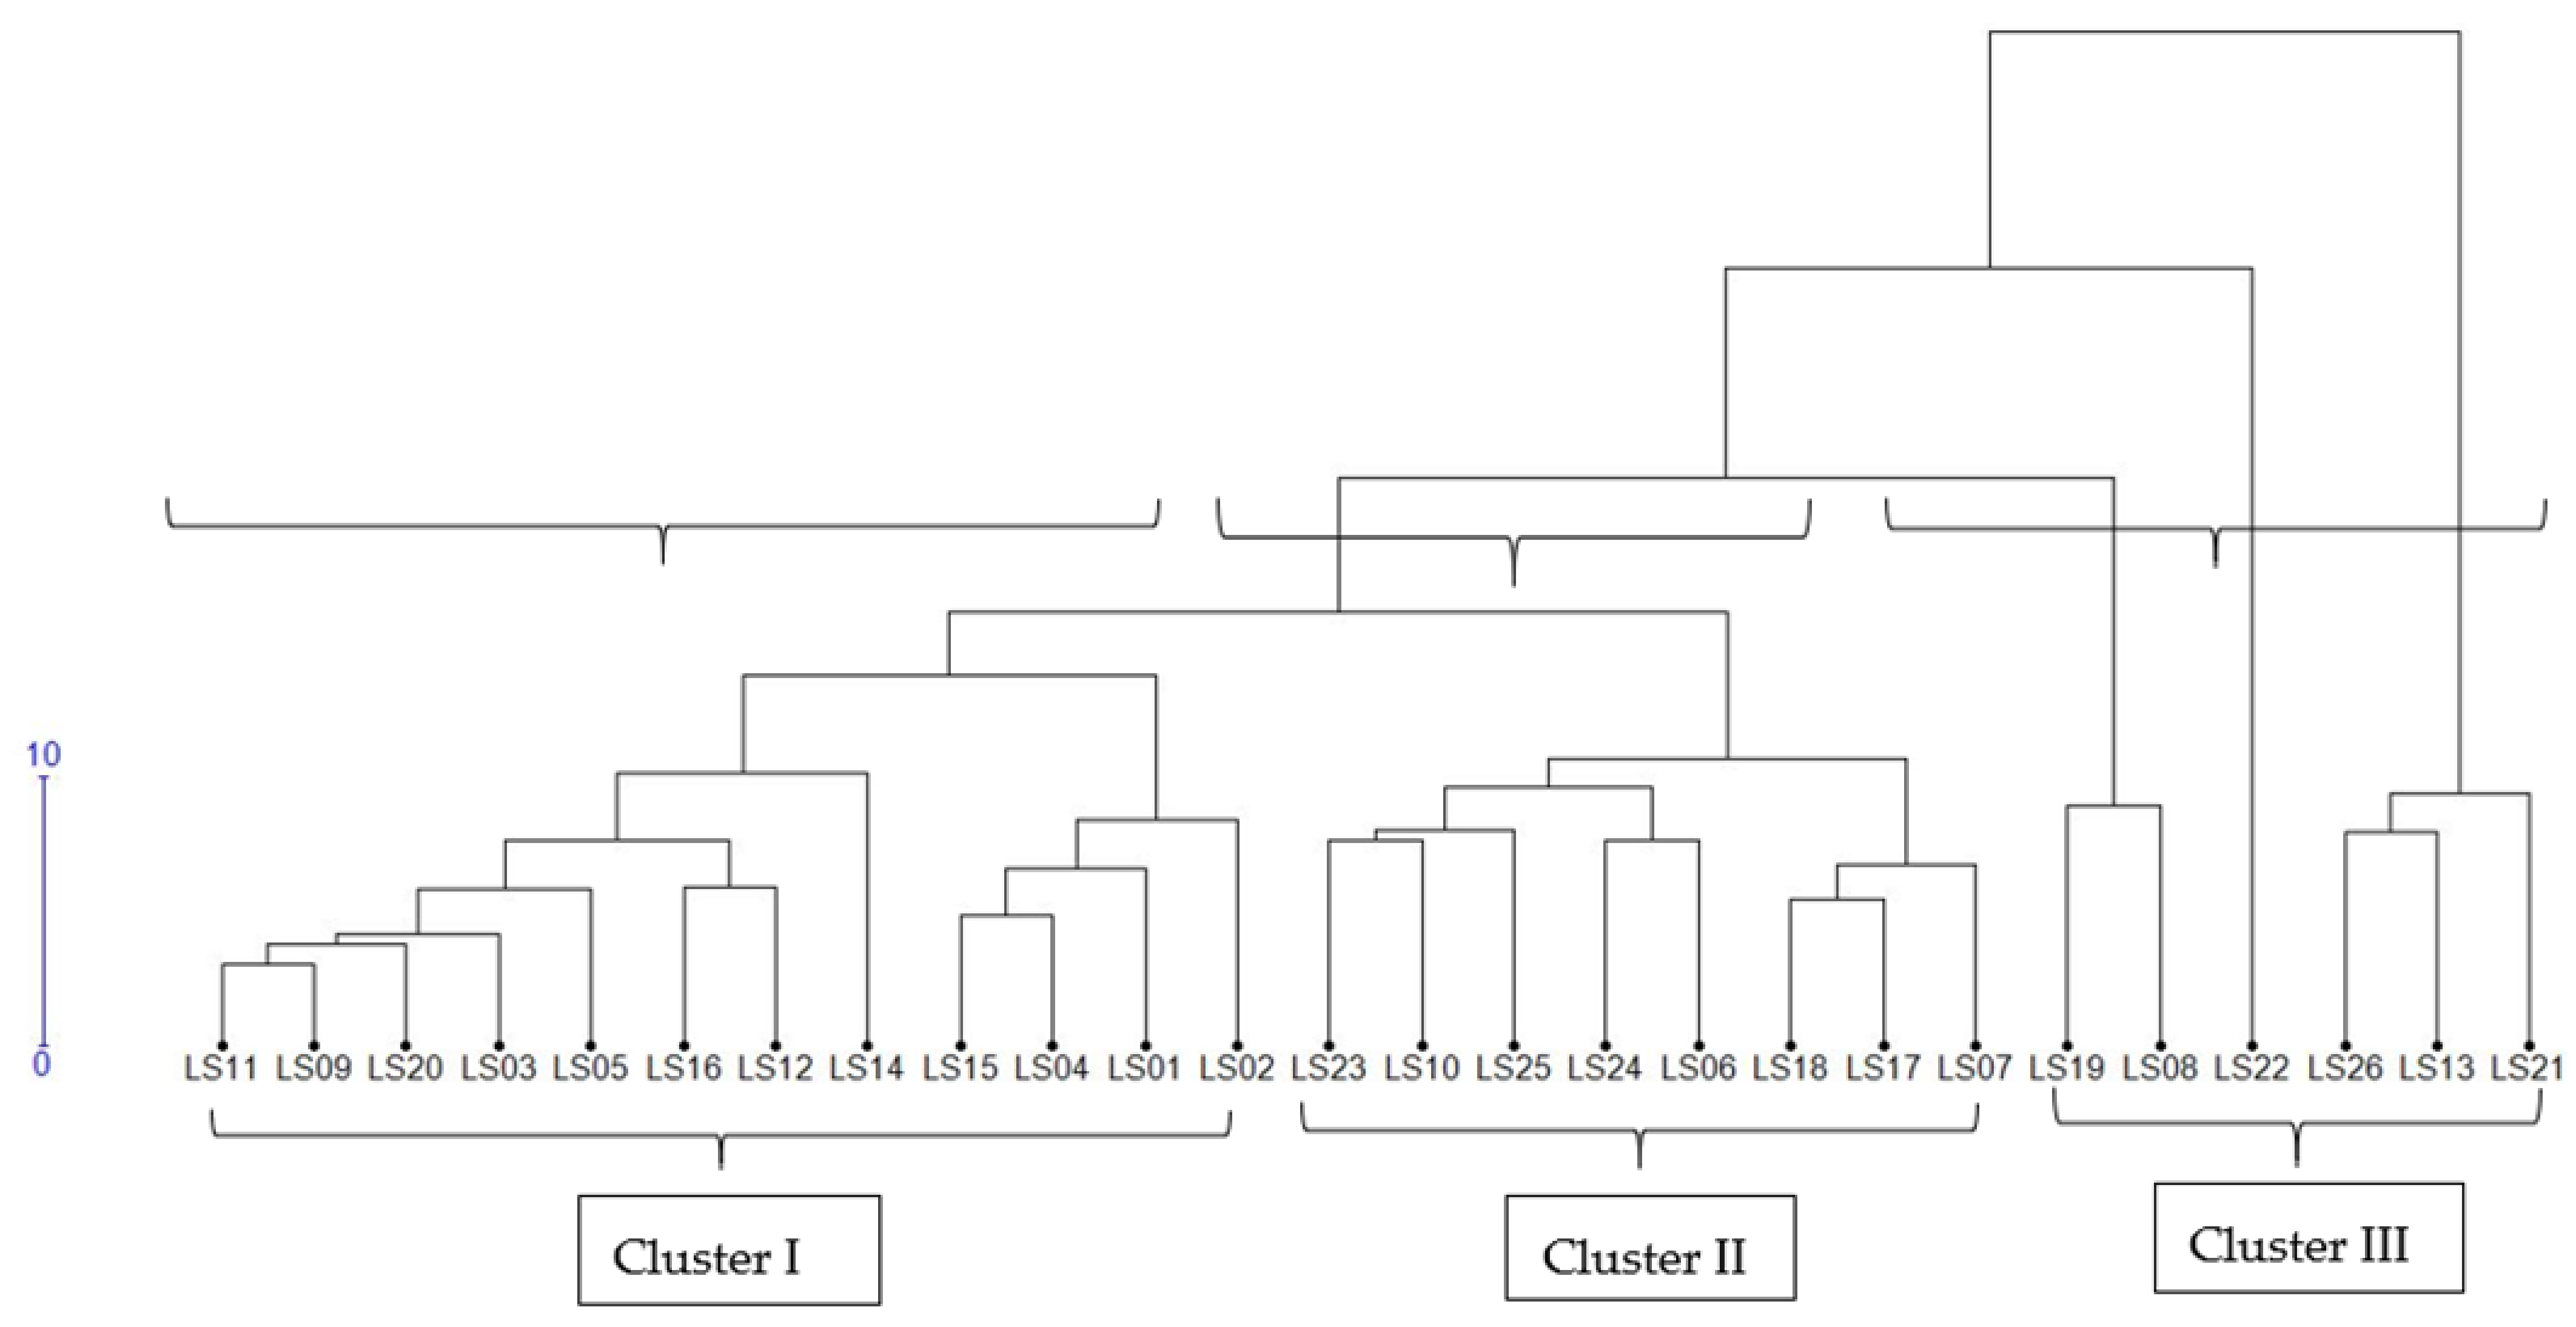
3.4. Cluster Analysis

Figure 3 summarizes the unweighted pair group method with the arithmetic mean method using Jaccard’s dissimilarity matrix, showing the genetic inter-relationships among the studied okra accessions. Clustering is a multivariate technique that assists in indicating the pattern of genetic relationships among accessions. The accessions were grouped into three distinct major clusters, namely cluster I, consisting of eight accessions, and clusters II and III, consisting of nine accessions each, indicating the presence of a wide genetic variation among the studied okra accessions. This corroborates with the findings of Reddy et al. [7], Pradip et al. [32], and Ravishankar et al. [33], who presented a dendrogram that classified the tested accessions into three major groups. Accessions allocated in different clusters are genetically divergent and may serve as prospective parents for a breeding programme. Most accessions maintained their positions on the dendrogram compared to the heatmap cluster analysis, except for the accessions LS01, LS03, and LS06. These clustering patterns indicate that accessions from different regions were genetically diverse. The high diversity among the accessions makes the assessed genotypes unique genetic resources to develop new breeding populations.

3.5. Accession and Environmental Effects on Phenotypic Traits

Analysis of variance indicated significant (p < 0.05) differences among the test accessions under different water treatments and their interactions for the assessed phenotypic traits (Table 4). Accessions had significant (p < 0.05) difference for PH, DTM, NPPP, PYPP, AGB, RW, and FPL. The water treatments had a significant (p < 0.05) effect on PH, FPL, and PYPP. The genotype × water treatment interaction exerted a significant (p < 0.05) effect on DTM, FPL, and PYPP (Table 4).

3.5.1. Performance of Okra Accessions for Phenotypic Traits under Drought-Stressed and Non-Stressed Conditions

Phenotypic traits provide useful selection criteria for genotype selection and breeding. Mean values of phenotypic traits recorded among the tested 26 okra accessions evaluated under DS and NS treatments are presented in Table 5. The present study revealed a significant genotype × water regime effect interaction for several traits, including days to maturity, fresh pod length, and fresh pod yield. This allowed the identification and selection of ideal accessions suited for irrigated and drought-prone environments. Highly significant genotypic differences (p < 0.001) were observed for PH under NS conditions. Plant height is an important agronomic trait that reflects the vegetative growth behaviour of crop plants in response to drought-stressed conditions. In the present study, drought stress reduced plant height (Table 6), with accessions LS01, LS02, LS08, LS09, LS11, LS13, and LS18 being the tallest under DS conditions. According to Eshiet and Brisibe [34], the height of an okra plant can potentially affect yield, as taller plants are more prone to lodging, thus resulting in a reduced number of pods and yield. Taller plant height was observed for accessions LS01, LS02, LS08, LS09, LS11, LS13, and LS18 under DS than NS that could be attributed to higher biomass portioning in okra as a means for higher yield and drought tolerance [35]. Days to maturity is an important trait in evaluating and selecting drought-tolerant okra genotypes. Under water-limited conditions, plants synthesize phytohormones, which synchronize the transition from vegetative to reproductive phases. Hence, the synthesis allows plants to regulate flowering, reproduction, and maturity periods [36]. Accessions LS01, LS03, LS06, LS08, and LS13 were early maturing under DS conditions (<85 days to maturity). Early maturing accessions could be selected as parents when breeding for drought escape through early maturity. Significant (p < 0.05) genotypic differences were recorded for FPL under both DS and NS conditions. Accessions LS06, LS07, and LS10 recorded the highest FPL (>8 cm) under DS conditions, whereas accessions LS10 and LS21 had the highest FLP (>10 cm) under NS conditions. Dry weight showed a reduction from 2.58 to 1.92 g under DS conditions. Chaturvedi et al. [9] reported that the reduction in dry weight is associated with the suppression of cell expansion and cell growth due to lower turgor pressure that occurs when plants are experiencing water shortages. Another record of reduced plant dry weight under drought stress was reported by Komolafe et al. [3]. Significant (p < 0.05) genotypic differences were recorded for NPPP under DS conditions. Accessions LS03, LS04, LS11, LS12, LS15, LS17, LS18, and LS21 recorded the highest NPPP (≥5), while LS13, LS19, and LS25 recorded the lowest NPPP (<2) under DS conditions. Drought stress reduced NPPP in okra accessions due to the disturbance in photosynthesis and low carbohydrate production caused by limited water availability [37].
Significant (p < 0.05) genotypic differences were recorded for PYPP under DS conditions. Accessions LS05, LS07, LS18 and LS10 recorded the highest PYPP (≥10 g). Under drought stress conditions, okra plants can accumulate sufficient photo-assimilates, resulting in higher YPPP [9]. In addition, Komolafe et al. [3], reported that pod yield could be improved with selection of a higher number of pods per plant and heavier pods as breeding parents. Genotypes LS19, LS20, and LS25 recorded the lowest PYPP (<1 g) under DS conditions. The reduction in PYPP in DS is attributed to low water availability, which reduces cell division, resulting in lower dry matter and pod yield [37]. Significant (p < 0.05) genotypic differences were recorded for AGB under both DS and NS conditions. There were significant (p < 0.05) differences among accessions for HI under NS conditions only. The highest HI (>70%) was observed for accessions LS12, LS21, and LS26, whereas the lowest HI (<10%) was recorded for LS08 and LS19 under NS conditions. Non-significant differences were recorded for RW under both DS and NS conditions. Significant (p < 0.05) genotypic differences were recorded for RSR under DS condition. Genotype LS19 recorded the highest RSR (>1) compared to all other test accessions under DS conditions. Under water-limited conditions, the productivity of a plant depends on some essential processes, such as temporal biomass distribution and dry matter partitioning [9]. Hence, the high fresh and dry weight of plants under restricted water supply is desirable and relates to high conversion efficiency. In the present study, accessions LS08, LS10, LS17, and LS23 indicated higher biomass production. Selecting parents with high biomass expression can help improve genetic gains. Based on this study, it can be indicated that reductions in most studied traits were highly associated with drought stress. These traits can effectively assess the drought tolerance potential of okra accessions and genotype variability for the studied traits and can be used to improve okra through selection.

3.5.2. Associations among Phenotypic Traits under Drought-Stressed and Non-Stressed Conditions

Understanding the associations between phenotypic traits provides a useful guide for the selection and improvement of desired traits. The levels of associations of the assessed phenotypic traits among accessions under DS and NS conditions in a GH environment are presented in Table 6. Correlation analysis provides a measure of associations among traits for effective selection. The poor associations recorded between DTM with DPL and NPPP suggest small trade-offs in pod yield. The high correlations between PYPP and DTM under drought stress suggest large trade-offs in yield responses. Under DS conditions, significant and positive associations were observed between PYPP with FPL (r = 0.81, p ≤ 0.001). AGB had higher significant association with PYPP (r = 0.69, p ≤ 0.001). HI positively and significantly correlated with FPL (r = 0.85, p ≤ 0.001) and PYPP (r = 0.67, p ≤ 0.001) under DS conditions, indicating that harvest index has a direct influence on pod yield. According to Kyriakopoulou et al. [10], crops under water-limited conditions show a significantly reduced harvest index. This is attributable to reduced photosynthesis, which could change pod yield. Positive and significant correlations were observed between RW and PH (r = 0.81, p ≤ 0.001). RSR significantly and positively correlated with DPW (r = 0.58, p ≤ 0.001) under DS conditions.
FPL positively and significantly correlated with PYPP (r = 0.83, p ≤ 0.001) and HI (r = 0.85, p ≤ 0.001) under NS condition. A positive and significant correlation between FPL and PYPP has been reported in okra [19,37], indicating that fresh pod length is vital for direct selection to improve the fresh pod yield in okra. Positive and highly significant correlations were recorded between AGB with PH (r = 0.88, p ≤ 0.001) and PYPP (r = 0.60, p ≤ 0.001) under NS conditions. There was a high positive association between above-ground biomass and plant height under drought stress conditions. This indicates that drought stress has a maximum impact on plant height due to the declined cell enlargement and cell growth due to low turgor pressure and more leaf senescence. Hence, more leaf senescence and reduced photosynthesis result in low biomass production in crops grown under water-limited conditions [7,12]. A suppression in dry biomass production in response to abiotic stress has been reported by Kaur et al. [12]. RW was positively and significantly correlated with PH (r = 0.70, p ≤ 0.001) and AGB (r = 0.62, p ≤ 0.001) and negatively correlated with HI (r = −0.69, p ≤ 0.001). RSR was negatively and significantly correlated with FPL (r = −0.56, p ≤ 0.001) and PYPP (r = −0.57, p ≤ 0.001) but positively and significantly correlated with RW (r = 0.49, p ≤ 0.05). The strong associations between the assessed phenotypic traits in the present study allow effective genotype selection and genetic advancement.

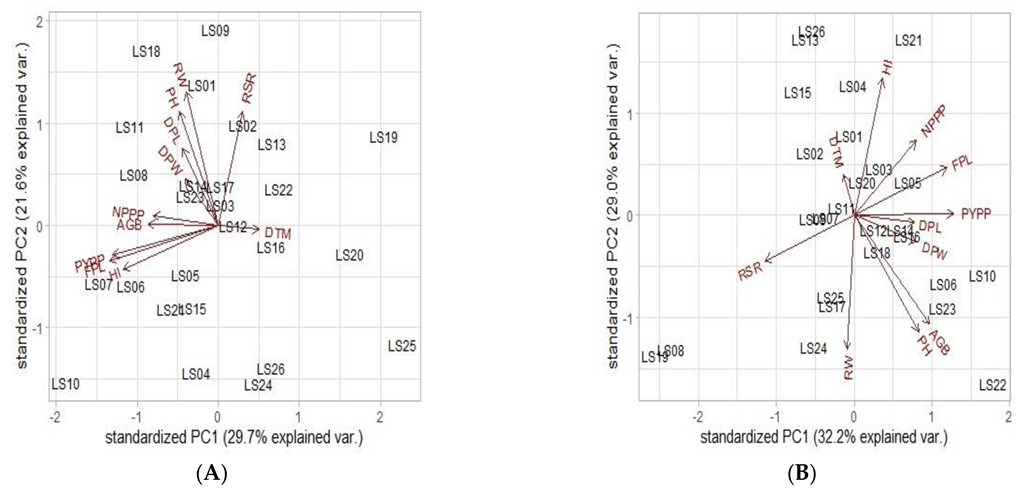
3.5.3. Principal Component Analysis (PCA)

PCA showing the loading scores and cumulative variations for phenotypic traits under DS and NS conditions are presented in Table 7. PCA is the most frequently used multivariate statistical analysis [21]. Three and four principal components (PCs) were identified for assessed traits under DS and NS conditions, accounting for a cumulative variance of 70.07% and 85.34%, respectively. Under DS conditions, PC1 was positively correlated with FPL, NPPP, PYPP, and HI, which accounted for 29.69% of the total variation. The results indicated that the tested okra accessions were genetically diverse. PH, RW, and RSR were positively correlated with PC2, accounting for 21.64% of the total variation under DS conditions. DPL and DPW were negatively correlated while AGB was positively associated with PC3, which accounted for 19.37% of the total variation. Under NS conditions, PC1 was positively associated with FPL, DPL, NPPP, and PYPP and negatively correlated with RSR, which accounted for 32.24% of the total variation. PC2 was positively associated with PH, AGB, and RW and negatively correlated with HI, which accounted for 28.99% of the total variation among the test accessions. PC3 was negatively correlated with DPW, while PC4 was positively associated with DTM, accounting for 14.22% and 9.89% of the total variation, respectively. The current PCA results successfully identified variables that contribute most to the response of okra accessions against drought stress.
The relationship between the accessions and the studied phenotypic traits is illustrated using principal component biplots (Figure 4). Angles less than 45 °C between the dimensions of two variables indicate high trait associations, whereas longer vectors show the discriminating ability of a particular trait. As a result, accessions excelling in a particular trait were plotted to the vector line. Accessions LS17 and LS02 were grouped together based on the high values for RSR under DS conditions. Under NS conditions, accessions LS14, LS16, LS18, LS23, and LS01 were grouped together based on high values of PH, FPL, DPW, DPL, NPPP, and PYPP. Accessions LS21, LS01, LS12, LS14, and LS09 were grouped together based on high values of PH, FPL, DPW, DPL, NPPP, and PYPP under DS conditions. Accessions LS17, LS12, LS09, LS19, and LS09 were grouped together based on the high values of PH, FPL, DPW, DPL, NPPP, and PYPP under NS conditions.

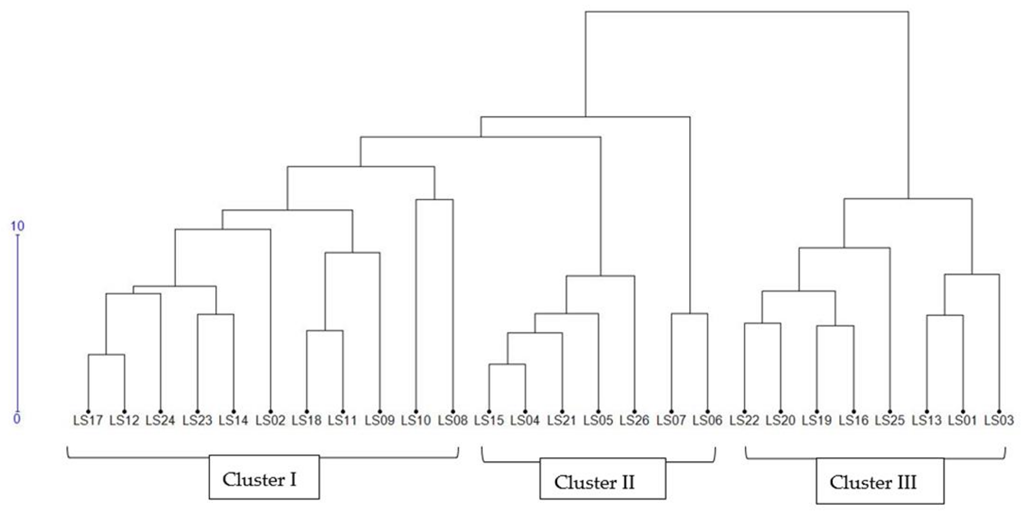
3.5.4. Phenotypic Hierarchical Clustering

Hierarchical cluster analysis using phenotypic data allocated the okra accessions into three groups under drought-stressed conditions (Figure 5). The largest cluster (cluster I) consisted of 11 accessions, followed by cluster III with 8 accessions and cluster I with 7 accessions. High-yielding accessions (e.g., LS05 and LS07) were grouped in cluster II. Cluster I consisted of accessions which were characterized by taller plant height and with the highest number of pods per plant. Cluster III contained accessions with low pod yield. Accessions LS10 and LS18, which were grouped in cluster I under drought-stressed conditions, can be selected to develop breeding populations for enhanced pod yield. This cluster also contained taller accessions, which usually have higher biomass than shorter plants and contribute to carbon sequestration for better soil health [37]. The test accessions were also grouped into three clusters under non-stressed conditions (Figure 6). The largest cluster (cluster I) contained 12 accessions, while the second largest cluster (cluster II) contained 8 accessions, and the smallest cluster III consisted of only 6 accessions. Cluster I comprised accessions with a higher number of pods, whereas cluster III had accessions with higher harvest index and early maturity, critical attributes for drought escape due to accelerated growth and development.

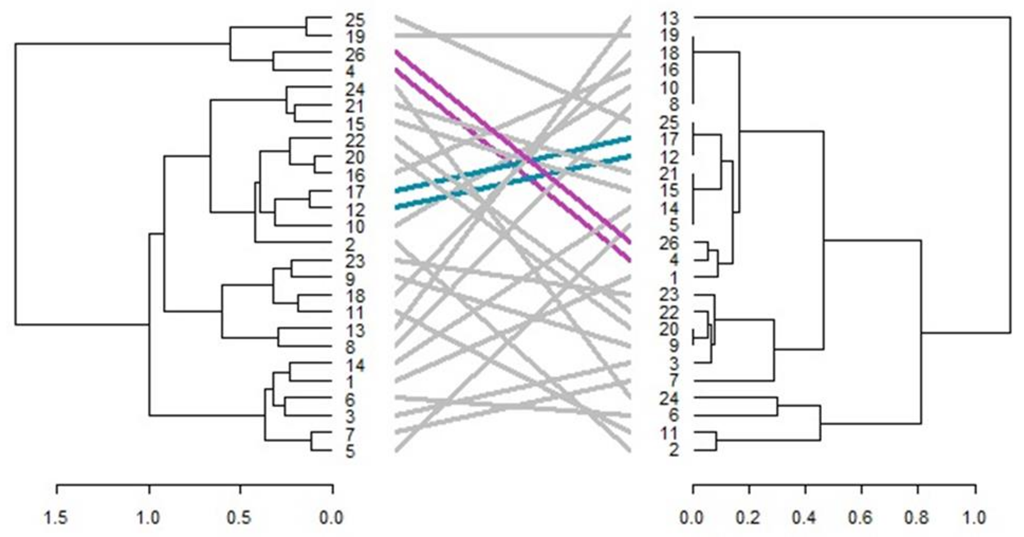
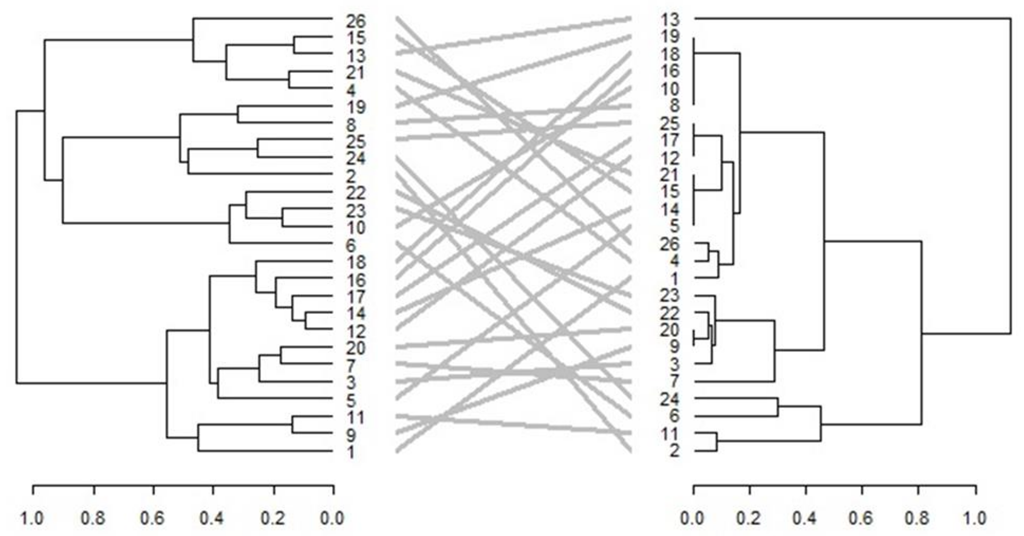
3.6. Comparison of Phenotypic and Genotypic Hierarchical Clusters

Genetic markers have proven to be a powerful tool for assessing genetic variation and elucidating genetic relationships within and among okra species, while phenotypic traits are essential indicators of genotypes in a given environment. A comparison of phenotypic and genotypic clusters was conducted to establish genotype compatibility among different dendrograms. None of the accessions maintained their positions when phenotypic hierarchical clusters were compared to genotypic hierarchical clustering under drought-stressed conditions (Figure 7). Similarly, under non-stressed conditions (Figure 8), the phenotypic clustering was opposite to the phenotypic cluster. The tanglegram comparison indicated that 42% of the accessions under drought-stressed conditions maintained their cluster membership in the phenotypic and genotypic hierarchical clustering (Figure 7). Under non-stressed conditions, 69% of the accessions maintained their membership in the phenotypic and genotypic hierarchical clustering (Figure 8). The phenotype and genotype clusters under drought and non-stressed conditions were inconsistent due to the genotype-by-environment interactions, resulting in variation in the phenotypic expression of the phenotypic traits [36]. Lower consistency in the phenotypic and genotypic clustering under drought-stressed conditions compared to non-stressed conditions is attributable to the selection pressure exerted by the drought treatment.

4. Conclusions

The present study evaluated the genetic and phenotypic diversity and relationships among selected okra accessions as a guide for selecting parental accessions for breeding. SSR-assisted phenotypic and genotype evaluation and classification in the present study suggest sufficient genetic diversity in okra accessions to initiate a trait-based pre-breeding program. Genetically unrelated accessions such as LS04, LS05, LS06, LS07, LS08, LS10, LS11, LS15, LS18, LS23, LS24, and LS26 were selected based on their high yield potential and related yield-improving traits under drought stress conditions. The identified accessions are recommended as suitable breeding parents for hybridization and selection programs to improve the yield potential of okra under drought-stressed environments.

Author Contributions

Conceptualization, S.S.M., H.S., A.S.G. and J.M.; Formal analysis, S.S.M. and A.S. Funding acquisition, H.S. and A.S.G.; Investigation, S.S.M.; Methodology, S.S.M., H.S. and J.M.; Project administration, S.S.M., H.S. and A.S.G.; Resources, H.S. and A.S.G.; Supervision, H.S. and A.S.G.; Writing—original draft, S.S.M.; Writing—review and editing, S.S.M., H.S., A.S.G. and J.M. All authors have read and agreed to the published version of the manuscript.

Funding

This research was funded by the National Research Foundation, South Africa, grant number MND200618533646, the Agricultural Research Council through the PDP program, grant number 10013464, and the Moses Kotane Institute, grant number 8804030907080.

Institutional Review Board Statement

Not applicable.

Data Availability Statement

Not applicable.

Acknowledgments

The University of KwaZulu-Natal is acknowledged for the support of the project, as well as the Agricultural Research Council through the Professional Development Programme for providing plant material and support. Anthon Wanga is acknowledged for assisting in data analysis.

Conflicts of Interest

The authors declare no conflict of interest.

References

  1. Düzyaman, E. Phenotypic Diversity within a Collection of Distinct Okra (Abelmoschus esculentus) Cultivars Derived from Turkish Land Races. Genet. Resour. Crop Evol. 2005, 52, 1019–1030. [Google Scholar] [CrossRef]
  2. Kumar, M.; Sharma, V.R.; Kumar, N.; Sirohi, U.; Naresh, R.; Chaudhary, V. Screening of Microsatellite Markers for Genetic Diversity Assessment and Conservation of Germplasm in Okra (Abelmoschus esculentus L. Moench). Int. J. Curr. Microbiol. Appl. Sci. 2017, 6, 509–520. [Google Scholar] [CrossRef]
  3. Komolafe, R.J.; Ariyo, O.J.; Alake, C.O. Correlation and Path Coefficient Analysis of Fruit Yield Attributes in Forty Genotypes of Okra (Abelmoschus esculentus). Agric. Res. 2021, 11, 15–23. [Google Scholar] [CrossRef]
  4. Abed, M.Y.; Ibrahim, E.A.; El-Shoura, A.M. Development of Okra (Abelmoschus esculentus L. Moench) Hybrids Derived from Selected Inbreds under Drought Stress. J. Plant Prod. 2020, 11, 61–69. [Google Scholar] [CrossRef]
  5. Saifullah, M.; Rabbani, M.G. Evaluation, and characterization of okra (Abelmoschus esculentus L. Moench) genotypes. SAARC J. Agric. 2009, 7, 92–99. [Google Scholar]
  6. Mihretu, Y.; Wayessa, G.; Adugna, D. Multivariate analysis among okra (Abelmoschus esculentus (L.) Moench) collection in South-Western Ethiopia. J. Plant Sci. 2014, 9, 43–50. [Google Scholar]
  7. Reddy, M.T.; Haribabu, K.; Ganesh, M.; Redyy, K.C.; Begum, H. Genetic divergence analysis of indigenous and exotic collections of okra (Abelmoschus esculentus L. Moench). J. Agric. Technol. 2012, 8, 611–623. [Google Scholar]
  8. Alake, C.O. Genetic variability and diversity in okra landraces using agromorphological traits and seed elemental minerals. Int. J. Veg. Sci. 2020, 26, 127–149. [Google Scholar] [CrossRef]
  9. Chaturvedi, A.K.; Surendran, U.; Gopinath, G.; Chandran, K.M.; Anjali, N.K.; Ct, M.F. Elucidation of stage specific physiological sensitivity of okra to drought stress through leaf gas exchange, spectral indices, growth and yield parameters. Agric. Water Manag. 2019, 222, 92–104. [Google Scholar] [CrossRef]
  10. Kyriakopoulou, O.G.; Arens, P.; Pelgrom, K.T.; Karapanos, I.; Bebeli, P.; Passam, H.C. Genetic and morphological diversity of okra (Abelmoschus esculentus [L.] Moench.) genotypes and their possible relationships, with particular reference to Greek landraces. Sci. Hortic. 2014, 171, 58–70. [Google Scholar] [CrossRef]
  11. Kaur, K.; Pathak, M.; Kaur, S.; Pathak, D.; Chawla, N. Assessment of morphological and molecular diversity among okra (Abelmoschus esculentus (L.) Moench.) germplasm. Afr. J. Biotechnol. 2013, 12, 3160–3170. [Google Scholar]
  12. Massucato, L.R.; Nakamura, K.K.; Ruas, P.M.; Zefa, D.M.; Da Silva, D.J.H.; Gonçalves, L.S.A. Genetic diversity among Brazilian okra landraces detected by morphoagronomic and molecular descriptors. Acta Sci. Agron. 2020, 42, e43426. [Google Scholar] [CrossRef]
  13. Aladele, S.E.; Ariyo, O.J.; Lapena, R.D.E. Genetic relationships among West African okra (Abelmoschus caillei) and Asian genotypes (Abelmoschus esculentus) using RAPD. Afr. J. Biotechnol. 2008, 7, 1426–1431. [Google Scholar]
  14. Yuan, C.; Zhang, C.; Wang, P.; Hu, S.; Chang, H.; Xiao, W.; Lu, X.; Jiang, S.; Ye, J.; Guo, X. Genetic diversity analysis of okra (Abelmoschus esculentus L.) by inter-simple sequence repeat (ISSR) markers. Genet. Mol. Res. 2014, 13, 3165–3175. [Google Scholar] [CrossRef] [PubMed]
  15. Kpodo, F.; Agbenorhevi, J.; Alba, K.; Bingham, R.; Oduro, I.; Morris, G.; Kontogiorgos, V. Pectin isolation and characterization from six okra genotypes. Food Hydrocoll. 2017, 72, 323–330. [Google Scholar] [CrossRef] [Green Version]
  16. Salameh, N.M. Genetic diversity of okra (Abelmoschus esculentus L.) genotypes from different agroecological regions revealed by amplified fragment length polymorphism analysis. Am. J. Appl. Sci. 2014, 11, 1157–1163. [Google Scholar] [CrossRef]
  17. Fougat, R.S.; Purohit, A.R.; Kumar, S.; Parekh, M.J.; Kumar, M. SSR based genetic diversity in Abelmoschus species. Indian J. Agric. Sci. 2015, 85, 1223–1228. [Google Scholar]
  18. Mohammed, W.; Amelework, B.; Shimelis, H. Simple sequence repeat markers revealed genetic divergence and population structure of okra [Abelmoschus esculentus] collections of diverse geographic origin. Aust. J. Crop Sci. 2020, 14, 1032–1041. [Google Scholar] [CrossRef]
  19. El-Fattah, B.E.S.A.; Haridy, A.G.; Abbas, H.S. Response to planting date, stress tolerance and genetic diversity analysis among okra (Abelmoschus esculentus (L.) Moench.) varieties. Genet. Resour. Crop Evol. 2020, 67, 831–851. [Google Scholar] [CrossRef]
  20. Ahmed, Z.G.; El-Sayed, M.A. Influence of drought stress on physiological traits of crossed okra varieties. Jordan J. Biol. Sci. 2021, 14, 253–260. [Google Scholar]
  21. Schafleitner, R.; Kumar, S.; Lin, C.-Y.; Hegde, S.G.; Ebert, A. The okra (Abelmoschus esculentus) transcriptome as a source for gene sequence information and molecular markers for diversity analysis. Gene 2013, 517, 27–36. [Google Scholar] [CrossRef] [PubMed]
  22. Ouedraogo, M.H.; Sawadogo, N.; Batieno, T.B.J.; Zida, W.M.S.F.; Bougma, A.L.; Barro, A.; Kiebre, Z.; Sawadogo, M. Evaluation of genetic diversity of okra accessions [Abelmoschus esculentus (L. Moench)] cultivated in Burkina Faso using microsatellite markers. Afr. J. Biotechnol. 2018, 17, 126–132. [Google Scholar] [CrossRef]
  23. Peakall, R.; Smouse, P.E. GenAlex 6.5: Genetic analysis in Excel. Population software for teaching and research-an update. Bioinformatics 2012, 28, 2537–2539. [Google Scholar] [CrossRef] [PubMed]
  24. Nei, M.; Li, W.H. Mathematical model for studying genetic variation in terms of restriction endonucleases. Proc. Natl. Acad. Sci. USA 1979, 76, 5269–5273. [Google Scholar] [CrossRef]
  25. Nagy, S.; Poczai, P.; Cernák, I.; Gorji, A.M.; Hegedűs, G.; Taller, J. PICcalc: An Online Program to Calculate Polymorphic Information Content for Molecular Genetic Studies. Biochem. Genet. 2012, 50, 670–672. [Google Scholar] [CrossRef]
  26. Metsalu, T.; Vilo, J. ClustVis: A web tool for visualizing clustering of multivariate data using Principal Component Analysis and heatmap. Nucleic Acids Res. 2015, 43, W566–W570. [Google Scholar] [CrossRef]
  27. Perrier, X.; Jacquemoud-Collet, J.P. DARwin Software. Dissimilarity Analysis and Representation for Windows. Available online: http://www.darwin.cirad.fr/darwin.html (accessed on 6 September 2022).
  28. Maechler, M.; Rousseeuw, P.; Struyf, A.; Hubert, M.; Hornik, K.; Studer, M. Package ‘Cluster’. Available online: https://cran.microsoft.com/snapshot/2014-10-10/web/packages/cluster/cluster2013.pdf (accessed on 12 November 2021).
  29. Gower, J.C. A General Coefficient of Similarity and Some of Its Properties. Biometrics 1971, 27, 857–871. [Google Scholar] [CrossRef]
  30. Kumar, S.; Parekh, M.J.; Fougat, R.S.; Patel, S.K.; Patel, C.B.; Kumar, M.; Patel, B.R. Assessment of genetic diversity among okra genotypes using SSR markers. J. Plant Biochem. Biotechnol. 2017, 26, 172–178. [Google Scholar] [CrossRef]
  31. Petropoulos, S.; Fernandes, Â.; Barros, L.; Ferreira, I.C. Chemical composition, nutritional value and antioxidant properties of Mediterranean okra genotypes in relation to harvest stage. Food Chem. 2018, 242, 466–474. [Google Scholar] [CrossRef]
  32. Pradip, K.; De Akotkar, D.K.; Pal, A.K. Genetic variability and diversity in okra [Abelmoschus esculentus (L) Moench]. Electron. J. Plant Breed. 2010, 1, 393–398. [Google Scholar]
  33. Ravishankar, K.V.; Muthaiah, G.; Mottaiyan, P.; Gundale, S.-K. Identification of novel microsatellite markers in okra (Abelmoschus esculentus (L.) Moench) through next-generation sequencing and their utilization in analysis of genetic relatedness studies and cross-species transferability. J. Genet. 2018, 97, 39–47. [Google Scholar] [CrossRef]
  34. Eshiet, A.J.; Brisibe, E.A. Morphological Characterization and Yield Traits Analysis in Some Selected Varieties of Okra (Abelmoschus esculentus L. Moench). Adv. Crop Sci. Technol. 2015, 3, 197. [Google Scholar] [CrossRef]
  35. Adejumo, S.A.; Ezeh, O.S.; Mur, L.A. Okra growth and drought tolerance when exposed to water regimes at different growth stages. Int. J. Veg. Sci. 2018, 25, 226–258. [Google Scholar] [CrossRef]
  36. Mkhabela, S.S.; Shimelis, H.; Gerrano, A.S.; Mashilo, J. Phenotypic and genotypic divergence in Okra [Abelmoschus esculentus (L.) Moench] and implications for drought tolerance breeding: A review. South Afr. J. Bot. 2021, 145, 56–64. [Google Scholar] [CrossRef]
  37. Rad, S.K.; Madani, H.; Sharifabadi, H.H.; Mahmoudi, M.; Nourmohamadi, G. Effects of different irrigation intervals and sowing time on yield attributing traits of okra (Abelmoschus esculentus L.). Arab. J. Geosci. 2022, 15, 740. [Google Scholar] [CrossRef]
Figure 1. Principal coordinate analysis (PCoA) based on 9 polymorphic SSR markers and 26 okra accessions (coded LS01 to LS26, Table 1). Note PC1 denotes the first principal coordinate and PC2 the second principal coordinate.
Diversity 14 00747 g001
Figure 2. Heatmap showing the genetic relationship among 26 okra accessions using 9 SSR markers. Annotations in the heatmap show grouping of accessions and SSR marker clusters.
Diversity 14 00747 g002
Figure 3. Dendrogram showing genetic relationships among 26 okra accessions assessed via 9 polymorphic SSR markers.
Diversity 14 00747 g003
Figure 4. Principal component biplot of PC1 vs. PC2 showing groupings of 26 okra accessions based on phenotypic traits under drought-stressed (A) and non-stressed (B) conditions. PH: plant height, DTM: number of days to maturity, FPL: fresh pod length, DPL: dry pod length, DPW: dry pod weight, NPPP: number of pods per plant, PYPP: pod yield per plant, AGB: above-ground biomass, HI: harvest index, RW: root weight, RSR: root: shoot ratio.
Diversity 14 00747 g004
Figure 5. Hierarchical clustering of 26 okra accessions based on phenotypic traits evaluated under drought-stressed conditions.
Diversity 14 00747 g005
Figure 6. Hierarchical clustering of 26 okra accessions based on phenotypic traits under non-stressed conditions.
Diversity 14 00747 g006
Figure 7. Tanglegram comparison of phenotypic and genotypic hierarchical clusters of 26 okra accessions based on 9 SSR markers and phenotypic data measured under drought-stressed conditions.
Diversity 14 00747 g007
Figure 8. Tanglegram comparison of phenotypic and genotypic hierarchical clusters of 26 okra accessions based on 9 SSR markers and phenotypic data measured under non-stressed conditions.
Diversity 14 00747 g008
Table 1. Accession code and number, and geographical origin of the okra accessions used in the study.
Accession CodeAccession NumberGeographical Origin
LS01VI033775Malaysia
LS02VI033797Malaysia
LS03VI056457Yugoslavia
LS04VI039651Bangladesh
LS05VI046561Thailand
LS06VI047672Bangladesh
LS07VI050150Taiwan
LS08VI050957Zambia
LS09VI050960Zambia
LS10VI055110Malaysia
LS11VI055119Myanmar
LS12VI055219Malaysia
LS13VI055220Malaysia
LS14VI055421Viet Nam
LS15VI056069Cambodia
LS16VI056079Cambodia
LS17VI056081Cambodia
LS18VI056449United States of America
LS19VI060131Mali
LS20VI060313Tanzania
LS21VI060679India
LS22VI060803Turkey
LS23VI060817Brazil
LS24VI060822Nigeria
LS25VI060823Nigeria
LS26Clemson SpinelessSouth Africa
Table 2. Description of the SSR primers used for genotyping of 26 okra landrace accessions.
Marker Name Forward Primer SequenceReverse Primer SequencePIC
Okra 111GATGGAATTGAGAAACCAGATGTGTTCTTCACTCTCGTCA0.89
Okra 152GCTCTATTGATGGCGAGTAAAAAGTCATCCAAGGTGACAA0.81
Okra 166TTCCAGTTGGAGAGGTAAGACTTCCATTTCATCGACTTTC0.82
AVRDC-Okra17ACGAGAGTGAAGTGGAACTGCTCCTCTTTCCTTTTTCCAT0.81
AVRDC-Okra70GTAGCTGAACCCTTTGCTTACTATCATGGCGGATTCTTTA0.98
AVRDC-Okra39TGAGGTGATGATGTGAGAGATTGTAGATGAGGTTTGAACG0.99
AVRDC-Okra64AAGGAGGAGAAAGAGAAGGAATTTACTTGAGCAGCAGCAG0.87
AVRDC-Okra9ACCTTGAACACCAGGTACAGTTGCTCTTATGAAGCAGTGA0.85
AVRDC-Okra57CGAGGAGACCATGGAAGAAGATGAGGAGGACGAGCAAGAA0.78
Okra137GAGAGAGATTGCTTCGACTGTAAACTTTAAACTCAGCGGC0.80
SSR = simple sequence repeats, PIC = polymorphic information content.
Table 3. Genetic diversity parameters generated by SSR markers among 26 okra accessions.
Marker Genetic Parameters
NaNeIHoHeFISPIC
AVRDC-Okra7032.470.971.000.60−0.680.60
AVRDC-Okra6422.000.691.000.50−1.000.50
Okra 15222.000.691.000.50−1.000.50
Okra 16622.000.691.000.50−1.000.50
AVRDC-Okra952.761.161.000.64−0.570.64
AVRDC-Okra3932.310.911.000.57−0.760.57
Okra 11122.000.691.000.50−1.000.50
Okra13732.581.011.000.61−0.630.61
AVRDC-Okra5722.000.691.000.50−1.000.50
Average2.702.240.831.000.54−0.850.55
Standard deviation1.000.300.180.000.060.190.06
Standard error0.340.150.100.100.060.060.02
Na = total number of alleles per locus; Ne = number of effective alleles per locus; I = Shannon information index; Ho = observed heterozygosity; He = expected heterozygosity; FIS = inbreeding coefficient; PIC = polymorphic information content.
Table 4. Analysis of variance showing mean square values and significant tests of 26 okra accessions assessed for phenotypic responses in glasshouse environment under drought-stressed (DS) and non-stressed (NS) conditions.
S.O.V.dfPHDTMFPLDPLDPWNPPPPYPPAGBHIRWRSR
Replications123.80 ns11.44 ns21.61 *35.41 ns81.39 *0.01 ns55.20 *1423.50 **1153 ns1.50 ns1.09 **
Incomplete blocks12063.50 **0.08 ns9.99 ns11.22 ns13.89 ns3.47 ns1.11 ns104.56 ns790.10 ns85.87 *0.09 ns
Genotype (G)26336.40 *225.57 *15.15 **13.76 ns7.54 ns7.92 *15.97 *136.00 *664.10 ns17.97 *0.14 ns
Water regime (WC)12231.00 **75.84 ns77.13 **13.18 ns10.93 ns16.56 *229.47 **578.52 ns4736.10 *82.41 *0.04 ns
G × WC25234.60 ns89.58 *6.82 *10.15 ns6.99 ns4.43 ns12.01 *55.27 ns714.90 ns8.91 ns0.07 ns
Residual49139.8048.053.9611.888.263.986.9675.76429.4010.190.09
S.O.V.: source of variation, PH: plant height, DTM: days to maturity, FPL: fresh pod length, DPL: dry pod length, DPW: dry pod weight, NPPP: number of pods per plant, PYPP: pod yield per plant, AGB: above-ground biomass, HI: harvest index, RW: root weight, RSR: root: shoot ratio, * significant at 5% level of significance, ** significant at 1% level of significance, ns non-significant.
Table 5. Mean values for phenotypic traits among 26 okra accessions evaluated under drought-stressed (DS) and non-stressed (NS) conditions.
Accession CodePH (cm)DTMFPL (cm)DPL (cm)DPW (g Per Plant)NPPPPYPP (g Per Plant)AGB (g Per Plant)HI (%)RW (g Per Plant)RSR
DSNSDSNSDSNSDSNSDSNSDSNSDSNSDSNSDSNSDSNSDSNS
LS0171.5064.2580.2595.173.927.9611.597.786.502.003.508.003.927.0213.9213.0217.1554.915.257.750.580.59
LS0265.3761.62101.0095.675.197.139.131.754.000.003.503.502.587.837.0817.8336.6744.476.005.250.830.30
LS0360.5068.3883.0083.503.035.965.156.833.503.508.007.002.508.7917.5017.2913.9651.865.256.250.330.37
LS0449.8752.1286.2586.756.217.508.298.541.002.506.005.504.196.099.1912.0947.5256.690.753.000.090.29
LS0554.5072.5089.0080.255.737.256.507.082.008.004.005.506.177.3316.1718.3338.3044.785.253.750.320.27
LS0661.5082.8877.0077.008.239.064.508.852.505.504.005.005.058.0016.5529.5062.4230.644.007.500.500.25
LS0758.3870.3886.2589.008.584.967.609.003.006.504.003.507.922.9216.9214.9265.1629.015.004.500.340.37
LS0873.5064.0077.0095.006.001.503.504.671.501.004.502.506.582.6321.5817.1241.578.978.7512.250.490.96
LS0982.2569.7589.6783.503.807.837.504.211.001.003.003.004.607.1717.1016.6721.8348.0710.507.750.850.50
LS1068.7588.2595.1790.0010.1711.500.008.380.001.503.003.5014.0013.2532.0037.7543.7535.804.007.250.130.20
LS1179.0066.5095.5086.006.519.758.333.633.000.006.004.006.769.2316.7619.2340.3447.337.759.000.460.47
LS1265.2582.38101.0083.173.995.513.755.082.504.006.506.502.857.6819.8521.6819.1246.845.007.250.330.40
LS1374.2549.7580.2598.252.507.465.716.192.500.501.005.502.006.1317.009.1310.9879.556.504.000.400.48
LS1465.5087.2586.4283.175.938.096.447.380.503.004.506.004.488.5618.9723.0623.5660.688.008.250.420.49
LS1552.5057.8889.0092.426.715.476.406.401.501.505.006.004.714.8210.718.3247.7157.663.503.750.400.45
LS1653.5078.1295.1792.253.957.757.406.923.503.002.504.502.6311.5513.6224.5518.9947.054.258.750.290.36
LS1767.0079.0098.0083.504.233.884.758.081.005.005.503.503.696.0021.1920.0023.5430.087.009.250.490.46
LS1883.6275.0098.2586.757.217.337.7510.381.501.506.003.505.426.1016.4225.1033.9424.6810.756.250.740.25
LS1954.1272.0095.5083.501.000.004.005.250.500.001.001.000.500.006.5012.5016.670.005.509.251.430.73
LS2060.2567.1295.1689.671.818.461.887.630.002.502.504.000.758.0811.2518.087.8948.954.506.250.450.42
LS2154.1266.2592.1792.258.5010.087.587.584.001.506.006.004.179.5810.1712.0841.9684.212.002.750.270.24
LS2263.50119.2589.6792.755.528.045.837.630.006.003.006.001.7511.4410.7537.9412.9630.576.2511.750.620.31
LS2369.7586.7592.1789.504.947.296.138.792.505.002.507.005.888.0020.8734.5030.7523.726.5010.000.350.28
LS2459.1286.2595.1777.004.835.311.503.380.000.503.002.504.176.8817.1725.8727.8619.231.009.500.110.42
LS2559.6283.62101.0090.000.006.920.003.500.000.001.003.500.007.0412.5026.540.0035.181.5010.750.040.41
LS2646.1252.6286.7583.504.675.635.453.052.001.502.006.004.005.246.007.2433.3382.281.752.500.150.22
Mean63.5973.2390.6187.675.126.835.646.461.922.583.904.714.287.2115.3020.0129.9243.205.257.100.440.40
p-valuens***ns**nsns***ns*ns**ns*nsns*ns
SED11.7312.846.297.491.732.133.193.772.413.251.852.172.292.957.639.8121.1620.583.103.290.370.17
LSD (5%)34.2426.4412.9615.975.054.399.327.777.056.695.414.486.686.0822.2620.2143.67 42.389.046.771.090.35
CV (%)18.4817.536.948.5434.7731.2255.8358.4265.1256.1047.6846.1256.7940.9350.2049.0269.2347.6358.8746.3563.7442.66
PH: plant height, DTM: days to maturity, FPL: fresh pod length, DPL: dry pod length, DPW: dry pod weight, NPPP: number of pods per plant, PYPP: pod yield per plant, AGB: above-ground biomass, HI: harvest index. RW: root weight, RSR: root: shoot ratio; NS: non-stressed, DS: drought-stressed, SED: standard deviation, LSD: least significant different, CV: coefficient of variation, * at 5% level of significance, ** significant at 1% level of significance, ns non-significant.
Table 6. Pearson correlation coefficients showing the magnitude of associations of phenotypic traits among okra accessions under drought-stressed (upper diagonal) and non-stressed (lower diagonal) conditions.
TraitsPHDTMFPLDPLDPWNPPPPYPPAGBHIRWRSR
PH 0.01 ns0.06 ns0.14 ns0.07 ns0.10 ns0.24 ns0.52 **−0.19 ns0.81 **0.32 ns
DTM−0.22 ns −0.20 ns−0.24 ns−0.27 ns−0.05 ns0.52 **−0.06 ns−0.29 ns−0.05 ns0.07 ns
FPL0.16 ns0.12 ns 0.21 ns0.12 ns0.43 *0.81 **0.36 ns0.85 **0.03 ns−0.23 ns
DPL0.24 ns0.03 ns0.26 ns 0.71 **0.30 ns−0.03 ns−0.35 ns0.25 ns0.29 ns0.28 ns
DPW0.41 *−0.29 ns0.06 ns0.58 ** 0.27 ns0.04 ns−0.14 ns0.17 ns0.03 ns0.05 ns
NPPP−0.03 ns0.15 ns0.39 **0.24 ns0.38 ns 0.26 ns0.19 ns0.34 ns0.14 ns−0.15 ns
PYPP0.46 **0.08 ns0.83 **0.16 ns0.15 ns0.37 ns 0.69 **0.67 **0.13 ns−0.27 ns
AGB0.88 **−0.14 ns0.36 ns0.27 ns0.30 ns−0.06 ns0.60 ** 0.13 ns0.34 ns0.27 ns
HI−0.47 *0.22 ns0.50 **−0.07 ns−0.11 ns0.61 **0.31 ns−0.48 * −0.09 ns−0.13 ns
RW0.70 **−0.02 ns−0.24 ns−0.12 ns−0.05 ns−0.32 ns−0.08 ns0.62 **−0.69 ** 0.58 **
RSR−0.18 ns0.20 ns−0.65 **−0.29 ns−0.33 ns−0.35 ns−0.57 **−0.31 ns−0.37 ns0.49 *
PH: plant height, DTM: number of days to maturity, FPL: fresh pod length, DPL: dry pod length, DPW: dry pod weight, NPPP: number of pods per plant, PYPP: yield per plant, AGB: above-ground biomass, HI: harvest index, RW: root weight, RSR: root: shoot weight, * significant at 5% level of significance, ** significant at 1% level of significance, ns non-significant.
Table 7. Principal component loading scores explained and cumulative variances of phenotypic traits among 26 okra accessions under drought-stressed and non-stressed conditions.
TraitsDrought-StressedNon-Stressed
PC1PC2PC3PC1PC2PC3PC4
PH0.320.740.460.550.760.050.01
DTM−0.33−0.030.32−0.09−0.270.480.74
FPL0.89−0.23−0.070.79−0.310.37−0.09
DPL0.290.50−0.730.510.05−0.530.41
DPW0.280.30−0.690.530.17−0.710.17
NPPP0.530.07−0.220.53−0.49−0.150.37
PYPP0.87−0.200.300.85−0.010.46−0.05
AGB0.580.010.700.640.710.19−0.02
HI0.78−0.29−0.270.24−0.900.16−0.01
RW0.260.870.30−0.060.880.310.21
RSR −0.200.74−0.07−0.760.300.100.39
Explained variance (eigenvalue)3.272.382.133.553.191.561.09
Proportion of total variance (%)29.6921.6419.3732.2428.9914.229.89
Cumulative variance (%)29.6951.3370.7032.2461.2375.4585.34
PH: plant height, DTM: number of days to maturity, FPL: fresh pod length, DPL: dry pod length, DPW: dry pod weight, NPPP: number of pods per plant, PYPP: pod yield per plant, AGB: above-ground biomass, HI: harvest index, RW: root weight, RSR: root: shoot ratio, PCs with ≥0.5 loading scores are boldfaced.
Publisher’s Note: MDPI stays neutral with regard to jurisdictional claims in published maps and institutional affiliations.

