
DNA Barcoding and New Records of Odonates (Insecta: Odonata) from Paraíba State, Brazil


Abstract
:1. Introduction
2. Materials and Methods
2.1. Ethics Statement
2.2. Data Collection
2.3. Extracting, Amplifying and Sequencing
2.4. Data Analysis
2.5. Species Delimitation
3. Results
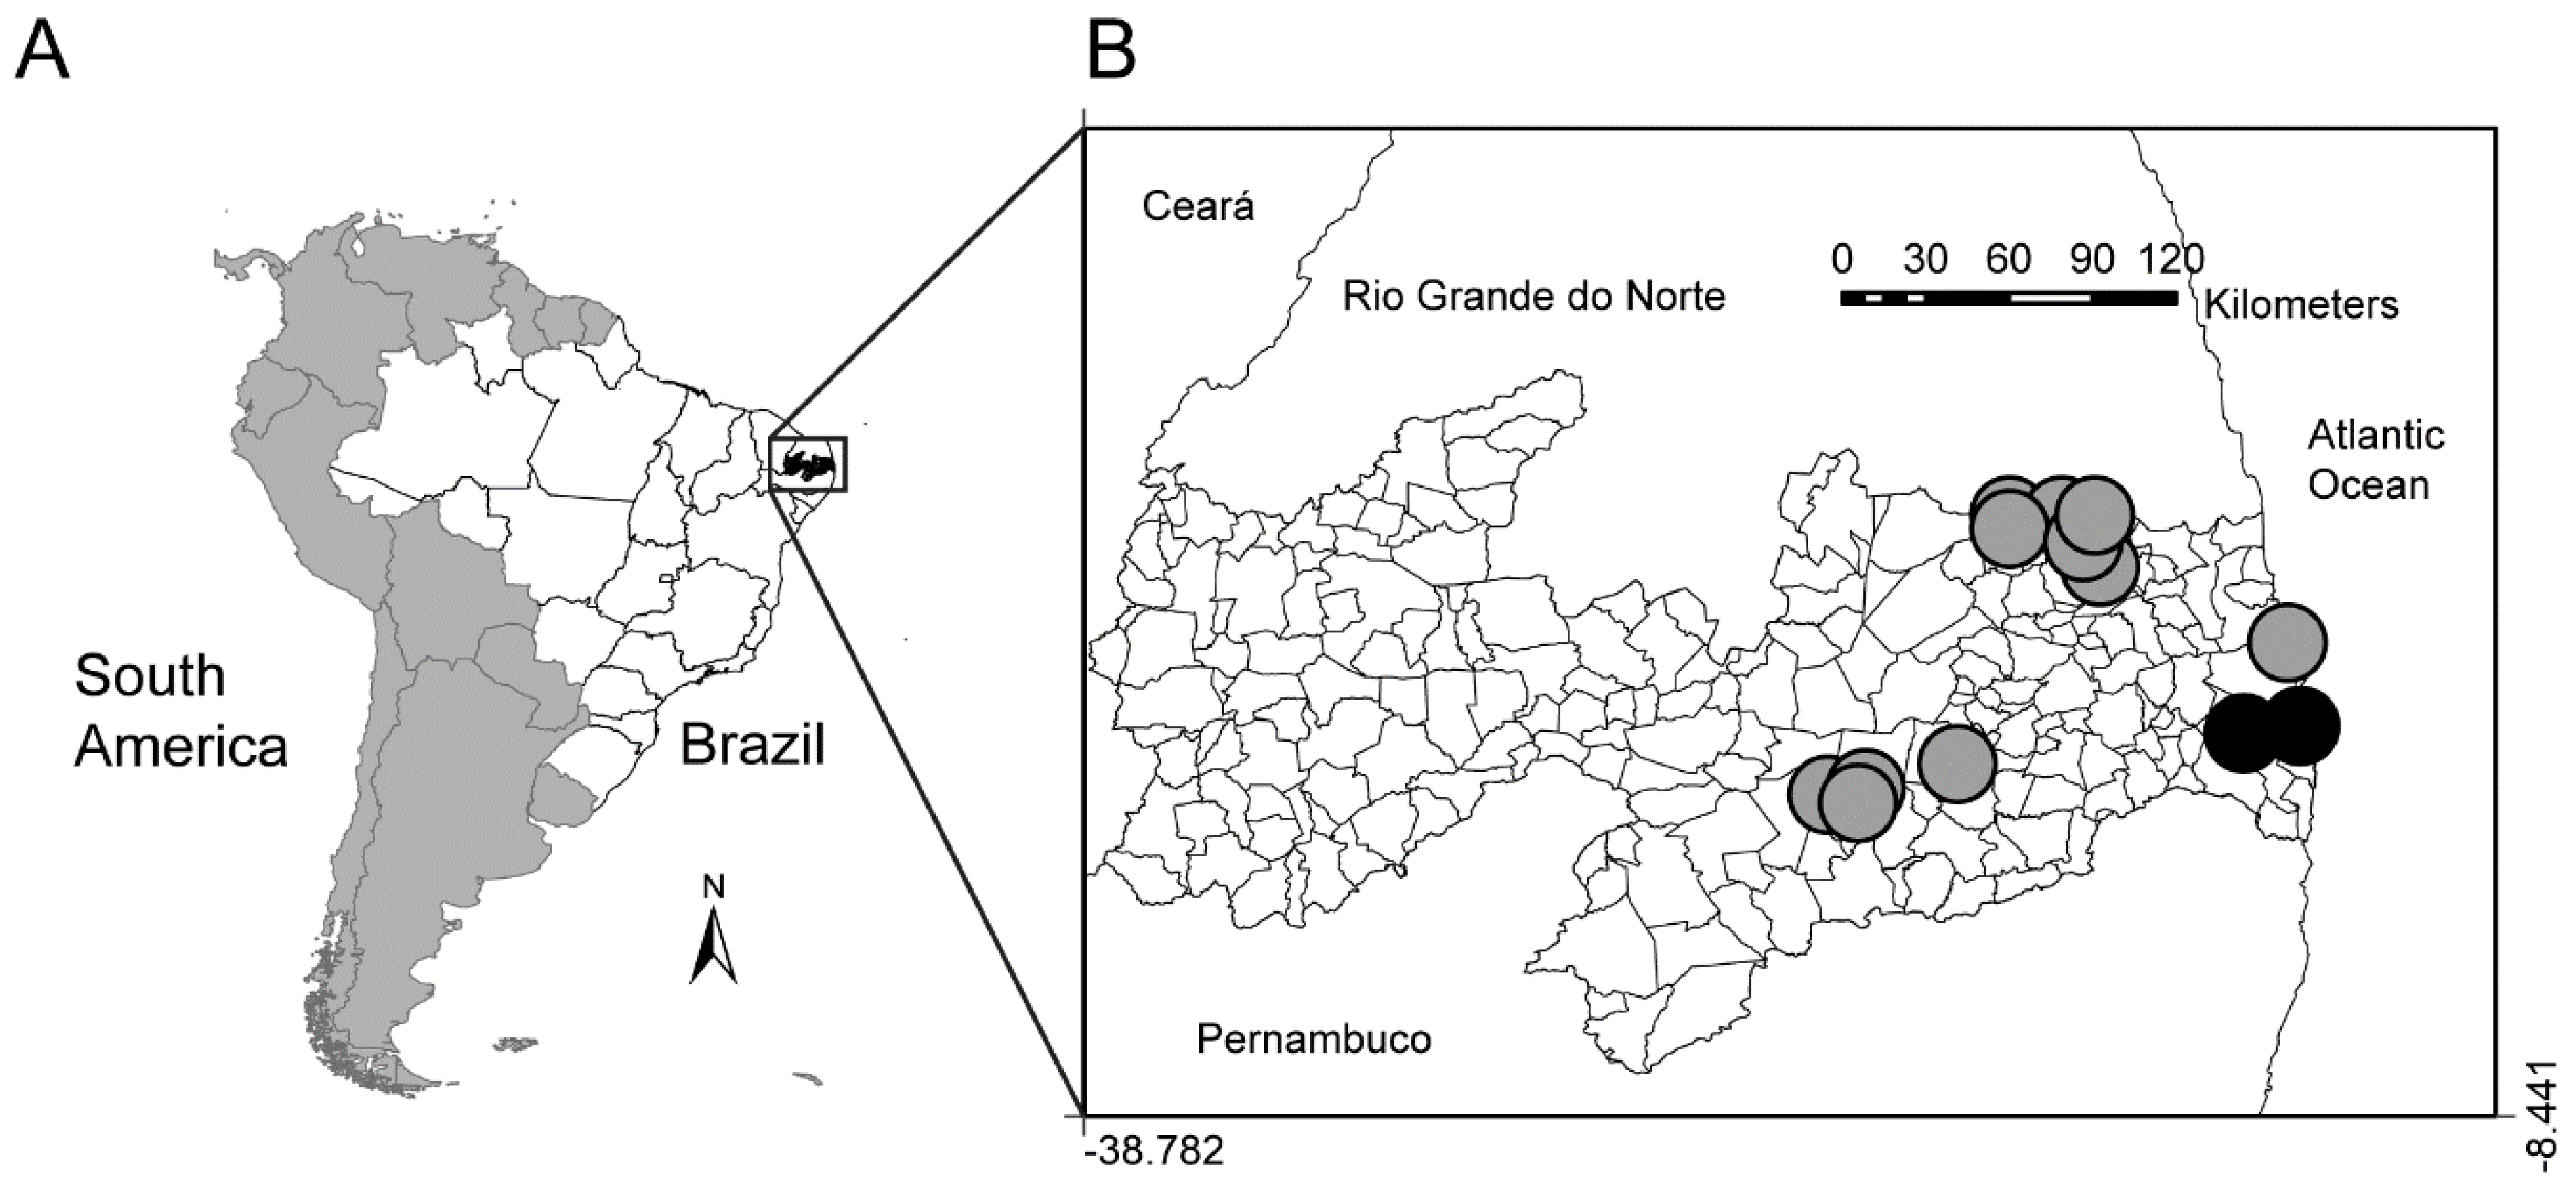
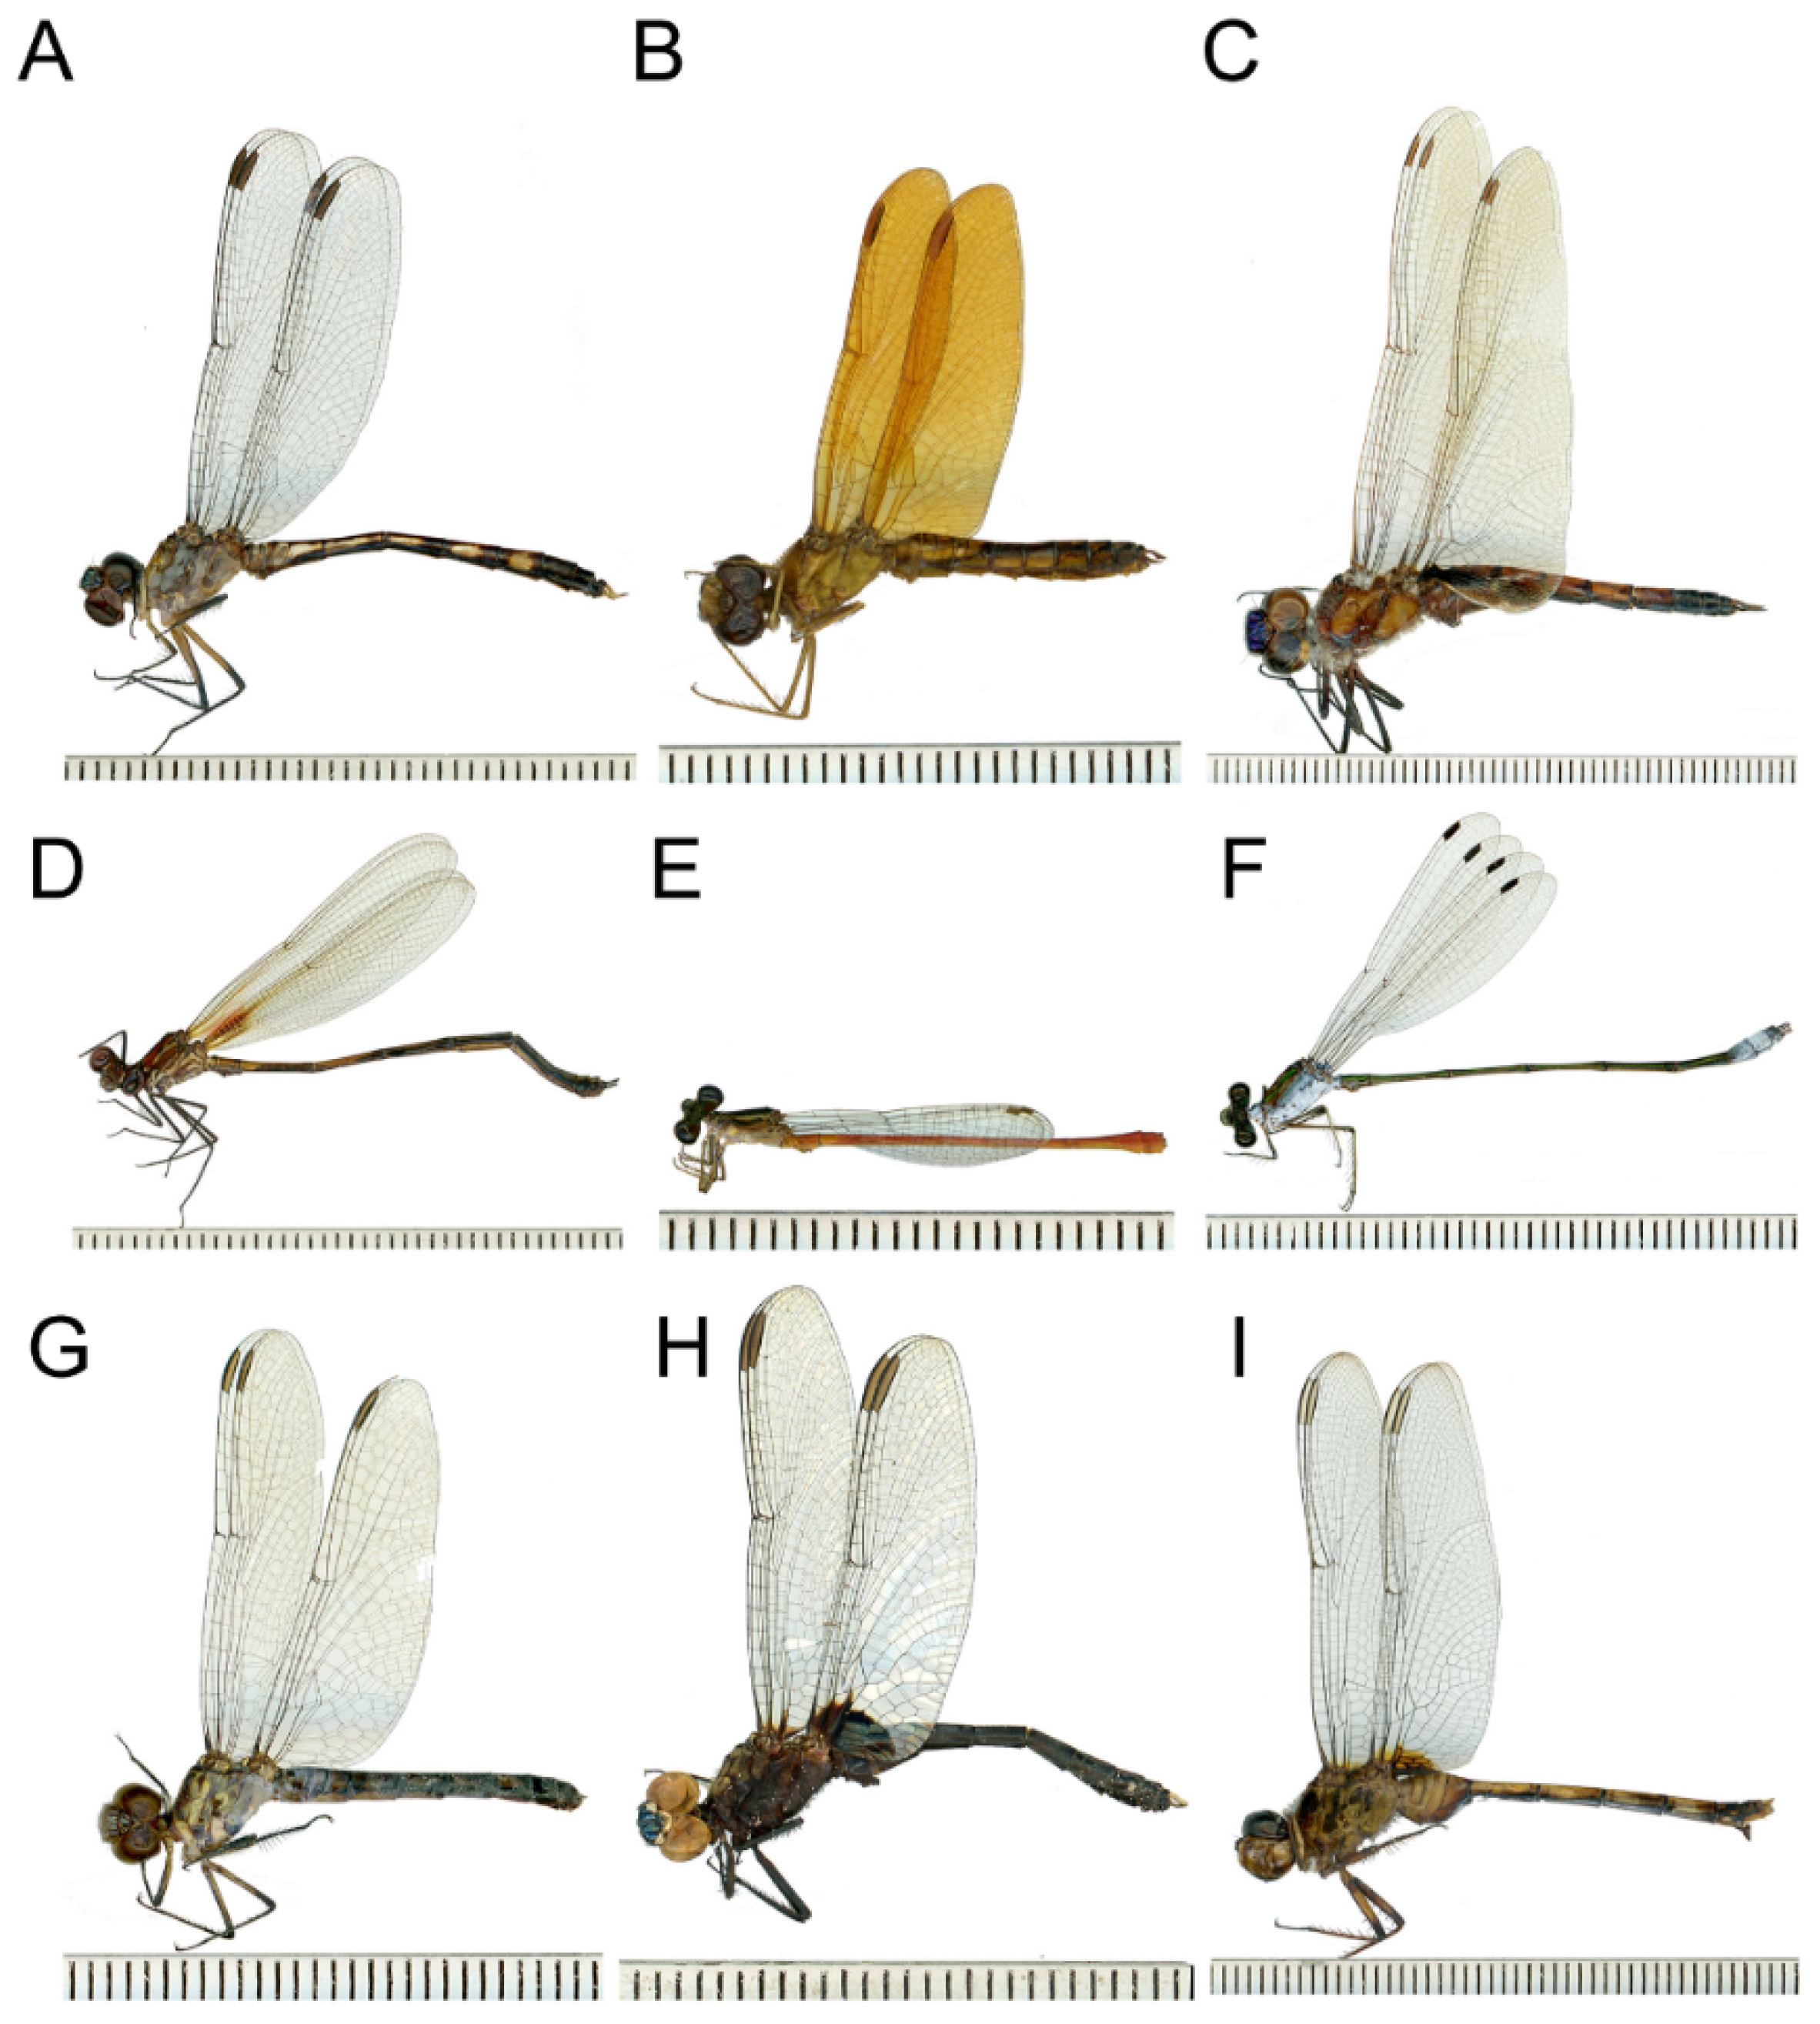
3.1. Sampling
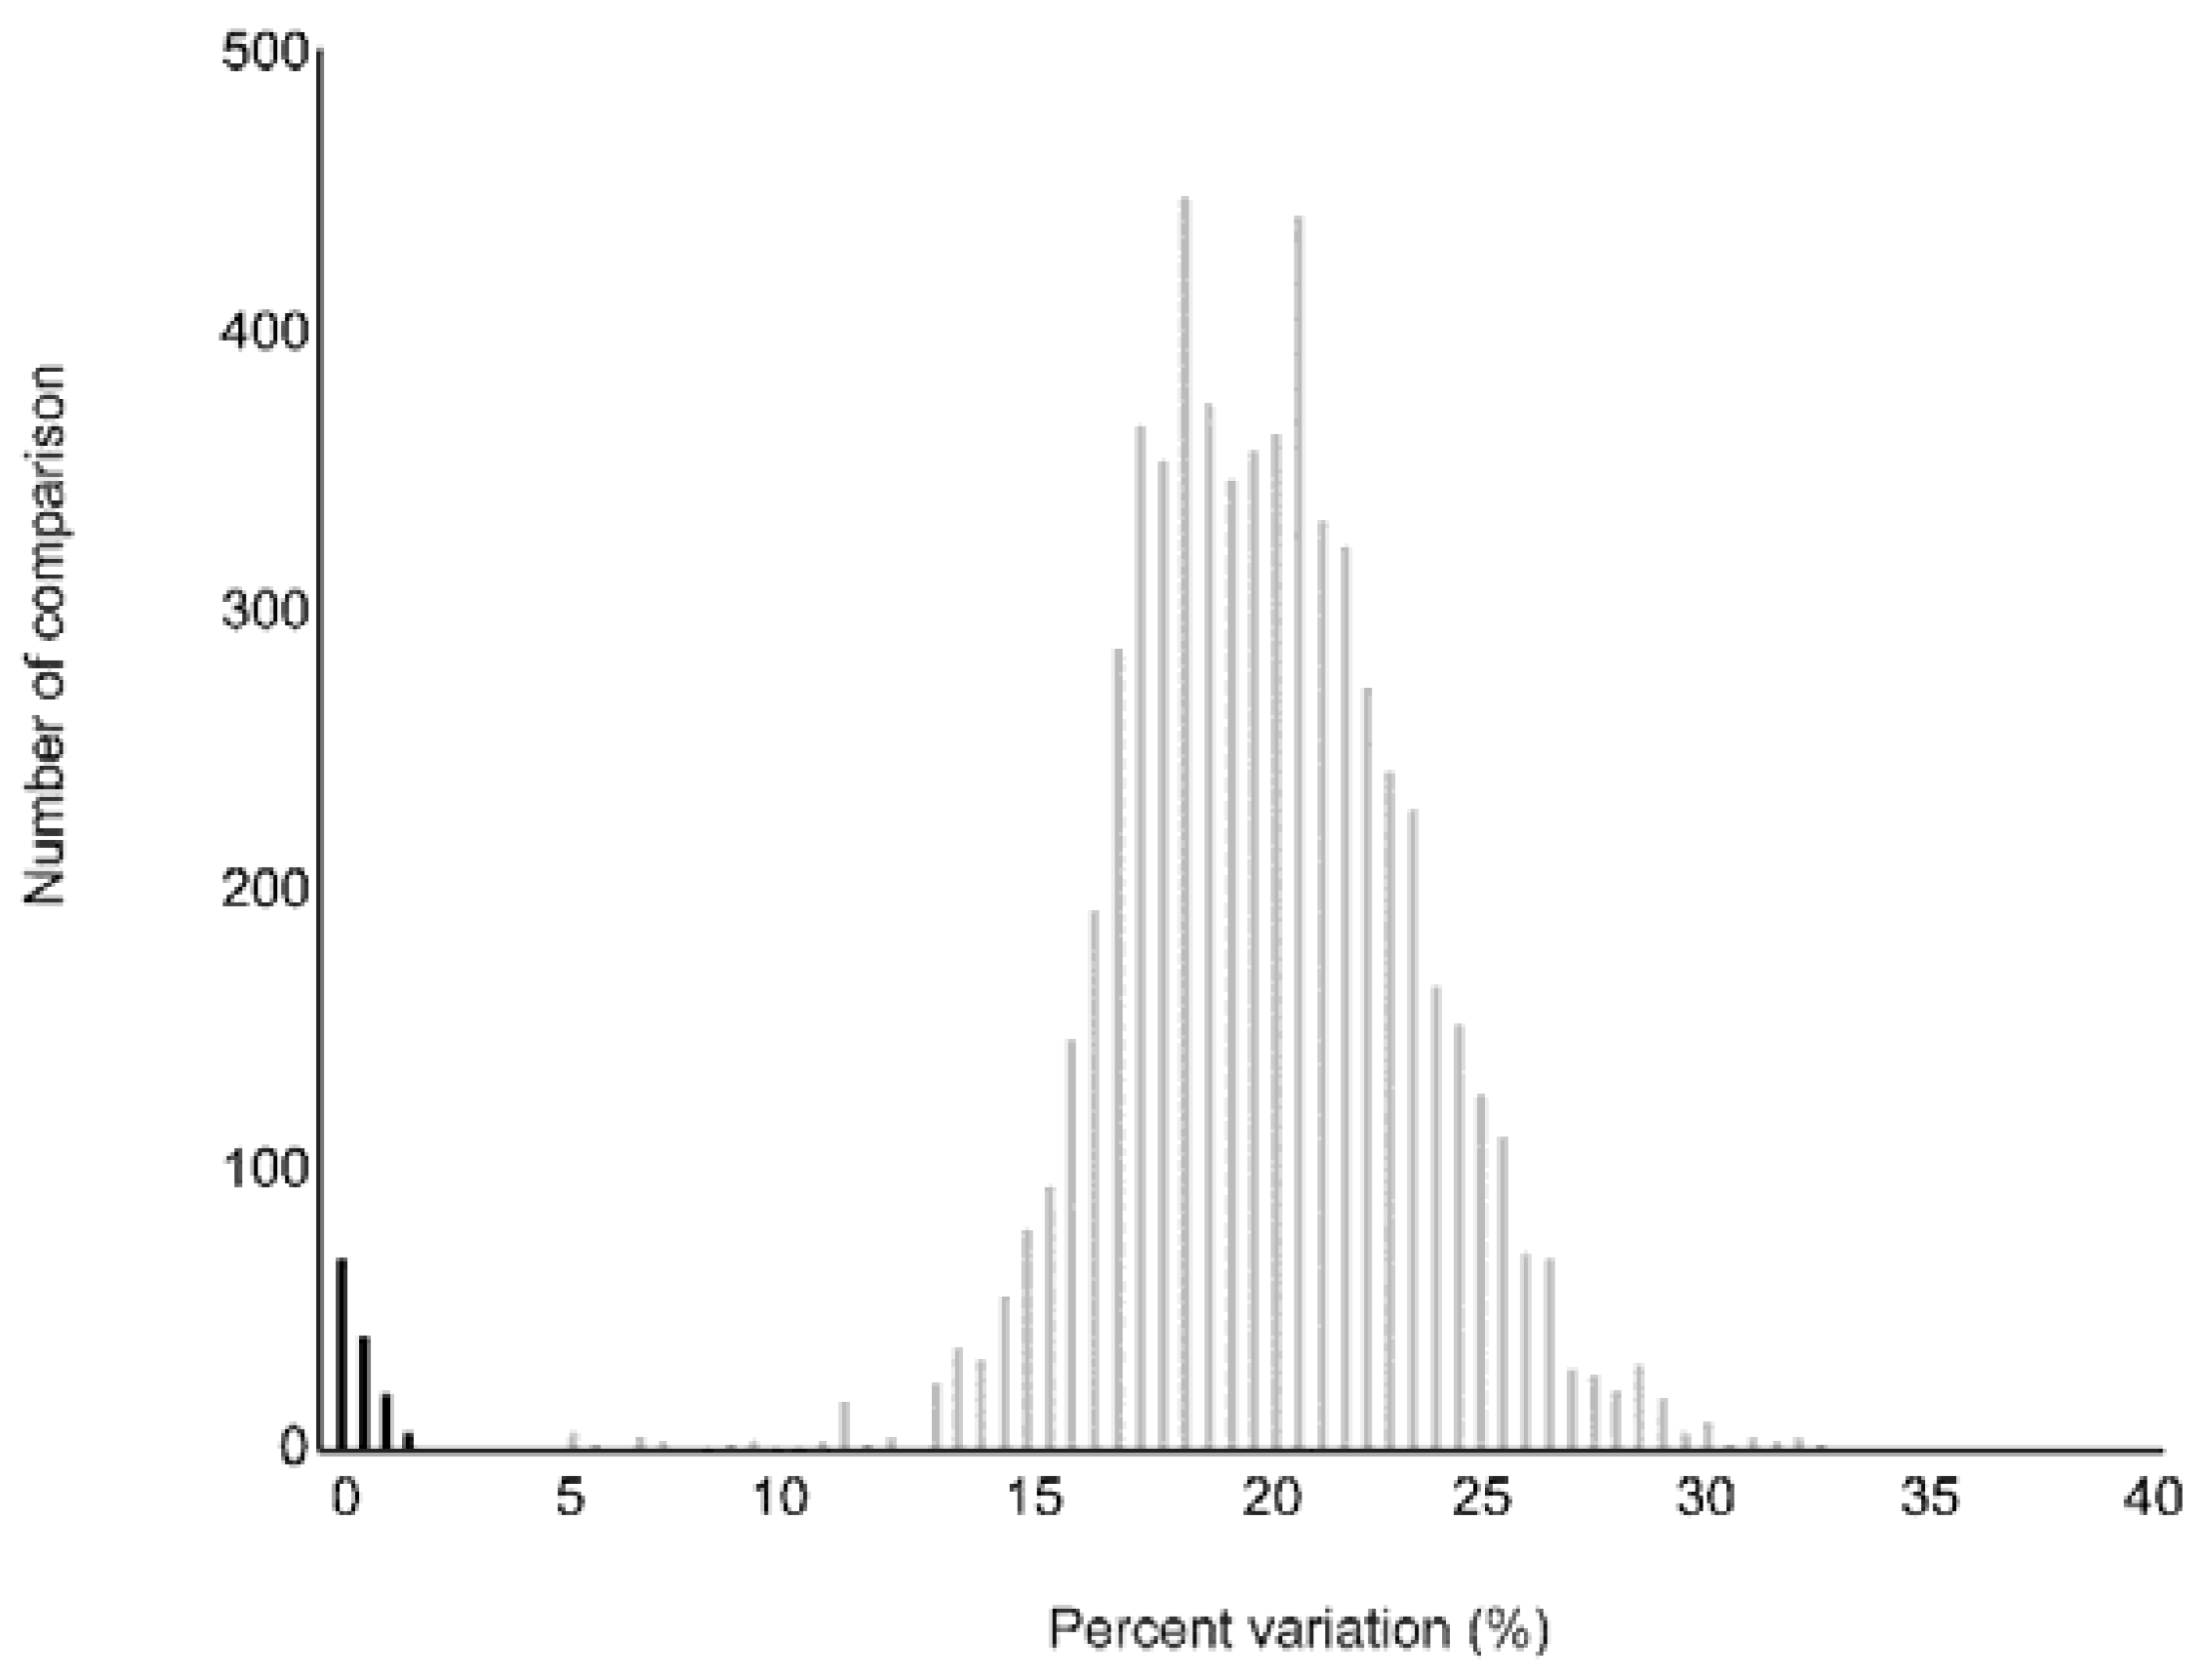
3.2. Genetic Variation
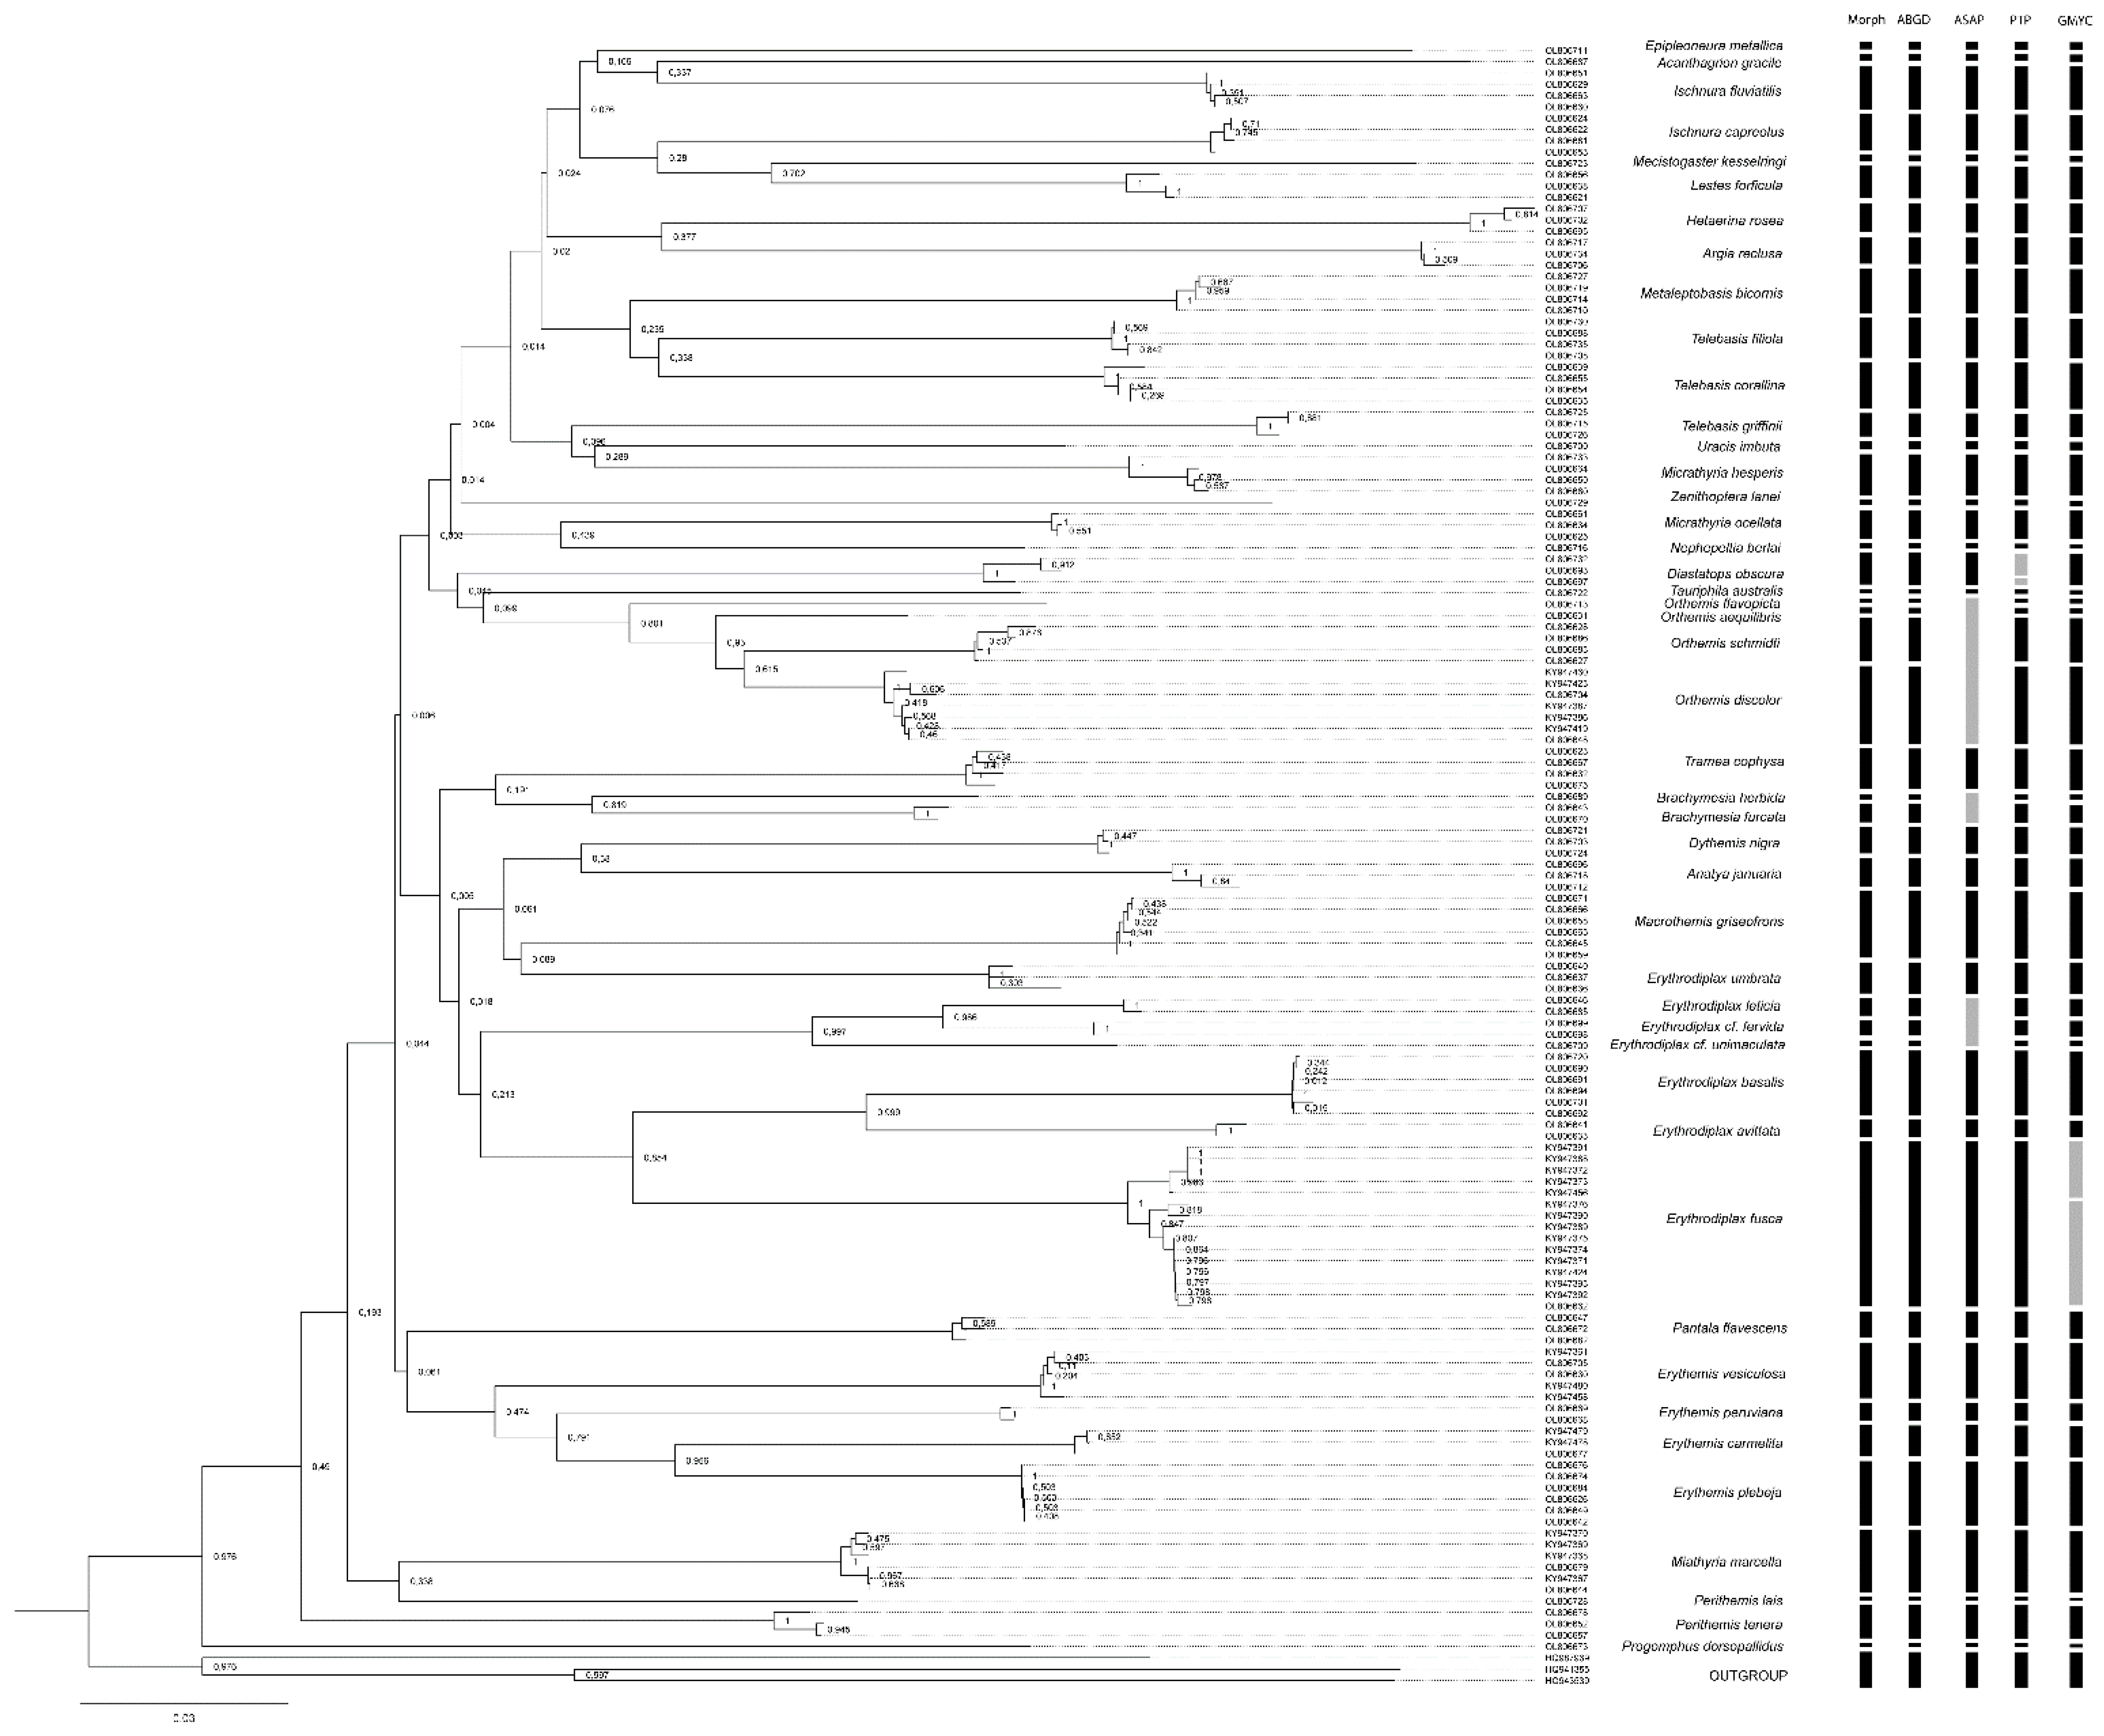
3.3. Species Delimitation
4. Discussion
5. Conclusions
Author Contributions
Funding
Institutional Review Board Statement
Data Availability Statement
Acknowledgments
Conflicts of Interest
References
- Trueman, J.W.H. A brief history of the classification and nomenclature of Odonata. Zootaxa 2007, 1668, 381–394. [Google Scholar] [CrossRef]
- Cordoba-Aguilar, A. Dragonflies and Damselflies: Model Organisms for Ecological and Evolutionary Research, 1st ed.; Oxford University Press: Oxford, UK, 2009. [Google Scholar]
- Miguel, T.B.; Oliveira-Junior, J.M.B.; Ligeiro, R.; Juen, L. Odonata (Insecta) as a tool for the biomonitoring of environmental quality. Ecol. Indic. 2017, 81, 555–566. [Google Scholar] [CrossRef]
- Veras, D.S.; Lustosa, G.S.; Moura, L.P.; Ferreira, M.F.R.; Juen, L. Differences in land use modify Odonata assemblages in the Cerrado-Caatinga ecotone. Acta Limnol. Bras. 2020, 32, e15. [Google Scholar] [CrossRef]
- May, M. Odonata: Who They Are and What They Have Done for Us Lately: Classification and Ecosystem Services of Dragonflies. Insects 2019, 10, 62. [Google Scholar] [CrossRef] [PubMed] [Green Version]
- Bried, J.; Ries, L.; Smith, B.; Patten, M.; Abbott, J.; Ball-Damerow, J.; Cannings, R.; Cordero-Rivera, A.; Córdoba-Aguilar, A.; De Marco, P.; et al. Towards Global Volunteer Monitoring of Odonate Abundance. Bioscience 2020, 70, 914–923. [Google Scholar] [CrossRef]
- Gómez-Tolosa, M.; Rivera-Velázquez, G.; Rioja-Paradela, T.M.; Mendoza-Cuenca, L.F.; Tejeda-Cruz, C.; López, S. The use of Odonata species for environmental assessment: A meta-analysis for the Neotropical region. Environ. Sci. Pollut. Res. 2021, 28, 1381–1396. [Google Scholar] [CrossRef] [PubMed]
- Koroiva, R.; Pereira-Colavite, A.; Batista, F.R.D.C.; Vilela, D.S. Checklist and contribution to the knowledge of the odonatofauna of Paraíba state, Brazil. Biota Neotrop. 2021, 21, e20211196. [Google Scholar] [CrossRef]
- Lencioni, F.A.A. Damselflies of Brazil—An Illustrated Identification Guide—Southeast Region; F.A.A. Lencioni: Jacareí, Brazil, 2017. [Google Scholar]
- Garrison, R.W.; von Ellenrieder, N.; Louton, J.A. Dragonfly Genera of the New Word: An Illustrated and Annotated Key to the Anisoptera. Available online: http://entomologia.net/L_Odonata/Odonata_Dragonfly_Genera_of_the_New_World__An_Illustrated_and_Annotated_Key_to_the_Anisoptera.pdf (accessed on 5 March 2016).
- Hebert, P.D.N.; Cywinska, A.; Ball, S.L.; de Waard, J.R. Biological identifications through DNA barcodes. Proc. Biol. Sci. 2003, 270, 313–321. [Google Scholar] [CrossRef] [Green Version]
- Hebert, P.D.N.; Ratnasingham, S.; de Waard, J.R. Barcoding animal life: Cytochrome c oxidase subunit 1 divergences among closely related species. Proc. R. Soc. B Biol. Sci. 2003, 270, S96–S99. [Google Scholar] [CrossRef] [Green Version]
- Lyra, M.L.; Haddad, C.F.B.; de Azeredo-Espin, A.M.L. Meeting the challenge of DNA barcoding Neotropical amphibians: Polymerase chain reaction optimization and new COI primers. Mol. Ecol. Resour. 2017, 17, 966–980. [Google Scholar] [CrossRef]
- Jennings, W.B.; Ruschi, P.A.; Ferraro, G.; Quijada, C.C.; Silva-Malanski, A.C.G.; Prosdocimi, F.; Buckup, P.A. Barcoding the Neotropical freshwater fish fauna using a new pair of universal COI primers with a discussion of primer dimers and M13 primer tails. Genome 2019, 62, 77–83. [Google Scholar] [CrossRef] [PubMed]
- Ratnasingham, S.; Hebert, P.D.N. BOLD: The Barcode of Life Data System (www.barcodinglife.org). Mol. Ecol. Notes 2007, 7, 355–364. [Google Scholar] [CrossRef] [PubMed] [Green Version]
- Koroiva, R.; Pepinelli, M.; Rodrigues, M.E.; Roque, F.O.; Lorenz-Lemke, A.P.; Kvist, S. DNA barcoding of odonates from the Upper Plata basin: Database creation and genetic diversity estimation. PLoS ONE 2017, 8, e0182283. [Google Scholar] [CrossRef] [PubMed] [Green Version]
- Vilela, D.S.; Koroiva, R.; Cordero-Rivera, A.; Guillermo-Ferreira, R. A further study on Franciscobasis Machado & Bedê, 2016 (Odonata: Coenagrionidae), a newly described genus from Minas Gerais, Brazil. PLoS ONE 2019, 14, e0223241. [Google Scholar] [CrossRef]
- Vilela, D.S.; Anjos-Santos, D.; Koroiva, R.; Cordero-Rivera, A.; Guillermo-Ferreira, R. Revision of the genus Minagrion Santos, 1965 (Odonata: Coenagrionidae). Zootaxa 2020, 4786, 176–198. [Google Scholar] [CrossRef] [PubMed]
- Pante, E.; Schoelinck, C.; Puillandre, N. From integrative taxonomy to species description: One step beyond. Syst. Biol. 2015, 64, 152–160. [Google Scholar] [CrossRef] [PubMed] [Green Version]
- IUCN. The IUCN Red List of Threatened Species: Version 2021-3. Available online: https://www.iucnredlist.org/search?permalink=7d7c85cb-009c-4c4d-83ae-25e4675dcd32 (accessed on 18 February 2022).
- Laurance, W.F. Conserving the hottest of the hotspots. Biol. Conserv. 2009, 142, 1137. [Google Scholar] [CrossRef]
- Marinho, F.P.; Mazzochini, G.G.; Manhães, A.P.; Weisser, W.W.; Ganade, G. Effects of past and present land use on vegetation cover and regeneration in a tropical dryland forest. J. Arid Environ. 2016, 132, 26–33. [Google Scholar] [CrossRef]
- da Silva, J.M.C.; Barbosa, L.C.F. Impact of Human Activities on the Caatinga. In Caatinga; Silva, J.M.C., da Tabarelli, M., Leal, I.R., Eds.; Springer International Publishing: Cham, Switzerland, 2017; pp. 359–368. [Google Scholar]
- Lencioni, F.A.A. Damselflies of Brazil: An Illustrated Identification Guide, Volume 1: Non-Coenagrionidae Families; All Print Editora: São Paulo, Brazil, 2005; ISBN 8598310565. [Google Scholar]
- Lencioni, F.A.A. Damselflies of Brazil: An Illustrated Identification Guide, Volume 2: Coenagrionidae; All Print Editora: São Paulo, Brazil, 2006; ISBN 8577180344. [Google Scholar]
- Garrison, R.W.; von Ellenrieder, N.; Louton, J.A. Damselfly Genera of the New World: An Illustrated and Annotated Key to the Zygoptera; Johns Hopkins University Press: Baltimore, MD, USA, 2010; ISBN 0801896703. [Google Scholar]
- Vilela, D.S.; Koroiva, R.; Tosta, T.H.A.; Novaes, M.C.; Guillermo-Ferreira, R. Dragonflies and damselflies from the West of Minas Gerais, Brazil: Checklist and new records. Biota Neotrop. 2020, 20, e20190851. [Google Scholar] [CrossRef] [Green Version]
- Paulson, D.; Schorr, M.; Deliry, C. World Odonata List. Available online: https://www2.pugetsound.edu/academics/academic-resources/slater-museum/biodiversity-resources/dragonflies/world-odonata-list2/ (accessed on 11 February 2021).
- Elbrecht, V.; Leese, F. Validation and Development of COI Metabarcoding Primers for Freshwater Macroinvertebrate Bioassessment. Front. Environ. Sci. 2017, 5, 11. [Google Scholar] [CrossRef] [Green Version]
- Folmer, O.; Black, M.; Hoeh, W.; Lutz, R.; Vrijenhoek, R. DNA primers for amplification of mitochondrial cytochrome c oxidase subunit I from diverse metazoan invertebrates. Mol. Mar. Biol. Biotechnol. 1994, 3, 294–299. [Google Scholar] [PubMed]
- Foottit, R.G.; Maw, H.E.L.; Havill, N.P.; Ahern, R.G.; Montgomery, M.E. DNA barcodes to identify species and explore diversity in the Adelgidae (Insecta: Hemiptera: Aphidoidea). Mol. Ecol. Resour. 2009, 9, 188–195. [Google Scholar] [CrossRef] [PubMed]
- Hebert, P.D.N.; Penton, E.H.; Burns, J.M.; Janzen, D.H.; Hallwachs, W. Ten species in one: DNA barcoding reveals cryptic species in the neotropical skipper butterfly Astraptes fulgerator. Proc. Natl. Acad. Sci. USA 2004, 101, 14812–14817. [Google Scholar] [CrossRef] [PubMed] [Green Version]
- Zhang, J.; Hanner, R. Molecular Approach to the Identification of Fish in the South China Sea. PLoS ONE 2012, 7, e30621. [Google Scholar] [CrossRef] [PubMed]
- Kearse, M.; Moir, R.; Wilson, A.; Stones-Havas, S.; Cheung, M.; Sturrock, S.; Buxton, S.; Cooper, A.; Markowitz, S.; Duran, C.; et al. Geneious Basic: An integrated and extendable desktop software platform for the organization and analysis of sequence data. Bioinformatics 2012, 28, 1647–1649. [Google Scholar] [CrossRef] [PubMed]
- Edgar, R.C. MUSCLE: Multiple sequence alignment with high accuracy and high throughput. Nucleic Acids Res. 2004, 32, 1792–1797. [Google Scholar] [CrossRef] [Green Version]
- Srivathsan, A.; Meier, R. On the inappropriate use of Kimura-2-parameter (K2P) divergences in the DNA-barcoding literature. Cladistics 2012, 28, 190–194. [Google Scholar] [CrossRef] [PubMed]
- Kumar, S.; Stecher, G.; Li, M.; Knyaz, C.; Tamura, K. MEGA X: Molecular Evolutionary Genetics Analysis across Computing Platforms. Mol. Biol. Evol. 2018, 35, 1547–1549. [Google Scholar] [CrossRef]
- Koroiva, R.; Kvist, S. Estimating the barcoding gap in a global dataset of cox1 sequences for Odonata: Close, but no cigar. Mitochondrial DNA Part A 2018, 29, 765–771. [Google Scholar] [CrossRef]
- Wiemers, M.; Fiedler, K. Does the DNA barcoding gap exist?—A case study in blue butterflies (Lepidoptera: Lycaenidae). Front. Zool. 2007, 4, 8. [Google Scholar] [CrossRef] [Green Version]
- Benson, D.A.; Cavanaugh, M.; Clark, K.; Karsch-Mizrachi, I.; Lipman, D.J.; Ostell, J.; Sayers, E.W. GenBank. Nucleic Acids Res. 2013, 41, D36–D42. [Google Scholar] [CrossRef] [Green Version]
- Ratnasingham, S.; Hebert, P.D.N. A DNA-Based Registry for All Animal Species: The Barcode Index Number (BIN) System. PLoS ONE 2013, 8, e66213. [Google Scholar] [CrossRef] [Green Version]
- Puillandre, N.; Lambert, A.; Brouillet, S.; Achaz, G. ABGD, Automatic Barcode Gap Discovery for primary species delimitation. Mol. Ecol. 2012, 21, 1864–1877. [Google Scholar] [CrossRef]
- Puillandre, N.; Brouillet, S.; Achaz, G. ASAP: Assemble species by automatic partitioning. Mol. Ecol. Resour. 2021, 21, 609–620. [Google Scholar] [CrossRef]
- Zhang, J.; Kapli, P.; Pavlidis, P.; Stamatakis, A. A general species delimitation method with applications to phylogenetic placements. Bioinformatics 2013, 29, 2869–2876. [Google Scholar] [CrossRef] [Green Version]
- Kapli, P.; Lutteropp, S.; Zhang, J.; Kobert, K.; Pavlidis, P.; Stamatakis, A.; Flouri, T. Multi-rate Poisson Tree Processes for single-locus species delimitation under Maximum Likelihood and Markov Chain Monte Carlo. Bioinformatics 2017, 33, 1630–1638. [Google Scholar] [CrossRef] [Green Version]
- Stamatakis, A. RAxML version 8: A tool for phylogenetic analysis and post-analysis of large phylogenies. Bioinformatics 2014, 30, 1312–1313. [Google Scholar] [CrossRef]
- Fujisawa, T.; Barraclough, T.G. Delimiting species using single-locus data and the generalized mixed yule coalescent approach: A revised method and evaluation on simulated data sets. Syst. Biol. 2013, 62, 707–724. [Google Scholar] [CrossRef] [Green Version]
- Bouckaert, R.; Vaughan, T.G.; Barido-Sottani, J.; Duchêne, S.; Fourment, M.; Gavryushkina, A.; Heled, J.; Jones, G.; Kühnert, D.; De Maio, N.; et al. BEAST 2.5: An advanced software platform for Bayesian evolutionary analysis. PLoS Comput. Biol. 2019, 15, e1006650. [Google Scholar] [CrossRef] [Green Version]
- Rambaut, A.; Suchard, M.A.; Xie, D.; Drummond, A.J. Tracer, v.1.6. Available online: http://beast.bio.ed.ac.uk/Tracer (accessed on 6 May 2016).
- Darriba, D.; Taboada, G.L.; Doallo, R.; Posada, D. jModelTest 2: More models, new heuristics and parallel computing. Nat. Methods 2012, 9, 772. [Google Scholar] [CrossRef] [Green Version]
- Guindon, S.; Gascuel, O. A Simple, Fast, and Accurate Algorithm to Estimate Large Phylogenies by Maximum Likelihood. Syst. Biol. 2003, 52, 696–704. [Google Scholar] [CrossRef] [PubMed] [Green Version]
- Ribeiro, C.; Firme, B.; Araujo, S.A.; de Sá, A.; Zander, F.; Teixeira, K.; Santos, L.R.; Rodrigues, M.E. Check-list of Odonata from the state of Bahia, Brazil: Ecological information, distribution, and new state records. Odonatologica 2021, 50, 161–186. [Google Scholar] [CrossRef]
- Takiya, D.; Santos, A.P.; Pinto, Â.; Henriques-Oliveira, A.L.; Carvalho, A.; Sampaio, B.; Clarkson, B.; Moreira, F.; Avelino-Capistrano, F.; Gonçalves, I.; et al. Aquatic Insects from the Caatinga: Checklists and diversity assessments of Ubajara (Ceará State) and Sete Cidades (Piauí State) National Parks, Northeastern Brazil. Biodivers. Data J. 2016, 4, e8354. [Google Scholar] [CrossRef] [PubMed]
- Casas, P.A.S.; Sing, K.-W.; Lee, P.-S.; Nuñeza, O.M.; Villanueva, R.J.T.; Wilson, J.-J. DNA barcodes for dragonflies and damselflies (Odonata) of Mindanao, Philippines. Mitochondrial DNA Part A 2018, 29, 206–211. [Google Scholar] [CrossRef] [PubMed]
- Rewicz, T.; Móra, A.; Tończyk, G.; Szymczak, A.; Grabowski, M.; Calleja, E.J.; Pernecker, B.; Csabai, Z. First records raise questions: DNA barcoding of Odonata in the middle of the Mediterranean. Genome 2021, 64, 196–206. [Google Scholar] [CrossRef]
- Ris, F. Libellulinen. In Collections Zoologiques du Baron Edm. De Selys Longchamps—Catalogue Systématique et Descriptif; Hayez: Bruxelles, Belgium, 1911; pp. 385–528. [Google Scholar]
- Borror, D.J. A revision of the Libelluline genus Erythrodiplax (Odonata); The Ohio State University: Columbus, OH, USA, 1942. [Google Scholar]
- Garrison, R.W. A synopsis of the genus Hetaerina with descriptions of four new species (Odonata: Calopterygidae). Trans. Am. Entomol. Soc. 1990, 116, 175–259. [Google Scholar]
- von Ellenrieder, N. A synopsis of the Neotropical genus Nephepeltia (Odonata: Libellulidae), including description of a new species, synonymies, and a key to males. Zootaxa 2014, 3796, 121–146. [Google Scholar] [CrossRef] [Green Version]
- von Ellenrieder, N.; Muzón, J. The Argentinean species of the genus Perithemis Hagen (Anisoptera: Libellulidae). Odonatologica 1999, 28, 1–14. [Google Scholar]
- Garrison, R.W. A synopsis of the genus Telebasis (Odonata: Coenagrionidae). Int. J. Odonatol. 2009, 12, 1–121. [Google Scholar] [CrossRef]
- De Marmels, J.; Rácenis, J. An analysis of the cophysa-group of Tramea Hagen, with descriptions of two new species (Anisoptera: Libellulidae). Odonatologica 1982, 11, 109–128. [Google Scholar]
- Koroiva, R.; Rodrigues, L.R.R.; Santana, D.J. DNA barcoding for identification of anuran species in the central region of South America. PeerJ 2020, 8. [Google Scholar] [CrossRef] [PubMed]
- Geiger, M.; Koblmüller, S.; Assandri, G.; Chovanec, A.; Ekrem, T.; Fischer, I.; Galimberti, A.; Grabowski, M.; Haring, E.; Hausmann, A.; et al. Coverage and quality of DNA barcode references for Central and Northern European Odonata. PeerJ 2021, 9, e11192. [Google Scholar] [CrossRef] [PubMed]
- Galimberti, A.; Assandri, G.; Maggioni, D.; Ramazzotti, F.; Baroni, D.; Bazzi, G.; Chiandetti, I.; Corso, A.; Ferri, V.; Galuppi, M.; et al. Italian odonates in the Pandora’s box: A comprehensive DNA barcoding inventory shows taxonomic warnings at the Holarctic scale. Mol. Ecol. Resour. 2021, 21, 183–200. [Google Scholar] [CrossRef] [PubMed]
- Vega-Sánchez, Y.M.; Lorenzo-Carballa, M.O.; Vilela, D.S.; Guillermo-Ferreira, R.; Koroiva, R. Comment on “Molecular identification of seven new Zygopteran genera from South China through partial cytochrome oxidase subunit I (COI) gene”. Meta Gene 2020, 25, 100759. [Google Scholar] [CrossRef]


| Similarity Match Regional Database | Similarity Match Global Database | |||||||||
|---|---|---|---|---|---|---|---|---|---|---|
| Species | N | Mean (%) | Max (%) | Nearest Neighbor | DNN (%) | GenBank id. (%) | GenBank E-Value | GenBank Species | Bold Similarity | Bold Species |
| Acanthagrion gracile | 1 | - | - | Lestes forficula | 19.01 | 92.17 | 1.00 × 10−149 | Acanthagrion cuyabae | no match | no match |
| Anatya januaria | 3 | 0.36 | 0.57 | Erythrodiplax umbrata | 15.44 | 99.73 | 0 | Anatya sp. | 99.74 | Anatya guttata |
| Argia reclusa | 3 | 0.16 | 0.25 | Orthemis discolor | 18.88 | 98.74 | 0 | Argia reclusa | 98.73 | Argia reclusa |
| Brachymesia furcata | 2 | 0.85 | 0.85 | Brachymesia herbida | 10.55 | 99.67 | 0 | Brachymesia furcata | 99.67 | Brachymesia furcata |
| Brachymesia herbida | 1 | - | - | Brachymesia furcata | 10.55 | 90.05 | 0 | Brachymesia furcata | 99.33 | Brachymesia herbida |
| Diastatops obscura | 3 | 0.86 | 1.3 | Orthemis aequilibris | 12.2 | 99.83 | 0 | Diastatops obscura | 99.83 | Diastatops obscura |
| Dythemis nigra | 3 | 0.16 | 0.25 | Orthemis discolor | 13.87 | 100 | 0 | Dythemis multipunctata | 100 | Dythemis nigra |
| Epipleoneura metallica | 1 | - | - | Dythemis nigra | 20.59 | 85.4 | 0 | Argia fumipennis | no match | no match |
| Erythemis plebeja | 6 | 0 | 0 | Erythemis carmelita | 10.64 | 90.95 | 0 | Erythemis peruviana | 100 | Erythemis plebeja |
| Erythemis vesiculosa | 5 | 0.32 | 0.50 | Erythrodiplax umbrata | 14.62 | 87.50 | 0 | Acisoma attenboroughi | 99.85 | Erythemis vesiculosa |
| Erythemis peruviana | 2 | 0.33 | 0.33 | Erythemis plebeja | 13.02 | 88.39 | 0 | Agrionoptera insignis | 100 | Erythemis peruviana |
| Erythemis carmelita | 3 | 0.10 | 0.16 | Erythemis plebeja | 10.64 | 97.90 | 0 | Erythemis sp. | 98.67 | Erythemis mithroides |
| Erythrodiplax avittata | 2 | 0 | 0 | Erythrodiplax basalis | 11.04 | 86.93 | 0 | Erythrodiplax paraguayensis | no match | no match |
| Erythrodiplax umbrata | 3 | 1.14 | 1.37 | Orthemis discolor | 13.74 | 99.84 | 0 | Erythrodiplax umbrata | 99.83 | Erythrodiplax umbrata |
| Erythrodiplax leticia | 2 | 0.16 | 0.16 | Erythrodiplax cf fervida | 4.87 | 92.53 | 0 | Erythemis sp. | no match | no match |
| Erythrodiplax fusca | 15 | 0.89 | 1.85 | Erythrodiplax avittata | 15.75 | 94.53 | 0 | Erythrodiplax connata | 99.85 | Erythrodiplax fusca |
| Erythrodiplax cf. fervida | 2 | 0 | 0 | Erythrodiplax leticia | 4.87 | 91.71 | 0 | Erythemis sp. | no match | no match |
| Erythrodiplax basalis | 6 | 0.11 | 0.75 | Erythrodiplax avittata | 11.04 | 87.24 | 6.00 × 10−118 | Erythrodiplax paraguayensis | 99.74 | Erythrodiplax paraguayensis |
| Erythrodiplax cf. unimaculata | 1 | - | - | Erythrodiplax leticia | 8.58 | 95.86 | 6.00 × 10−163 | Libellulidae sp. | 97.11 | Erythrodiplax kimminsi |
| Hetaerina rosea | 3 | 0.52 | 0.78 | Ischnura capreolus | 19.6 | 98.96 | 0 | Hetaerina sanguinea | 98.95 | Hetaerina sanguinea |
| Ischnura fluviatilis | 4 | 0.12 | 0.26 | Telebasis filiola | 15.96 | 99.22 | 0 | Ischnura fluviatilis | 98.68 | Ischnura fluviatilis |
| Ischnura capreolus | 4 | 0.25 | 0.49 | Lestes forficula | 13.2 | 100 | 0 | Ischnura capreolus | 100 | Ischnura capreolus |
| Lestes forficula | 3 | 0.69 | 1.03 | Ischnura capreolus | 13.2 | 100 | 0 | Lestes forficula | 98.78 | Lestes forficula |
| Macrothemis griseofrons | 6 | 0.1 | 0.17 | Erythrodiplax umbrata | 15.39 | 88.07 | 0 | Agrionoptera insignis | no match | no match |
| Mecistogaster kesselringi | 1 | - | - | Lestes forficula | 14.76 | 95.92 | 6.00 × 10−178 | Mecistogaster amalia | no match | no match |
| Metaleptobasis bicornis | 4 | 0.12 | 0.25 | Telebasis corallina | 13.75 | 93.42 | 6.00 × 10−163 | Metaleptobasis selysi | no match | no match |
| Miathyria marcella | 6 | 0.53 | 0.92 | Perithemis lais | 13.19 | 87.84 | 0 | Agrionoptera insignis | 100 | Miathyria marcella |
| Micrathyria hesperis | 4 | 0.38 | 0.51 | Uracis imbuta | 14.37 | 87.98 | 4.00 × 10−125 | Micrathyria stawiarskii | no match | no match |
| Micrathyria ocellata | 3 | 0.11 | 0.16 | Nephepeltia belai | 13.76 | 100 | 0 | Micrathyria ocellata | 100 | Micrathyria ocellata |
| Nephepeltia berlai | 1 | - | - | Micrathyria ocellata | 13.76 | 98.11 | 0 | Nephepeltia aequisetis | 98.1 | Nephepeltia aequisetis |
| Orthemis schmidt | 4 | 0.62 | 0.78 | Orthemis discolor | 5.00 | 99.48 | 0 | Orthemis schmidti | 99.48 | Orthemis schmidti |
| Orthemis aequilibris | 1 | - | - | Orthemis discolor | 4.92 | 95.25 | 0 | Orthemis discolor | 99.83 | Orthemis aequilibris |
| Orthemis discolor | 7 | 0.51 | 0.91 | Orthemis aequilibris | 4.92 | 99.03 | 0 | Orthemis sp. | 100 | Orthemis discolor |
| Orthemis flavopicta | 1 | - | - | Orthemis discolor | 9.69 | 93.79 | 4.00 × 10−176 | Orthemis cultriformis | no match | no match |
| Pantala flavescens | 3 | 0.65 | 0.65 | Tramea cophysa | 14.9 | 99.84 | 0 | Pantala flavescens | 99.83 | Pantala flavescens |
| Perithemis tenera | 3 | 0.87 | 1.27 | Brachymesia furcata | 13.28 | 91.1 | 0 | Libellulidae sp. | 99.83 | Perithemis icteroptera |
| Perithemis lais | 1 | - | - | Brachymesia furcata | 13.14 | 88.21 | 0 | Libellulinae sp. | 99.25 | Perithemis lais |
| Progomphus dorsopallidus | 1 | - | - | Perithemis tenera | 18.93 | 86.22 | 4.00 × 10−171 | Tanypteryx hageni | no match | no match |
| Tauriphila australis | 1 | - | - | Orthemis flavopicta | 14.64 | 100 | 0 | Tauriphila australis | 100 | Tauriphila australis |
| Telebasis corallina | 4 | 0.47 | 0.8 | Orthemis schmidt | 13.08 | 88.28 | 0 | Telebasis willinki | 97.9 | Telebasis corallina |
| Telebasis filiola | 4 | 0.26 | 0.51 | Telebasis corallina | 13.26 | 98.72 | 0 | Telebasis willinki | 98.96 | Telebasis willinki |
| Telebasis griffinii | 3 | 0.52 | 0.78 | Uracis imbuta | 17.12 | 88.89 | 8.00 × 10−127 | Telebasis digiticollis | no match | no match |
| Tramea cophysa | 4 | 0.83 | 1.02 | Brachymesia furcata | 12.88 | 99.11 | 0 | Tramea cophysa | 98.34 | Tramea binotata |
| Uracis imbuta | 1 | - | - | Nephepeltia berlai | 14.35 | 94.08 | 1.00 × 10−179 | Uracis imbuta | 99.04 | Uracis imbuta |
| Zenithoptera lanei | 1 | - | - | Telebasis corallina | 19.33 | 98.24 | 8.00 × 10−166 | Zenithoptera sp. | no match | no match |
Publisher’s Note: MDPI stays neutral with regard to jurisdictional claims in published maps and institutional affiliations. |
© 2022 by the authors. Licensee MDPI, Basel, Switzerland. This article is an open access article distributed under the terms and conditions of the Creative Commons Attribution (CC BY) license (https://creativecommons.org/licenses/by/4.0/).
Share and Cite
Koroiva, R.; Gomes, V.G.N.; Vilela, D.S. DNA Barcoding and New Records of Odonates (Insecta: Odonata) from Paraíba State, Brazil. Diversity 2022, 14, 203. https://doi.org/10.3390/d14030203
Koroiva R, Gomes VGN, Vilela DS. DNA Barcoding and New Records of Odonates (Insecta: Odonata) from Paraíba State, Brazil. Diversity. 2022; 14(3):203. https://doi.org/10.3390/d14030203
Chicago/Turabian StyleKoroiva, Ricardo, Vanessa Gabrielle Nóbrega Gomes, and Diogo Silva Vilela. 2022. "DNA Barcoding and New Records of Odonates (Insecta: Odonata) from Paraíba State, Brazil" Diversity 14, no. 3: 203. https://doi.org/10.3390/d14030203