
Response of Diatoms to the Changing Water Quality in the Myristica Swamps of the Western Ghats, India


Abstract
:1. Introduction
2. Materials and Methods
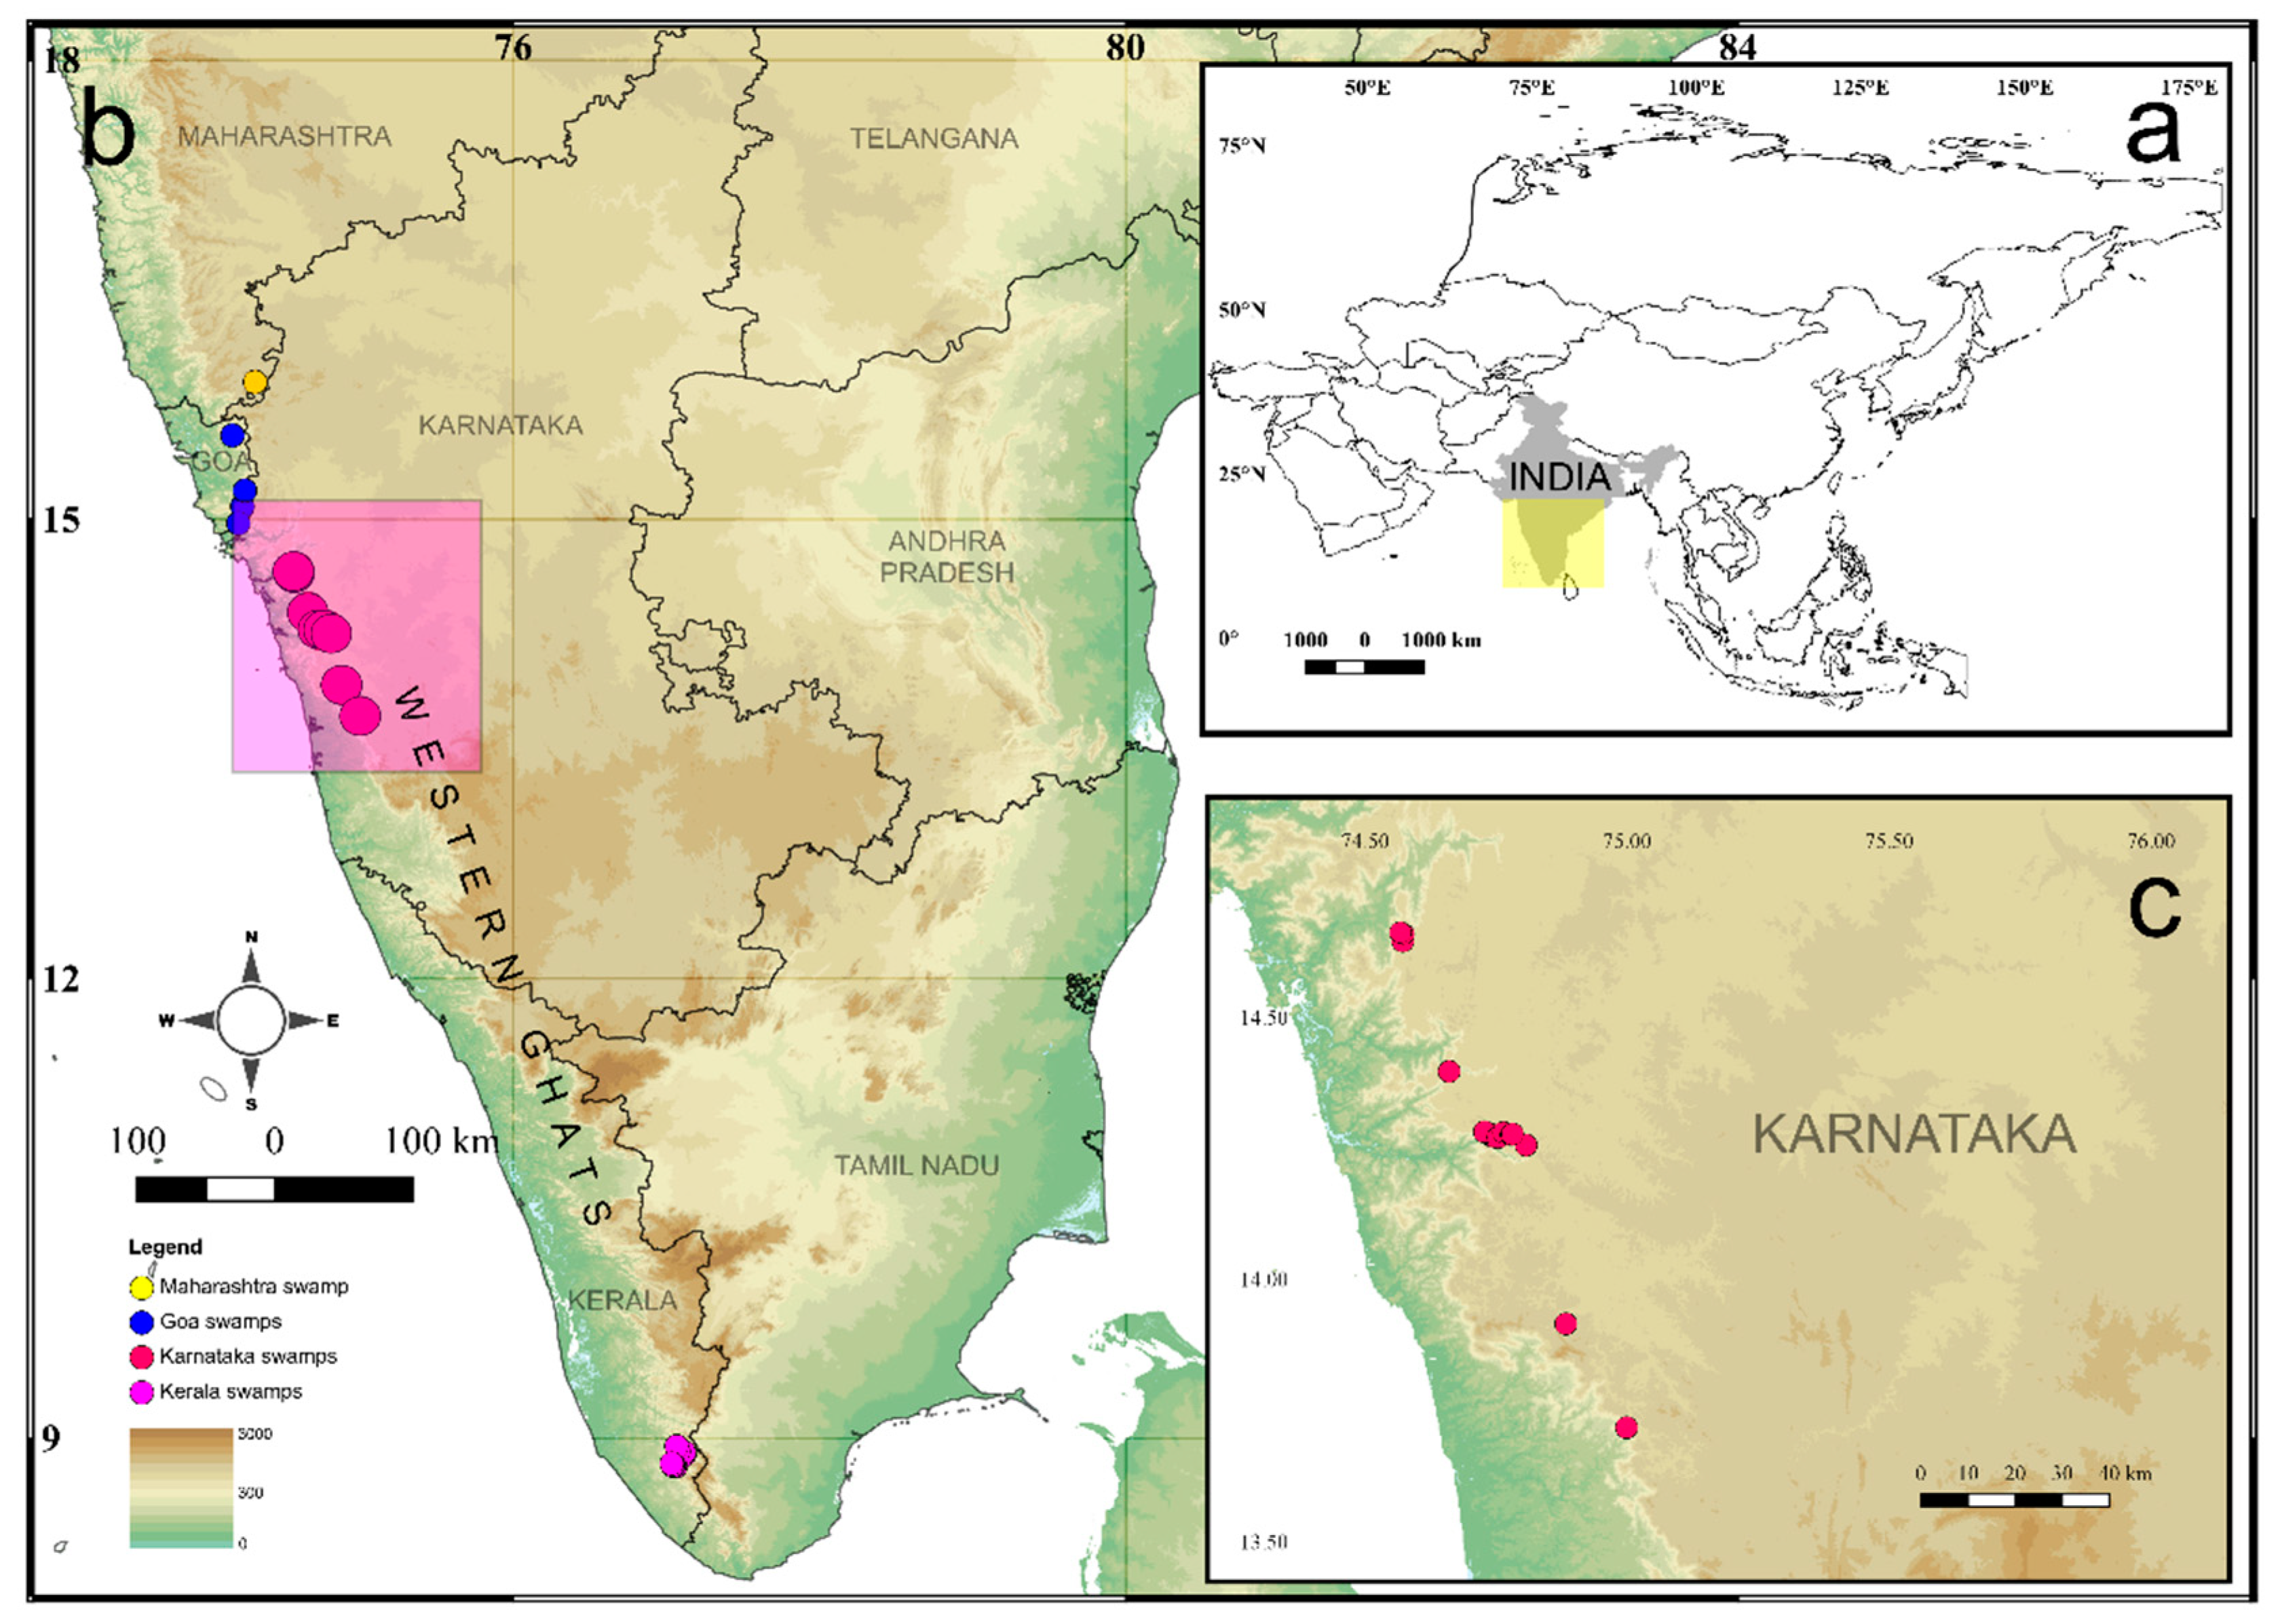
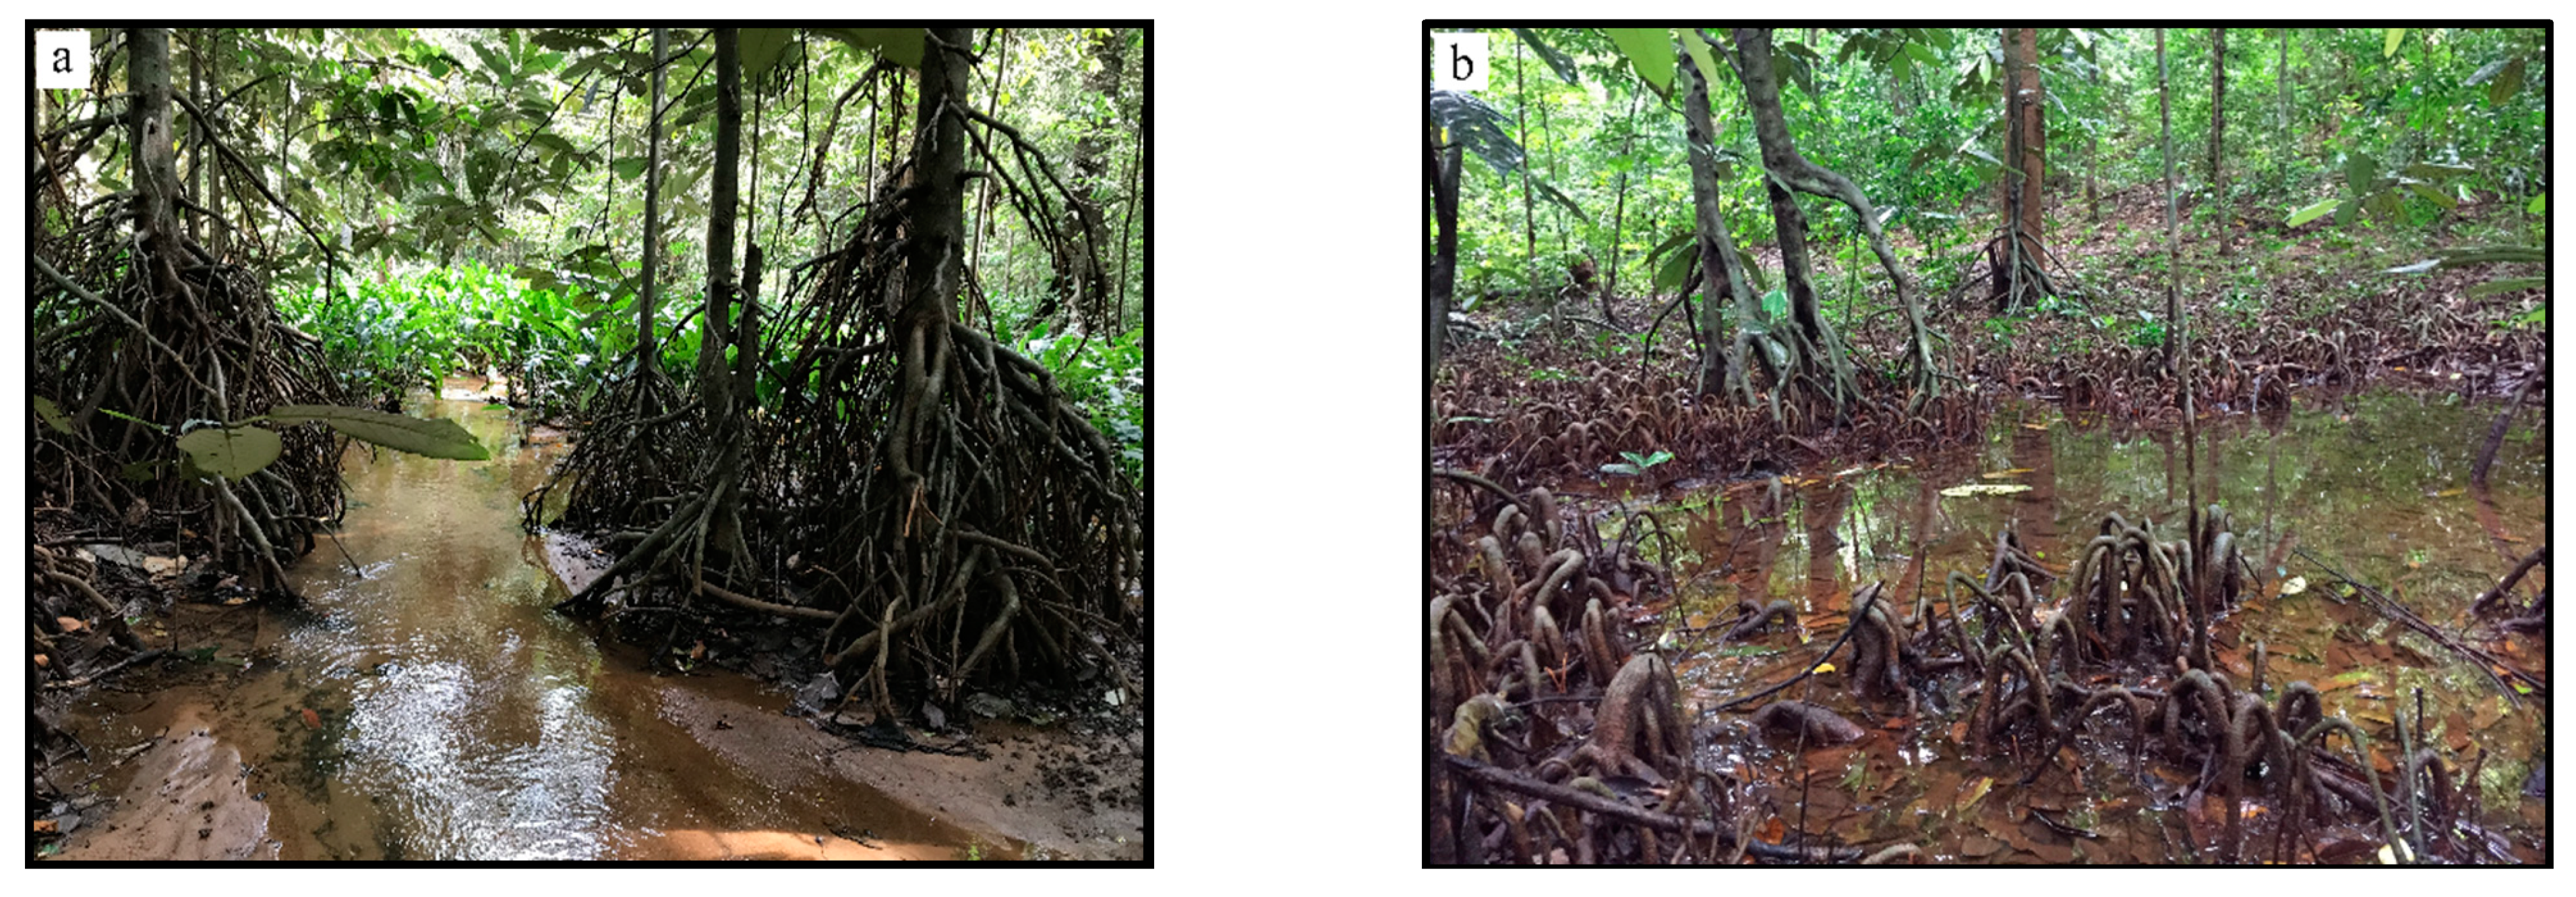
2.1. Study Area
2.2. Environmental Variables Sampling and Analysis
2.3. Diatom Sampling, Preparation, and Analysis
2.4. Statistical Analysis
3. Results
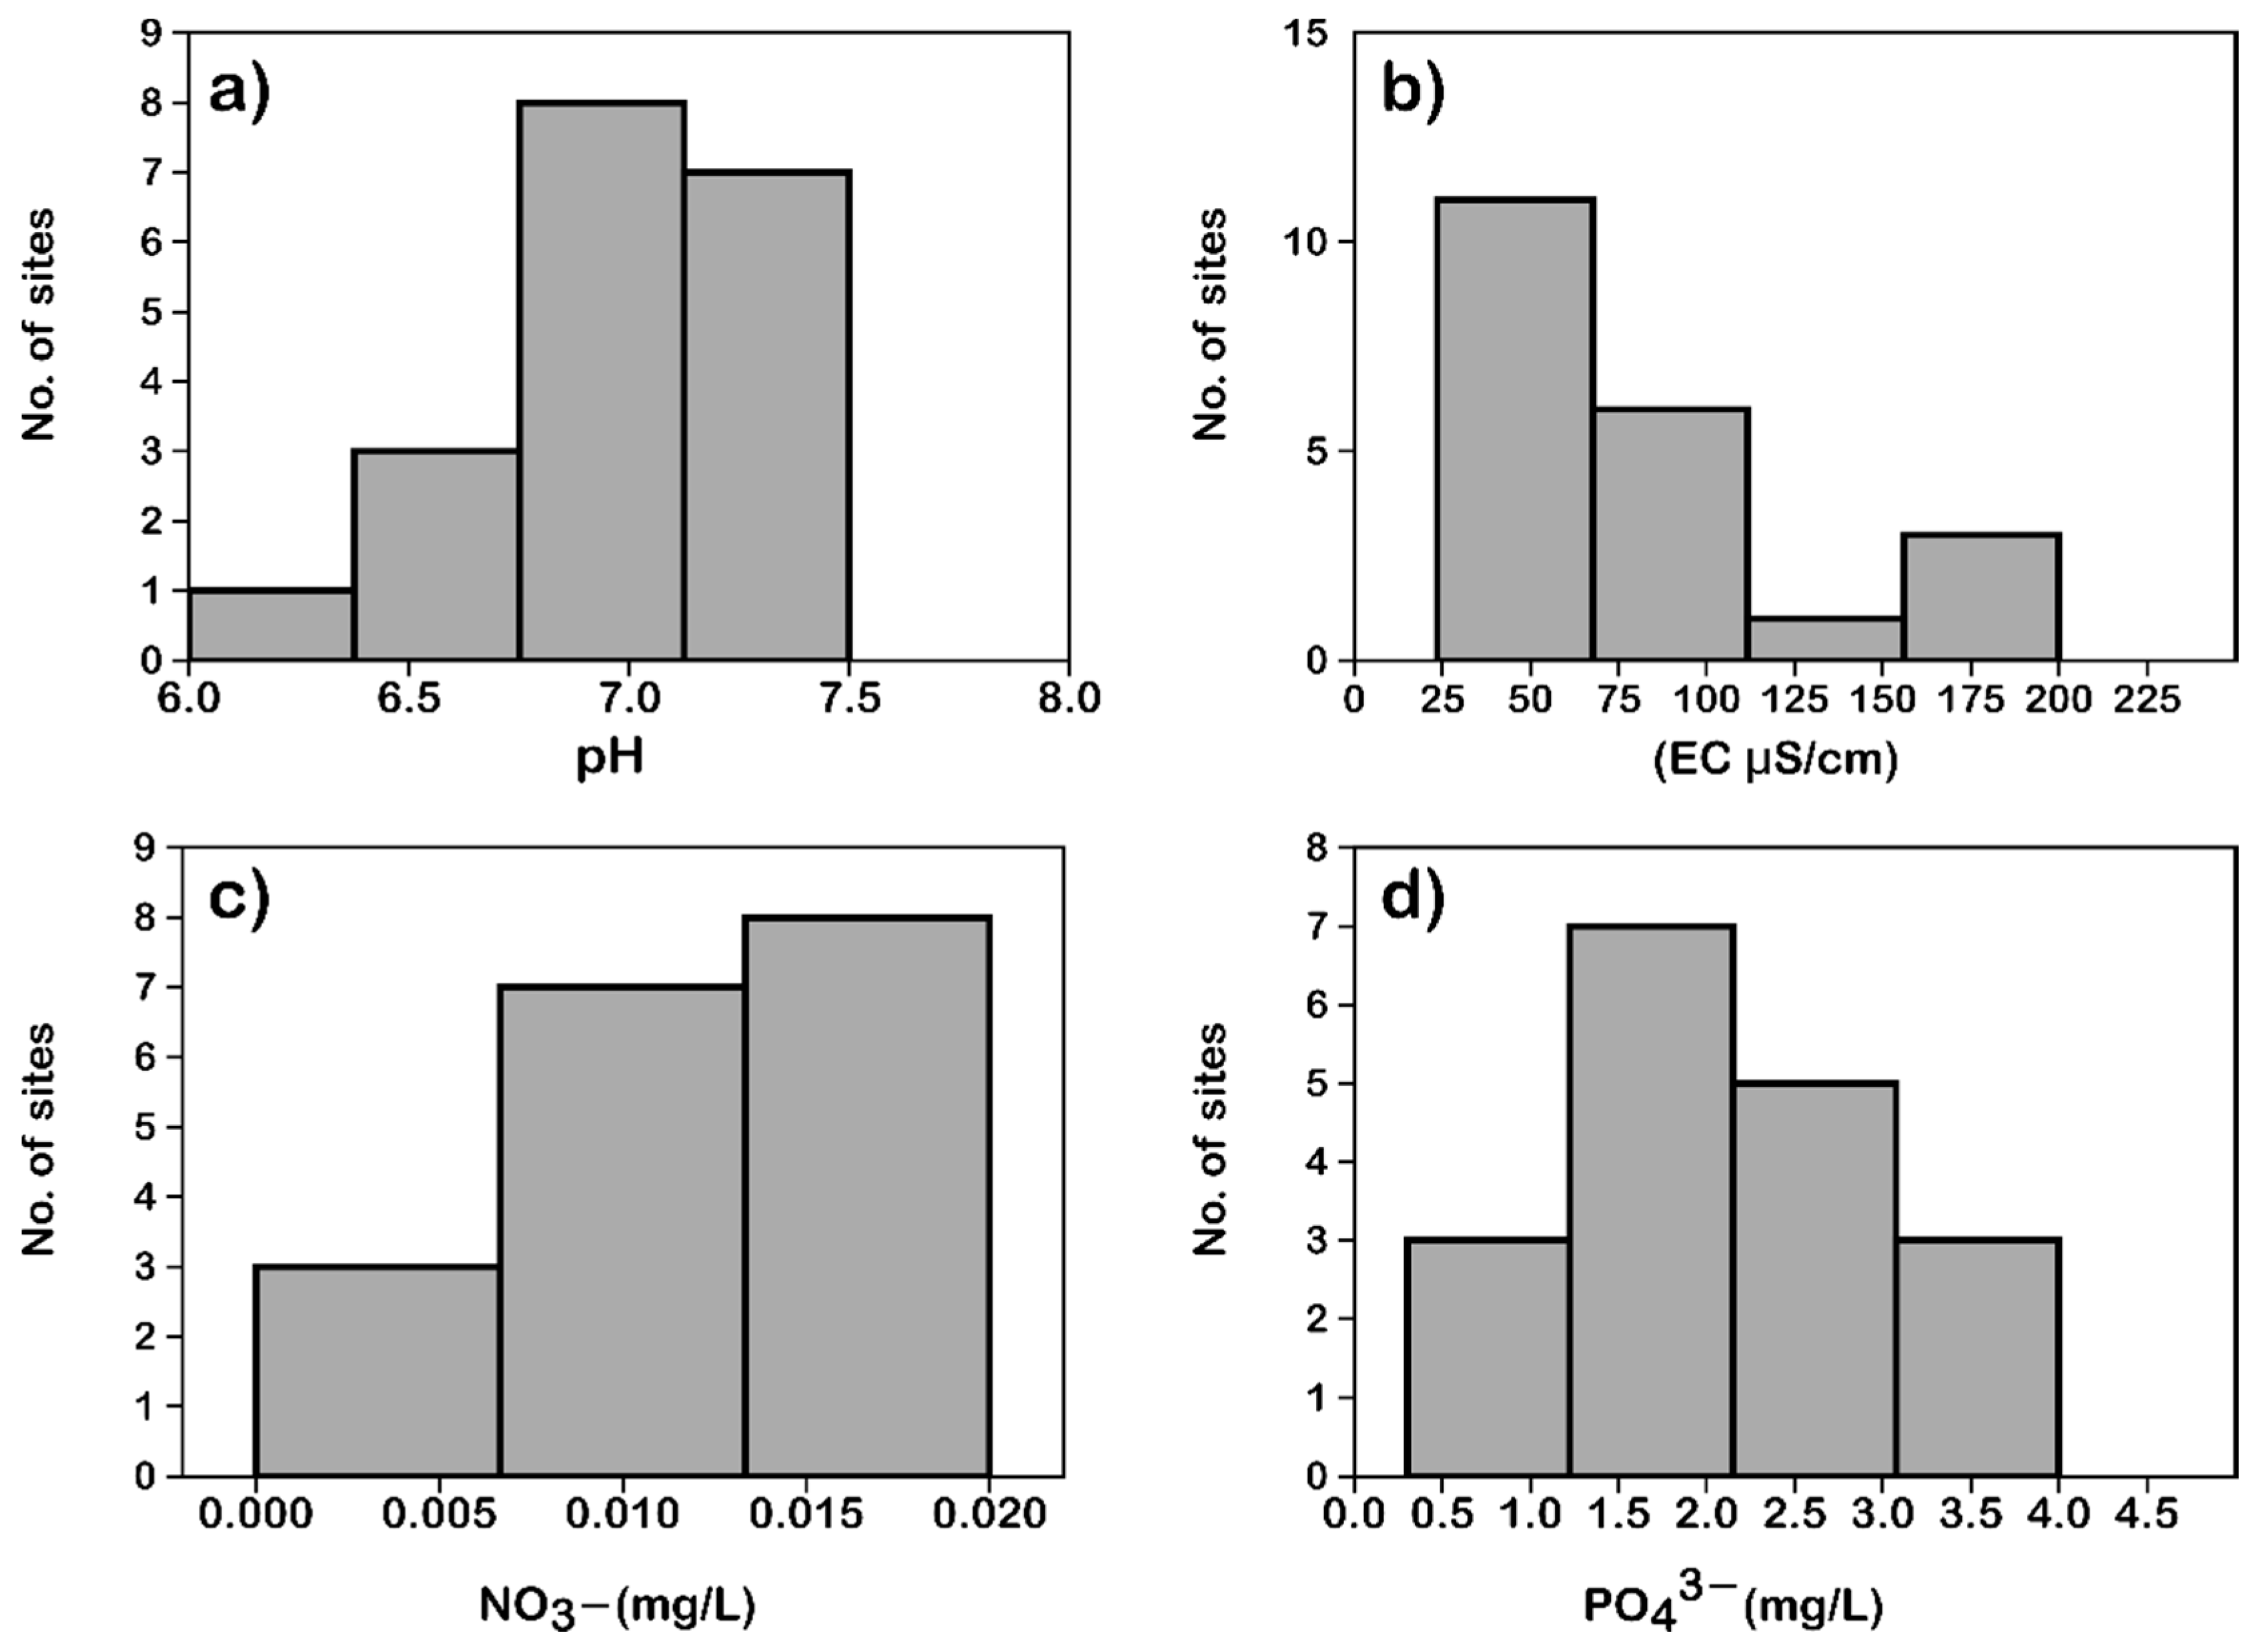
3.1. Hydrochemistry
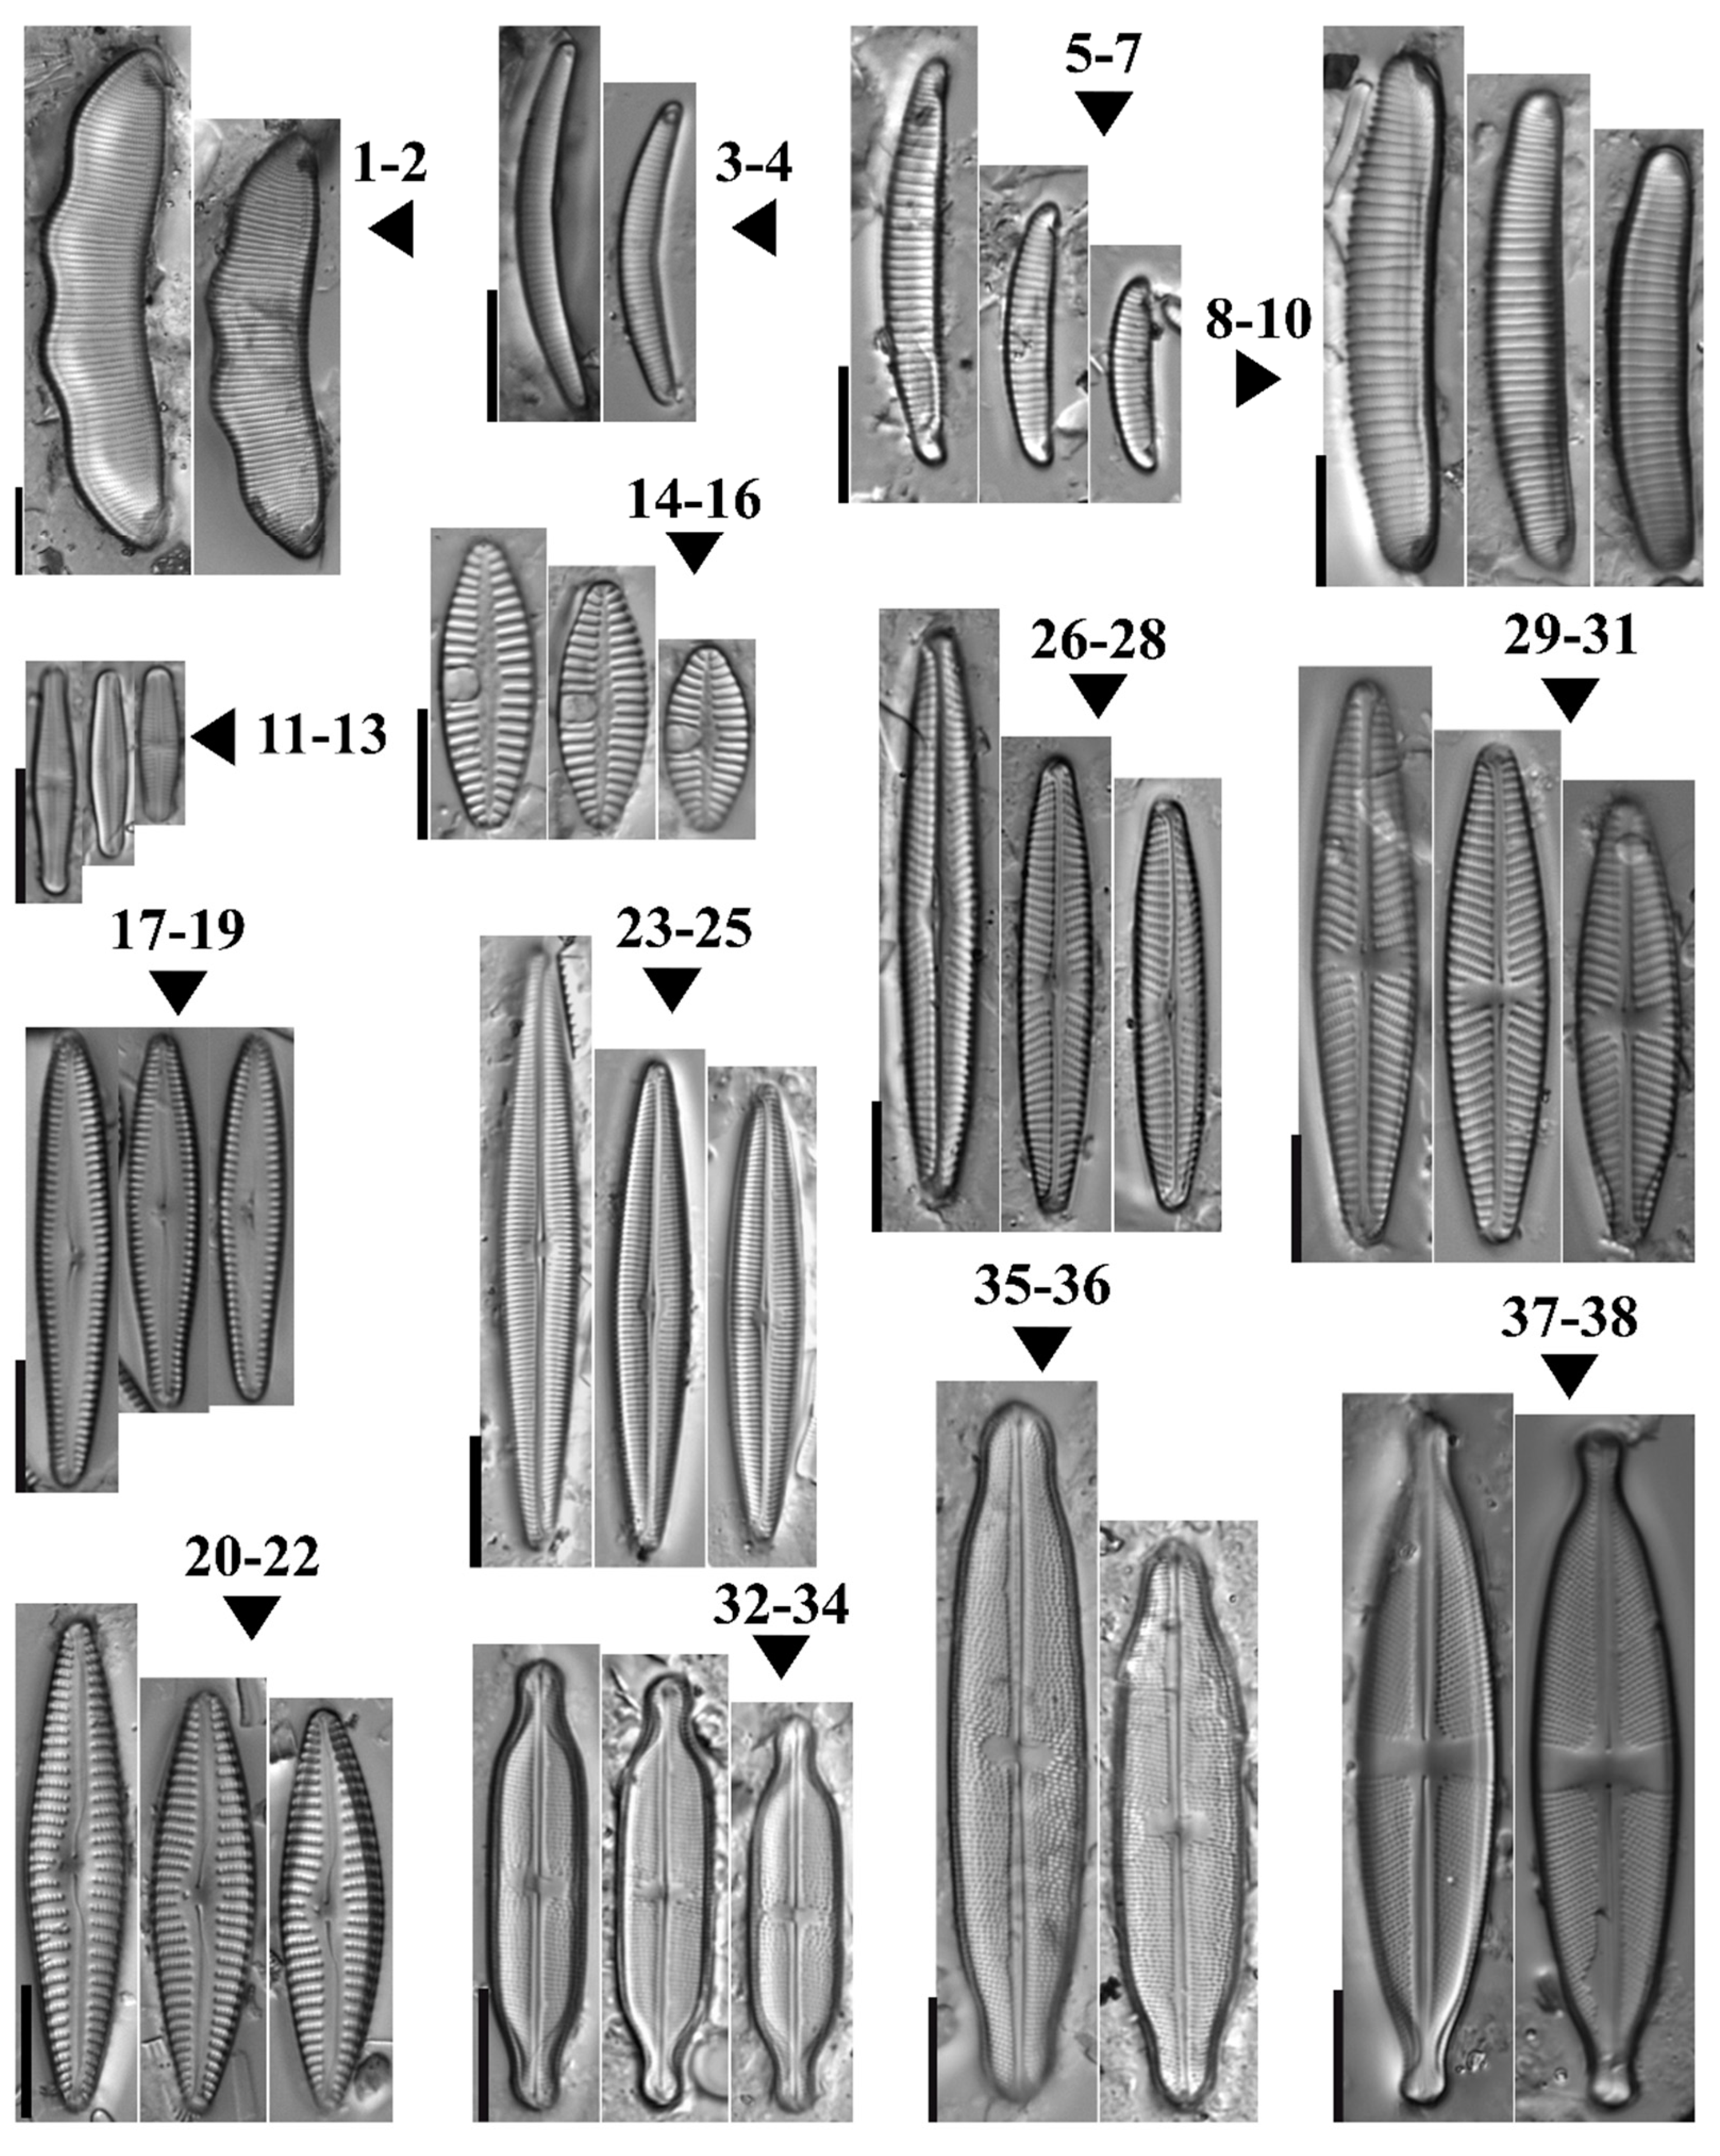
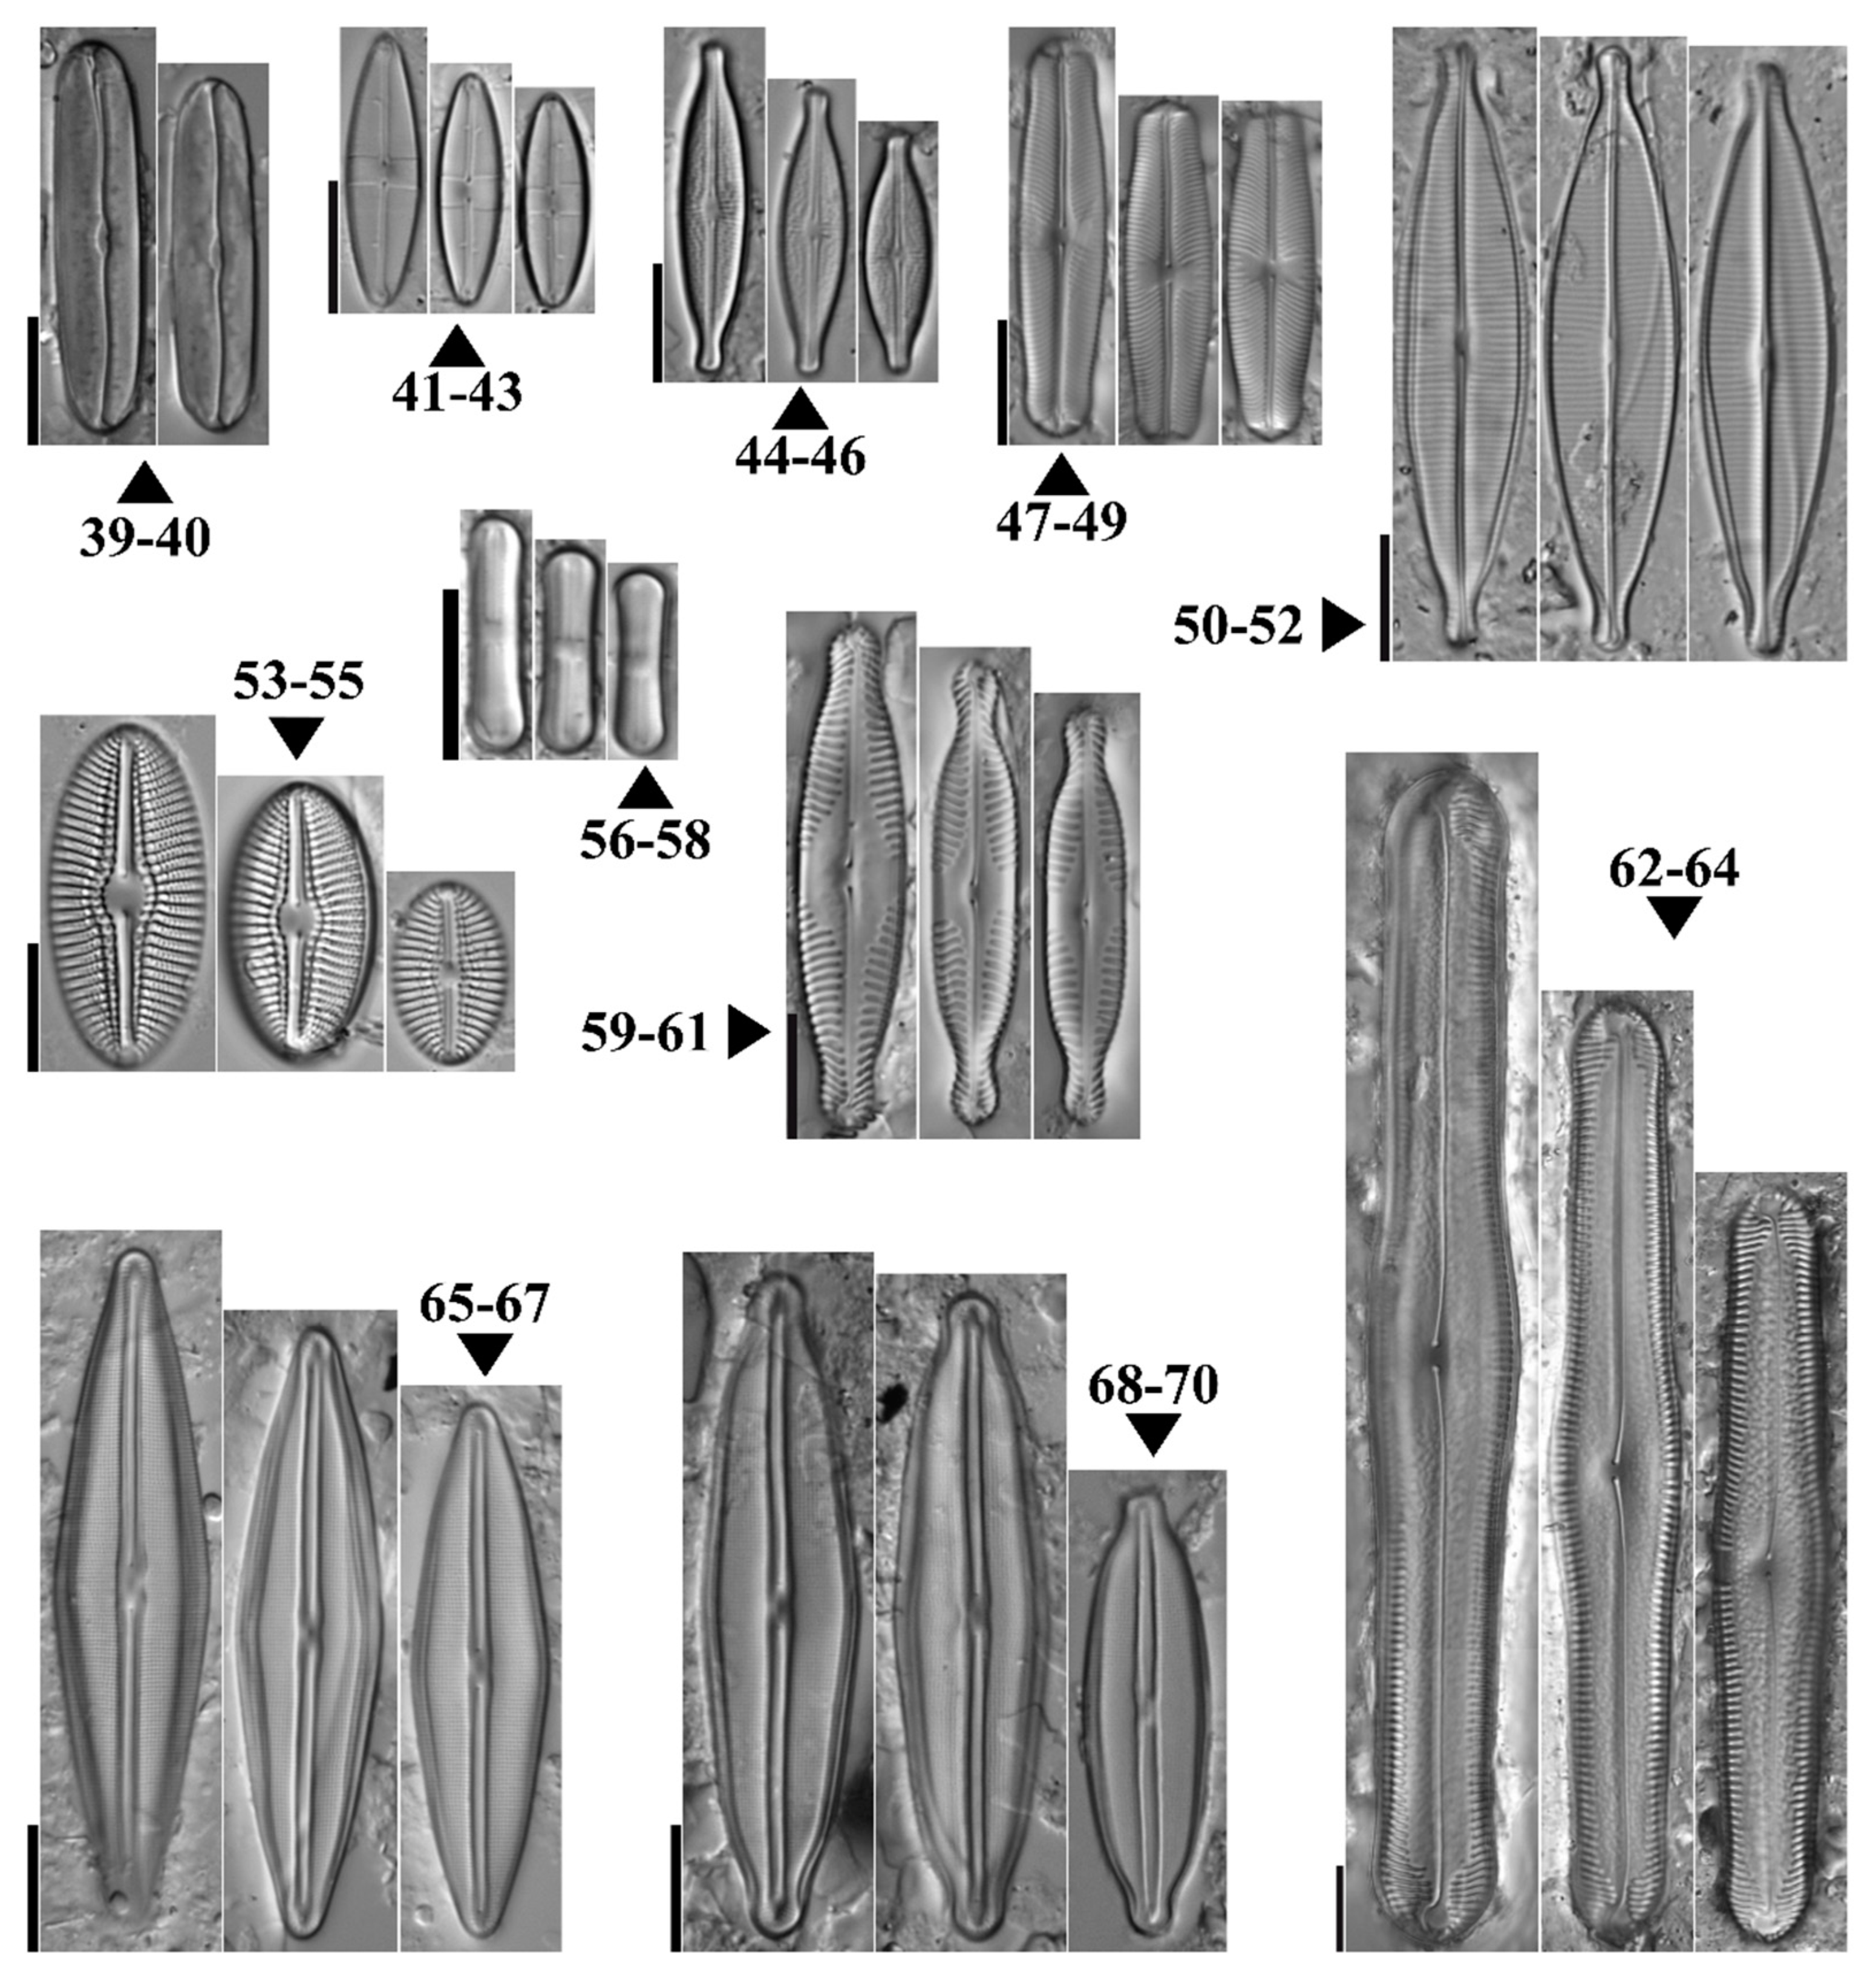
3.2. Species Composition and Diversity
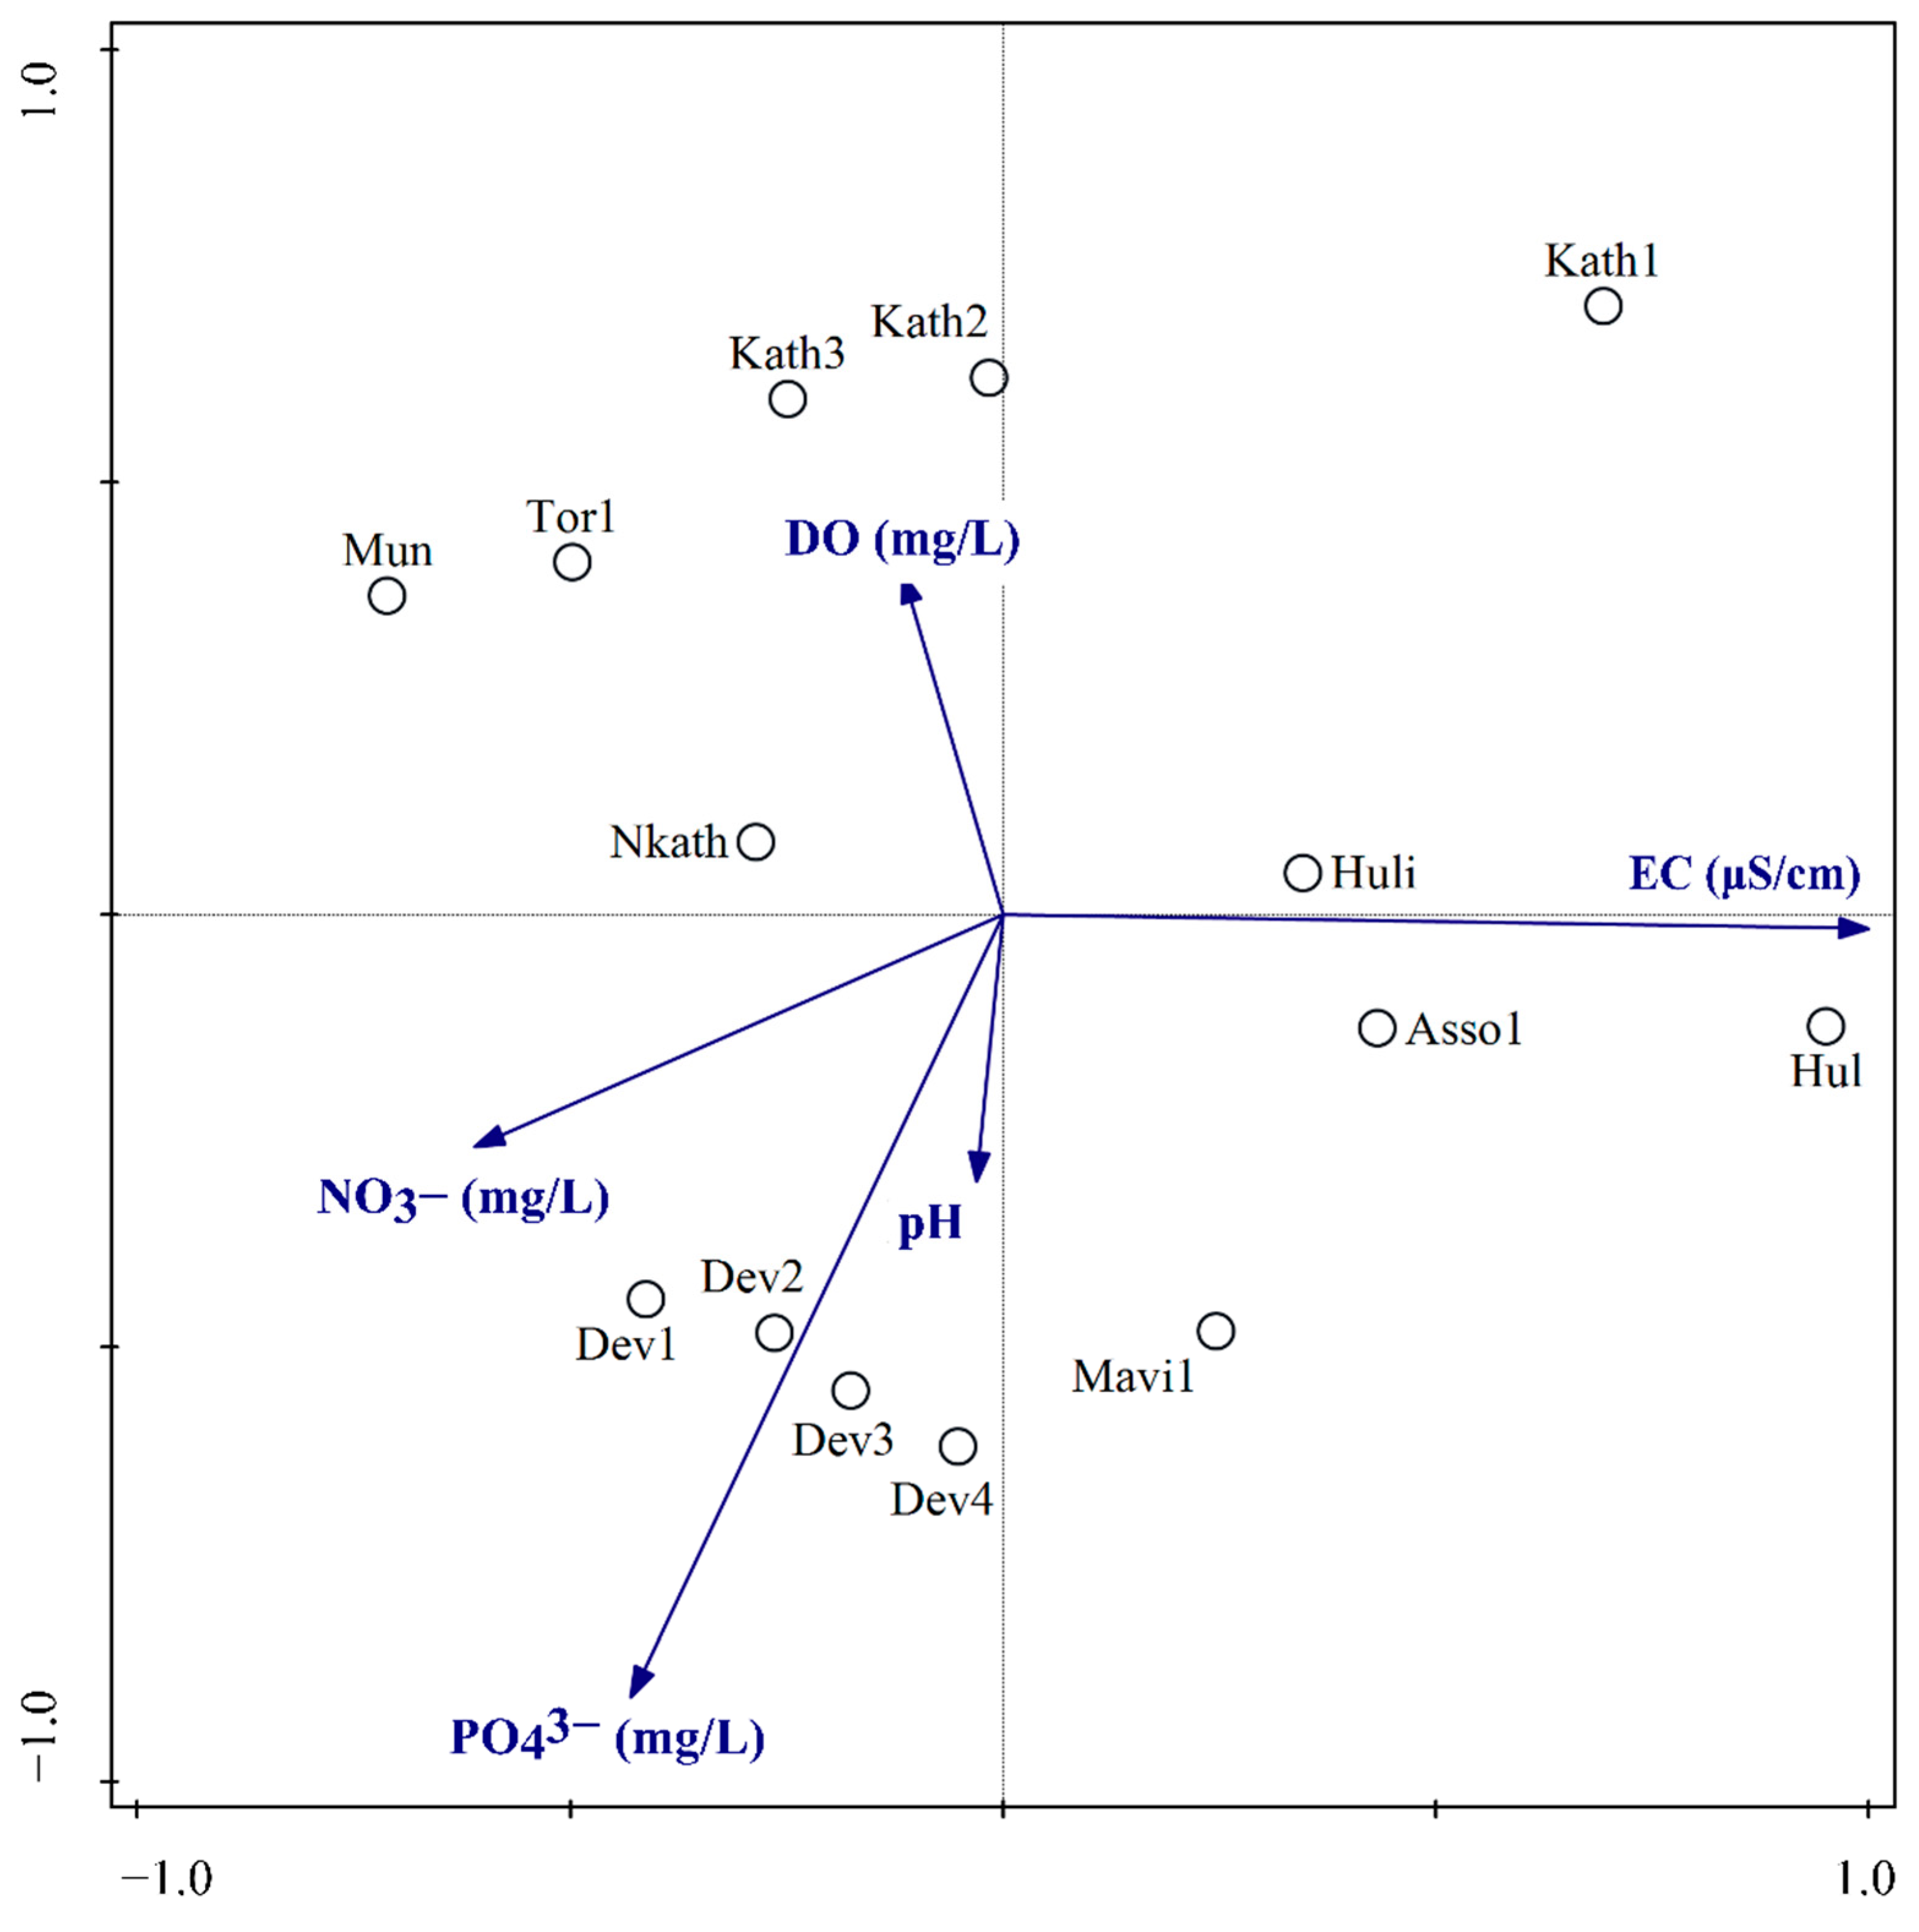
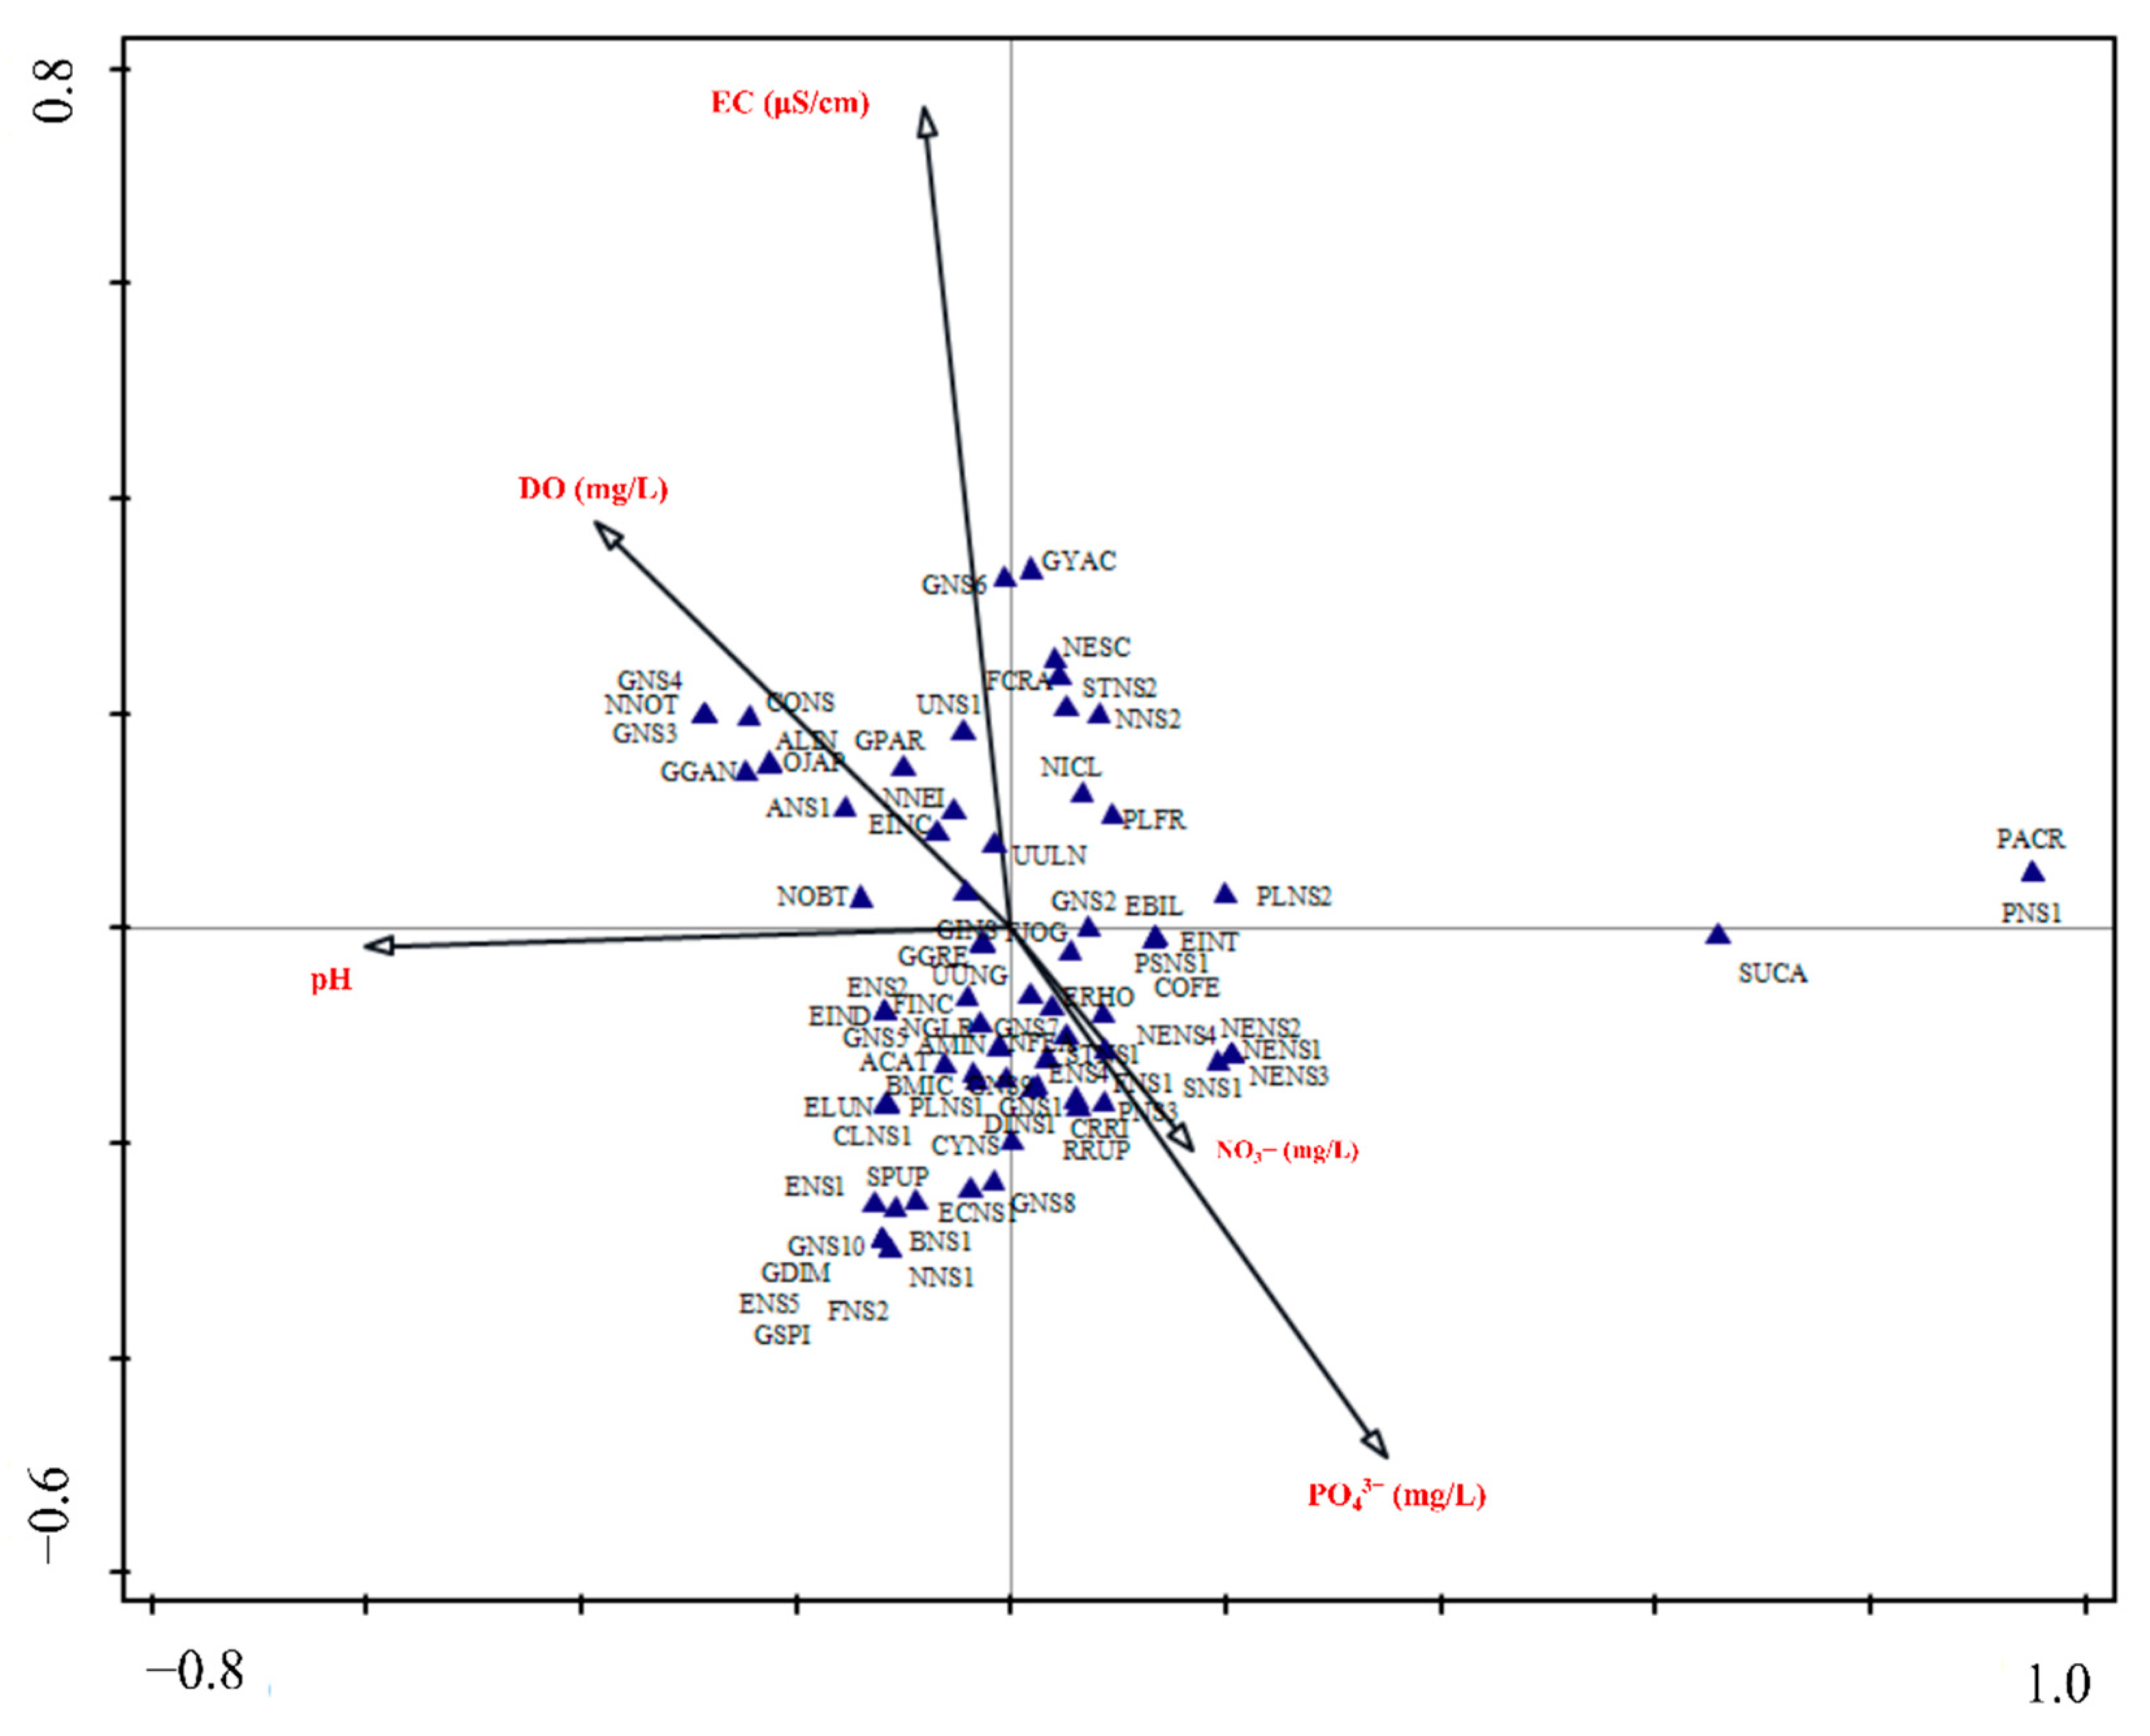
3.3. Relationship of Diatom Assemblages to Environmental Variables
4. Discussion
4.1. Water Quality
4.2. Diatom Community Composition, Diversity, and Distribution
4.3. Diatom Distribution in Relation to Environmental Variables
5. Conclusions
Supplementary Materials
Author Contributions
Funding
Institutional Review Board Statement
Informed Consent Statement
Acknowledgments
Conflicts of Interest
References
- Ramsar, C. The List of Wetlands of International Importance; RAMSAR Secretariat: Gland, Switzerland, 2013. [Google Scholar]
- Rao, R.R. Biodiversity in India: Floristic Aspects; Bishen Singh Mahendra Pal Singh: Delhi, India, 1994. [Google Scholar]
- Krishnamoorthy, K. Myristica Swamps in the evergreen forests of Travancore. Indian For. 1960, 86, 314–315. [Google Scholar]
- Ranganathan, P.; Ravikanth, G.; Aravind, N.A. A review of research and conservation of Myristica swamps, a threatened freshwater swamp of the Western Ghats, India. Wetl. Ecol. Manag. 2021, 30, 171–189. [Google Scholar] [CrossRef]
- Myers, N.; Mittermeier, R.A.; Mittermeier, C.G.; da Fonesca, G.A.B.; Kent, J. Biodiversity hotspots for conservation priorities. Nature 2000, 403, 853–858. [Google Scholar] [CrossRef] [PubMed]
- Ganesan, R. Evergreen Forest swamps and their plant species diversity in Kalakad-Mundanthurai Tiger Reserve, South Western Ghats, India. Indian For. 2002, 128, 1351–1359. [Google Scholar]
- Pushpakaran, B.; Gopalan, R. Study on seasonally waterlogged grasslands of Mudumalai Tiger Reserve. Int. J. Sci. Res. Publ. 2013, 3, 1–6. [Google Scholar]
- Bassi, N.; Kumar, M.D.; Sharma, A.; Pardha-Saradhi, P. Status of wetlands in India: A review of extent, ecosystem benefits, threats and management strategies. J. Hydrol. Reg. 2014, 2, 1–19. [Google Scholar] [CrossRef] [Green Version]
- Chandran, M.D.S.; Mesta, D.K. On the conservation of the Myristica swamps of the Western Ghats. In Forest Genetic Resources: Status and Conservation Strategies; Uma Shaanker, R., Ganeshaiah, K.N., Bawa, K.S., Eds.; Oxford & IBH Publications Co: New Delhi, India, 2001; pp. 1–19. [Google Scholar]
- Nair, P.V.; Ramachandran, K.K.; Swarupanandan, K.; Thomas, T.P. Mapping Biodiversity of the Myristica Swamps in Southern Kerala; Research Report No. 326; Kerala Forest Research Institute: Thrissur, India, 2007; p. 255. [Google Scholar]
- Santhakumaran, L.N.; Singh, A.; Thomas, V.T. Description of a sacred grove in Goa (India), with notes on the unusual aerial roots produced by its vegetation. Wood 1995, Oct–Dec, 24–28. [Google Scholar]
- Sreedharan, G.; Indulkar, M. New distributional record of the northernmost Myristica swamp from the Western Ghats of Maharashtra. Curr. Sci. 2018, 115, 1434. [Google Scholar]
- Chandran, M.D.S.; Mesta, D.K.; Naik, M.B. Inventorying and Conservation of the Myristica Swamps of Uttara Kannad; Report; Research and Training Institute: Bangalore, India, 1999. [Google Scholar]
- Bhat, P.R.; Kaveriappa, K.M. Ecological studies on Myristica swamp forests of Uttara Kannada, Karnataka, India. Trop. Ecol. 2009, 50, 329–337. [Google Scholar]
- Varghese, A.V.; Kumar, B.M. Ecological observations in the freshwater swamp forests of southern Kerala, India. J. Trop. For. Sci. 1997, 9, 299–314. [Google Scholar]
- Chandran, S.; Mesta, D.K.; Ali, S.; Gururaja, K.V.; Rao, G.R.; Ramachandra, T.V. Discovery of two critically endangered tree species and issues related to relic forests of the Western Ghats. Open Conserv. Biol. J. 2008, 2, 1–8. [Google Scholar] [CrossRef]
- Roby, T.J.; Jose, J.; Nair, P.V. Checklist of Flora of Myristica swamps—A critically endangered freshwater ecosystem of Southern Western Ghats of Kerala India. Ind. For. 2014, 140, 608–616. [Google Scholar]
- Gururaja, K.V.; Aravind, N.A.; Ali, S.; Ramachandra, T.V.; Velavan, T.P.; Krishnakumar, V.; Aggarwal, R. A new frog species from the central Western Ghats of India, and its phylogenetic position. Zool. Sci. 2007, 24, 525–534. [Google Scholar] [CrossRef]
- Latha, K.D.; Raj, K.A.; Manimohan, P. Laccaria violaceotincta: A new species from tropical India based on morphology and molecular phylogeny. Phytotaxa 2019, 392, 140–146. [Google Scholar] [CrossRef]
- Sujitha, P.C.; Prasad, G.; Sadasivan, K. Butterflies of the Myristica swamp forests of Shendurney Wildlife Sanctuary in the southern Western Ghats, Kerala, India. J. Threat. Taxa 2019, 11, 13320–13333. [Google Scholar] [CrossRef]
- Thacker, M.; Roy, S.; Kociolek, J.P.; Lowe, R.L.; Karthick, B. A new species of Germainiella (Bacillariophyta) from the Myristica swamps of the Western Ghats, India. Diatom Res. 2019, 34, 181–191. [Google Scholar] [CrossRef]
- Tambat, B.; Chaithra, G.N.; Reddy, K.V.V.; Vasudeva, R.; Ganeshaiah, K.N.; Shaanker, R.U. Threat assessment of Myristica swamps in central Western Ghats. Int. J. For. Usufructs Manag. 2012, 13, 3–12. [Google Scholar]
- Kumaran, K.P.N.; Limaye, R.B.; Punekar, S.A.; Rajaguru, S.N.; Joshi, S.V.; Karlekar, S.N. Vegetation response to South Asian Monsoon variations in Konkan, western India during the Late Quaternary: Evidence from fluvio-lacustrine archives. Quat. Int. 2013, 286, 3–18. [Google Scholar] [CrossRef]
- Srivastava, G.; Trivedi, A.; Mehrotra, R.C.; Paudayal, K.N.; Limaye, R.B.; Kumaran, K.P.N.; Yadav, S.K. Monsoon variability over Peninsular India during Late Pleistocene: Signatures of vegetation shift recorded in terrestrial archive from the corridors of Western Ghats. Palaeogeogr. Palaeoclimatol. Palaeoecol. 2016, 443, 57–65. [Google Scholar] [CrossRef]
- Li, L.; Zheng, B.; Liu, L. Biomonitoring and bioindicators used for river ecosystems: Definitions, approaches and trends. Procedia Environ. Sci. 2010, 2, 1510–1524. [Google Scholar] [CrossRef] [Green Version]
- Dalu, T.; Froneman, P.W. Diatom-based water quality monitoring in southern Africa: Challenges and future prospects. Water SA 2016, 42, 551–559. [Google Scholar] [CrossRef] [Green Version]
- Kock, A.; Taylor, J.C.; Malherbe, W. Diatom community structure and relationship with water quality in Lake Sibaya, KwaZulu-Natal, South Africa. S. Afr. J. Bot. 2019, 123, 161–169. [Google Scholar] [CrossRef]
- Battarbee, R.W.; Jones, V.J.; Flower, R.J.; Cameron, N.G.; Bennion, H.; Carvalho, L.; Juggins, S. Diatoms. In Tracking Environmental Change Using Lake Sediments: Developments in Paleoenvironmental Research; Smol, J.P., Birks, H.J.B., Last, W.M., Bradley, R.S., Alverson, K., Eds.; Springer: Dordrecht, The Netherlands, 2002; Volume 3, pp. 155–202. [Google Scholar] [CrossRef]
- Stevenson, R.J.; Pan, Y.; van Dam, H. Assessing environmental conditions in rivers and streams with diatoms. In The Diatoms: Applications for the Environmental and Earth Sciences; Smol, J.P., Stoermer, E.F., Eds.; Cambridge University Press: Cambridge, UK, 2010; pp. 57–85. [Google Scholar]
- Dixit, S.S.; Smol, J.P.; Kingston, J.C.; Charles, D.F. Diatoms: Powerful indicators of environmental change. Environ. Sci. Technol. 1992, 26, 22–33. [Google Scholar] [CrossRef]
- Dalu, T.; Wasserman, R.J.; Magoro, M.L.; Mwedzi, T.; Froneman, P.W.; Weyl, O.L. Variation partitioning of benthic diatom community matrices: Effects of multiple variables on benthic diatom communities in an Austral temperate river system. Sci. Total Environ. 2017, 601, 73–82. [Google Scholar] [CrossRef]
- Hamilton, P.B.; Hutchinson, S.J.; Patterson, R.T.; Galloway, J.M.; Nasser, N.A.; Spence, C.; Palmer, M.J.; Falck, H. Late-Holocene diatom community response to climate driven chemical changes in a small, subarctic lake, Northwest Territories, Canada. Holocene 2021, 31, 1124–1137. [Google Scholar] [CrossRef]
- Battarbee, R.W.; Donald, F.; Charles, C.B.; Cumming, B.F.; Renberg, I. Diatoms as indicators of surface-water acidity. In The Diatoms: Applications for the Environmental and Earth Sciences, 2nd ed.; Smol, J.P., Stoermer, E.F., Eds.; Cambridge University Press: Cambridge, UK, 2010; pp. 98–121. [Google Scholar]
- Birks, H.J.B.; Simpson, G.L. ‘Diatoms and pH reconstruction’ (1990) revisited. J. Paleolimnol. 2013, 49, 363–371. [Google Scholar] [CrossRef]
- Water Environment Federation; American Public Health Association (APHA). Standard Methods for the Examination of Water and Wastewater, 21st ed.; American Public Health Association (APHA): Washington, DC, USA, 2005. [Google Scholar]
- Hach, C.C. Phosphorus, Reactive, Amino Acid Method Manual, 9th ed.; Hach Co.: Loveland, CO, USA, 2014; p. 6. [Google Scholar]
- Hach, C.C. Nitrate, Cadmium Reduction Method Manual, 11th ed.; Hach Co.: Loveland, CO, USA, 2019; p. 7. [Google Scholar]
- Karthick, B.; Taylor, J.C.; Mahesh, M.K.; Ramachandra, T.V. Protocols for collection, preservation and enumeration of diatoms from Aquatic habitats for water quality monitoring in India. IUP J. Soil Water Sci. 2010, 3, 25–60. [Google Scholar]
- The GIMP Team. University of California, Berkeley, 1997–2021. Available online: https://www.gimp.org/ (accessed on 20 November 2021).
- Harrington, B.; Gould, T.; Hurst, N.; Mentalgu, Y. Inkscape 2004–2005. Available online: https://www.inkscape.org/ (accessed on 28 April 2020).
- Krammer, K.; Lange-Bertalot, H. Bacillariophyceae 1. Teil: Naviculaceae. In Süßwasserflora von Mitteleuropa; Ettl, H., Gerloff, J., Heynig, H., Mollenhauer, D., Eds.; Gustav Fischer Verlag: Stuttgart, Germany, 1986; p. 876. [Google Scholar]
- Krammer, K.; Lange-Bertalot, H. Bacillariophyceae 2. Teil: Bacillariaceae, Epithemiaceae, Surirellaceae. In Süßwasserflora von Mitteleuropa; Ettl, H., Gerloff, J., Heynig, H., Mollenhauer, D., Eds.; Gustav Fischer Verlag: Stuttgart, Germany, 1988; p. 596. [Google Scholar]
- Krammer, K.; Lange-Bertalot, H. Bacillariophyceae 3. Teil: Centrales Fragilariaceae, Eunotiaceae. In Die Süßwasserflora von Mitteleuropa; Ettl, H., Gerloff, J., Heynig, H., Mollenhauer, D., Eds.; Gustav Fischer Verlag: Stuttgart, Germany, 1991; p. 576. [Google Scholar]
- Krammer, K.; Lange-Bertalot, H. Bacillariophyceae 4. Teil: Achnanthaceae. Kritische Erga¨nzungen zu Navicula (Lineolatae) und Gomphonema. Gesamtliteraturverzeichnis Teil 1–4. In Süßwasserflora von Mitteleuropa; Ettl, H., Gerloff, J., Heynig, H., Mollenhauer, D., Eds.; Gustav Fischer Verlag: Stuttgart, Germany, 1991; p. 437. [Google Scholar]
- Krammer, K. Diatoms of Europe: Diatoms of the European Inland Waters and Comparable Habitats, The Genus Pinnularia; Ruggell Koeltz Scientific Books: Konigstein, Germany, 2000; Volume 1, p. 703. [Google Scholar]
- Lange-Bertalot, H. Diatoms of Europe: Diatoms of the European Inland Waters and Comparable Habitats, Navicula Sensu Stricto; 10 Genera Separated from Navicula Sensu Lato Frustulia; Ruggell Koeltz Scientific Books: Konigstein, Germany, 2001; Volume 2, p. 526. [Google Scholar]
- Lange-Bertalot, H.; Hofmann, G.; Werum, M.; Cantonati, M.; Kelly, M.G. Freshwater Benthic Diatoms of Central Europe: Over 800 Common Species Used in Ecological Assessment; English Edition with Updated Taxonomy and Added Species; Koeltz Botanical Books: Glashütten, Germany, 2017; pp. 1–942. [Google Scholar]
- Karthick, B.; Kociolek, J.P.; Mahesh, M.K.; Ramachandra, T.V. The diatom genus Gomphonema Ehrenberg in India: Checklist and description of three new species. Nova Hedwig. 2011, 93, 211. [Google Scholar] [CrossRef]
- Karthick, B.; Hamilton, P.B.; Kociolek, J.P. An Illustrated Guide to Common Diatoms of Peninsular India; Gubbi Labs: Gubbi, India, 2013; p. 206. [Google Scholar]
- Karthick, B.; Taylor, J.C.; Hamilton, P.B. Two new species of Achnanthidium Kützing (Bacillariophyceae) from Kolli Hills, Eastern Ghats, India. Fottea 2017, 17, 65–77. [Google Scholar] [CrossRef] [Green Version]
- Jüttner, I.; Cox, E.J.; Ormerod, S.J. New or poorly known diatoms from Himalayan streams. Diatom Res. 2000, 15, 237–262. [Google Scholar] [CrossRef]
- Taylor, J.C.; Harding, W.R.; Archibald, C.G.M. An Illustrated Guide to Some Common Diatom Species from South Africa; WRC Report No. TT282/07; Water Research Commission: Pretoria, South Africa, 2007. [Google Scholar]
- Taylor, J.C.; Cocquyt, C.; Mayama, S. Navicula nielsfogedii JC Taylor & Cocquyt sp. nov., a new diatom (Bacillariophyta) from tropical and sub-tropical Africa. Fottea 2016, 16, 201–208. [Google Scholar] [CrossRef] [Green Version]
- Chudaev, D.A.; Glushchenko, A.M.; Blagoveshchenskaya, E.Y.; Karthick, B.; Kulikovskiy, M.S. Morphology and taxonomy of Navicula escambia and N. simulata (Bacillariophyceae). Nova Hedwig. 2018, 147, 43–57. [Google Scholar] [CrossRef] [PubMed]
- Bishop, I.W.; Esposito, R.M.; Tyree, M.; Spaulding, S.A. A diatom voucher flora from selected southeast rivers (USA). Phytotaxa 2017, 332, 101–140. [Google Scholar] [CrossRef] [Green Version]
- Kociolek, J.P.; Balasubramanian, K.; Blanco, S.; Coste, M.; Ector, L.; Liu, Y.; Kulikovskiy, M.; Lundholm, N.; Ludwig, T.; Potapova, M.; et al. DiatomBase. Available online: https://www.diatombase.org (accessed on 30 December 2020).
- Hammer, Ø.; Harper, D.A.T.; Ryan, P.D. Past: Paleontological statistics software package for education and data analysis. Palaeontol. Electron. 2001, 4, 9. [Google Scholar]
- Ter Braak, C.J.F.; Šmilauer, P. Canoco Reference Manual and User’s Guide: Software for Ordination; Version 5.0; Microcomputer Power: Ithaca, NY, USA, 2012; p. 496. [Google Scholar]
- Gauch, H.G. Multivariate Analysis in Community Ecology; Cambridge University Press: Cambridge, UK, 1982. [Google Scholar]
- Benito, X.; Fritz, S.C.; Steinitz-Kannan, M.; Tapia, P.M.; Kelly, M.A.; Lowell, T.V. Geo-climatic factors drive diatom community distribution in tropical South American freshwaters. J. Ecol. 2018, 106, 1660–1672. [Google Scholar] [CrossRef]
- Passy, S.I. Framework for community functioning: Synthesis of stress gradient and resource partitioning concepts. PeerJ 2017, 5, e3885. [Google Scholar] [CrossRef]
- Mann, D.G. The species concept in diatoms. Phycologia 1999, 38, 437–495. [Google Scholar] [CrossRef] [Green Version]
- Aguilera, A.; Manrubia, S.C.; Gómez, F.; Rodríguez, N.; Amils, R. Eukaryotic community distribution and its relationship to water physicochemical parameters in an extreme acidic environment, Rio Tinto (southwestern Spain). Appl. Environ. Microbiol. 2006, 72, 5325–5330. [Google Scholar] [CrossRef] [Green Version]
- Potapova, M.; Charles, D.F. Distribution of benthic diatoms in U.S. rivers in relation to conductivity and ionic composition. Freshw. Biol. 2003, 48, 1311–1328. [Google Scholar] [CrossRef] [Green Version]
- Smol, J.P.; Wolfe, A.P.; Birks, H.J.B.; Douglas, M.S.V.; Jones, V.J.; Korhola, A.; Pienitz, R.; Ruhland, K.; Sorvari, S.; Antoniades, D.; et al. Climate-driven regime shifts in the biological communities of arctic lakes. Proc. Natl. Acad. Sci. USA 2005, 102, 4397–4402. [Google Scholar] [CrossRef] [Green Version]
- Shibabaw, T.; Beyene, A.; Awoke, A.; Tirfie, M.; Azage, M.; Triest, L. Diatom community structure in relation to environmental factors in human influenced rivers and streams in tropical Africa. PLoS ONE 2021, 16, e0246043. [Google Scholar] [CrossRef]
- Vijayakumar, P.K.; Vasudeva, R. Characterization of soil properties from freshwater swamps and adjoining evergreen forest area. Karnataka J. Agric. Sci. 2011, 24, 601–602. [Google Scholar]
- Johnson, P.; Gerbeaux, P. Wetland Types in New Zealand; Department of Conservation and Ministry for the Environment: Wellington, New Zaeland, 2004. [Google Scholar]
- Hajkova, P.; Bojková, J.; Frankova, M.; Opravilová, V.; Hajek, M.; Kintrová, K.; Horsak, M. Disentangling the effects of water chemistry and substratum structure on moss-dwelling unicellular and multicellular micro-organisms in spring-fens. J. Limnol. 2011, 70, 54. [Google Scholar] [CrossRef] [Green Version]
- Raghu, H.B.; Vasudeva, R.; Nagesha, G.K.; Krishna, H.C.; Hombegowda, H.C. Dasappa and Boby, VU, 2006, Chemical properties of soils from freshwater swamps of Uttara Kannada. Mysore J. Agric. Sci. 2006, 40, 367–370. [Google Scholar]
- Chen, X.; Bu, Z.; Stevenson, M.A.; Cao, Y.; Zeng, L.; Qin, B. Variations in diatom communities at genus and species levels in peatlands (central China) linked to microhabitats and environmental factors. Sci. Total Environ. 2016, 568, 137–146. [Google Scholar] [CrossRef]
- Poulíčková, A.; Hájková, P.; Kintrová, K.; Bat’ková, R.; Czudková, M.; Hájek, M. Tracing decadal environmental change in ombrotrophic bogs using diatoms from herbarium collections and transfer functions. Environ. Pollut. 2013, 179, 201–209. [Google Scholar] [CrossRef]
- Humphries, M.S.; Benitez-Nelson, C.R. Recent trends in sediment and nutrient accumulation rates in coastal, freshwater Lake Sibaya, South Africa. Mar. Freshw. Res. 2013, 64, 1087–1099. [Google Scholar] [CrossRef]
- Reddy, K.R.; Wetzel, R.G.; Kadlec, R.H. Biogeochemistry of phosphorus in wetlands. In Phosphorus: Agriculture and the Environment; Sims, J.T., Sharpley, A.N., Eds.; Soil Science Society of America: Madison, WI, USA, 2005; Volume 46, pp. 263–316. [Google Scholar] [CrossRef] [Green Version]
- Kim, Y.; Suk Choi, J.; Sin Kim, H. Epiphytic diatom communities from two mountain bogs in South Korea. Nova Hedwig. 2007, 84, 363–379. [Google Scholar] [CrossRef]
- Lange-Bertalot, H.; Bąk, M.; Witkowski, A. Eunotia and some related genera. In Diatoms of Europe—Diatoms of the European Inland Water and Comparable Habitats; Lange-Bertalot, H., Ed.; A.R.G. Gantner: Ruggell, Liechtenstein, 2011; Volume 6, pp. 1–747. [Google Scholar]
- Van de Vijver, B.; Schuster, T.M.; Kusber, W.-H.; Hamilton, P.B.; Wetzel, C.E.; Ector, L. Revision of European Brachysira species (Brachysiraceae, Bacillariophyta): I. The Brachysira microcephala—B. neoexilis enigma. Bot. Lett. 2021, 168, 467–484. [Google Scholar] [CrossRef]
- Van Dam, H.; Mertens, A.; Sinkeldam, J. A coded checklist and ecological indicator values of freshwater diatoms from The Netherlands. Neth. J. Aquat. Ecol. 1994, 28, 117–133. [Google Scholar] [CrossRef]
- Watanabe, T.; Ohtsuka, T.; Tuji, A.; Houki, A. Picture Book and Ecology of the Freshwater Diatoms; Uchida Rokakuho Publishing Company: Tokyo, Japan, 2005; p. 666. [Google Scholar]
- Potapova, M.; Charles, D.F. Diatom metrics for monitoring eutrophication in rivers of the United States. Ecol. Indic. 2007, 7, 48–70. [Google Scholar] [CrossRef]
- Hargan, K.E.; Rühland, K.M.; Paterson, A.M.; Finkelstein, S.A.; Holmquist, J.R.; MacDonald, G.M.; Keller, W.; Smol, J.P. The influence of water-table depth and pH on the spatial distribution of diatom species in peatlands of the Boreal Shield and Hudson Plains, Canada. Botany 2015, 93, 57–74. [Google Scholar] [CrossRef]
- Cantonati, M.; Lange-Bertalot, H. Diatom monitors of close-to-pristine, very-low alkalinity habitats: Three new Eunotia species from springs in Nature Parks of the southeastern Alps. J. Limnol. 2011, 70, 209–221. [Google Scholar] [CrossRef]
- Chen, X.; Zhou, W.; Pickett, S.T.; Li, W.; Han, L.; Ren, Y. Diatoms are better indicators of urban stream conditions: A case study in Beijing, China. Ecol. Indic. 2016, 60, 265–274. [Google Scholar] [CrossRef]
- Fox, J.F. Intermediate-disturbance hypothesis. Science 1979, 204, 1344–1345. [Google Scholar] [CrossRef] [Green Version]
- Chandran, M.D.S.; Rao, G.R.; Gururaja, K.V.; Ramachandra, T.V. Ecology of the swampy relic forests of Kathalekan from central Western Ghats, India. Bioremediat. Biodivers. Bioavailab. 2010, 4, 54–68. [Google Scholar]
- Ramachandra, T.V.; Setturu, B.; Chandran, M.D.S. Geospatial analysis of forest fragmentation in Uttara Kannada District, India. For. Ecosyst. 2016, 3, 10. [Google Scholar] [CrossRef] [Green Version]
- Raghu, H.B. Reproductive Biology and Conservation of Semecarpus kathalekanensis: A Threatened Swamp Species of the Central Western Ghats. Master’s Thesis, University of Agricultural Sciences, Dharwad, India, 2000. [Google Scholar]
- Triest, L.; Lung’ayia, H.; Ndiritu, G.; Beyene, A. Epilithic diatoms as indicators in tropical African rivers (Lake Victoria catchment). Hydrobiologia 2012, 695, 343–360. [Google Scholar] [CrossRef]
- Kilham, P.; Kilham, S.S.; Hecky, R.E. Hypothesized resource relationships among African planktonic diatoms. Limnol. Oceanogr. 1986, 31, 1169–1181. [Google Scholar] [CrossRef] [Green Version]


| No | Swamp | Latitude (°N) | Longitude (° E) | Altitude (m a.s.l.) |
|---|---|---|---|---|
| 1 | Devikan swamp | 14.65034 | 74.57084 | 451 |
| 2 | Assoli swamp—1 | 14.65902 | 74.57178 | 419 |
| 3 | Assoli swamp—2 | 14.66012 | 74.57059 | 446 |
| 4 | Balajetty swamp | 14.66122 | 74.56786 | 395 |
| 5 | Hudidevarakudlu swamp | 14.3969 | 74.6595 | 396 |
| 6 | Torme swamp—1 | 14.2773 | 74.76942 | 617 |
| 7 | Torme swamp—2 | 14.27856 | 74.76717 | 588 |
| 8 | Mundigethagu swamp | 14.27709 | 74.78032 | 608 |
| 9 | Nagodi swamp | 13.91614 | 74.88213 | 557 |
| 10 | Hulikal swamp | 13.71799 | 74.99848 | 571 |
| 11 | Kathlekan swamp—1 | 14.27424 | 74.74807 | 556 |
| 12 | Kathlekan swamp—2 | 14.27284 | 74.74468 | 540 |
| 13 | Kathlekan swamp—3 | 14.27404 | 74.74564 | 562 |
| 14 | Malemane swamp | 14.28221 | 74.72691 | 530 |
| 15 | New Kathlekan swamp | 14.27064 | 74.7514 | 543 |
| 16 | Mavingundi swamp—1 | 14.25621 | 74.80658 | 623 |
| 17 | Mavingundi swamp—2 | 14.25646 | 74.80669 | 599 |
| No. | Swamp | pH | EC (µS/cm) | DO (mg/L) | T (°C) | NO3− (mg/L) | PO43− (mg/L) | TDS (mg/L) |
|---|---|---|---|---|---|---|---|---|
| 1 | Devikan swamp Site—1 | 7.45 | 35.50 | 6.65 | 25.7 | 0.02 | 3.95 | 16.61 |
| 2 | Devikan swamp site—2 | 6.12 | 42.10 | 6.65 | 25.7 | 0.02 | 3.95 | 19.7 |
| 3 | Devikan swamp site—3 | 7.48 | 52.50 | 6.65 | 25.7 | 0.02 | 3.95 | 19.7 |
| 4 | Devikan swamp site—4 | 7.2 | 46.30 | 6.65 | 25.7 | 0.02 | 3.95 | 21.7 |
| 5 | Devikan swamp site—5 | 6.40 | 45.30 | 5.98 | 24.4 | 0.02 | 2.95 | 21.04 |
| 6 | Assoli swamp—1 | 7.28 | 79.80 | 6.9 | 24.8 | 0.02 | 2.32 | 37.6 |
| 7 | Assoli swamp—2 | 7.21 | 77.50 | 7.06 | 25.2 | 0.01 | 3.41 | |
| 8 | Balajetty swamp | 7.01 | 168.80 | 6.24 | 25.8 | 80.1 | ||
| 9 | Hudidevarakudlu swamp | 7.24 | 74.30 | 7.63 | 24.9 | 0.01 | 2.08 | 34.9 |
| 10 | Torme swamp—1 | 7.15 | 31.50 | 7.28 | 22.9 | 0.02 | 2.14 | 14.71 |
| 11 | Torme swamp—2 | 6.86 | 30.00 | 6.99 | 22.4 | 0.01 | 2.29 | 14.01 |
| 12 | Mundigethagu swamp | 6.99 | 23.60 | 7.35 | 23 | 0.02 | 2.43 | 11 |
| 13 | Nagodi swamp | 7.36 | 40.70 | 7.24 | 28.4 | 0.01 | 0.85 | 19.08 |
| 14 | Hulikal swamp | 6.87 | 115.90 | 6.89 | 25.6 | 0.01 | 1.87 | 54.8 |
| 15 | Kathlekan swamp—1 | 6.79 | 96.20 | 6.98 | 21.2 | 0.01 | 0.8 | 45.3 |
| 16 | Kathlekan swamp—2 | 6.18 | 53.30 | 6.88 | 21.6 | 0.01 | 1.4 | 25 |
| 17 | Kathlekan swamp—3 | 6.71 | 42.00 | 7.05 | 23.8 | 0.02 | 1.6 | 19.68 |
| 18 | Malemane swamp | 6.83 | 201.00 | 8.74 | 24.2 | 0.01 | 0.3 | 95.6 |
| 19 | New Kathlekan swamp | 6.82 | 40.70 | 6.95 | 24.1 | 0.01 | 2.6 | 19.07 |
| 20 | Mavingundi swamp—1 | 6.67 | 68.80 | 7.04 | 23.7 | 0.01 | 3.33 | 32.4 |
| 21 | Mavingundi swamp—2 | 6.98 | 44.40 | 6.82 | 23.2 | 0.01 | 2.98 | 20.8 |
| Swamp | Microhabitat | Species Richness (s) | Pielou’s Evenness (J) | Shannon Index (H) | Simpson Diversity Index (1 − λ) |
|---|---|---|---|---|---|
| Devikan swamp site—1 | Epibryophytic | 17 | 0.54 | 2.22 | 0.85 |
| Devikan swamp site—2 | Epipsammic | 12 | 0.25 | 1.10 | 0.55 |
| Devikan swamp site—3 | Epipsammic | 14 | 0.48 | 1.91 | 0.78 |
| Devikan swamp site— | Epilithic | 18 | 0.54 | 2.28 | 0.86 |
| Devikan swamp site—4 | Epipsammic | 17 | 0.41 | 1.96 | 0.80 |
| Assoli swamp—1 | Epiphytic | 8 | 0.49 | 1.37 | 0.67 |
| Hudidevarakudlu swamp | Epipsammic | 14 | 0.75 | 2.36 | 0.89 |
| Torme swamp—1 | Epilithic | 10 | 0.44 | 1.49 | 0.63 |
| Mundigethagu swamp | Epilithic | 13 | 0.49 | 1.86 | 0.76 |
| Hulikal swamp site—1 | Epilithic | 13 | 0.48 | 1.84 | 0.80 |
| Hulikal swamp site—2 | Epilithic | 16 | 0.66 | 2.37 | 0.88 |
| Hulikal swamp site—3 | Epiphytic | 18 | 0.48 | 2.15 | 0.84 |
| Kathlekan swamp—1 | Epiphytic | 12 | 0.73 | 2.17 | 0.86 |
| Kathlekan swamp—2 | Epidendric | 14 | 0.73 | 2.32 | 0.88 |
| Kathlekan swamp—2 | Epiphytic | 15 | 0.58 | 2.16 | 0.84 |
| Kathlekan swamp—3 | Epiphytic | 18 | 0.73 | 2.58 | 0.90 |
| Malemane swamp | Epipsammic | 16 | 0.61 | 2.29 | 0.86 |
| New Kathlekan swamp site—1 | Epibryophytic | 23 | 0.72 | 2.80 | 0.91 |
| New Kathlekan swamp site—2 | Epiphytic | 21 | 0.72 | 2.72 | 0.91 |
| Mavingundi swamp—1 | Epilithic | 16 | 0.55 | 2.18 | 0.86 |
Publisher’s Note: MDPI stays neutral with regard to jurisdictional claims in published maps and institutional affiliations. |
© 2022 by the authors. Licensee MDPI, Basel, Switzerland. This article is an open access article distributed under the terms and conditions of the Creative Commons Attribution (CC BY) license (https://creativecommons.org/licenses/by/4.0/).
Share and Cite
Thacker, M.; Karthick, B. Response of Diatoms to the Changing Water Quality in the Myristica Swamps of the Western Ghats, India. Diversity 2022, 14, 202. https://doi.org/10.3390/d14030202
Thacker M, Karthick B. Response of Diatoms to the Changing Water Quality in the Myristica Swamps of the Western Ghats, India. Diversity. 2022; 14(3):202. https://doi.org/10.3390/d14030202
Chicago/Turabian StyleThacker, Mital, and Balasubramanian Karthick. 2022. "Response of Diatoms to the Changing Water Quality in the Myristica Swamps of the Western Ghats, India" Diversity 14, no. 3: 202. https://doi.org/10.3390/d14030202