Article

Current and Future Distribution Modeling of Socotra Cormorants Using MaxEnt

Department of Biology, United Arab Emirates University, Al Ain P.O. Box 15551, United Arab Emirates
*
Author to whom correspondence should be addressed.
Diversity 2022, 14(10), 840; https://doi.org/10.3390/d14100840
Submission received: 24 July 2022 / Revised: 28 September 2022 / Accepted: 4 October 2022 / Published: 6 October 2022
(This article belongs to the Special Issue Spatiotemporal Bird Distribution and Conservation)

Abstract

:
The Socotra Cormorant (Phalacrocorax nigrogularis) is a regionally endemic seabird that is vulnerable due to human disturbance and habitat degradation. This study aimed to predict the potential current and future marine distribution of the species under different climate change scenarios using environmental variables affecting distribution using MaxEnt. Occurrence data were collected over several years using satellite tagged adults in the Arabian Gulf. The current model showed large areas of high suitability, mainly in the Arabian Gulf and in the Red Sea, where 31,300 km2 or 48% of total highly suitable areas existed. These areas are currently not utilized by the species. The future model predicted a sharp decline in suitable areas with 73% loss under the SSP5-8.5 climate change scenario of 2050 (extreme scenario). Nevertheless, the Red Sea is predicted to still hold considerable moderately suitable areas. Suitable areas increased around the Socotra archipelago. The model did not include biological variables due to lack of fish distribution data. Two variables, namely, mixed layer thickness and sea floor depth, explained most of the species’ distribution. These variables significantly influence nutrient cycling and forage fish distribution patterns, which in turn influence seabird distributions. Thus, the model could be useful in predicting the distribution of Socotra cormorants. However, the model outcomes should be interpreted with caution as potential areas of future expansion of the species to be further tested and validated. Conserving these areas as a precaution might encourage the Socotra Cormorant to colonize the region and persist in the future under the most extreme climate change scenarios, given that small forage fish that are eaten by the species are abundant in the predicted areas outside of the Arabian Gulf.

1. Introduction

Seabirds are important components of marine ecosystems [1,2,3]. Climate change, the impact of invasive exotic species, incidental capture, overfishing, pollution, and hunting are important factors that currently threaten seabirds [2]. Although some of these threats have great direct and immediate effects on breeding and foraging seabirds [1,4,5], the consequences of climate change are also potentially high, with long-term shifts in spatial distribution or catastrophic declines in populations predicted for some seabird species [1,2]. Climate change can affect complete regions compared to the local impact of some of these other threats, adding to the cumulative pressure on seabirds, especially species that are endemic to small regions [4,5]. Whereas some of these threats have recognized and proven solutions, mitigation may have limited scope for the main impacts such as sea level rise and extreme rainfall (destruction of colonies), increased severe weather events, changing oceanographic processes, reduction in marine productivity near colonies, and increased infections and severity of avian diseases [2].
An overall climate warming is predicted for many regions of the earth under different conservative scenarios. Impacts of this warming could include reduction in the distribution range and changes in habitat suitability of multiple groups of terrestrial and marine organisms, including seabirds [2,4,6]. Shifts in seabird phenology were also reported due to impacts associated with climate warming [7], which is particularly alarming for seabirds with a limited range and declining populations [8,9,10]. Rising temperatures influence the productivity of phytoplankton, thus altering the fecundity and abundance of herbivorous zooplankton. Inevitably, the impacts of these changes reach pelagic fish, squid, and carnivorous zooplankton [4,9] and, in turn, could significantly impact the seabirds which largely feed on these species [4,5]. Previous studies on demographic dynamics of small populations of pelagic fish in upwelling ecosystems indicated that a collapse in such forage fish or zooplankton populations is often preceded by sharp decline in predatory seabird populations [4,9]. During the last 60 years, seabird populations have decreased by nearly 70% worldwide [1,2,11]. Obtaining adequate knowledge of seabird movement patterns and spatial distribution is increasingly important to conserve the marine environment they depend upon. The marine environment is highly dynamic, and species such as seabirds are challenging to study given their mobility and breeding cycles [12,13]. Various restricted range seabird species live within the productive upwelling zones. For example, seabirds in the southern Benguela ecosystem off South Africa, those off the coast of New Zealand, or those in shallow gulfs such as the Arabian (Persian) Gulf are especially vulnerable to such changes in oceanographic as well as trophic changes triggered by climate change [9,14,15]. Adaptable species such as Cape Gannets (Sula) can travel greater distances to forage in response to shifting prey distributions, therefore avoiding population declines [9]. Less adaptable species such as Cape Cormorants or African penguins, with restricted foraging ranges, are unable to alter their foraging patterns in relation to shifting prey distributions, thereby experiencing population crashes [9].
Socotra Cormorants are endemic to a restricted range extending from the Arabian Gulf and the Gulf of Oman along the Omani coastline into the Gulf of Aden [10,16]. Most of the species’ population roosts and breeds within the Arabian Gulf, forming the northern subpopulation. The smaller southern subpopulation resides on islands off Oman and in the Gulf of Aden, although there is no known breeding within the Red Sea. Nonetheless, non-breeding birds roam widely within the Arabian Gulf, the coastline of Oman and near the entrance to the Red Sea [8,10]. The latest total population estimate was 750,000 birds [10]. Overall, the Socotra Cormorant is poorly studied in some aspects of its annual life cycle. Distribution of Socotra Cormorants is governed by the abundance of forage fish, including anchovies (e.g., Encrasicholina) and sardines (Sardinella) [10,14,17]. The only studies investigating its foraging and roosting areas are from the Siniya Island colony, located north of the UAE. Roosting and foraging sites of cormorants breeding in other colonies (western Arabian Gulf or Gulf of Oman) remain unclear. Socotra Cormorants are opportunistic predators that rely on diverse, locally abundant forage fish stocks [10,17]. The annual fish consumption from the Siniya Island population alone was estimated to be between 11,000 and 18,000 tons [17]. A subsequent study calculated the average daily fish intake as 47 tons [18]. Socotra Cormorants likely improve fish diversity and the dynamics of the marine ecosystem and fisheries by controlling fish density and intra specific competition, which enhance size structures of fish populations and individual growth [17,18,19,20,21,22]. They also contribute greatly to marine nutrient cycling by depositing their nutrient-rich guano and affecting vegetation and invertebrates on nesting islands [19,20,21].
The species is listed as vulnerable, and its population is declining due to range limitations and human disturbance on many of its breeding islands [8,10,14,22]. Overall, the Arabian Gulf is considered among the most anthropogenically impacted marine areas [23]. Evidence that heavy metals bioaccumulate in forage fish in concentrations exceeding the maximum permissible limits suggests that many pollutants may be traversing through food webs in this system [24,25]. The Arabian Gulf is also one of the most extreme marine environments (high temperature and salinity, limited seasonality) [10,26]. Consequently, Arabian Gulf marine organisms have been reported to be living near their environmental tolerance boundary [10,27]. Generally, the movement patterns of the Socotra Cormorant are not clear, though one study suggested a dispersive movement [14], and rare observations have been reported on the west coast of India and in the west of the Red Sea [28]. Recent remote sensing data indicates short-distance directional migration by individuals nesting on one colony in eastern UAE [29]. There is often a mismatch between fish distributions and Socotra Cormorant distributions due to their generalist diet. Thus, observations of Socotra Cormorant movements appear to indicate seasonally changing distributions of the prey fish species, although systematic studies showing distribution and migratory patterns of the fish are missing [10,29].
Remote sensing and presence-only (PO) modeling techniques have contributed significantly towards our knowledge of the marine environment and the species that live in them [4,6,12]. Different modeling techniques have been used to better understand the current distribution of seabirds and predict their future distributions in light of environmental change [12]. In this study, we aim to (i) determine the possible current geographic distribution of Socotra Cormorants, a regionally endemic seabird with a restricted range around the Arabian Gulf, the Gulf of Oman, and the Gulf of Aden, to analyze the important environmental variables that affect its current distribution; and (ii) predict the possible future distribution in 2050 using a selected climate change scenario.

2. Materials and Methods

2.1. Collection and Preparation of Occurrence Data

Platform terminal transmitters (PTTs) (Kiwisat, Model K3H 174A, Sirtrack) were attached to individual breeding Socotra Cormorants as part of a larger study on foraging ecology. This helped to monitor breeding individuals during breeding seasons (September to December) as well as the post-breeding dispersal (December to July) in selected years. Occurrence data covered three periods. The first deployment of PTTs was in November 2013. Data were collected from November 2013 to December 2013 and then from May to June 2014. The gap in data was due to a technical error in the ARGOS satellite system that prevented signal recording. In this phase, 8 PTTs were attached to individuals from the Siniya Island, Umm Al Quwain, UAE colony using a harness made of Teflon ribbons in a back-pack arrangement (see [29]). The second deployment was in November 2014, and the data collection period was from November 2014 to August 2015 from 10 PTTs from birds caught on Siniya Island. The third deployment was at 2 different colonies in the southern Arabian Gulf, with 4 transmitters attached on Bu Tinah Island (in western Abu Dhabi), and 6 devices attached on Rubud Al Sharqiya on the northern portion of the Hawar archipelago in Bahrain. Data for this period were collected from December 2019 to December 2020. In each deployment, occurrence data represented nesting birds, foraging birds, and roosting birds during an annual migratory cycle.
Occurrence data were rarefied to avoid model overfitting and bias [30,31] at a resolution of 10 km, matching the environmental predictors. Moran’s Index was calculated to check spatial autocorrelation in the species distribution. The index ranged from +1 (perfect correlation) to −1 (perfect dispersion), and values near zero indicated randomness in the spatial pattern [12]. Both steps were carried out using ArcGIS. Overall, Maxent had the best performance at low sample sizes and the second best at intermediate and high sample sizes when compared with other common models [32]. It could also predict the reasonable and representative total area regardless of the sample size [33].

2.2. Collection and Preparation of Predictor Variables

The following variables were chosen to perform the modeling: SST (sea surface temperature, °C); SSS (sea surface salinity, ppt); SSH (sea surface height, m); depth (m); and MLD (mixed layer thickness, m). These predictors are either known or presumed to be linked to the abundance and distribution of seabirds by affecting multiple factors (e.g., water circulation, mixing and distribution of nutrients, upwelling, stratification, and sea level), which ultimately affect island availability, marine productivity, and prey fish abundance [27,34,35,36]. The movement, breeding, and foraging patterns are mostly along shallow coastal waters for both the Socotra Cormorant and the forage fish they prey upon [10].
Current variables were obtained at 0.083° (~9.2 km) resolution as monthly averages from E.U. Copernicus Marine Service Information [37], covering the period from 2011 to May 2020. The Depth variable was considered invariant throughout this study period. For the period of June to December 2020, the variables were obtained from the E.U. Copernicus Marine Service Information [38] also as monthly averages at the same resolution. The future variables were extracted as monthly data at 10 km resolution for the period of 2041 to 2050. The future scenario used was the Shared Socioeconomic Pathway SSP5-8.5 from the HadGEM3-GC31-HH model [39]. For this scenario, the radiative forcing in 2050 is projected to reach nearly 4 W/m2 and 5.9 W/m2 for CO2 and all greenhouse gases (GHGs), respectively [40]. Future variables were interpolated using the kriging method [4] in ArcGIS (Desktop 10.8.1). The kriging method has good sensitivity and is known to produce accurate re-gridded surfaces [41,42]. All variables were averaged and processed to have the same spatial extent and resolution of 10 km using ArcGIS. Finally, multicollinearity was assessed between the environmental variables using Variance Inflation Factor analyses (VIF) in R (version 4.1.1) using VIF >10 as a threshold [43].

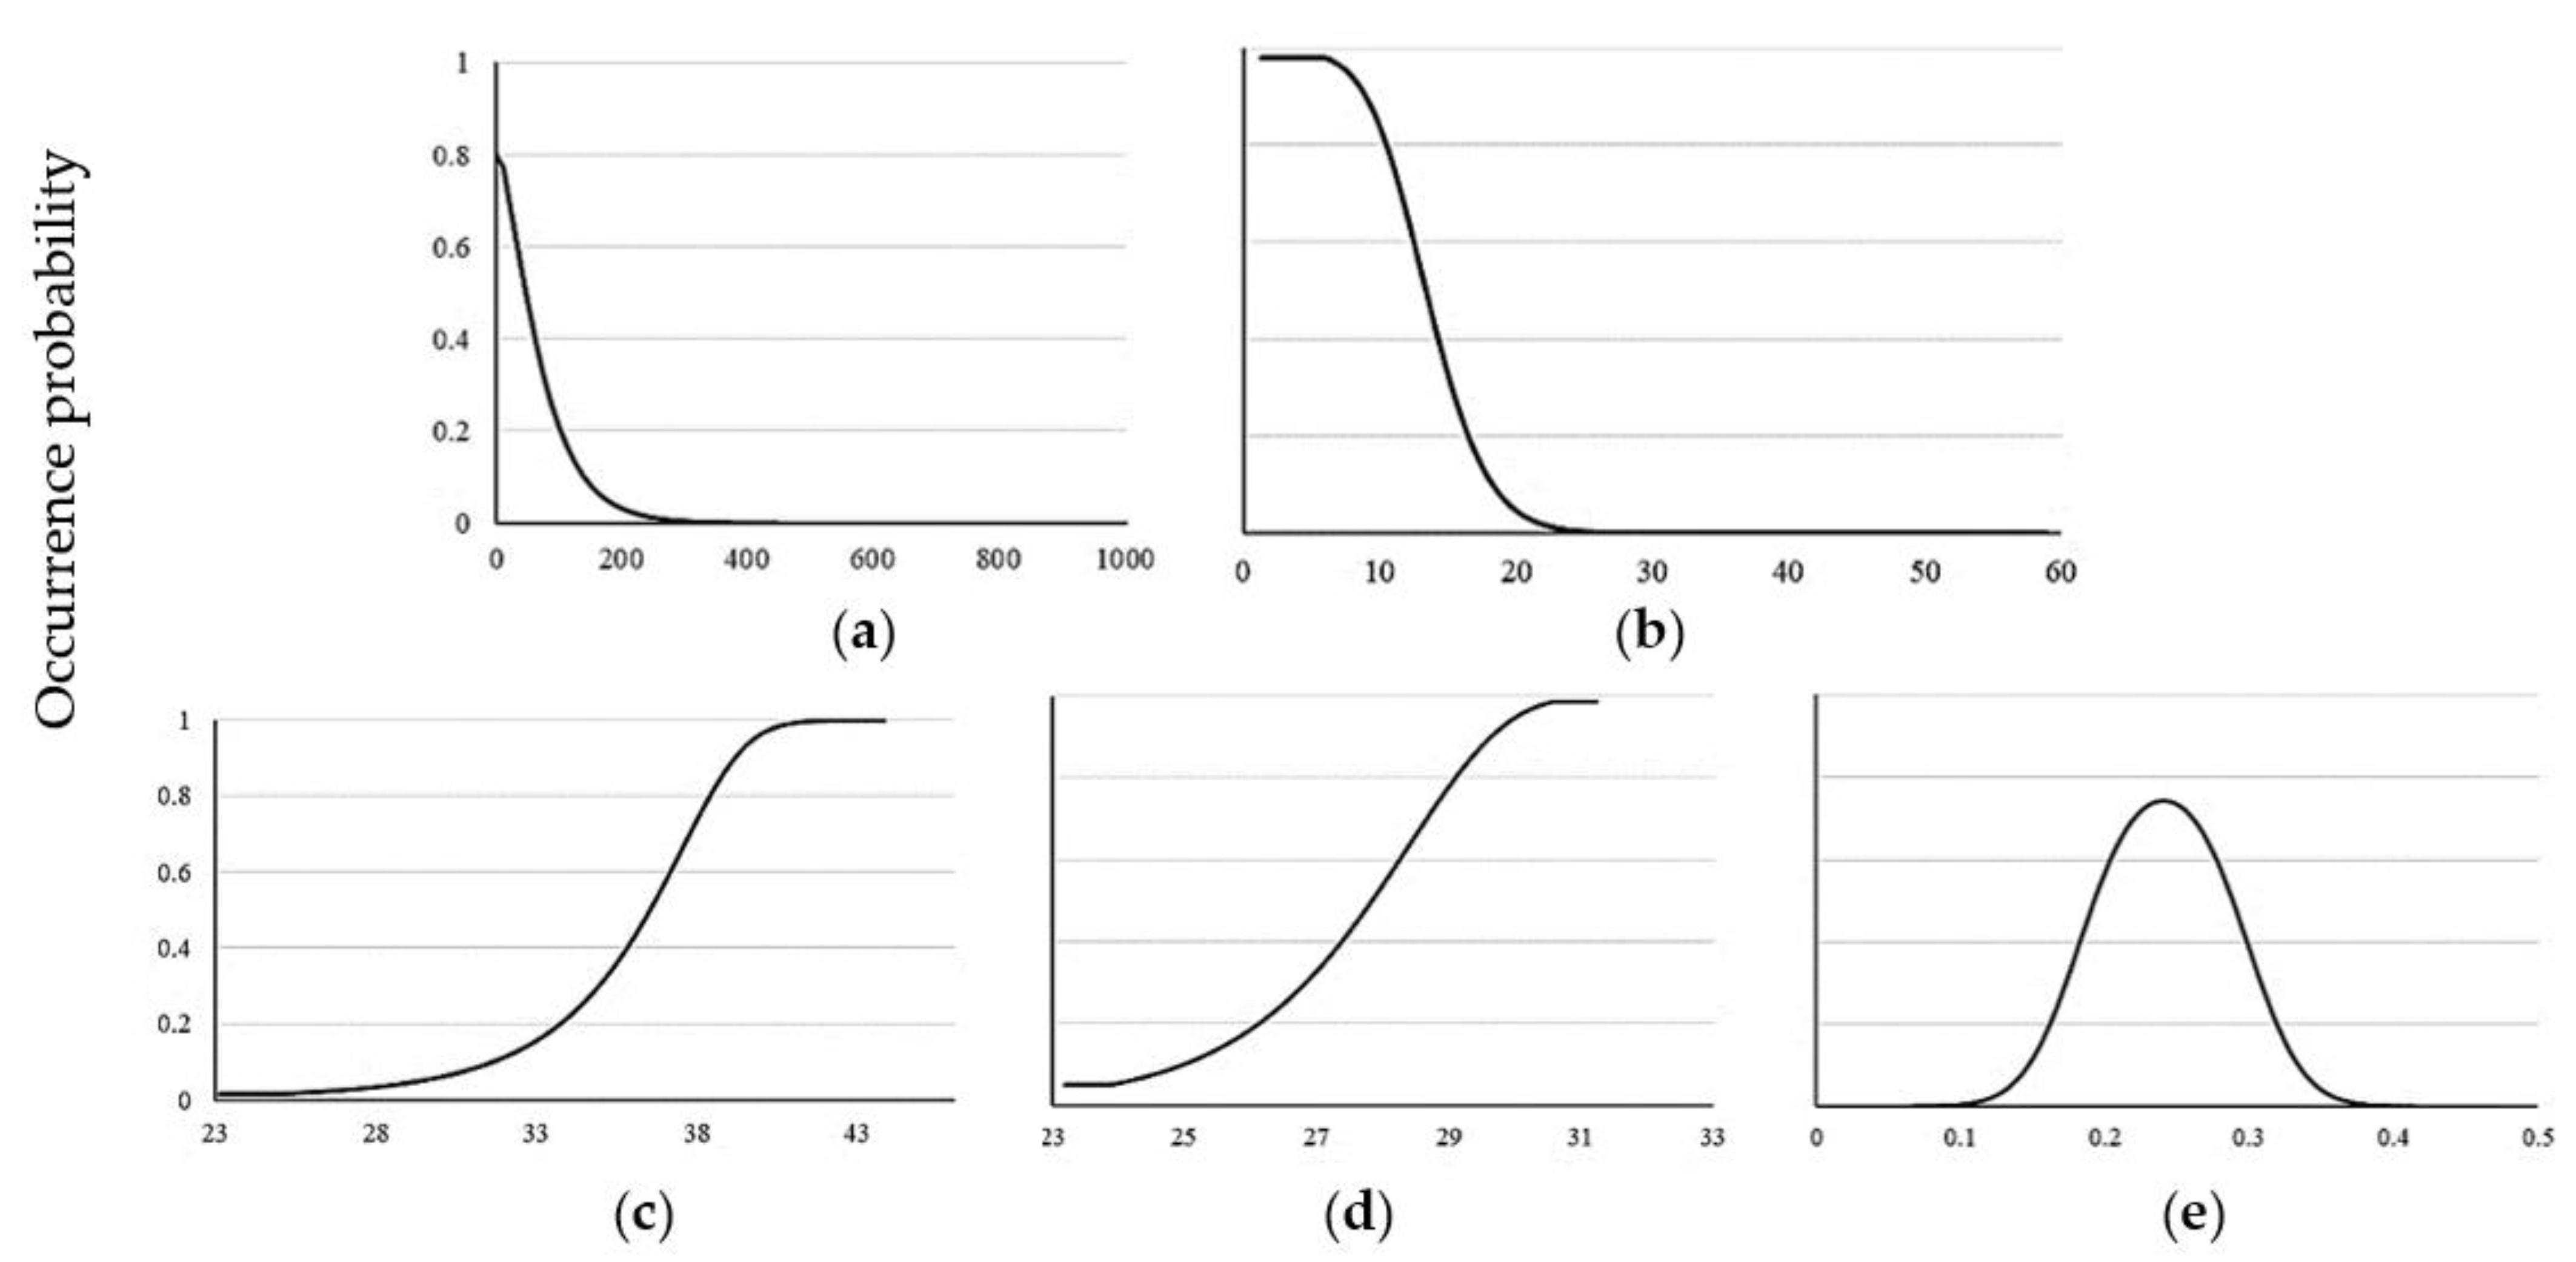
2.3. Modeling Procedures and Calibration

Maxent 3.4.3 [44] was used for the modeling analyses. Maxent is one of the commonly used techniques in niche and species distribution modeling, as it requires presence-only (PO) data [45,46,47]. Its method is considered robust [48], and it performed better when compared to most other PO modeling programs [32,46,47,49]. One of Maxent’s most argued criticisms is the common use of its default settings and visualizing it as a ‘blackbox’ tool [33,47]. In addition, the present study samples covered the marine distribution of some of the most well-known colonies in the Arabian Gulf [10], but no location data were included from the southern subpopulation outside the Arabian Gulf. Accounting for these arguments, the spatial jackknifing tool in SDM toolbox in ArcGIS was used [50]. The tool tests the Maxent model on multiple levels using varying parameters to produce the most likely calibrated and powerful model [50,51]. Regularization Multiplier (RM) is one of the tested parameters that aids the model to achieve accurate prediction and maximum entropy or the most uniform distribution, thereby reducing model overfitting [33,47]. Maxent was also provided with a bias file that was created using gaussian kernel density of sampling localities in the SDM toolbox. The bias file accounts for sampling bias by providing Maxent with a background file that has the same level of bias in presence localities. It also allows the model to control the density and locations of background points and to thus avoid sampling the less informative background points that lies outside the known range of the species [50].
The final model was run using an RM of 2 with linear and quadratic features. It was replicated for 15 runs by the subsampling method where 25% of occurrence data were allocated for model testing. The purpose of replication is to average prediction probabilities and avoid any skewness in the model outcome. To further prevent the model from under or overpredicting spatial relationships, iterations were set at 5000 considering the recommended convergence threshold of 10−5. Finally, Maxent projected the current model to the year 2050 using the provided future variables of the SSP5-8.5 scenario. The final distribution maps were visualized, and areas were calculated using ArcGIS.

2.4. Model Evaluation

To evaluate the model, the area under the receiver operating characteristic (ROC) curve (AUC) was used as a threshold independent method. AUC values ranged from 0 to 1, with values closer to 1 indicating better model performance [52]. True skill statistics (TSS) and Cohen’s kappa (k) were used as threshold dependent methods, with maximum training sensitivity and specificity as the threshold [53]. For the Cohen’s kappa method, k < 0.4 indicates low model accuracy, 0.4 < k < 0.75 indicates good accuracy, and k > 0.75 reflects excellent model accuracy [54]. Kappa statistics have been criticized for being dependent on the prevalence of data. As a result, TSS was calculated to support the kappa results, since it retains all kappa advantages, is less affected by prevalence, and accounts for omission and commission errors [55]. TSS ranges from −1 to +1, where TSS < 0 represents a random model, and values closer to +1 reflect excellent model performance [53]. Both statistics were calculated using Microsoft Excel and R. To assess the relative importance of each environmental predictor, contribution percentage and jackknife analysis were conducted using MaxEnt.

2.5. Model Exploration

To investigate variable differences between current and future distributions, multivariate environmental similarity surfaces (MESS) and the most dissimilar variable (MoD) of the MESS map were calculated using MaxEnt [56]. Pixel-by-pixel analysis was performed to calculate the extent of extrapolation or the similarity of a given point to a reference point between current and future variable values. MESS scores range from positive to negative, with negative values indicating an extrapolation or degree of novelty in that point, and a score of +100 meaning the point is not novel at all. MoD analysis is based on the MESS, as it shows the variable with the smallest similarity at each point [56,57]. Limiting factor analyses (LF) was conducted in MaxEnt to examine the most important variable(s) that influenced the model prediction at each point for both current and future predictions [56]. The variable that increases the model value the most when its value changes with respect to the average value at species sites is considered a limiting factor [56]. All maps were processed and visualized in ArcGIS.

3. Results

3.1. Autocorrelation Tests

The filtering of occurrence data resulted in 58 presence points (Figure 1). Moran’s Index was −0.0023, indicating a random distribution of presence points. The slightly negative value indicated a tendency towards dispersion, but this was negligible since it was close to zero. The P-value was 0.72, and the z-score was −0.36. Both values showed that the species localities were randomly distributed. For the predictor variables, VIF analysis showed no correlation, considering a VIF >10 as a critical threshold [43]. Thus, no variables were excluded from the distribution modeling.

3.2. Model Evaluation and Sensitivity Analysis

The final model showed a credible level of accuracy, with AUC-test at 0.965 and AUC-train at 0.966 with a standard deviation of 0.006, meaning the model had 96.5% performance (Table 1). Cohen’s kappa analysis also indicated good model accuracy as Kmax = 0.438, which fell within the desired range (0.4 < k < 0.75) [54]. The TSS results also supported the earlier results, as the averaged value was TSS = 0.874, and this indicated a high performance [53]. MLD and Depth were the top contributors of the model, with 43.3% and 41.1%, respectively (Table 1). The jackknife test results also showed that the environmental variable with the highest gain when used in isolation was MLD (Figure 2). It was also the variable that decreased the gain the most when omitted. Depth was the second most important variable with a clear drop in average gain when it was not used in the model.

3.3. Predicted Potential Suitability

Socotra Cormorants were predicted to have large moderate and high suitability areas across the study area (Figure 3a). The total predicted suitable area was 219,400 km2, with 64,100 km2 predicted as highly suitable areas (>0.6) (Table 2). From that, the Arabian Gulf alone had 24,000 km2, which equated to 37.4% of the total predicted distribution. The model also predicted suitable areas off Oman extending from Masirah Island in the north, with highly suitable areas, to the Al Hallaniyat archipelago, where suitability was mostly low (<0.4). Interestingly, the model predicted considerable highly suitable areas in the southern Red Sea, with 31,300 km2 or 48.8% of the total. The potential future distribution of the Socotra Cormorant is expected to decline sharply under the SSP5-8.5 scenario for 2050 (Figure 3b). The total suitable area was 32,600 km2, indicating a loss of ~73% in suitable areas, and only 1700 km2 of this was highly suitable (>0.6) (Table 2). These areas were mostly found near the Socotra archipelago. The Red Sea mostly had moderately suitable areas of 5200 km2, and 100 km2 of highly suitable areas. The Arabian Gulf lost all its highly and moderately suitable areas under this scenario.

3.4. Model Exploration

The response curves for the Maxent model were created to visualize the occurrence probability of Socotra Cormorants in relation to individual environmental variables (Figure 4). The probability of occurrence declined sharply with the increasing values of the Depth and MLD variables. For these two variables, high suitability (>0.6) occurred in areas where depth was ≤30.3 m and MLD was ≤12.5 m. In contrast, potential suitability increased with increasing SSS and SST values until stabilization, with highly suitable areas occurring when SSS was ≥37.2 ppt and SST was ≥28.3 °C. Suitability increased with the corresponding value of SSH of up to 0.24 m followed by a gradual decrease.
The MESS analysis values ranged from −44.22 to 55.89 (Figure 5a). The model extrapolated most in the southern Red Sea, as it had negative values, indicating novelty in environmental space (i.e., outside the training range). The novelty was mostly driven by SST (Figure 5b). The areas around the Socotra archipelago were the least extrapolated (i.e., closer and inside the training range) within the predicted future distribution of the Socotra Cormorant (areas within the black polygon). The LF analyses indicated that MLD is the dominant limiting factor over the predicted current range (Figure 5c). Areas off the southern UAE coast had Depth as the limiting factor, while areas around Hawar Islands had SSS as the limiting factor. For the potential future distribution (Figure 5d), SSH was the limiting factor in almost the entire predicted future range. Areas near the Socotra archipelago showed MLD as the limiting factor.

4. Discussion

4.1. Predicted Suitability and Re/Colonization

The current model predicted large areas of high suitability in the Arabian Gulf. This region was expected to be highly suitable, as it currently supports the largest portion of the bird population. Unexpectedly, the model predicted large patches of highly suitable areas in the southern Red Sea region with an overall suitable area that exceeded the prediction in the Arabian Gulf by 7300 km2. Some islands in this region were historically used, although there are limited studies on the species from the region [8,14], and there are no up to date breeding records [8]. Historically, there appear to be foraging areas located on either side of the coast of the southern Red Sea. Thus, the suitability predicted by our model highlights historic foraging areas for the species [8]. It must be noted that our model did not include biological variables (e.g., prey fish movement and abundance) due to the lack of these data in the region. However, the variables used as predictors have a strong influence on oceanographic factors, which in turn impact forage fish distributions (discussed further below) [10]. It was also difficult to obtain representative parameters for the future scenarios. In low latitude regions, biotic conditions are thought to play a primary role in determining distributional limits [58]. Modelling a species distribution and its relationship with environmental variables is an iterative process, where further testing and validation takes place [59]. Since our model was restricted to marine physical data, the outcomes of the modeling should be tested in an iterative manner using additional sampling, validating, and re-modeling.
Several other variables can affect the distribution of seabirds, including predation, competition, prey abundance, genetic diversity, adaptation, evolution, and the ability to disperse [59]. There are no studies on Socotra Cormorants that extensively investigated their movement between colonies or how they respond to changes in their islands and marine foraging ground status. Khan et al. [22] reported that Socotra Cormorants were able to relocate to inactive colonies and colonize new areas, as seen in the cases of Ghagha, Bu Tinah, and Digala Islands off the western Abu Dhabi emirate coast. However, the proximity between these islands and the surrounding active colonies were ≤150 km. These three colonies showed low disturbance levels, and two of them (Ghagha and Bu Tinah) have restricted access, emphasizing the importance of conserving suitable areas for possible future colonization. Since the study was conducted on decadal bases (1996, 2006, 2016), the temporal movement of colonization/recolonization could not be documented precisely. However, the general outcome indicated that the species made a gradual shift to these colonies.
Breeding Socotra Cormorants may move between colonies [10,14,22,29]. Intermixing occurs during the post-breeding period at roosting sites, and although recolonization could occur [10,14,22], the extent of this has not been studied. For example, the breeding population in Abu Dhabi islands increased significantly during the last decade. The movement was suspected to be from nearby colonies off eastern Qatar or other UAE colonies [22]. Our tracking data showed that birds from Siniya (eastern and northern UAE) and Abu Dhabi (western UAE) colonies visited the eastern Qatar and Hawar Archipelago colonies between January and March for a few days. However, recolonization movement between these two areas cannot be determined unless long-term tracking takes place. Several studies show that Socotra Cormorants breeding on Siniya Island migrate to western UAE (the islands in Abu Dhabi) where they may mix during non-breeding periods with individuals that breed in the area [10,17,29]. Similarly, it is widely believed that populations breeding on Hawar Islands may periodically also nest on some of the coastal islands of Saudi Arabian within the Gulf of Salwa [14], although there are no studies carefully documenting the extent of this interchange of breeding sites.
The distribution of forage fish is highly correlated with the distribution of breeding Socotra Cormorants during the breeding season, as individual birds are obliged to return to the colony at the end of their daily foraging activities to incubate their eggs or tend to the chicks. In comparison, non-breeding bird distribution is often not correlated with prey distributions because individuals do not need to return to a specific island after foraging and may roost in one of many islands during the night [29]. In the absence of detailed fish prey distribution data, it is difficult to correlate prey distributions and predict their predator (Socotra Cormorant) distributions. However, there are several species of forage fish that serve as prey within the Arabian Gulf, the Gulf of Oman (along the Omani shoreline), the Gulf of Aden, and within the Red Sea. These species undergo seasonal migrations within the Arabian Gulf, Red Sea, or in the Gulf of Oman and Gulf of Aden along the coastlines of Oman and Yemen [10]. Therefore, it is feasible for Socotra Cormorants to expand their distribution and colonize areas within the southern Red Sea region from nearby colonies off Yemen.
Socotra Cormorants have been reported near the Eritrean coastline and islands, with numbers surpassing 1500 birds in the summer season alone [60]. Breeding was also suspected to occur on the southern Eritrea coast extending to Djibouti [60], but this has not been confirmed to date [16]. The Red Sea is a unique environment, as it has high levels of surface temperature and salinity. It is also one of the busiest shipping routes globally, and anthropogenic disturbance is high [61]. Similar or higher levels of disturbance occurs in the Arabian Gulf [23,61]. Yet the species was able to persist and increase in numbers with the growing protection, as most of the islands it uses are designated as Important Bird and Biodiversity Areas (IBAs) [10,22].
The predicted future distribution under the SSP5-8.5 scenario showed an extreme declining trend that ranged between complete loss and significant reduction of suitability. This trend is similar to those found in other studies investigating climate change impacts on seabirds [4,6,62]. During model projection, extrapolation and clamping were allowed. Clamping deals with the uncertainty of predicting outside the training range by capping the prediction at the lowest/highest values observed during model training. In total, the future model predicted 5300 km2 of moderate and highly suitable areas in the southern Red Sea. The model extrapolated more in this region compared to others and was mostly driven by SST. Interestingly, in contrast to all other regions, suitable areas near the Socotra Archipelago increased under future prediction. This can be explained by the MESS analysis that showed less extrapolation in and around Socotra Archipelago, suggesting that the environmental conditions will likely be most similar to the current environmental conditions. Overall, moderate and high suitable areas in the future should remain intact, suggesting that the Socotra Archipelago could be of high importance to the conservation of this species in the future.
A recent study surveyed 538 animal and plant species globally and predicted that ≥30% may become extinct within their regions based on all future scenarios [63]. The study also indicated that dispersal alone might not be enough to face temperature change, and niche shifts may be highly important to avoid extinction [63]. Indeed, a credible projection of range change and expansion depends on long-term monitoring programs, where species abundance, migration, dispersal, and persistence are monitored [59]. Given that such data are lacking for Socotra Cormorants, the projection in the Red Sea might carry uncertainty. We present this projected range expansion as an initial hypothesis to be tested [59]. Socotra Cormorants may have to adapt or shift their niche to be able to survive in that region in the future (see below).

4.2. Influence of Predictor Variables

Depth was an important limiting factor preventing the species from spreading deeper into the Indian Ocean, with a contribution of 41% towards the model. Shallow sea floors are important because of their association with upwelling areas of high productivity [34]. Specifically, depths ≤30 m were predicted to be highly suitable for Socotra Cormorants. Socotra Cormorants of the Siniya Island colony were observed foraging mostly at depths of 15 m or less, and this is where forage fish are commonly encountered in winter [10,18]. MLD was limiting the bird distribution mostly in the middle (deeper) areas of the Arabian Gulf and the Red Sea. In the Arabian Gulf, the water column at deeper locations tends to be more stratified, which lowers mixing of nutrients, especially in the summer, as surface heating increases [64]. In shallow areas of the Arabian Gulf, thermal stratification is almost absent, and the whole water column is mixed in most areas in winter. Even in summer, the water column was moderately well-mixed in shallow areas [27,64]. The combination of these two factors enhances productivity [27]. MLD had the highest contribution to the model (42.3%). It also had the highest gain when used in isolation. Therefore, it appears that MLD had the most useful information in determining the outcome of the model. The variable also lowered the model gain the most when it was omitted, suggesting that it had the most information that was not present in other variables.
SSH also limited the distribution mostly along the eastern Arabian Gulf. Its current level is lower than 0.18 m on average, which corresponds to the least suitable areas as indicated by the response curve. The LF analyses of future distribution showed that SSH will limit Socotra Cormorant distribution in most areas. In some areas, SSH was predicted to increase, while for others it was predicted to decrease. Increasing SSH will submerge shallow islands and coastlines, which will increase the challenges for Socotra Cormorants to find suitable breeding and roosting sites. Decreasing SSH, on the other hand, will affect upwelling, circulation patterns and current dynamics [34]. The rise in SST in the future may affect MLD and cause more stratification and hence less nutrient mixing. The increase in SST by itself is threatening, as extreme environmental conditions (i.e., high SST and SSS) already exist in the Arabian Gulf and the Red Sea, and marine organisms are living near the edge of their tolerance level. As a result, a wide range of marine organisms including the Socotra Cormorant are expected to decrease in numbers [27].
SSH reflects ocean surface topography and large-scale circulations [34]. It is used as a proxy for eddies, upwelling areas, and current dynamics. These processes bring nutrients to the sea surface and affect its distribution on the water surface, thus contributing to marine productivity [34]. SSH, for example, is also used as a proxy for the potential location of many commercial fish catches such as tuna [65]. In the Arabian Gulf, many fish species migrate from the northern areas off the UAE coastline toward the south off Abu Dhabi emirate. This migration is correlated with predominant surface water currents in the area [10] that are influenced by MLD, SSH, depth, and SST. Thus, the important limiting variables contributing towards our model are consistent with our understanding of the impact of these variables on large-scale circulation patterns, nutrient dynamics, and forage fish distributions [10]. Thus, our model could form the basis for testing and validating direct linkages between nutrient circulation, forage fish distribution, seabird distribution, and these predictor variables.

4.3. Limitations and Unresolved Questions

Species distribution models have some methodological constraints, mainly for not integrating representative variables of the ecological interactions such as fishing exploitation and human disturbance [4]. As a result, it is recommended for researchers and environmental data providers (projects and services that provide bioclimatic and marine data) to explore options on how to account for these impacts. It is important to recognize that modeling marine species has significant challenges compared to terrestrial animals and stationary plants, as the conditions of marine environments are dynamic [12]. Consequently, data availability is affected, as there are fewer sources with calibrated, high-resolution, and continuous temporal coverage available for marine researchers. Furthermore, SDMs for seabirds face an unresolved question regarding the best spatiotemporal scale to use for modeling. Several approaches have been suggested for seabird distribution modeling, and there is no preponderance for a certain approach over another. One approach collects occurrences over several years and uses averaged environmental data [4]. Another similar approach pools presence data and averages the predictor variables on seasonal basis [12]. There is also the annual approach, which models the seabird distribution separately for each year [66]. Future studies could attempt to select the most suitable model using some sort of information theoretic approach to avoid biases in the use of SDMs.
The statistical tools for distribution modeling have been available for a considerable time now. Nevertheless, the present study is one of only a few studies that attempted to assess the impacts of climate change on seabirds in the Arabian Peninsula. We urge marine researchers and modelers to explore the region in depth and collect more data. There is also a need for baseline studies on the movement patterns of forage fish in the Arabian Gulf, as they are very limited and restricted to a few large, commercially important species. Understanding the movement of small forage species will help scientists better understand not only the Socotra Cormorant distribution but also other seabirds, larger fish species, and marine mammals in the region [10]. It will also facilitate the conservation of the marine grounds they depend upon.

Author Contributions

Conceptualization, S.B.M., T.K. and A.J.; methodology, A.J. and T.K.; software, A.J.; formal analysis, A.J.; investigation, A.J.; resources, T.K., S.B.M. and A.J.; data curation, A.J. and S.B.M.; writing—original draft preparation, A.J.; writing—review and editing, S.B.M., T.K. and A.J.; visualization, A.J.; supervision, S.B.M. and T.K.; project administration, S.B.M. and T.K.; funding acquisition, S.B.M. All authors have read and agreed to the published version of the manuscript.

Funding

This research was funded by a small grant available to M.Sc. Students of the College of Science (Grants 31S166 and 31S248), United Arab Emirates University.

Institutional Review Board Statement

This work was conducted under the Animal Ethics protocols of UAE University: A18-12 and ERA_2019_5974 under the UAE University Program for Advanced Studies Grants 31S166 and 31S248.

Data Availability Statement

Data may be requested from SBM.

Acknowledgments

We are grateful for K. Remya from the College of Science, UAE University, for her support. We also thank the anonymous reviewers for their constructive comments on an earlier version of this manuscript.

Conflicts of Interest

The authors declare no conflict of interest.

References

  1. Croxall, J.P.; Butchart, S.H.; Lascelles, B.E.N.; Stattersfield, A.J.; Sullivan, B.E.N.; Symes, A.; Taylor, P.H.I.L. Seabird conservation status, threats and priority actions: A global assessment. Bird Conserv. Int. 2012, 22, 1–34. [Google Scholar] [CrossRef] [Green Version]
  2. Dias, M.P.; Martin, R.; Pearmain, E.J.; Burfield, I.J.; Small, C.; Phillips, R.A.; Yates, O.; Lascelles, B.; Borboroglu, P.G.; Croxall, J.P. Threats to seabirds: A global assessment. Biol. Conserv. 2019, 237, 525–537. [Google Scholar] [CrossRef]
  3. Schreiber, E.A.; Burger, J. Seabirds in the Marine Environment. In Biology of Marine Birds; Schreiber, E.A., Burger, J., Eds.; CRC Press: Boca Raton, FL, USA, 2002; pp. 1–12. [Google Scholar]
  4. Cursach, J.A.; Arriagada, A.; Rau, J.R.; Ojeda, J.; Bizama, G.; Becerra, A. Predicting the potential distribution of the endemic seabird Pelecanus thagus in the Humboldt Current Large Marine Ecosystem under different climate change scenarios. Peer J. 2019, 7, e7642. [Google Scholar] [CrossRef] [PubMed] [Green Version]
  5. Quillfeldt, P.; Masello, J.F. Impacts of climate variation and potential effects of climate change on South American seabirds–a review. Mar. Biol. Res. 2013, 9, 337–357. [Google Scholar] [CrossRef] [Green Version]
  6. Krüger, L.; Ramos, J.A.; Xavier, J.C.; Gremillet, D.; González-Solís, J.; Petry, M.V.; Phillips, R.A.; Wanless, R.M.; Paiva, V.H. Projected distributions of Southern Ocean albatrosses, petrels and fisheries as a consequence of climatic change. Ecography 2018, 41, 195–208. [Google Scholar] [CrossRef] [Green Version]
  7. Glencross, J.S.; Lavers, J.L.; Woehler, E.J. Breeding success of short-tailed shearwaters following extreme environmental conditions. Mar. Ecol. Prog. Ser. 2021, 672, 193–203. [Google Scholar] [CrossRef]
  8. BirdLife International. Phalacrocorax nigrogularis (amended version of 2018 assessment). The IUCN Red List of Threatened Species 2019, e.T22696802A155525071. Available online: https://www.iucnredlist.org/species/22696802/155525071 (accessed on 20 March 2022).
  9. Crawford, R.J.M.; Sabarros, P.S.; Fairweather, T.; Underhill, L.G.; Wolfaardt, A.C. Implications for seabirds of a long term change in the distribution of sardine: A South African experience. Afr. J. Mar. Sci. 2008, 30, 177–184. [Google Scholar] [CrossRef] [Green Version]
  10. Muzaffar, S.B. Socotra Cormorants in the Arabian Gulf: A review of breeding biology, feeding ecology, movements and conservation. Aquat. Ecosyst. Health Manag. 2020, 23, 220–228. [Google Scholar] [CrossRef]
  11. Paleczny, M.; Hammill, E.; Karpouzi, V.; Pauly, D. Population trend of the world’s monitored seabirds, 1950–2010. PLoS ONE 2015, 10, e0129342. [Google Scholar] [CrossRef] [PubMed]
  12. Oppel, S.; Meirinho, A.; Ramírez, I.; Gardner, B.; O’Connell, A.F.; Miller, P.I.; Louzao, M. Comparison of five modelling techniques to predict the spatial distribution and abundance of seabirds. Biol. Conserv. 2012, 156, 94–104. [Google Scholar] [CrossRef]
  13. Robinson, L.M.; Elith, J.; Hobday, A.J.; Pearson, R.G.; Kendall, B.E.; Possingham, H.P.; Richardson, A.J. Pushing the limits in marine species distribution modelling: Lessons from the land present challenges and opportunities. Glob. Ecol. Biogeogr. 2011, 20, 789–802. [Google Scholar] [CrossRef] [Green Version]
  14. Jennings, M.C. Atlas of the breeding birds of Arabia. Br. Birds 2010, 103, 549–553. [Google Scholar]
  15. Nelson, J.B. Pelicans, Cormorants, and Their Relatives: Pelecanidae, Sulidae, Phalacrocoracidae, Anhingidae, Fregatidae, Phaethontidae; OUP Oxford: New York, NY, USA, 2005; pp. 429–431. [Google Scholar]
  16. BirdLife International. Species factsheet: Phalacrocorax nigrogularis. Available online: http://datazone.birdlife.org/species/factsheet/socotra-cormorant-phalacrocorax-nigrogularis/text (accessed on 20 March 2022).
  17. Muzaffar, S.B.; Gubiani, R.; Benjamin, S.; AlShihi, R.; Al-Romithi, A.; Al Kaabi, F.H. Food consumption patterns of the Vulnerable Socotra cormorant Phalacrocorax nigrogularis indicate minimal overlap with fisheries in the eastern Arabian Gulf. Oryx 2015, 51, 115–123. [Google Scholar] [CrossRef] [Green Version]
  18. Cook, T.R.; Gubiani, R.; Ryan, P.G.; Muzaffar, S.B. Group foraging in Socotra cormorants: A biologging approach to the study of a complex behavior. Ecol. Evolut. 2017, 7, 2025–2038. [Google Scholar] [CrossRef] [PubMed]
  19. Al Shehhi, H.; Muzaffar, S.B. Impact of nesting Socotra Cormorants on terrestrial invertebrate communities. Insects 2021, 12, 615. [Google Scholar] [CrossRef] [PubMed]
  20. Aspinall, S. Why the Socotra Cormorant Phalacrocorax nigrogularis should be formally protected. Notes Contrib. 1995, 5, 10–12. [Google Scholar]
  21. Ksiksi, T.S.; Muzaffar, S.B.; Gubiani, R.; Alshihi, R.M. The impact of nesting Socotra cormorants on soil chemistry and vegetation in a large colony in the United Arab Emirates. Diversity 2015, 7, 60–73. [Google Scholar] [CrossRef]
  22. Khan, S.B.; Javed, S.; Ahmed, S.; Al Hammadi, E.A.; Al Hammadi, A.A.; Al Dhaheri, S. Does a recent surge in Socotra Cormorant Phalacrocorax nigrogularis nesting population and establishment of new breeding colonies ensure long term conservation? Pragmatic assessment of recent augmentation in Abu Dhabi Emirate, UAE. Bird Conserv. Int. 2018, 29, 361–369. [Google Scholar] [CrossRef]
  23. Halpern, B.S.; Walbridge, S.; Selkoe, K.A.; Kappel, C.V.; Micheli, F.; D’Agrosa, C.; Bruno, J.F.; Casey, K.S.; Ebert, C.; Fox, H.E. A global map of human impact on marine ecosystems. Science 2008, 319, 948–952. [Google Scholar] [CrossRef] [PubMed] [Green Version]
  24. Alizada, N.; Malik, S.; Muzaffar, S.B. Bioaccumulation of heavy metals in tissues of Indian anchovy (Stolephorus indicus) from the UAE coast, Arabian Gulf. Mar. Pollut. Bull. 2020, 154, 111033. [Google Scholar] [CrossRef]
  25. Malik, S.; Alizada, N.; Muzaffar, S.B. Bioaccumulation of trace elements in tissues of Indian oil sardine (Sardinella longiceps) from the northern United Arab Emirates. Mar. Pollut. Bull. 2020, 161, 111771. [Google Scholar] [CrossRef]
  26. Diaz Lopez, B.; Methion, S.; Das, H.; Bugla, I.; Al Hameli, M.; Al Ameri, H.; Al Hashmi, A.; Grandcourt, E. Vulnerability of a top marine predator in one of the world’s most impacted marine environments (Arabian Gulf). Mar. Biol. 2021, 168, 1–11. [Google Scholar] [CrossRef]
  27. Riegl, B.M.; Purkis, S.J. Coral reefs of the Gulf: Adaptation to climatic extremes in the world’s hottest sea. In Coral Reefs of the Gulf; Springer: Dordrecht, The Netherlands, 2012; Volume 3, pp. 1–4. [Google Scholar] [CrossRef]
  28. Del Hoyo, J.; Elliott, A.; Sargatal, J. Handbook of the Birds of the World; Lynx edicions: Barcelona, Spain, 1992. [Google Scholar]
  29. Muzaffar, S.B.; Clarke, C.; Whelan, R.; Gubiani, R.; Cook, T.R. Short distance directional migration in the threatened Socotra cormorant: Link to primary productivity and implications for conservation. Mar. Ecol. Prog. Ser. 2017, 575, 181–194. [Google Scholar] [CrossRef]
  30. Boria, R.A.; Olson, L.E.; Goodman, S.M.; Anderson, R.P. Spatial filtering to reduce sampling bias can improve the performance of ecological niche models. Ecol. Model. 2014, 275, 73–77. [Google Scholar] [CrossRef]
  31. Veloz, S.D. Spatially autocorrelated sampling falsely inflates measures of accuracy for presence-only niche models. J. Biogeogr. 2009, 36, 2290–2299. [Google Scholar] [CrossRef]
  32. Wisz, M.S.; Hijmans, R.J.; Li, J.; Peterson, A.T.; Graham, C.H.; Guisan, A.; NCEAS Predicting Species Distributions Working Group. Effects of sample size on the performance of species distribution models. Divers. Distrib. 2008, 14, 763–773. [Google Scholar] [CrossRef]
  33. Hernandez, P.A.; Graham, C.H.; Master, L.L.; Albert, D.L. The effect of sample size and species characteristics on performance of different species distribution modeling methods. Ecography 2006, 29, 773–785. [Google Scholar] [CrossRef]
  34. Gilmour, M.E.; Castillo-Guerrero, J.A.; Fleishman, A.B.; Hernández-Vázquez, S.; Young, H.S.; Shaffer, S.A. Plasticity of foraging behaviors in response to diverse environmental conditions. Ecosphere 2018, 9, e02301. [Google Scholar] [CrossRef] [Green Version]
  35. Tremblay, Y.; Bertrand, S.; Henry, R.W.; Kappes, M.A.; Costa, D.P.; Shaffer, S.A. Analytical approaches to investigating seabird–environment interactions: A review. Mar. Ecol. Prog. Ser. 2009, 391, 153–163. [Google Scholar] [CrossRef] [Green Version]
  36. Wakefield, E.D.; Phillips, R.A.; Matthiopoulos, J. Quantifying habitat use and preferences of pelagic seabirds using individual movement data: A review. Mar. Ecol. Prog. Ser. 2009, 391, 165–182. [Google Scholar] [CrossRef] [Green Version]
  37. E.U. Copernicus Marine Service Information. Global Ocean Physics Reanalysis. Available online: https://resources.marine.copernicus.eu/product-detail/GLOBAL_MULTIYEAR_PHY_001_030/INFORMATION (accessed on 10 June 2021).
  38. E.U. Copernicus Marine Service Information. Global Ocean 1/12° Physics Analysis and Forecast updated Daily. Available online: https://resources.marine.copernicus.eu/product-detail/GLOBAL_ANALYSIS_FORECAST_PHY_001_024/INFORMATION (accessed on 10 June 2021).
  39. Roberts, M. MOHC HadGEM3-GC31-HH model output prepared for CMIP6 HighResMIP highres-future. Version 20200514. Earth System Grid Federation. 2019. Available online: https://www.wdc-climate.de/ui/cmip6?input=CMIP6.HighResMIP.MOHC.HadGEM3-GC31-HH.highres-future (accessed on 5 March 2021).
  40. Meinshausen, M.; Nicholls, Z.R.; Lewis, J.; Gidden, M.J.; Vogel, E.; Freund, M.; Beyerle, U.; Gessner, C.; Nauels, A.; Bauer, N.; et al. The shared socio-economic pathway (SSP) greenhouse gas concentrations and their extensions to 2500. Geosci. Model Dev. 2020, 13, 3571–3605. [Google Scholar] [CrossRef]
  41. Lima-Ribeiro, M.S.; Varela, S.; González-Hernández, J.; de Oliveira, G.; Diniz-Filho, J.A.F.; Terribile, L.C. EcoClimate: A database of climate data from multiple models for past, present, and future for macroecologists and biogeographers. Biodivers. Inform. 2015, 10, 1–21. [Google Scholar] [CrossRef] [Green Version]
  42. Varela, S.; Lima-Ribeiro, M.S.; Terribile, L.C. A short guide to the climatic variables of the last glacial maximum for biogeographers. PLoS ONE 2015, 10, e0129037. [Google Scholar] [CrossRef] [PubMed]
  43. Duque-Lazo, J.; Van Gils, H.A.M.J.; Groen, T.A.; Navarro-Cerrillo, R.M. Transferability of species distribution models: The case of Phytophthora cinnamomi in Southwest Spain and Southwest Australia. Ecol. Model. 2016, 320, 62–70. [Google Scholar] [CrossRef]
  44. Phillips, S.J.; Dudík, M.; Schapire, R.E. Maxent software for modeling species niches and distributions Version 3.4.3. Available online: http://biodiversityinformatics.amnh.org/open_source/maxent (accessed on 26 February 2022).
  45. Bradie, J.; Leung, B. A quantitative synthesis of the importance of variables used in MaxEnt species distribution models. J. Biogeogr. 2017, 44, 1344–1361. [Google Scholar] [CrossRef]
  46. Merow, C.; Smith, M.J.; Silander Jr, J.A. A practical guide to MaxEnt for modeling species’ distributions: What it does, and why inputs and settings matter. Ecography 2013, 36, 1058–1069. [Google Scholar] [CrossRef]
  47. Phillips, S.J.; Dudík, M. Modeling of species distributions with Maxent: New extensions and a comprehensive evaluation. Ecography 2008, 31, 161–175. [Google Scholar] [CrossRef]
  48. Phillips, S.J.; Anderson, R.P.; Schapire, R.E. Maximum entropy modeling of species geographic distributions. Ecol. Model. 2006, 190, 231–259. [Google Scholar] [CrossRef] [Green Version]
  49. Elith, J.; Phillips, S.J.; Hastie, T.; Dudík, M.; Chee, Y.E.; Yates, C.J. A statistical explanation of MaxEnt for ecologists. Divers. Distrib. 2011, 17, 43–57. [Google Scholar] [CrossRef]
  50. Brown, J.L.; Bennett, J.R.; French, C.M. SDMtoolbox 2.0: The next generation Python-based GIS toolkit for landscape genetic, biogeographic and species distribution model analyses. Peer J. 2017, 5, e4095. [Google Scholar] [CrossRef] [Green Version]
  51. Radosavljevic, A.; Anderson, R.P. Making better Maxent models of species distributions: Complexity, overfitting and evaluation. J. Biogeogr. 2014, 41, 629–643. [Google Scholar] [CrossRef]
  52. Merckx, B.; Steyaert, M.; Vanreusel, A.; Vincx, M.; Vanaverbeke, J. Null models reveal preferential sampling, spatial autocorrelation and overfitting in habitat suitability modelling. Ecol. Model. 2011, 222, 588–597. [Google Scholar] [CrossRef] [Green Version]
  53. West, A.M.; Kumar, S.; Brown, C.S.; Stohlgren, T.J.; Bromberg, J. Field validation of an invasive species Maxent model. Ecol. Inform. 2016, 36, 126–134. [Google Scholar] [CrossRef] [Green Version]
  54. Landis, J.R.; Koch, G.G. An application of hierarchical kappa-type statistics in the assessment of majority agreement among multiple observers. Biometrics 1977, 33, 363–374. [Google Scholar] [CrossRef] [PubMed]
  55. Allouche, O.; Tsoar, A.; Kadmon, R. Assessing the accuracy of species distribution models: Prevalence, kappa and the true skill statistic (TSS). J. Appl. Ecol. 2006, 43, 1223–1232. [Google Scholar] [CrossRef]
  56. Elith, J.; Kearney, M.; Phillips, S. The art of modelling range-shifting species. Methods Ecol. Evolut. 2010, 1, 330–342. [Google Scholar] [CrossRef]
  57. Rodder, D.; Lawing, A.M.; Flecks, M.; Ahmadzadeh, F.; Dambach, J.; Engler, J.O.; Habel, J.C.; Hartmann, T.; Hornes, D.; Ihlow, F.; et al. Evaluating the significance of paleo phylogeographic species distribution models in reconstructing Quaternary range-shifts of Nearctic chelonians. PLoS ONE 2013, 8, e72855. [Google Scholar] [CrossRef] [PubMed] [Green Version]
  58. Rodda, G.H.; Jarnevich, C.S.; Reed, R.N. Challenges in identifying sites climatically matched to the native ranges of animal invaders. PLoS ONE 2011, 6, e14670. [Google Scholar] [CrossRef] [Green Version]
  59. Jarnevich, C.S.; Stohlgren, T.J.; Kumar, S.; Morisette, J.T.; Holcombe, T.R. Caveats for correlative species distribution modeling. Ecol. Inform. 2015, 29, 6–15. [Google Scholar] [CrossRef]
  60. Semere, D.; Hagos, T.; Seleba, G.; Gebrezgabhier, Y.; Haile, Z.; Chiozzi, G.; De Marchi, G. The status of breeding seabirds and waterbirds on the Eritrean Red Sea islands. Bull. Afr. Bird Club 2008, 15, 228–237. [Google Scholar] [CrossRef]
  61. Rasul, N.; Stewart, I.C.; Nawab, Z.A. Introduction to the Red Sea: Its origin, structure, and environment. In The Red Sea; Springer: Berlin, Germany, 2015; pp. 1–28. [Google Scholar] [CrossRef]
  62. Jenouvrier, S.; Holland, M.; Stroeve, J.; Serreze, M.; Barbraud, C.; Weimerskirch, H.; Caswell, H. Projected continent-wide declines of the emperor penguin under climate change. Nat. Clim. Change 2014, 4, 715–718. [Google Scholar] [CrossRef]
  63. Román-Palacios, C.; Wiens, J.J. Recent responses to climate change reveal the drivers of species extinction and survival. Proc. Nat. Acad. Sci. U.S.A. 2020, 117, 4211–4217. [Google Scholar] [CrossRef] [PubMed]
  64. Azizpour, J.; Chegini, V.; Khosravi, M.; Einali, A. Study of the physical oceanographic properties of the Persian Gulf, strait of Hormoz and Gulf of Oman based on PG-GOOS CTD measurements. J. Pers. Gulf 2014, 5, 37–48. [Google Scholar]
  65. Syah, A.F.; Siregar, E.S.Y.; Siregar, V.P.; Agus, S.B. Application of remotely sensed data and maximum entropy model in detecting potential fishing zones of Yellowfin tuna (Thunnus albacares) in the eastern Indian Ocean off Sumatera. J. Phys. Conf. Ser. 2020, 1569, 042097. [Google Scholar] [CrossRef]
  66. Tuanmu, M.N.; Vina, A.; Roloff, G.J.; Liu, W.; Ouyang, Z.; Zhang, H.; Liu, J. Temporal transferability of wildlife habitat models: Implications for habitat monitoring. J. Biogeogr. 2011, 38, 1510–1523. [Google Scholar] [CrossRef]
Figure 1. Occurrence points used for the distribution modelling.
Diversity 14 00840 g001
Figure 2. Jackknife evaluation of the relative importance of each variable. Depth: sea floor depth, MLD: mixed layer thickness, SSS (sea surface salinity), SST (sea surface temperature), SSH (sea surface height).
Diversity 14 00840 g002
Figure 3. Potential current and future geographic distribution of Phalacrocorax nigrogularis: (a) predicted current distribution, (b) projected future distribution under SSP5-8.5 scenario in 2050.
Diversity 14 00840 g003
Figure 4. Response curves of the environmental variables showing occurrence probability for Phalacrocorax nigrogularis. (a) Depth (sea floor depth, m), (b) MLD (mixed layer thickness, m), (c) SSS (sea surface salinity, ppt), (d) SST (sea surface temperature, °C), (e) SSH (sea surface height, m).
Diversity 14 00840 g004
Figure 5. Model exploration maps: (a) extrapolation region using multivariate environmental similarity surfaces (MESS) analysis showing the extent of extrapolation or similarity of each point to reference points; (b) most dissimilar variable (MoD) map showing the smallest similarity at each point; and (c) limiting factor (LF) analyses highlighting the most important limiting factors for predicted current and (d) future distributions. The black polygons represent the potential future distribution range for (a,b,d), and (c) the potential current distribution range based on Maxent prediction. Depth (sea floor depth, m), MLD (mixed layer thickness, m), SSS (sea surface salinity, ppt), SST (sea surface temperature, °C), and SSH (sea surface height, m). (See text for details).
Diversity 14 00840 g005aDiversity 14 00840 g005b
Table 1. Model evaluation and sensitivity tests and contribution percentage for each variable in the distribution model of Phalacrocorax nigrogularis.
VariableContribution to the Model (%)
MLD42.3
Depth41.1
SST9.6
SSH6.4
SSS0.6
Evaluation TestResult
AUC-test0.965
AUC-train0.966
TSS0.874
Kappa max0.448
Table 2. Suitability area for Phalacrocorax nigrogularis in each region expressed in surface area.
RegionsSuitability Area (km2)
Unsuitable
(<0.2)
Least
Suitable (0.2–0.4)
Moderately
Suitable (0.4–0.6)
Highly
Suitable (>0.6)
CurrentFutureCurrentFutureCurrentFutureCurrentFuture
All1,980,5002,172,700113,30024,90042,000600064,1001700
Arabian Gulf156,200225,60027,300016,400024,0000
Gulf of Oman, Arabian Sea, Gulf of Aden1,488,1001,524,60025,5004100780080088001600
Red Sea336,200422,50060,50020,80017,800520031,300100
Publisher’s Note: MDPI stays neutral with regard to jurisdictional claims in published maps and institutional affiliations.

