1. Introduction
The accurate identification of population demographic characteristics, such as age composition and operational sex ratios, is important to understand the recruitment dynamics [
1], mating systems [
2], and propensities for loss of genetic diversity [
3], which can direct management actions. The identification of sex can be difficult for sexually monomorphic species, such as sturgeon and paddlefish (review in [
4]). Difficulties can be particularly pronounced during the non-breeding season, as gonadal development and hormonal expressions vary greatly.
Until recently, methods for determining sex in Acipenserid species varied greatly, including ultrasound [
5], histological characterization of gonadal tissue differentiation [
6], and hormonal assays [
7]. With the characterization of the sterlet (
Acipenser ruthenus) genome [
8], follow-up work by Kuhl et al. [
9] recently published the discovery of the AllWSex2 marker in sturgeon and tested its ability to determine sex in six Acipenserid species. Subsequently, Scribner and Kanefsky [
10] described the utility of the AllWSex2 primers for PCR-based sex determination in lake sturgeon (
Acipenser fulvescens), a species not tested by Kuhl et al. [
9]. These primers produce an amplification product specifically in female lake sturgeon that is slightly larger than 100 base pairs (bp) in length. Therefore, Scribner and Kanefsky [
10] classified individuals that produced ~100 bp amplification products as female, while those that did not were classified as male. However, in all of the five male lake sturgeon in our test [
10], an amplification product of ~300 bp in length was produced using the AllWSex2 primers, along with other minor amplification products. Sanfilippo et al. [
11] then documented that the male non-target-specific amplification products were only sporadically detectable on ethidium bromide-stained agarose gels. This finding diminished the method’s utility as an internal control for DNA quality and necessitated the use of a second marker to test the DNA quality to prevent erroneous male assignments that could result from the lack of amplification due to poor DNA quality or a failed PCR reaction in putative male individuals [
11].
In an attempt to improve upon the speed and ease of use of the lake sturgeon PCR-based sexing assay, we developed and tested a sexing protocol using the same primers in a real-time PCR assay that includes melt curve analysis based on the method of Anglès d’Auriac et al. [
12]. In real-time PCR assays, an intercalating reporter dye binds to double-stranded products produced during the PCR, which produces a fluorescent signal. When a PCR product is dissociated into single strands, the reporter dye no longer binds and the fluorescence declines. The melt curve analysis is conducted after the PCR is complete, and it determines the change in fluorescence in a reaction over a range of temperatures as the PCR products are rendered single-stranded. The data are then used to produce a derivative melt curve plot, which shows the negative derivative of normalized fluorescence versus temperature. The peaks in this plot correspond to the maximum rates of change in the fluorescence from which the melting temperature (Tm) of the PCR products, or the temperature at which 50% of the PCR products are double-stranded and 50% are dissociated into single-stranded DNA, is estimated. The Tm is determined, in part, by the characteristics of the amplified target DNA, such as fragment length, sequence, and base pair composition, so that different amplicons can have different melting temperatures and produce peaks at different temperatures in the derivative melt curve plot, allowing their distinction. Multiple advantages were revealed with this new method. In addition, while developing this assay, we tested a larger number of lake sturgeon adults with field-assigned sex than in the original tests [
10], including lake sturgeon from two different populations, to further examine the robustness and accuracy of the marker for sex identification. The method has the potential to be used with additional sturgeon species where the sexing primers have been demonstrated to be applicable (e.g., [
9]).
2. Materials and Methods
Included in the testing were 143 adult individuals that had received a field-sex assignment (either conclusive or tentative). Fish (N = 57) were collected from the Menominee River (MI–WI border) in 2019 and tentatively sexed using ultrasonography and common morphological measures [
5]. Fish (N = 23) were collected from the Black River, Cheboygan County, MI, in 2020 and 2021 (N = 63). Of the Black River individuals that were genetically sexed, 68 were of known field sex based on expression of gametes, and 18 were newly captured and provisionally sexed based on visual examination of morphological features (vent morphology and girth and length ratios), which are not definitive. Of the 143 fish, 58 were assigned a field sex of female and 85 were assigned a field sex of male.
DNeasy Blood and Tissue kits (QIAGEN, Germantown, MD, USA) were used to extract DNA from dried lake sturgeon fin clips, according to the manufacturer’s protocols. The real-time PCR reactions contained 18 µL of master mix (10 µL of 2X Forget-Me-Not™ EvaGreen qPCR Master Mix-Low ROX (Biotium, Fremont, CA, USA), 1 µL each of the AllWSex2 forward and reverse primers at 10 pmol/µL, and 6 µL of diH
2O) and 2 µL of DNA at a concentration of 20 ng/µL for a total volume of 20 µL. The negative control reactions (NTCs) contained 2 µL of sterile dH
2O instead of DNA. Thermal cycling was carried out on a QuantStudio™ 6 (Applied Biosystems, Waltham, MA, USA) and included the following settings: melt curve experiment, SYBR
® Green reagents, fast cycling conditions, including PCR, and a 20 µL reaction volume. The cycling parameters were as follows: an initial denaturation step of 2 min at 95 °C, followed by 40 cycles of 5 s at 95 °C, 10 s at 56 °C, and 20 s at 72 °C, with imaging during the extension step. This was followed by 15 s at 95 °C and melt curve analysis from 56 to 95 °C with 0.1 °C increments, a 3-s hold at each temperature, and imaging. The resulting melt curve and fluorescence derivative plots were evaluated using the QuantStudio™ Real-Time PCR Software v1.2 (Applied Biosystems, Waltham, MA, USA). We produced an R-script for summarizing the maximum rate of change in the fluorescence within the temperature ranges corresponding to the male- and female-specific PCR products and produced a linear discriminant model for sex assignment using these summary statistics using the lda function from the R package MASS ([
13];
https://github.com/ScribnerLab/LakeSturgeon_SexID; DOI:10.5281/zenodo7072409, accessed on 28 August 2022).
3. Results and Discussion
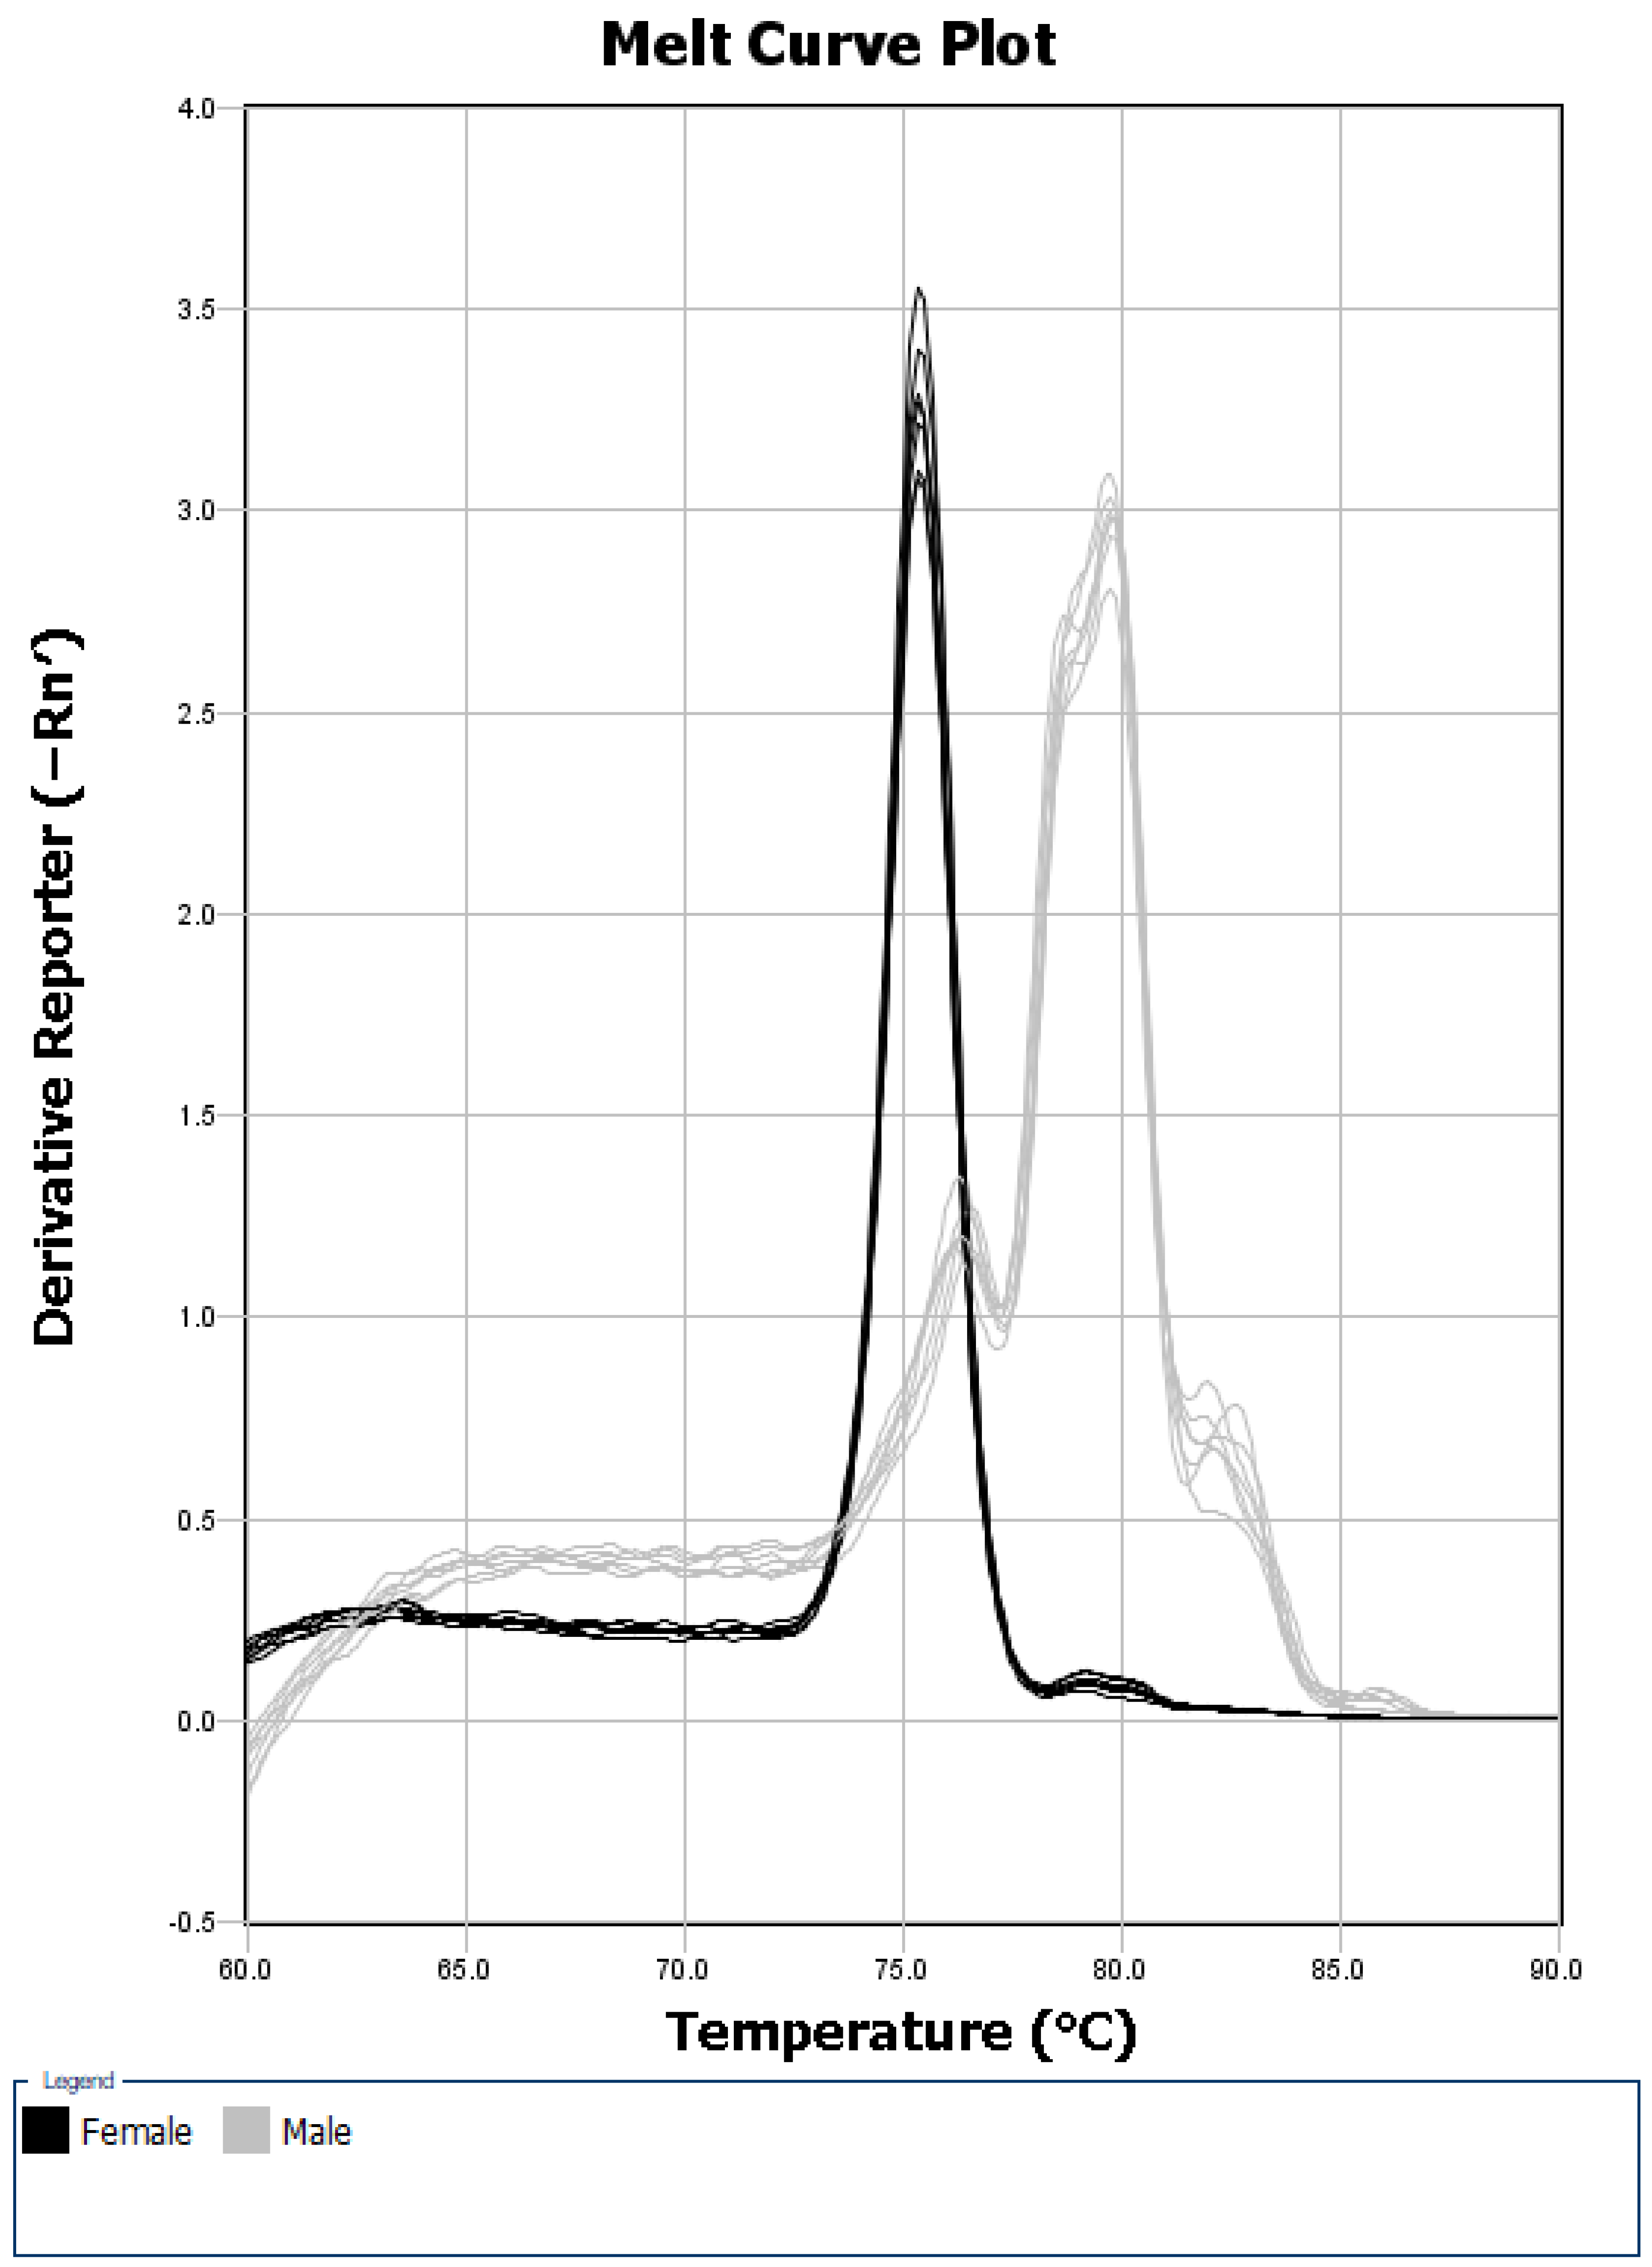
In an initial test of the real-time PCR protocol on seven male and seven female lake sturgeon adults (sex was conclusively assigned in the field), the seven female samples each showed a single peak in the melt curve with an average melting temperature of (mean + std) of 75.12 + 0.05 °C (
Figure 1), presumably corresponding to the single female-specific band produced in the PCR-based assays. All of the seven male samples displayed what appears to be one main peak in the melt curve, with an average melting point of 79.42 + 0.08 °C, as well as three smaller peaks (
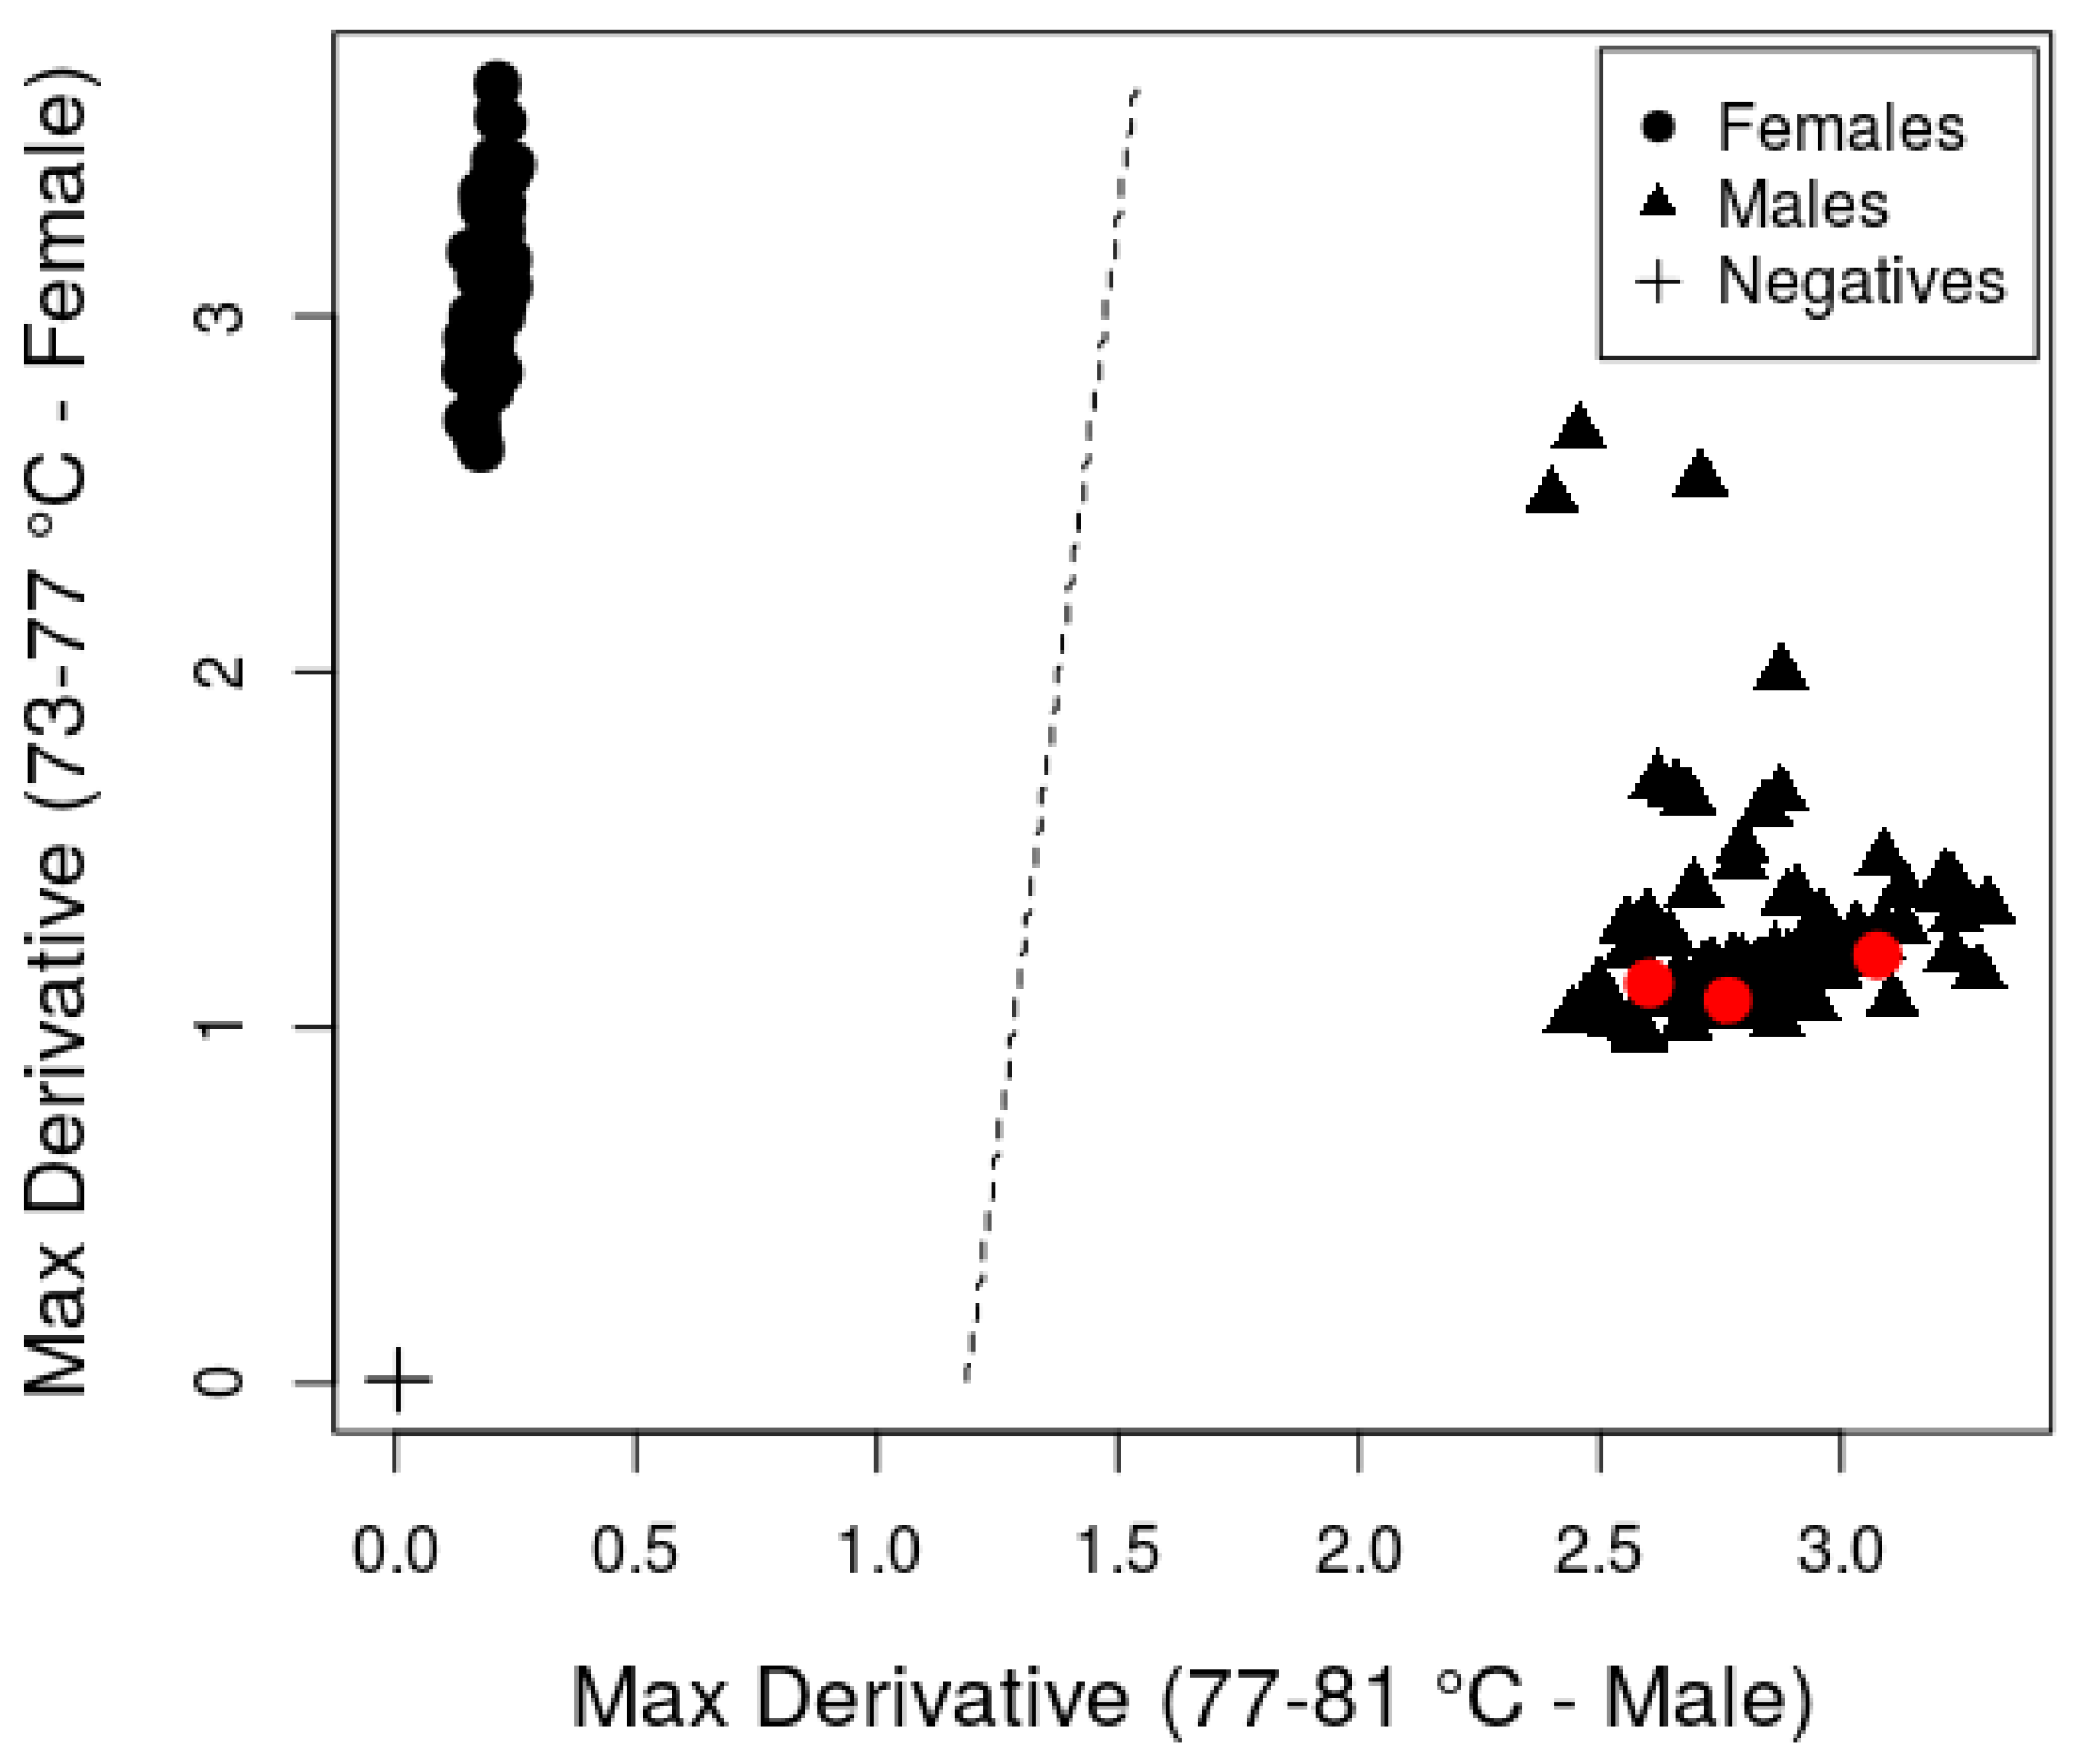
Figure 1). These peaks presumably correspond to the amplification products observed in some male samples when using the PCR-based assay. The melt curve analysis is traditionally used with real-time PCR assays to verify the production of a single target PCR product in a reaction. We were able to use the method for a different purpose: to distinguish male and female PCR amplification patterns. The 4.3 °C difference in melting temperatures for the main products produced by the male and female samples, as well as the difference in the shape of the curves, allowed for the discrimination between the male and female lake sturgeon. The mean maximum derivatives within the female peak region were 3.01 and 1.27 for the females and males, respectively. The mean maximum derivatives within the male peak region were 0.33 and 2.84 for the females and males, respectively. A single linear discriminant (dotted line,
Figure 2) cleanly separates the males and females based on the maximum derivatives within the two peak regions. The coefficients for this linear discriminant were −0.27 for the female peak region and 2.27 for the male peak region.
The presence of a consistently detectable and distinct melt curve pattern in all of the fish identified as male in the field provides a “built-in” internal control for assessing the DNA quality and amplification success. If a sample’s melt curve shows a female-specific peak or a male peak pattern, there is positive amplification and the DNA quality can be considered sufficient. Alternatively, if a sample’s melt curve shows no peaks, the DNA is either of poor quality or the PCR reaction failed due to user error, and the sample should be retested. Without the presence of a male peak pattern in the melt curves for the AllWSex2 marker in lake sturgeon, the samples lacking amplification due to poor DNA quality or a PCR amplification failure could erroneously be classified as males if the sample was not also tested with a different DNA marker.
A total of 143 adult lake sturgeon, including the 14 used for the initial testing (85 with a field-sex assignment of male and 58 with a field-sex assignment of female), were analyzed using the real-time PCR sexing assay and the AllWSex2 primers [
9]. The results are summarized in
Table 1 and
Figure 2. The sex assignment agreed between the field and molecular methods in 98% (140/143) of the samples, indicating that the assay was successful in two geographically separated lake sturgeon populations. All except for three female field-sexed fish showed a female-specific peak. The three samples with the mismatch between field and molecular sex were tentative field-sexed females that showed only male peak patterns in the real-time PCR melt curves (
Figure 2). The mismatched fish included one female lake sturgeon from the Black River that was classified tentatively as a female and two females from the Menominee River that were tentatively classified as F4 (black-egg) females [
5]. While the mismatched female from the Black River was only tentatively classified as female (i.e., no gametes were expressed), it seems less likely that the F4 female fish from the Menominee River were misclassified as they were determined to be in a mature reproductive state. The misclassifications could be the result of field-sexing error, environmentally mediated sex reversal, or incomplete linkage of the AllWSex2 marker with the sex determination locus. Environmentally induced sex reversal has been documented in multiple fish species. For instance, starvation and thermal shock during key developmental periods are known to induce female-to-male sex reversals in Medaka (
Olyzias latipes, [
14]) and Nile Tilapia (
Oreochromis niloticus, [
15]), respectively. It is also possible that these individuals were intersex. Intersex individuals occur in wild and cultured sturgeon populations [
16,
17,
18] and, occasionally, in paddlefish [
19]. Intersex individuals have been described in situations of exposure to exogenous sex hormones [
17,
20,
21]; however, it is unclear if these compounds exist in sufficiently high concentrations in the systems that we sampled to cause sex reversal. Sexing errors using the ALLWSex2 marker in lake sturgeon, though small, cannot be considered nonexistent and appear to be biased towards erroneously classifying females as males. This should be considered when utilizing this method in future studies.
All male field-identified fish showed the male peak pattern in their melt curves. However, in 12 male fish (all from the Black River), peaks near the melting temperature of the female-specific peak were observed in addition to the male peak pattern. These extra peaks could be confused with the female-specific peaks, but their average melting temperature was slightly lower than that of the female-specific peaks (74.80 + 0.06 °C vs. 75.12 + 0.05 °C). Care must be taken to discriminate this extra peak found in some males from the female-specific peak in order to avoid misclassification as female.
Given this observation, we suggest that sex be determined by comparing the maximum rate of change in the fluorescence within the melting temperature ranges corresponding to male- and female-specific peaks. The female-specific peak spans temperatures from 73–77 °C. The male-specific peak spans temperatures from 77–81 °C. A plot of the maximum derivatives for these two melting temperature ranges cleanly separates the males and females (
Figure 2). We have provided an R-script and a linear discriminant model that can be used to calculate these summary statistics from raw melt curve data and determine sex in an automated fashion. Note that this methodology produced sex assignments that were identical to those described above.
The small number of individuals (11) examined with the PCR-based assay in our initial testing [
10] were all from one population (Black River, MI), and the sex assigned by the PCR-based assay agreed with the field-assigned sex in all cases. These 11 samples were included here, and the female samples clearly showed the female-specific peak, while the males clearly showed the male peak pattern. The examination of a larger number of samples during this study exposed some inconsistencies between field-assigned sex and molecular sex determination using the AllWSex2 primers (a 2% mismatch). Additionally, in some males (8.4%), peaks with melting temperatures similar to (but slightly lower than) the female-specific peaks were observed.


