Sea Slugs—“Rare in Space and Time”—But Not Always


1
National Marine Science Centre, Southern Cross University, Bay Drive, Coffs Harbour, NSW 2450, Australia
2
Marine Ecology Research Centre, Southern Cross University, Lismore, NSW 2458, Australia
*
Author to whom correspondence should be addressed.
Diversity 2020, 12(11), 423; https://doi.org/10.3390/d12110423
Submission received: 24 September 2020
/
Revised: 26 October 2020
/
Accepted: 9 November 2020
/
Published: 11 November 2020
(This article belongs to the Section Marine Diversity)
Abstract
:The term “rare in space and time” is often used to typify the spatial and temporal patterns of occurrence of heterobranch sea slugs. However, “rare” in this context has not been clearly defined. In an attempt to provide more insight into the concept of rarity in sea slug assemblages, we analysed abundance data from 209 individual surveys conducted over a 5-year period in a subtropical estuary and a 7-year period on a shallow coastal reef, on the Sunshine Coast, Qld, Australia. Using an ‘intuitive’ method (<10 individuals recorded over the study), and the ‘quartile’ method we assessed numerical rarity (number of individuals of a species seen over the study period) and temporal rarity (frequency of observation). We also assessed numerical rarity using octaves based on log2 abundance bins. The quartile method did not effectively capture either measure of rarity. The octave method, however, fitted closely to subjective classifications of abundance and defined a similar number of species as rare when compared to the intuitive method. Using the octave method, 66% of species in both the estuary and on the reef, were considered as rare. Consequently, we recommend the octave method to allocate abundance classifications. To address the poor fit for temporal classifications based on quartiles, we propose the following as a working model for wider testing: rare ≤25% of surveys; uncommon 26−50%, common 51−75%; and abundant >75%.
1. Introduction
Ecologists have long recognised that many species within a community are represented by very few individuals (e.g., [1]) and highlighted the importance of these species in terms of potential extinction risk and, more recently, for broader ecosystem function (e.g., [2]). For example, Rabinowitz [3] recognised 7 forms of rarity, which reflected combinations of differences across 3 descriptive variables—geographic range, habitat specificity and local population size. Species with both narrow geographic range and strong habitat specificity typified the “classic” concept of rarity, but different combinations of restrictions across each of these 3 variables may result in a species being considered rare. Whilst recognising the variety of causes and classifications of rarity, there has nevertheless been an attempt to generate unifying metrics to numerically define rarity [4]. However, application of “universal” metrics is unlikely to fit all cases [2,5], especially when dealing with taxonomic subsets of a broader community that may be typified by low abundance across most of their range.
Heterobranch sea slugs (Mollusca: Gastropoda) are often referred to as being “rare in space and time” [6,7,8] and thus represent an interesting taxon for exploring the broad use of commonly-used rarity metrics. The initial use of the term “rare in space and time” [9] did not provide a clear quantitative context for its application and, while other authors have also reported sea slugs as rare [6,10], they have, likewise, not quantified the use of the term. Rarity is not only a relative concept, but also an intuitive concept (as cited in [4] (p. 2)), the latter being used by Marshall and Willan [8] as the basis for an abundance scale for sea slug taxa occurring at Heron Island, Great Barrier Reef, Queensland. In taking this approach, the authors also note that their species-specific abundance scale was unlikely to apply to the same species in different geographic locations, and was applied on the basis that low abundance is expected to dominate in sea slug assemblages [8]. More broadly, communities generally include many rare and few common species [11], and there is recognition that standard definitions of rarity are required [5,12], and that multiple measures of rarity may be needed in order to effectively compare among assemblages [2]. Indeed, Gaston [4] lists a number of studies across different taxa and the various criteria used by the authors to numerically define rarity, very few of which provide a rationale for setting cut-off points, whilst other authors [13] have applied 6 abundance categories including rare and very rare. To achieve a standardised method of attributing rarity, Gaston [4] proposed a relative cut-off of the 25th percentile (the first quartile) for abundance. This method ranks species, from lowest to highest, based on their abundance, with the dataset then divided into quarters, the 25th percentile containing species in the lowest quartile. However, as rarity is not evenly distributed across phyla [5], this approach may be difficult to apply to species with different life histories [14] and may not be applicable when assessing sea slugs for which rarity may be more widespread among species [8]. A variation of this method was suggested by Gray et al. [15] in which abundance is summarised on a log2 scale, with relative abundance definitions then based upon quartiles of the resultant histogram bins.
The quartile method [4] has previously been applied to studies of molluscs [2,11,16]. Benkendorff and Przeslawski [2] used this approach to assess distributions of abundance in rocky shore assemblages, allocating 4 categories (rare, uncommon, common, abundant) to the quartile groups. However, because of the large number of low abundance species in their meta-communities of stream invertebrates, Siqueira, Bini, Roque, Marques Couceiro, Trivinho-Strixino and Cottenie [11] extended the definition of rare to species within the first 3 quartiles (to 75%) with the top quartile considered as common. The quartile method has also been applied to the assessment of temporal rarity [2]. These examples clearly indicate the variability in the distribution of abundance among species in different habitats and for different taxa. However, it is also clear that viewing species abundance distributions through this process provides insight into relative rarity amongst different assemblages and may therefore be a useful comparative tool. In the current context, it provides the opportunity to more clearly define the concept of rarity for sea slugs and to explore the likely causes of species abundance distribution patterns.
A number of factors can affect the presence and abundance of sea slugs including water temperature [17,18], availability of food sources [19], larval dispersal [19], and survey method and effort [20,21,22]. Some sea slug species are known to undergo population fluctuations as part of their normal life cycle [23]. They also have limited life spans ranging from weeks to approximately 12 months [19,24].
The majority of studies of sea slug diversity are based on short-term or sporadic data [7,10,17], or data collected in widely-spaced surveys [6,25], with the consequent risk that species may be identified as rare due to data insufficiency [2]. Long-term data are necessary to assess patterns of rarity and to determine if this is due to: temporal variability linked to normal seasonal fluctuations [26]; persistent presence but numerical rarity; or vagrancy. Climate-change-driven poleward range extensions of several species of sea slug [27,28,29] is also resulting in designation of rarity for species occurring at novel locations [30], or as single observations [28]. Although some species may be spatially or numerically rare, there are others that are very common within specific locations [8,31] and to which the blanket term “rare in space and time” does not apply.
The objectives of this study were to: (i) describe patterns of abundance for sea slug assemblages from 2 sites in subtropical eastern Australia; (ii) assess patterns of numerical and temporal rarity using the quartile method [4], quartiles based on bins of abundance on a log2 scale (octaves) [15], and the abundance scale applied to assessments at Heron Island [8]; and, (iii) conduct preliminary exploration of associations among water temperature, species richness and the appearance of rare species. We hypothesised that the data set would contain a high percentage of rare species and a low percentage of frequently observed species. We also hypothesised that there would be a correlation between species richness, numbers of rare species and water temperature based on recent findings from a warm temperate location on Australia’s east coast [32].
2. Materials and Methods
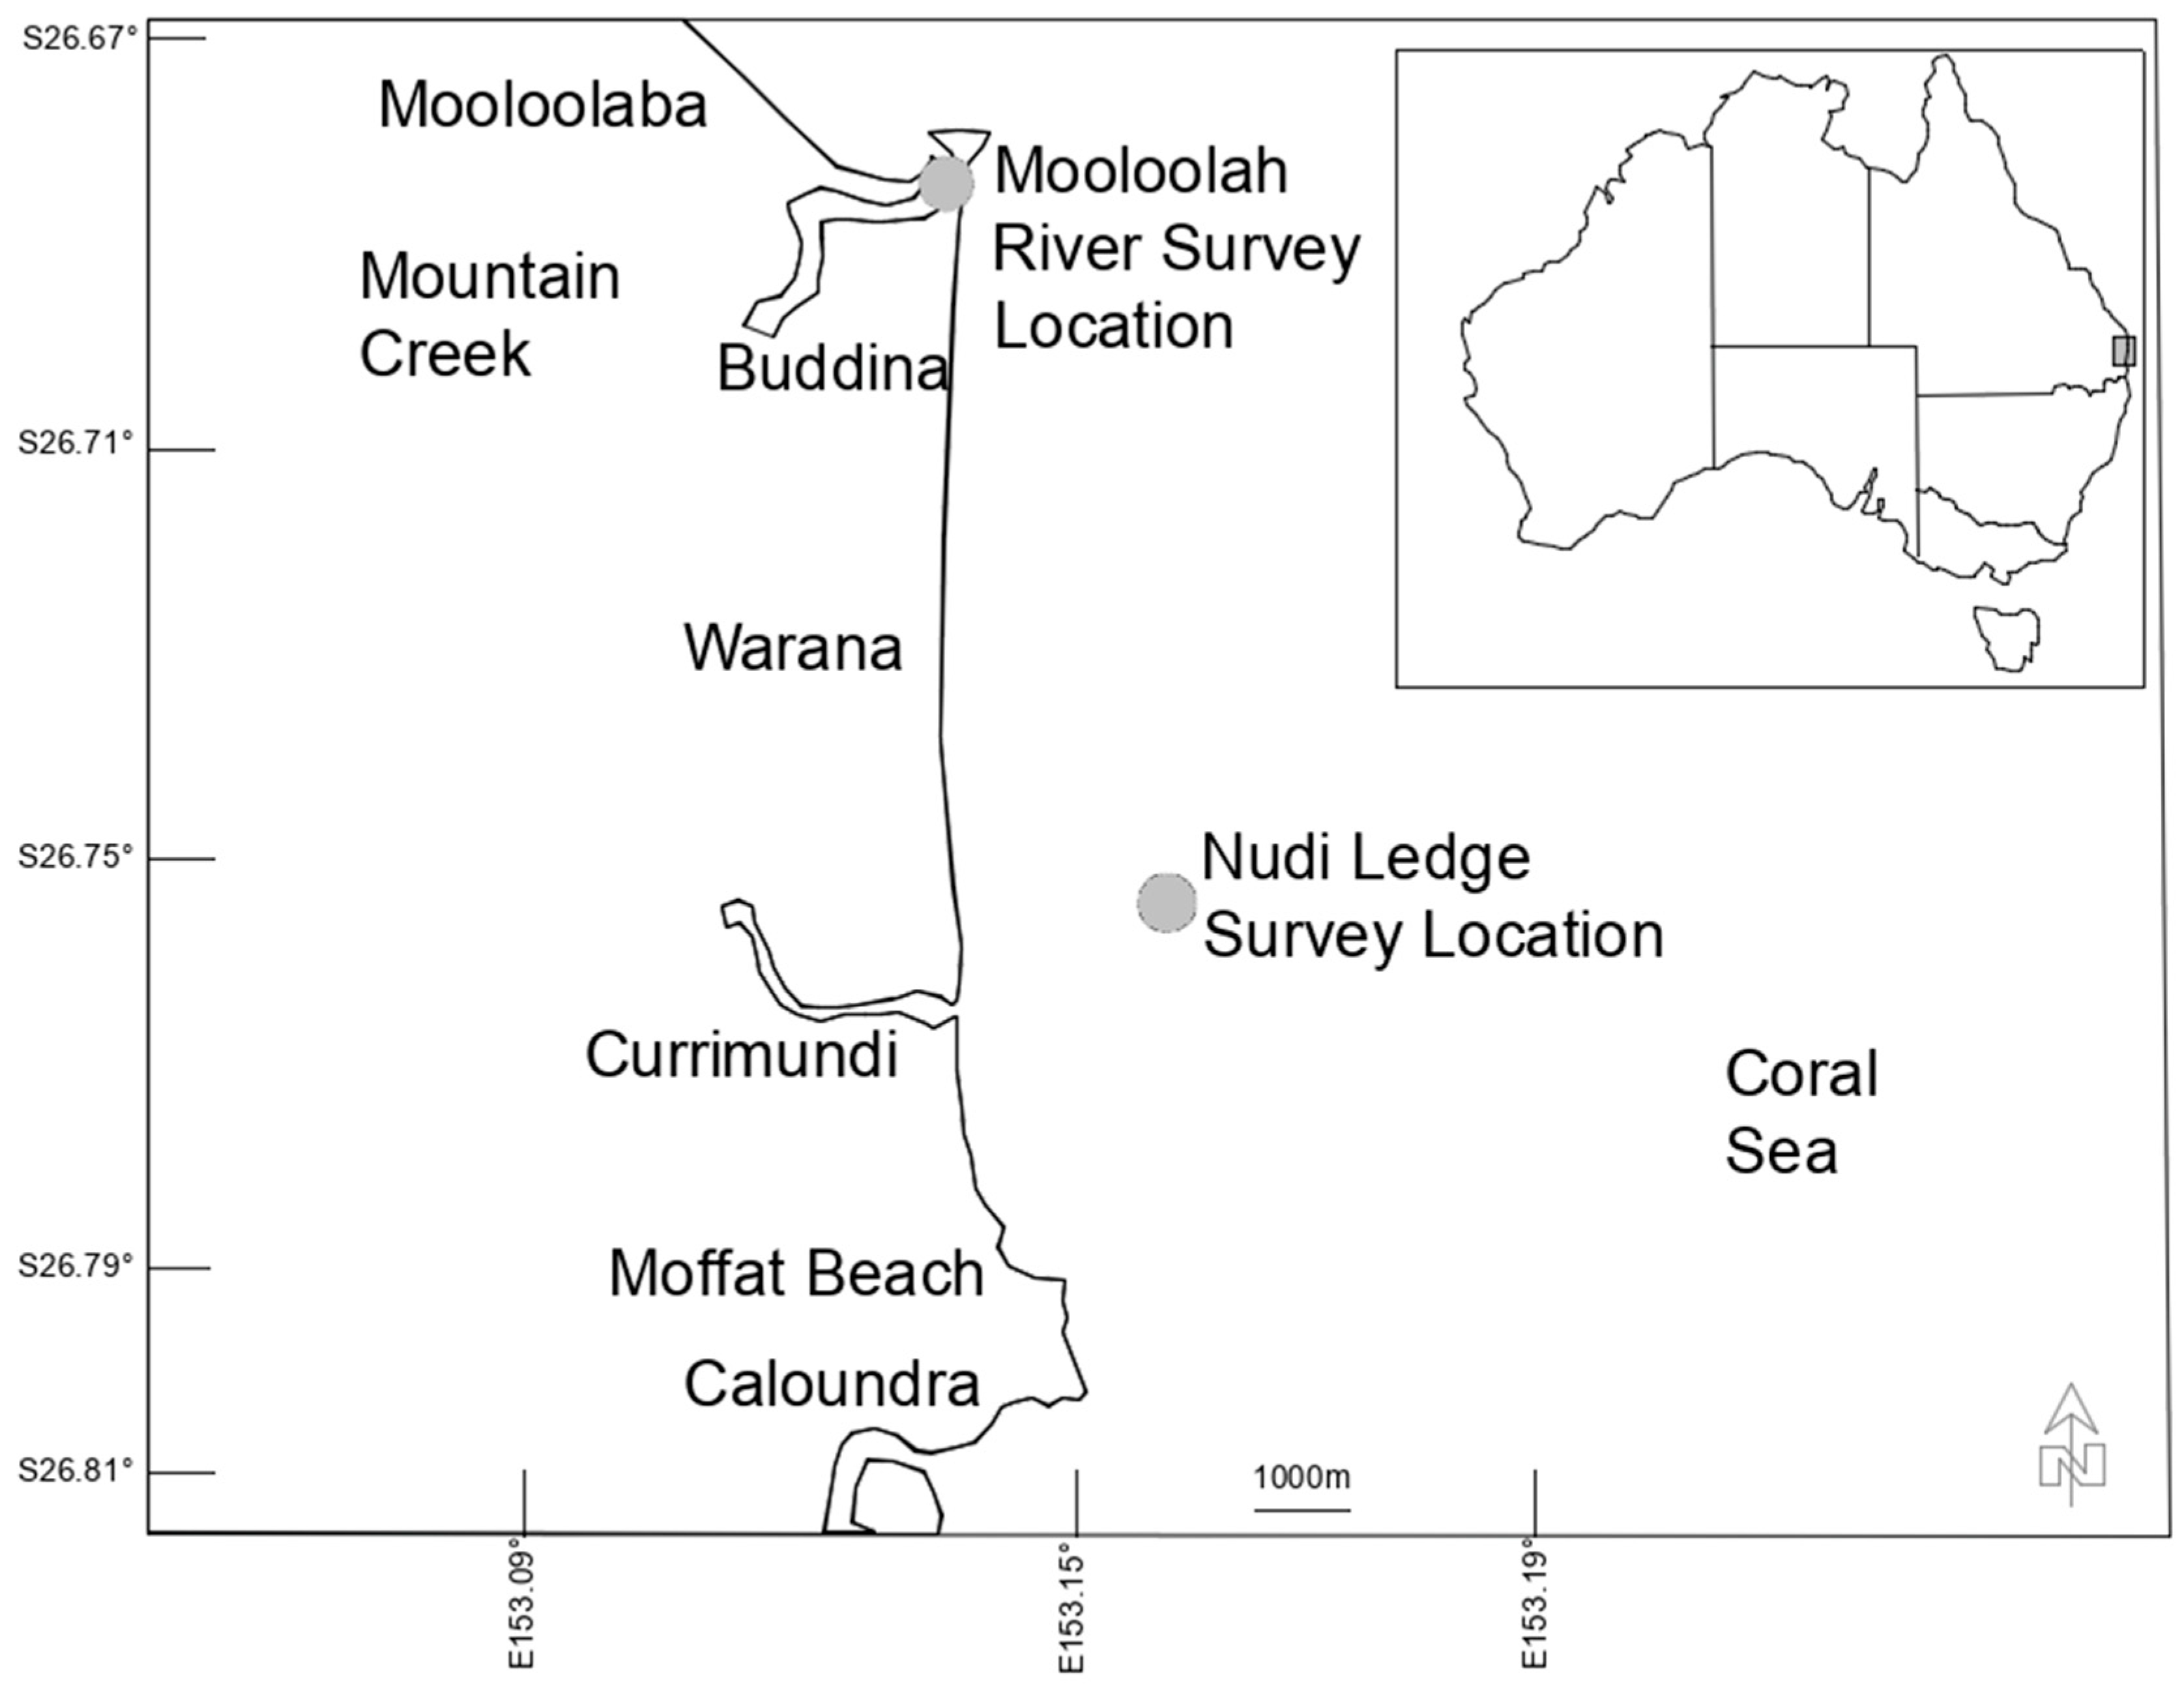
Surveys of heterobranch sea slugs (Heterobranchia: Gastropoda: Mollusca) were conducted on scuba by the first author and colleagues at an estuarine site (La Balsa Park) and a reef site (Nudi Ledge) on the Sunshine Coast, Qld., Australia. Target species included those typically regarded as “sea slugs and allies” [33] which are the main focus of general surveys of marine sea slugs [6,34,35], and recent community-run events (e.g., the Sea Slug Census program [32]). In a formal sense, this included heterobranchs from the infraclass Euthyneura (see Table S1). Data collection from La Balsa Park, in the Mooloolah River, Buddina, (26.6843° S, 153.1356° E) occurred between 8 March 2014 and 7 June 2019, and from Nudi Ledge, Currimundi Reef, (26.7549° S, 153.1583° E) between 6 November 2011 and 19 March 2019 at (Figure 1).
The highest astronomical tide (HAT) at Mooloolah River is 2.21 m, with a mean tidal range of 1.4 m during spring tide and 0.68 m during neap tide (measured upstream at Parrearra Weir) [36]. The river channel is regularly profiled and the river bar regularly dredged (pers. obs.) to maintain clear access for commercial and recreational vessels utilising the harbour. The site is dominated by sandy substrate with scattered rocks that support varying amounts of turf algae, sponges, scattered hydroids, ascidians, hard corals and octocorals (e.g., Melithaea spp. and Dendronephthya spp.). As the site is subject to tidal currents, it was generally surveyed 1 h either side of high tide, with an average survey time of approximately 2 h. The average maximum diving depth was approximately 6 m. This site was surveyed haphazardly over an area approximately 5 m wide by 100 m long per survey. Surveys were conducted both during the day and at night.
Nudi Ledge is a rocky reef that is dominated by leathery soft corals (Sarcophyton spp. and Lobophyton spp.) with low-growing hard corals, ascidians, hydroids, sponges, bryozoans and algae. This site was also surveyed haphazardly, generally over 2 dives per day, giving an average of 2.5 h of survey time per sample day. Diving depth varies from approximately 14 m to 16 m. The search area was generally limited to a maximum of 30 m in any direction from the anchor. The second dive survey was conducted in a different direction to the first dive to avoid double counting.
The following details were recorded for each survey: abundance of each sea slug species found; duration of dive; number of divers; water temperature; and underwater visibility. While there was no a priori defined temporal sequence to the dives, they occurred on a regular basis with intervals between surveys generally no longer than 3 months, except when diving was precluded due to inclement weather.
During each survey, the dive team photographed all heterobranch sea slugs sighted. Species present in high abundance were initially photographically recorded, with additional specimens tallied on an underwater slate. Each diver prepared a list of species and count of specimens from their photographs/slates following each survey. The list was later collated between all divers and the highest individual count of specimens per species was recorded.
As records span >5 years, names were updated prior to data compilation to comply with recent taxonomic reclassifications. Nomenclature in this paper follows the World Register of Marine Species [37]. It is noted that taxonomic revision of Coryphellina rubrolineata (O’Donoghue, 1929) has been undertaken resulting in the identification of a new species (Coryphellina lotos Korshunova, Martynov, Bakken, Evertsen, Fletcher, Mudianta, Saito, Lundin, Schrödl and Picton, 2017). However as the revision by Korshunova et al. [38] did not include any specimens from the survey site, the name Coryphellina rubrolineata has been retained for the purposes of this paper. All photographs were reviewed and species identifications checked against published references [33,39,40]. When no exact match was available, species were assigned a genus and species number. The dataset included 156 undescribed species (see Results, below). Where the potential exists for these species to be colour variations of another species, they were combined. Species recorded only as empty shells were removed from the dataset to avoid inclusion of those that may not be present in the survey location as live specimens [41].
The distribution of species abundance, and rarity, were initially described using descriptive plots, and then analysed in 3 different ways—using the abundance scale defined by Marshall and Willan [8], whereby species represented by <10 individuals over the survey period are classified as rare, using the quartile method [4], and using quartiles based on log2 abundance bins [15,42]. Species rarity is commonly assessed on local abundance (numerical) [43], percentage of surveys (temporal) [2] and size of geographical range [4]. As our data were limited to 2 study sites, only 2 measures of rarity could be assessed, local abundance and percentage of surveys in which they occurred. Numerical rarity was based on the rank of total number of individuals of a species seen over the entire study period. A cut-off of 25% (the 25th percentile or first quartile) was applied, with those species falling within the first quartile designated as rare. To visualise the abundance, a frequency distribution plot was developed using groupings starting at 1 individual, then 2 and 3 individuals, 4–5, 6–10, then in groups of 10 to 50, then 51–100, 101–500 and >500. These groupings follow those utilised by Benkendorff and Przeslawski [2] to explore patterns for intertidal molluscs. We also assessed abundance distributions by plotting a histogram of abundances (octaves) on a log2 scale and allocating quartiles to the bins (e.g., with 8 bins, the 4 quartiles comprise bins 1 and 2, 3 and 4, 5 and 6, 7 and 8, respectively) [15,42]. The rank of percentage of surveys in which a species was recorded was used to calculate temporal rarity. Numerical and temporal values for the 2nd (50th percentile), 3rd (75th percentile) and 4th quartile were also calculated. To explore patterns in frequency of observation, frequency distribution was calculated based on survey groups of 1%, 2%, 3%, 4–5%, 6–10%, then values of 11% up to 100%, in groups of 10 following Benkendorff and Przeslawski [2]. Following perceived limitations of the objective classification, we also explored the use of alternate cut-off values for temporal rarity.
To evaluate patterns of seasonal abundance of frequently observed species (those observed on more than 75% of surveys), data were first averaged over replicate surveys conducted within a specific season, and rounded up to provide a single data point (which is the average number of specimens sighted per survey per season). Averaging of the data was required to allow for multiple dives per month per season where applicable. Thus, data were averaged over the month for months with multiple surveys and rounded up to provide an average number of species sighted per survey per month. The Pearson correlation coefficient was used to test for correlation between average monthly species richness, average monthly water temperature and number of rare species.
3. Results
We recorded a total of 251 species from 41 families in the Mooloolah River, which included 156 undescribed species. The data were recorded over 168 surveys over the >5 year duration of the study. Abundance per species ranged from 1 to 2964 individuals and frequency of sightings from 1 to 151 (90%) surveys. At Nudi Ledge, over the >7 year duration of the study, we recorded 188 species from 35 families over 41 surveys. Species abundance ranged from 1 to 935 individuals and frequency of sightings from 1 to 41 (100%) surveys. Only 62 species were common to both sites (see Table S1). The distributions for species abundance (Figure 2A), and frequency of sighting (%) (Figure 2B) are both skewed to the right due to the large number of low abundance and infrequently sighted species.
3.1. Numerical Rarity
Utilising the abundance scale of Marshall and Willan [8], 173 of the 251 species in the Mooloolah River (68%), and 131 of the 188 species at Nudi Ledge (69%), could be considered rare with <10 individuals recorded over the entire survey. Using the quartile method [4] to define numerically rare species, both sites returned similar values; the first quartile occurred at 1 individual and so only 85 species (34%) in the Mooloolah River and 61 species (32%) at Nudi Ledge could be considered numerically rare. The second quartile cut-off occurred at 3 individuals and included 52 species (21%) for the Mooloolah River and 40 species (21%) for Nudi Ledge. The third quartile cut-offs differed slightly at 14 individuals (52 species, 21%) for the Mooloolah River and 13 individuals (41 species, 22%) for Nudi Ledge. The fourth quartiles contained 62 species (25%) for the Mooloolah River and 46 species (24%) for Nudi Ledge (Table 1A).
3.2. Temporal Rarity
The first quartile for temporal rarity occurred at 1% of the surveys in the Mooloolah River and 2% of the surveys at Nudi Ledge. Therefore, 96 and 71 species (38%), respectively, could be considered temporally rare. The remaining quartiles differed slightly. For Mooloolah River the second quartile occurred at 2% of surveys (52 species, 21%), the third quartile at 5% of surveys (42 species, 17%) and the fourth quartile at >5% of surveys (61 species, 24%). The second-quartile cut-off for Nudi Ledge occurred at 5% of surveys (27 species, 14%), the third quartile at 20% of surveys (44 species, 23%) and the upper quartile at >20% of surveys (46 species, 24%) (Table 2).
The results (Table 2) indicate a species observed on 5% or 20% of surveys is not classified as rare, therefore, temporal variation cut-offs were recalculated as a direct percentage of surveys, being ≤25% (rare), 26−50% (uncommon), 51−75% (common) and >75% (abundant). Using the revised cut-off values based on percentage of surveys, the number of species classified as temporally rare increased to 238 in the Mooloolah River and 147 at Nudi Ledge. The number of species classified as temporally abundant was reduced to 4 in the Mooloolah River and 10 at Nudi Ledge (Table 3).
3.3. Frequently Observed Species
Only 4 species were observed on more than 75% of the surveys in the Mooloolah River. These were Hypselodoris obscura (Stimpson, 1855) (90% of surveys), Goniobranchus daphne (Angas, 1864) (83% of surveys), Goniodoridella sp. (undescribed) (82% of surveys) and Pteraeolidia semperi (Bergh, 1870) (82% of surveys). A total of 10 species was observed on more than 75% of the surveys at Nudi Ledge. These were Doriprismatica atromarginata (Cuvier, 1804) (100% of surveys), Phyllida ocellata Cuvier, 1804 (98% of surveys), Phyllidiella pustulosa (Cuvier, 1804) (98% of surveys), Phyllidiella lizae Brunkhorst, 1993 (95% of surveys), Hypselodoris jacksoni N. G. Wilson and Willan, 2007 (93% of surveys), Sagaminopteron ornatum Tokioka and Baba, 1964 (93% of surveys), Pteraeolidia semperi (Bergh, 1870) (85% of surveys), Bornella anguilla S. Johnson, 1984 (78% of surveys), Chromodoris kuiteri Rudman, 1982 (78% of surveys) and Dermatobranchus ornatus (Bergh, 1874) (78% of surveys) (Figure 4).
3.3.1. Trends for Frequently Observed Species—Mooloolah River
Pteraeolidia semperi showed the clearest seasonal pattern of abundance in the Mooloolah River with yearly peaks in autumn, with the exception of 2019. Hypselodoris obscura initially peaked in abundance during summer in 2015, 2016 and 2017. However, the peak occurred in autumn in 2018 and 2019. Goniodoridella sp. initially peaked during winter in 2014 to 2017, with autumn maxima in 2018 and 2019, whilst Goniobranchus daphne was generally observed in lower abundance during winter. None of the species were recorded in Autumn 2015 due to a significant flood event.
3.3.2. Trends of Frequently Observed Species—Nudi Ledge
The species with the clearest seasonal pattern of abundance were Pteraeolidia semperi which generally exhibited yearly peaks in autumn and Doriprismatica atromarginata which generally peaked in spring. Phyllidiella pustulosa, Phyllidia ocellata and Phyllidiella lizae remained relatively constant all year, whilst the remaining species did not appear to follow an obvious seasonal pattern.
3.4. Correlation between Biotic Variables and Water Temperature
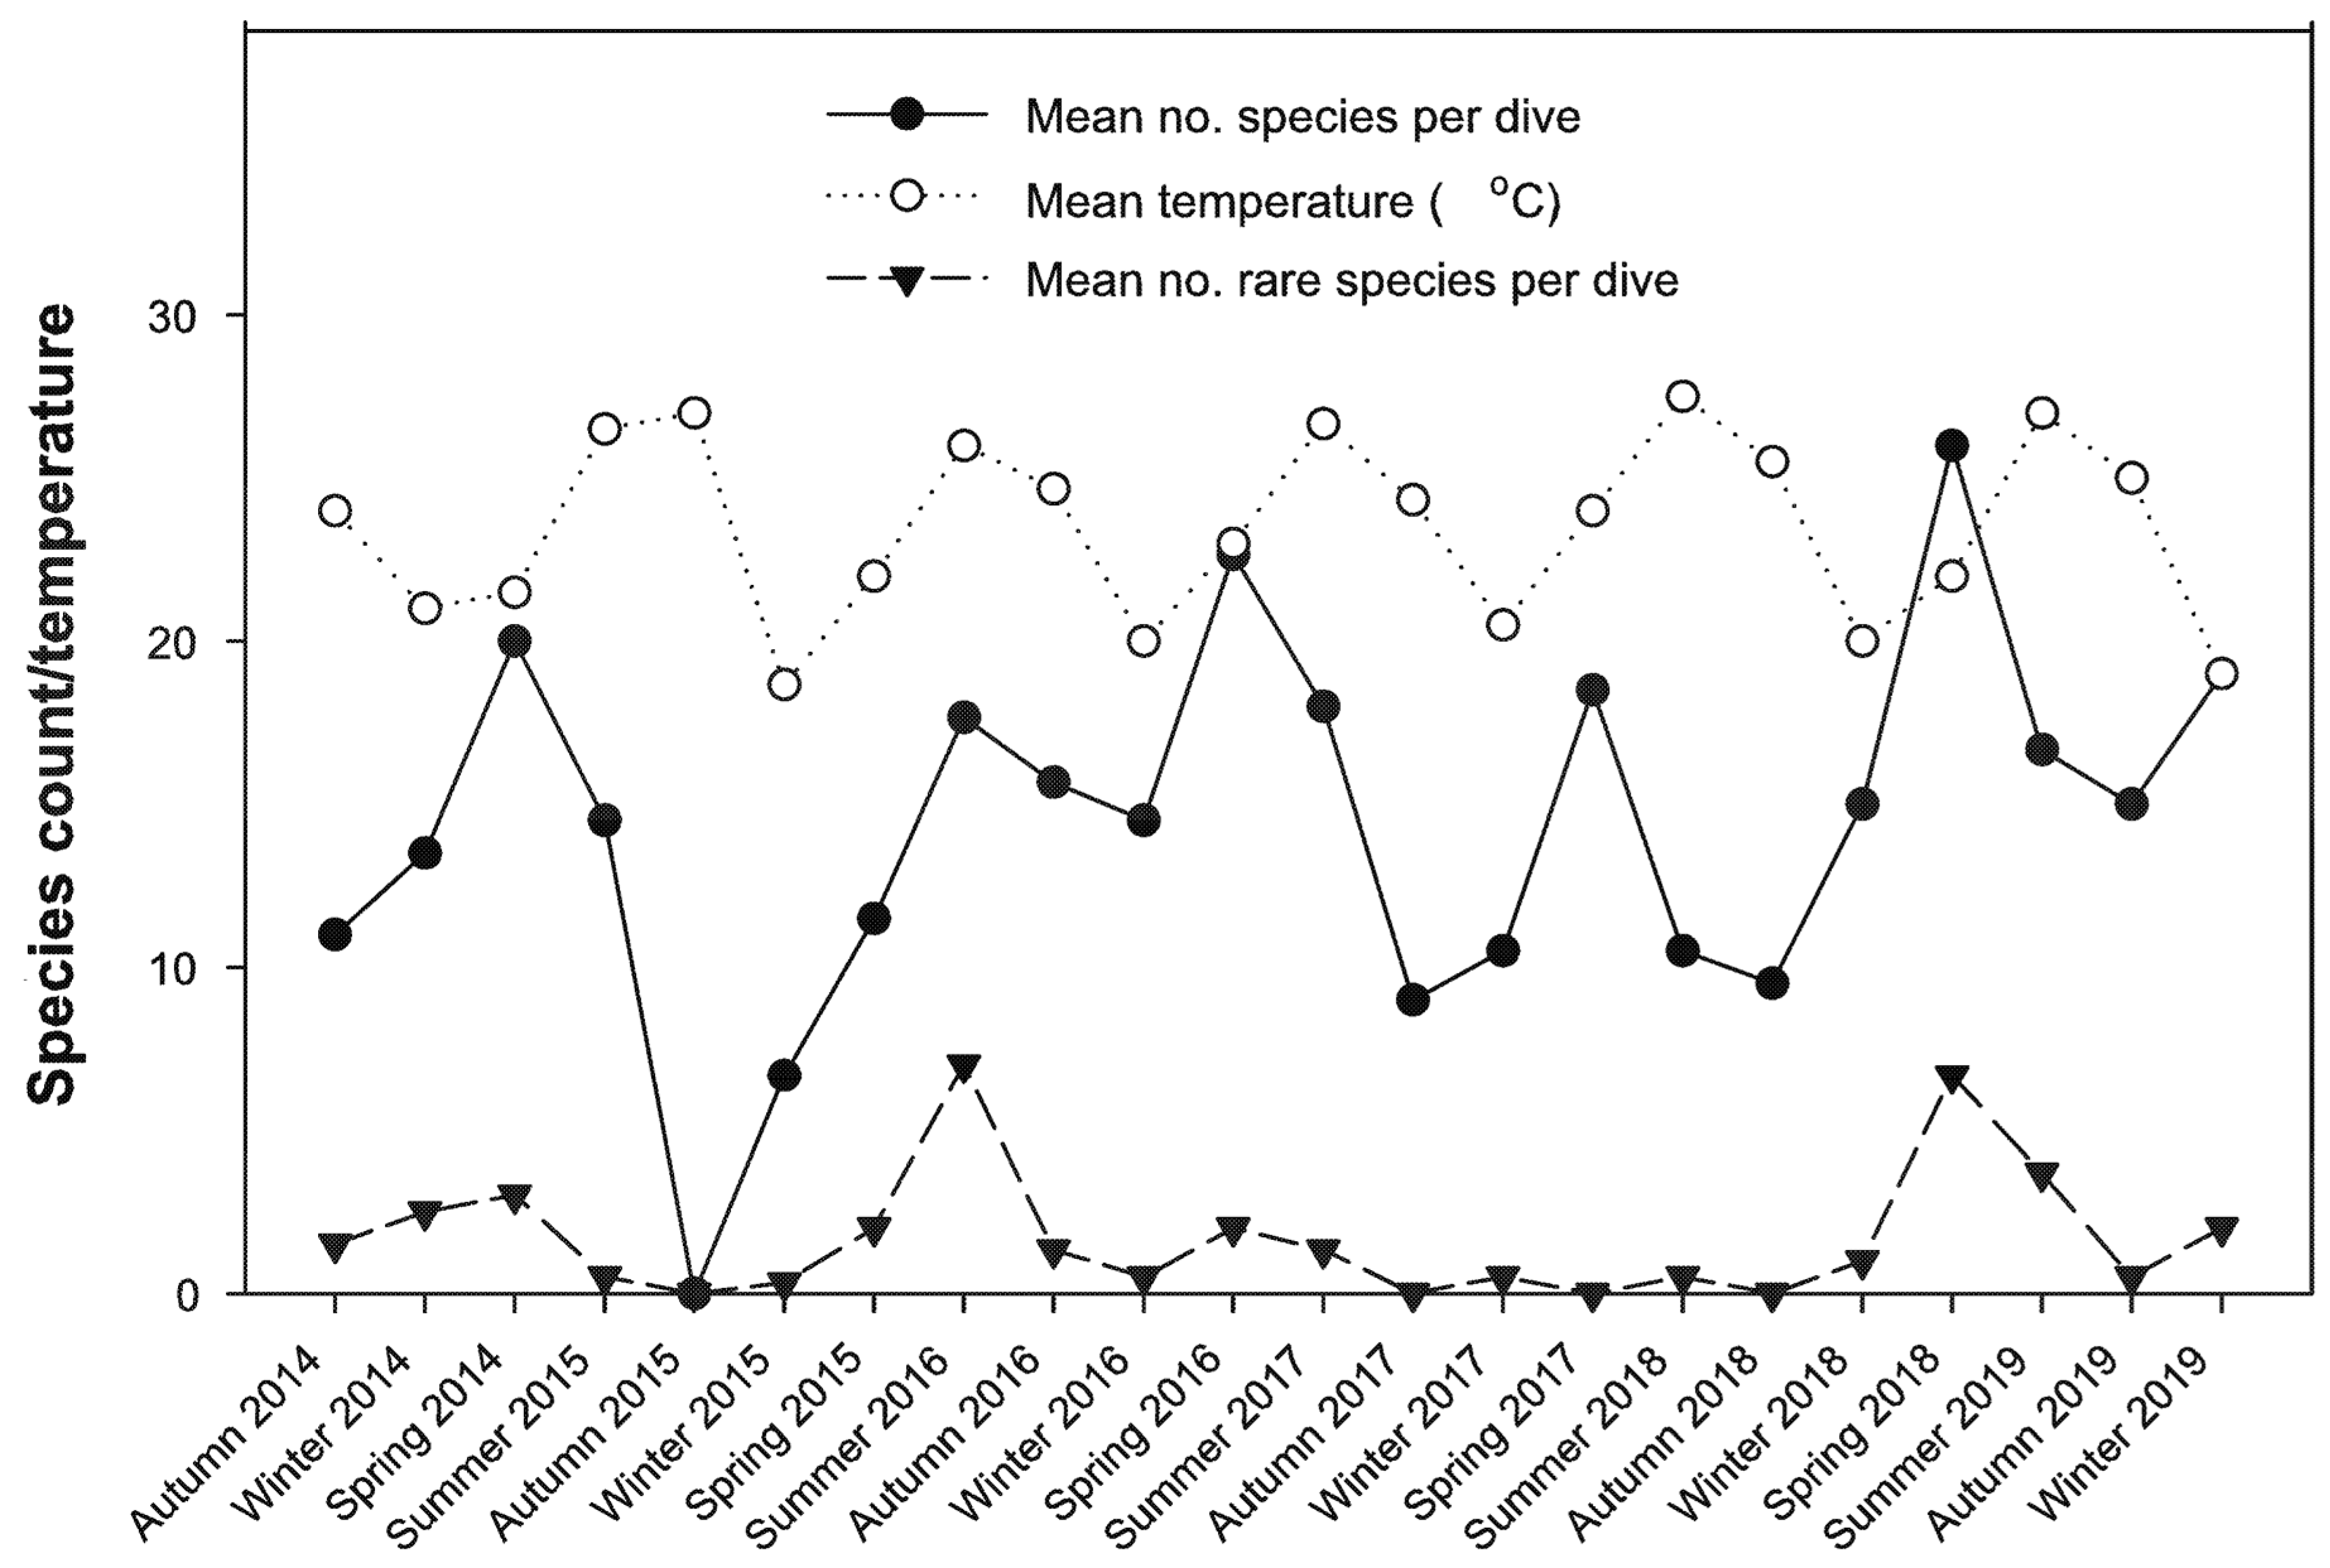
Mean seasonal water temperature and mean seasonal species richness in the Mooloolah River did not show matching peaks (Figure 5) (r = 0.017, p > 0.05). However, for that analysis to be significant would imply an instantaneous response to water temperature which is unlikely. It is more likely that, while larvae may be transported from tropical locations during peak temperatures (partially mediated by the East Australia Current), increases in species richness will lag and also be dependent on availability of food resources. Repeating the analysis with a one-season (r = 0.316, p = 0.034) and two season lag in mean species richness improved the correlation coefficient with the best fit for the two-season lag (r = 0.452, p = 0.002). Note that species richness declined significantly in March 2015 due to flooding caused by a low pressure system (ex-tropical cyclone Marcia). No significant correlation was detected between the number of rare species recorded each season and the water temperature, but there was a strong correlation between average number of species and number of rare species (r = 0.571, p < 0.001).
Associations between mean seasonal species richness and mean seasonal water temperature were less clear for Nudi Ledge with no significant relationships for contemporaneous comparisons (r = 0.097, p = 0.660) or for a one-season (r = 0.144, p = 0.523), or two-season (r = 0.107, p = 0.644), lag. A significant positive correlation (r = 0.618, p = 0.002) was detected between mean number of species and number of rare species in each season.
4. Discussion
Using long-term data sets that provide much-needed, additional ecological data on sea slug assemblages in a subtropical location, this study explored the distribution of abundance among species to see if commonly-used models are useful for describing rarity. Studies assessing distribution typically use the categories of rare, uncommon, common and abundant [2,44], although extra categories are sometimes included [8,13,45]. We found that the quartile method as applied in other studies underrepresented rarity and over represented abundant species. In contrast, the octave method provided data which matched a priori, subjective impressions, and were most consistent with the intuitive method applied to sea slug abundance from long-term studies at Heron Island. For classifying temporal rarity, quartile groupings were likewise considered of limited value and we therefore propose alternative cut-offs to better represent this component of rarity.
Using the abundance scale adopted by Marshall and Willan [8], 173 species (68%) could be considered rare in the Mooloolah River and 131 species (69%) rare at Nudi Ledge (i.e., less than 10 individuals observed over the survey period). These values are similar to those observed during an 18-year study at Heron Island in which 174 species from 262 species (66%) were considered to be rare [8]. This differs from the results obtained following the Gaston [4] quartile definition of rarity which suggested 85 numerically rare species (34%) for Mooloolah River and 61 species (32%) for Nudi Ledge. With the lowest quartile containing an average of 1 individual per species, our results are similar to those recorded for molluscs in New Caledonia [16], and the NSW south coast [2]. However, the additional quartile cut-offs (3 individuals—uncommon; 14/13 individuals—common; >14/>13 abundant) do not adequately reflect expected usage of these terms [2]. Thus, the second quartile includes species for which only 2 or 3 specimens were sighted over the entire study period, but 8 of these species found in the Mooloolah River, and 7 at Nudi Ledge, were observed in just 1 survey. The likelihood of observing these species on a survey at the study site would be considered very low and therefore a classification other than rare cannot be supported. At the higher end of the abundance classification, the upper abundance quartile for Mooloolah River is defined as >14 specimens. As the survey period covers >60 months, this means that a species represented by only 4 specimens per year would be classified as abundant which, again, cannot be supported.
In contrast, the octave method provided similar definitions of rarity to the intuitive method and also provided definitions of other abundance classifications that aligned with what we considered to be intuitive cut-offs. While this method has been discussed in the broader literature covering species abundance distributions, we were unable to find many practical applications of the method in the published literature [15,42], but our results support this as a useful, objective approach.
As has been noted before [2,5], application of “standard” definitions of categories are unlikely to fit all situations and that is clearly the case here for assessments of temporal rarity. An octave approach to this analysis is likely to be obviated in many cases due to the limited number of surveys available—thus, there would be very few bins on which to base the assessment of quartiles. Here, using the quartile method, the first quartile cut-off is 1 survey or 0.60% of surveys at Mooloolah River and 2% of surveys at Nudi Ledge. This classifies 96 species (38%) at Mooloolah River and 71 species (38%) at Nudi Ledge as temporally rare. The temporal upper quartile for Mooloolah River is >9 observations over the survey period. This equates to an observation rate of approximately 5% of surveys at the lowest end of the quartile range. Given that the survey period encompasses 168 surveys this rate is not intuitively suitable to categorise a species as abundant. The upper quartile at Nudi Ledge is >20% of surveys which differs from the Mooloolah River due to a greater number of species observed on more than 25% of surveys. Applying an intuitive approach to the data, we suggest cut-off values as: rare ≤25% of surveys; uncommon 26−50%; common 51−75%; abundant >75% of surveys. The majority of species at both sites were sighted <20% of the time (Figure 2B). Using these values, at Mooloolah River, only 13 species (5%) were observed on more than 25% of surveys, and only 4 species were observed on more than 75% of surveys. In contrast, 41 species at Nudi Ledge were sighted on more than 25% of the surveys, with 10 species sighted on more than 75% of surveys. Therefore, we consider the proposed temporal cut-off values better represent sea slug populations at the study site. Further testing of these cut-off values on additional datasets is required to explore their wider applicability.
This study was limited to 2 sites, so a regional scale of rarity was not assessed. However, species may be spatially rare but locally abundant with 2 of the species observed frequently in the Mooloolah River, Unidentia sp. and Goniodoridella sp. only being recorded as singletons (one individual sighted in a survey period) and uniques (only recorded on one survey) on coastal reefs in the surrounding area by JS and colleagues (pers. obs.). Therefore, whilst they may be considered common or abundant in the Mooloolah River, they would be classified as rare on the coastal reefs. Therefore, although they may be rare at a survey site, larger populations may exist elsewhere on a regional scale. There is also the potential for species to be numerically rare but not spatially rare [2], only occurring in small numbers but at a large number of locations. Clearly, further study is required to establish rarity of species over a larger geographic scale.
The trends in abundance for the frequently observed species confirm the need to conduct surveys over all seasons and multiple years, with the average abundance changing throughout the year. A species may therefore move from one classification to another (e.g., abundant to rare) and may not be correctly classified if the survey is time-limited, although it is acknowledged that long-term monitoring may be subject to logistic and monetary constraints. The abundance of some species is reported to correlate with seasons [16] and, whilst a species may be rare in some months, at other times it may be locally abundant due to life cycle population fluctuations. The cause of the population fluctuations of the most frequently observed species was not investigated. However, no sea slugs were encountered in the river for several weeks following the significant flood event in late February 2015. Although quantitative data were not collected, personal observations note that the river no longer supported hydroids and had greatly reduced sponge populations. Goniobranchus daphne and Hypselodoris obscura are sponge feeders and Pteraeolidia semperi feeds on hydroids [40]. The food source of the undescribed Goniodoridella is unknown as it has not been observed feeding.
The area of this study is considered a transition zone between tropical waters to the north and temperate waters to the south [46]. The South Equatorial Current flows from east to west across the Pacific Ocean joining the East Australian Current (EAC) in the north of the Australian continent which then transports warm waters southward [47]. The majority of sea slug species produce planktonic larvae [19] which are transported by currents: it is therefore considered likely that vagrant species will be observed in some samples and thus classified as rare. With reports of poleward range extensions of sea slugs due to climate change [21,27,28,48], it could be expected that some of the rare species at the study site will transition from a rare classification to a more abundant category if populations are able to establish. A large number of the species in this dataset (156) are undescribed and whilst some of the species are a match to undescribed species in the Indo-Pacific [33], others are not. Based on the “commonness of rarity” as discussed by Lim et al. [49], these may be genuinely rare species. Many of these species will therefore remain undescribed unless taxonomists have access to specimens and are willing to describe a species based on a single specimen. If species remain undescribed, the geographical range and rarity of that species is difficult to assess.
The results of this study highlight the issues surrounding the use of the quartile model to define rarity in sea slugs when using a dataset with high numbers of low abundance species, and the comparative utility of the octave method using quartiles of bins based on log2 abundance to allocate species to categories. Using this method, the percentage of species in each abundance classification was similar at both sites despite the difference in number of surveys and total species observed. It is also clear that outcomes of classification will depend on the frequency of surveys, their geographical extent, and the duration of the survey, all of which need to be carefully considered in the planning stage, or during the subsequent interpretation of findings.
5. Conclusions
This dataset fits with the common perception that communities generally comprise numerous rare species with fewer common species. However, whilst the majority of species in this study were classified as rare, the abundance and almost constant presence of certain species implies that “rare in space and time” does not apply to all sea slug species. Species may be rare in one habitat but abundant in another, geographically-close location, so the label of rarity needs to include information about the classification method and scales over which it is determined. Our results support the octave method using quartiles of bins based on log2 abundance as a useful, objective approach. However, we also recognise the need for a consistent approach for defining temporal rarity and provide a working model for broader testing.
Supplementary Materials
The following are available online at https://www.mdpi.com/1424-2818/12/11/423/s1, Table S1: Summarised list of species, number of specimens and frequency of sighting.
Author Contributions
J.S. and S.D.A.S. conceived the work; J.S. sourced and summarised the data; J.S. and S.D.A.S. analysed the data; J.S. wrote the paper; S.D.A.S. supervised the project and reviewed and edited the paper. All authors have read and agreed to the published version of the manuscript.
Funding
This research received no external funding.
Acknowledgments
The first author wishes to thank Terry Farr and David Mullins for their continual assistance with species identifications, original data collection, awesome photography and record keeping skills. Our thanks also extend to other divers who participated in collection of the historical data including Sue Churchill, Rogan Draper, Tom Davis, Simon Hartley, Vanessa Knudson and Gary Cobb. The research was performed as part of a Bachelor of Environmental Science (Honours) by the first author. We would also like to thank the anonymous reviewers whose comments helped us improve the manuscript.
Conflicts of Interest
The authors declare no conflict of interest.
References
- Preston, F.W. The Commonness, And Rarity, of Species. Ecology. 1948, 29, 254–283. [Google Scholar] [CrossRef]
- Benkendorff, K.; Przeslawski, R. Multiple measures are necessary to assess rarity in macro-molluscs: A case study from southeastern Australia. Biodivers. Conserv. 2008, 17, 2455–2478. [Google Scholar] [CrossRef]
- Rabinowitz, D. Seven forms of rarity. In The Biological Aspects of Rare Plant Conservation; Synge, H., Ed.; John Wiley & Sons: Somerset, NJ, USA, 1981. [Google Scholar]
- Gaston, K.J. Rarity; Chapman & Hall: London, UK, 1994. [Google Scholar]
- Leroy, B.; Gallon, R.; Feunteun, E.; Robuchon, M.; Frédéric, Y. Cross-taxon congruence in the rarity of subtidal rocky marine assemblages: No taxonomic shortcut for conservation monitoring. Ecol. Indic. 2017, 77, 239–249. [Google Scholar] [CrossRef] [Green Version]
- Eisenbarth, J.H.; Undap, N.; Papu, A.; Schillo, D.; Dialao, J.; Reumschüssel, S.; Kaligis, F.; Bara, R.; Schäberle, F.T.; König, M.G.; et al. Marine Heterobranchia (Gastropoda, Mollusca) in Bunaken National Park, North Sulawesi, Indonesia—A Follow-Up Diversity Study. Diversity 2018, 10, 127. [Google Scholar] [CrossRef] [Green Version]
- Larkin, M.F.; Smith, S.D.A.; Willan, R.C.; Davis, T.R. Diel and seasonal variation in heterobranch sea slug assemblages within an embayment in temperate eastern Australia. Mar. Biodivers. 2018, 48, 1541–1550. [Google Scholar] [CrossRef]
- Marshall, J.G.; Willan, R.C. Nudibranchs of Heron Island, Great Barrier Reef: A survey of the Opisthobranchia (sea slugs) of Heron and Wistari Reefs; Backhuys Publishers: Leiden, The Netherlands, 1999. [Google Scholar]
- Willan, R.; Morton, J. Marine Molluscs Part 2 Opisthobranchia. Leigh Laboratory Bulletin 13; University of Auckland, Leigh Marine Laboratory: Auckland, New Zealand, 1984. [Google Scholar]
- Tanamura, D.; Hirose, E. Seasonal Occurrence of Gastropterids (Gastropoda: Cephalaspidea) and Their Habitat Selection in a Subtropical Back-reef on Okinawajima Island (Ryukyu Archipelago, Japan). Zool. Stud. 2017, 56, 1–8. [Google Scholar] [CrossRef]
- Siqueira, T.; Bini, L.M.; Roque, F.O.; Marques Couceiro, S.R.; Trivinho-Strixino, S.; Cottenie, K. Common and rare species respond to similar niche processes in macroinvertebrate metacommunities. Ecography 2012, 35, 183–192. [Google Scholar] [CrossRef]
- Burlakova, L.; Karatayev, A.; Karatayev, V.; May, M.; Bennett, D.; Cook, M. Endemic species: Contribution to community uniqueness, effect of habitat alteration, and conservation priorities. Biol. Conserv. 2011, 144, 155–165. [Google Scholar] [CrossRef]
- Smith, S.D.A.; Peregrin, L.S. The shelled gastropods of the Solitary Islands Marine Park, northern New South Wales, Australia. Molluscan Res. 2020, 40, 142–149. [Google Scholar] [CrossRef]
- Flather, C.H.; Sieg, C.H. Species Rarity: Definition, Causes and Classifications; Island Press: Washington, DC, USA, 2007. [Google Scholar]
- Gray, J.S.; Bjørgesæter, A.; Karl, I.U. On Plotting Species Abundance Distributions. J. Anim. Ecol. 2006, 75, 752–756. [Google Scholar] [CrossRef]
- Bouchet, P.; Lozouet, P.; Maestrati, P.; Heros, V. Assessing the magnitude of species richness in tropical marine environments: Exceptionally high numbers of molluscs at a New Caledonia site. Biol. J. Linn. Soc. 2002, 75, 421–436. [Google Scholar] [CrossRef]
- Betti, F.; Bava, S.; Cattaneo-Vietti, R. Composition and seasonality of a heterobranch assemblage in a sublittoral, unconsolidated, wave-disturbed community in the Mediterranean Sea. J. Molluscan Stud. 2017, 83, 325–332. [Google Scholar] [CrossRef]
- Gaston, K.J. Global patterns in biodiversity. Nature 2000, 405, 220. [Google Scholar] [CrossRef]
- Behrens, D.W. Nudibranch Behavior; New World Publications Inc.: Jacksonville, FL, USA, 2007. [Google Scholar]
- Crocetta, F.; Macali, A.; Furfaro, G.; Cooke, S.; Villani, G.; Valdes, A. Alien molluscan species established along the Italian shores: An update, with discussions on some Mediterranean “alien species” categories. ZooKeys 2013, 277, 91–108. [Google Scholar] [CrossRef] [PubMed] [Green Version]
- Ekimova, I.A.; Antokhina, T.I.; Schepetov, D.M. “Invasion” in the Russian Arctic: Is global Climate Change a real driver? A remarkable case of two nudibranch species. Ruthenica 2019, 29, 103–113. [Google Scholar]
- Evertsen, J.; Bakken, T. Diversity of Norwegian sea slugs (Nudibranchia): New species to Norwegian coastal waters and new data on distribution of rare species. Fauna Nor. 2013, 32, 45–52. [Google Scholar] [CrossRef] [Green Version]
- Rudman, W. Population Fluctuations. Sea Slug Forum. Available online: http://www.seaslugforum.net/factsheet/popfluc (accessed on 27 September 2019).
- Debelius, H.; Kuiter, R.H. Nudibranchs of the World; IAKN-Unterwasserarchiv: Frankfurt, Germany, 2007. [Google Scholar]
- Kaligis, F.; Eisenbarth, J.-H.; Schillo, D.; Dialao, J.; Schäberle, T.F.; Böhringer, N.; Bara, R.; Reumschüssel, S.; König, G.M.; Wägele, H.; et al. Second survey of heterobranch sea slugs (Mollusca, Gastropoda, Heterobranchia) from Bunaken National Park, North Sulawesi, Indonesia — how much do we know after 12 years? Mar. Biodivers. Rec. 2018, 11, 2. [Google Scholar] [CrossRef] [Green Version]
- Davis, T.R.; Harasti, D.; Kelaher, B.; Smith, S.D.A. Spatial and temporal variation in subtidal molluscan diversity amongst temperate estuarine habitats. Mar. Ecol. 2017, 38. [Google Scholar] [CrossRef]
- Arias, A.; Crocetta, F. Umbraculum umbraculum (Gastropoda: Heterobranchia) spreading northwards: Additional evidence to the “tropicalization” of the Bay of Biscay. Cah. Biol. Mar. 2016, 57, 285–286. [Google Scholar]
- Nimbs, M.; Smith, S.D.A. Beyond Capricornia: Tropical Sea Slugs (Gastropoda, Heterobranchia) Extend Their Distributions into the Tasman Sea. Diversity 2018, 10, 99. [Google Scholar] [CrossRef] [Green Version]
- Schultz, S.T.; Goddard, J.H.; Gosliner, T.M.; Mason, D.E.; Pence, W.E.; McDonald, G.R.; Pearse, V.B.; Pearse, J.S. Climate-index response profiling indicates larval transport is driving population fluctuations in nudibranch gastropods from the northeast Pacific Ocean. Limnol. Oceanogr. 2011, 56, 749. [Google Scholar] [CrossRef]
- O’Hara, T. Endemism, rarity and vulnerability of marine species along a temperate coastline. Invertebr. Syst. 2002, 16, 671–684. [Google Scholar] [CrossRef]
- Tanamura, D.; Hirose, E. Population Dynamics of the Sea Slug Plakobranchus ocellatus (Opisthobranch: Sacoglossa: Elysioidea) on a Subtropical Coral Reef off Okinawa-jima Island, Ryukyu Archipelago, Japan. Zool. Stud. 2016, 55, 42. [Google Scholar] [CrossRef]
- Smith, S.D.A.; Davis, T.R. Slugging it out for science: Volunteers provide valuable data on the diversity and distribution of heterobranch sea slugs. Molluscan Res. 2019, 39, 214–223. [Google Scholar] [CrossRef]
- Gosliner, T.M.; Valdes, A.; Behrens, D.W. Nudibranch & Sea Slug Identification Indo-Pacific, 2nd ed.; New World Publications Inc.: Jacksonville, FL, USA, 2018. [Google Scholar]
- Nimbs, M.J.; Smith, S.D.A. An illustrated inventory of the sea slugs of New South Wales, Australia (Gastropoda: Heterobranchia). R. Soc. Vic. 2017, 128, 44–113. [Google Scholar] [CrossRef]
- Nimbs, M.J.; Hutton, I.; Davis, T.R.; Larkin, M.F.; Smith, S.D.A. The heterobranch sea slugs of Lord Howe Island, NSW, Australia (Mollusca: Gastropoda). Proc. R. Soc. Vic. 2020, 132, 12–41. [Google Scholar] [CrossRef]
- Maritime Safety Queensland. Tidal Planes. Available online: https://www.msq.qld.gov.au/Tides/Tidal-planes (accessed on 26 June 2019).
- WoRMS Editorial Board. World Register of Marine Species. Available online: http://www.marinespecies.org (accessed on 27 March 2019).
- Korshunova, T.; Martynov, A.; Bakken, T.; Evertsen, J.; Fletcher, K.; Mudianta, I.; Saito, H.; Lundin, K.; Schrödl, M.; Picton, B. Polyphyly of the traditional family Flabellinidae affects a major group of Nudibranchia: Aeolidacean taxonomic reassessment with descriptions of several new families, genera, and species (Mollusca, Gastropoda). ZooKeys 2017, 717, 1–139. [Google Scholar] [CrossRef] [Green Version]
- Burn, R. Nudibranchs and Related Molluscs; Museum Victoria: Melbourne, Australia, 2015. [Google Scholar]
- Coleman, N. Nudibranchs Encyclopedia, 2nd ed.; Masalai Press and Underwater Australasia: Oakland, Australia; Byron Bay, CA, USA, 2015. [Google Scholar]
- Crocetta, F.; Poursanidis, D.; Tringali, L.P. Biodiversity of sea slugs and shelled relatives (Mollusca: Gastropoda) of the Cretan Archipelago (Greece), with taxonomic remarks on selected species. Quat. Int. 2015, 390, 56–68. [Google Scholar] [CrossRef]
- Borges, P.A.V.; Ugland, K.I.; Dinis, F.; Gaspar, C. Insect and spider rarity in an oceanic island (Terceira, Azores): True rare and pseudo-rare species. In Insect Ecology and Conservation; Fattorini, S., Ed.; Research Signpost: Kerala, India, 2008; pp. 47–70. [Google Scholar]
- Harnik, P.G.; Simpson, C.; Payne, J.L. Long-term differences in extinction risk among the seven forms of rarity. Proc. R. Soc. B. 2012, 279. [Google Scholar] [CrossRef]
- Murphy, M.J. A survey of the marine bivalves and gastropods of Shelly Beach, Port Macquarie, on the north coast of New South Wales, Australia. Vic. Nat. 2015, 132, 73–85. [Google Scholar]
- Poloczanska, E.S.; Smith, S.; Fauconnet, L.; Healy, J.; Tibbetts, I.R.; Burrows, M.T.; Richardson, A.J. Little change in the distribution of rocky shore faunal communities on the Australian east coast after 50 years of rapid warming. J. Exp. Mar. Biol. Ecol. 2011, 400, 145–154. [Google Scholar] [CrossRef]
- DeVantier, L.; Williamson, D.; Willan, R. Nearshore Marine Biodiversity of the Sunshine Coast, South-East Queensland: Inventory of molluscs, corals and fishes July 2010; Baseline Survey Report to the Noosa Integrated Catchment Association: Tewantin, Australia, 2010. [Google Scholar] [CrossRef]
- Short, A.D.; Woodroffe, C.D. The Coast of Australia; Cambridge University Press: New York, NY, USA, 2009. [Google Scholar]
- Almada, F.; Levy, A.; Robalo, J. Not so sluggish: The success of the Felimare picta complex (Gastropoda, Nudibranchia) crossing Atlantic biogeographic barriers. PeerJ 2016, 4, e1561. [Google Scholar] [CrossRef] [PubMed] [Green Version]
- Lim, G.; Balke, M.; Meier, R. Determining Species Boundaries in a World Full of Rarity: Singletons, Species Delimitation Methods. Syst. Biol. 2011, 61, 165–169. [Google Scholar] [CrossRef] [PubMed] [Green Version]
Figure 1.
Location of the 2 study sites—Mooloolah River and Nudi Ledge, Sunshine Coast, QLD, Australia.
Figure 1.
Location of the 2 study sites—Mooloolah River and Nudi Ledge, Sunshine Coast, QLD, Australia.

Figure 2.
Distributions for species abundance (A), and frequency (%) of sighting (B) across species for heterobranch sea slugs at 2 sites on the Sunshine Coast, Qld.
Figure 2.
Distributions for species abundance (A), and frequency (%) of sighting (B) across species for heterobranch sea slugs at 2 sites on the Sunshine Coast, Qld.

Figure 3.
Distributions for species abundance using octaves (abundance bins based on log2 abundance) for heterobranch sea slugs at 2 sites on the Sunshine Coast, Qld.
Figure 3.
Distributions for species abundance using octaves (abundance bins based on log2 abundance) for heterobranch sea slugs at 2 sites on the Sunshine Coast, Qld.

Figure 4.
Images of the most frequently observed species in surveys at both sites. (A)—Goniodoridella sp., (B)—Pteraeolidia semperi, (C)—Hypselodoris obscura, (D)—Goniobranchus daphne, (E)—Hypselodoris jacksoni, (F)—Chromodoris kuiteri, (G)—Bornella anguilla, (H)—Phyllidiella lizae, (I)—Phyllidia ocellata, (J)—Sagaminopteron ornatum, (K)—Doriprismatica atromarginata, (L)—Dermatobranchus ornatus, (M)—Phyllidiella pustulosa.

Figure 5.
Trends in mean seasonal species richness per survey, mean water temperature and mean number of rare species per season—Mooloolah River.
Figure 5.
Trends in mean seasonal species richness per survey, mean water temperature and mean number of rare species per season—Mooloolah River.


Table 1.
Cut-off values (in quartiles—increments of 25%) for measures of numerical rarity, including number (percent) of species falling into each category for (A) the quartile method, and (B) the octave method based on log2 bins. Percentages rounded to nearest whole number.
Table 1.
Cut-off values (in quartiles—increments of 25%) for measures of numerical rarity, including number (percent) of species falling into each category for (A) the quartile method, and (B) the octave method based on log2 bins. Percentages rounded to nearest whole number.
| Quartile | Mooloolah River a | Nudi Ledge a |
|---|---|---|
| A | ||
| First quartile (rare) | 1, 85 (34%) | 1, 61 (32%) |
| Second quartile | 2–3, 52 (21%) | 2–3, 40 (21%) |
| Third quartile | 4–14, 52 (21%) | 4–13, 41(22%) |
| Upper quartile | >14, 62 (25%) | >13, 46 (24%) |
| B | ||
| First quartile (rare) | 1–7, 165 (66%) | 1–7, 124 (66%) |
| Second quartile | 8–63, 65 (26%) | 8–63, 48 (26%) |
| Third quartile | 64–511, 15 (6%) | 64–511, 15(8%) |
| Upper quartile | >511, 6 (2%) | >511, 1 (1%) |
a Bold numbers indicate number of individuals sighted over the entire survey period.
Table 2.
Cut-off values (in quartiles—increments of 25%) for measures of temporal rarity, including number (percent) of species falling into each category. Percentages rounded to nearest whole number.
Table 2.
Cut-off values (in quartiles—increments of 25%) for measures of temporal rarity, including number (percent) of species falling into each category. Percentages rounded to nearest whole number.
| Quartile | Mooloolah River a | Nudi Ledge a |
|---|---|---|
| First quartile (rare) | 1, 96 (38%) | 2, 71 (38%) |
| Second quartile | 2, 52 (21%) | 3–5, 27 (14%) |
| Third quartile | 3–5, 42 (17%) | 6–20, 44 (23%) |
| Upper quartile | >5, 61 (24%) | >20, 46 (24%) |
a Bold numbers represent percentage of surveys on which species were sighted.
Table 3.
Revised cut-off values for measures of temporal rarity, including number of species falling into each category and their percentage (rounded to whole number) of the total species pool.
Table 3.
Revised cut-off values for measures of temporal rarity, including number of species falling into each category and their percentage (rounded to whole number) of the total species pool.
| Cut-Off Value and Classification | Mooloolah River | Nudi Ledge |
|---|---|---|
| 25% of surveys (rare) | 238 (95%) | 147 (78%) |
| 50% of surveys (uncommon) | 7 (39%) | 25 (13%) |
| 75% of surveys (common) | 2 (1%) | 6 (3%) |
| >75% of surveys (abundant) | 4 (2%) | 10 (5%) |
Publisher’s Note: MDPI stays neutral with regard to jurisdictional claims in published maps and institutional affiliations. |
© 2020 by the authors. Licensee MDPI, Basel, Switzerland. This article is an open access article distributed under the terms and conditions of the Creative Commons Attribution (CC BY) license (http://creativecommons.org/licenses/by/4.0/).
Share and Cite
MDPI and ACS Style
Schubert, J.; Smith, S.D.A. Sea Slugs—“Rare in Space and Time”—But Not Always. Diversity 2020, 12, 423. https://doi.org/10.3390/d12110423
AMA Style
Schubert J, Smith SDA. Sea Slugs—“Rare in Space and Time”—But Not Always. Diversity. 2020; 12(11):423. https://doi.org/10.3390/d12110423
Chicago/Turabian StyleSchubert, Julie, and Stephen D. A. Smith. 2020. "Sea Slugs—“Rare in Space and Time”—But Not Always" Diversity 12, no. 11: 423. https://doi.org/10.3390/d12110423
Note that from the first issue of 2016, this journal uses article numbers instead of page numbers. See further details here.