Article

Recently Naturalized Paraserianthes lophantha subsp. lophantha Displays Contrasting Genetic Diversity and Climate Relationships Compared to Native Populations

by
Gillian K. Brown
1,2,3,*,
Elizabeth A. James
2,
Catherine L. Simmons
3 and
Collin W. Ahrens
2,4
1
School of Biosciences, University of Melbourne, Parkville 3010, Australia
2
Royal Botanic Gardens Victoria, Private Bag 2000, South Yarra 3141, Australia
3
Queensland Herbarium, DES, Brisbane Botanic Gardens, Mt Coot-tha Rd, Toowong 4066, Australia
4
Hawkesbury Institute for the Environment, Western Sydney University, Penrith 2750, Australia
*
Author to whom correspondence should be addressed.
Diversity 2020, 12(11), 422; https://doi.org/10.3390/d12110422
Submission received: 14 October 2020 / Revised: 6 November 2020 / Accepted: 9 November 2020 / Published: 10 November 2020
(This article belongs to the Special Issue Evolutionary Ecology and Conservation of Native Plants)

Abstract

:
Paraseriantheslophantha subsp. lophantha (Leguminosae) is native to southwestern Australia, but has become naturalized in eastern Australia and in countries around the world. Previous studies have investigated the introduction sources for P. lophantha subsp. lophantha overseas, but here, we expand on the knowledge of genetic patterns in its native and naturalized range in Australia. Genetic patterns were examined using nine nuclear microsatellite loci and three chloroplast DNA markers. The native populations exhibited phylogeographic patterns, including north-south differentiation, and a genetic signal related to temperature gradients. Naturalized Australian populations displayed lower overall genetic variation and no phylogeographic patterns. Several naturalized populations separated by large distances (350–650 km) shared multi-locus genotypes, supporting the notion of a shared source of germplasm and possible inbreeding due to human-mediated introductions from a limited number of individuals and/or source populations within the native range. We advocate that management strategies are tailored to the distinct conservation aims underpinning conservation in native or naturalized populations. Within the native distribution, management should have a long-term aim to replicate historical evolutionary processes, whereas in naturalized populations, immediate actions may be required to reduce the abundance of P. lophantha subsp. lophantha and minimize its invasive impact on the recipient vegetation.

1. Introduction

The evolutionary history of a species is determined by the spatially and temporally variable environments they experience [1,2,3]. Interactions between the geographic distance, environment, and random genetic processes generate geographically structured genetic patterns often associated with climate cycles [4,5]. Species are dynamic entities whose abundance and distribution fluctuate over time [6] as they adapt to changing or new environments [7]. The natural evolutionary trajectory of a species begins with range expansion determined by the ability to disperse to new habitats, and intrinsic genetic factors that allow adaptation to novel environments [6,8,9]. Eventually, a species may decline to a point where contraction and fragmentation of the geographic range disrupt reproductive and evolutionary processes, resulting in local or absolute extinction [1,10].
The management of native species for biodiversity conservation is usually focused on in-situ strategies that may incorporate genetic resources for activities including genetic rescue and population augmentation [11,12]. However, the human-mediated dispersal of endemic species beyond their native range, but within their country-of-origin, may create a considerable risk for native biodiversity [13] and is an emerging management issue in Australia [14]. In recent decades, human-mediated dispersal beyond a species’ natural capability has been the major factor underlying the establishment of plant species outside their native ranges, and their rapid spread effectively increases contemporary gene flow and global homogenization [15]. There are many examples of such dispersal of non-native species for horticulture, agriculture, and forestry, which has contributed to the establishment of both naturalized and invasive plants [16,17]. The anthropogenic alteration of habitats has also enabled native species to expand their ranges into new environments [18]. Webber et al. [19] introduced the concept of a projected dispersal envelope (PDE), defined as a region where a species can be considered native, irrespective of whether human-mediated dispersal is implicated, as distinct from movement outside a PDE to where a species’ presence can be considered ‘alien’. In the second instance, there may be a need to control the abundance when the integrity of recipient vegetation assemblages is at risk. Australian examples include an increasing number of documented species naturalizing and hybridizing on occasion, even when recipient vegetation assemblages and climate envelopes do not match those of the native range (e.g., [13,14,20]).
One such plant, Paraserianthes lophantha (Willd.) I.C.Nielsen subsp. lophantha (Leguminosae) [21], is a fast-growing species related to the genus Acacia and a member of the rainforest mimosoid legumes of the tribe Ingeae [22,23]. The other subspecies of P. lophantha, subsp. montana, is only known to occur naturally in Indonesia and few herbarium records exist, all of which are dated 1972 or earlier [24,25]. Subspecies lophantha (referred to hereafter as P. lophantha for brevity) is endemic to southwest Western Australia (SW WA), but has become invasive outside its natural range, both in Australia and elsewhere. It grows naturally as a shrub to a medium-sized tree in a range of habitats in SW WA, from open eucalypt forests to coastal shrubland, extending from the Bibbulmun Floristic Province (BFP) eastward into the Southeast Coastal Province (SCP) [26,27,28,29]. It is most commonly found in granitic soils and gravels in a sandy or loamy matrix [30]. Little is known about the reproductive biology of P. lophantha, although plants are diploid (2n = 26 [31,32]), and in keeping with a short lifespan, exhibit fast growth rates with a tendency to flower within 12 months of germination. Correlated mating, where a single pollen donor sires all seeds within a fruit, is common in mimosoid legumes because pollen is dispersed in clusters (polyads) of 16 pollen grains [33,34,35]. Its seed is hard coated, similar to the seed of its sister group Acacia [25], and can lie dormant in the soil for many years, germinating prolifically after a fire [36]. Such a response can produce monospecific stands with little age variation [25]. Its role as an ecologically and economically important taxon widely used for reforestation and horticulture has prompted the intentional movement of plant material outside its native range and inadvertently resulted in a need for management intervention to contain its spread, which is facilitated by prolific seed production and the ability to transform its environment by fixing nitrogen [37].
Despite a widespread natural distribution within SW WA, most native populations of P. lophantha are relatively small and isolated (Pers. Obs.; [38]). Naturalization has occurred in Australia outside its native range, predominantly in near-coastal areas of South Australia, Victoria, New South Wales (plus Norfolk Is), and Tasmania [28,39,40]. Concern has been raised about its invasive potential in Australia based on its high fecundity, horticultural popularity, and invasiveness in ecosystems overseas [37,41,42]. Seeds have been spread unintentionally in contaminated soil and garden waste [43] and human-mediated introduction into eastern Australia is indisputable based on the evidence of explorers. For example, Ferdinand von Mueller, of the National Herbarium of Victoria (1857–1873), provided packets of seed of P. lophantha to be planted as a marker of the route travelled [42]. However, the degree to which the species colonized naturally or was introduced by humans, particularly to the granitic islands within Bass Strait, is unknown, and the natural occurrence of P. lophantha on the islands off the coast of WA has also been questioned [28]. There is increasing concern about the potential invasiveness given the rapid expansion of P. lophantha in its naturalized Australian distribution because it has become a significant weed in South Africa, the Canary Islands, Chile, New Zealand, Portugal, southern California, and South America [44,45,46,47,48,49,50,51].
The combined impact of human-mediated range expansion and changing climates raises questions about the best way to reduce the negative effects on native biodiversity where native species have established outside their native range (or PDE). Native and naturalized regions generally have independent geographic patterns of genetic diversity, and elucidating these contrasting patterns is integral to our understanding of species’ distributions and the possible consequences of current climate change on plant movement and adaptation [7,52]. Information on the genetics of native populations of P. lophantha and the origins of naturalized populations would assist in tailoring management plans for each region, designed to maintain connectivity and evolutionary processes in the native region compared to a reduction in competition with naturally occurring species in the naturalized region. Several studies have investigated the genetic diversity of P. lophantha [37,38,44,53]. Genetic structure has been identified in the native range of P. lophantha as part of studies focusing on the population structure outside Australia [37] and adaptive responses to novel ranges [38]. Phylogeographic patterns within Australia have not been explored in detail in P. lophantha, but phylogeographic structure identified in SW WA in both plants (e.g., [5,54,55,56]) and animals (e.g., [57,58,59,60,61]) has contributed to conservation in the region by enabling genetically informed management.
The goal of this study was to investigate and compare the phylogeographic patterns of P. lophantha within its native range in SW WA and in naturalized populations along coastal southeastern Australia to guide conservation management strategies. Nuclear microsatellite markers and chloroplast DNA sequence data were used to quantify genetic patterns and differences among native and naturalized populations. We used assignment tests to evaluate the source of naturalized populations and whether the timing of establishment could be attributed to recent human-mediated introductions or older, natural dispersal events. Finally, the differential climate suitability for native and naturalized populations was tested by examining associations between environmental variables and genetic variation.

2. Materials and Methods
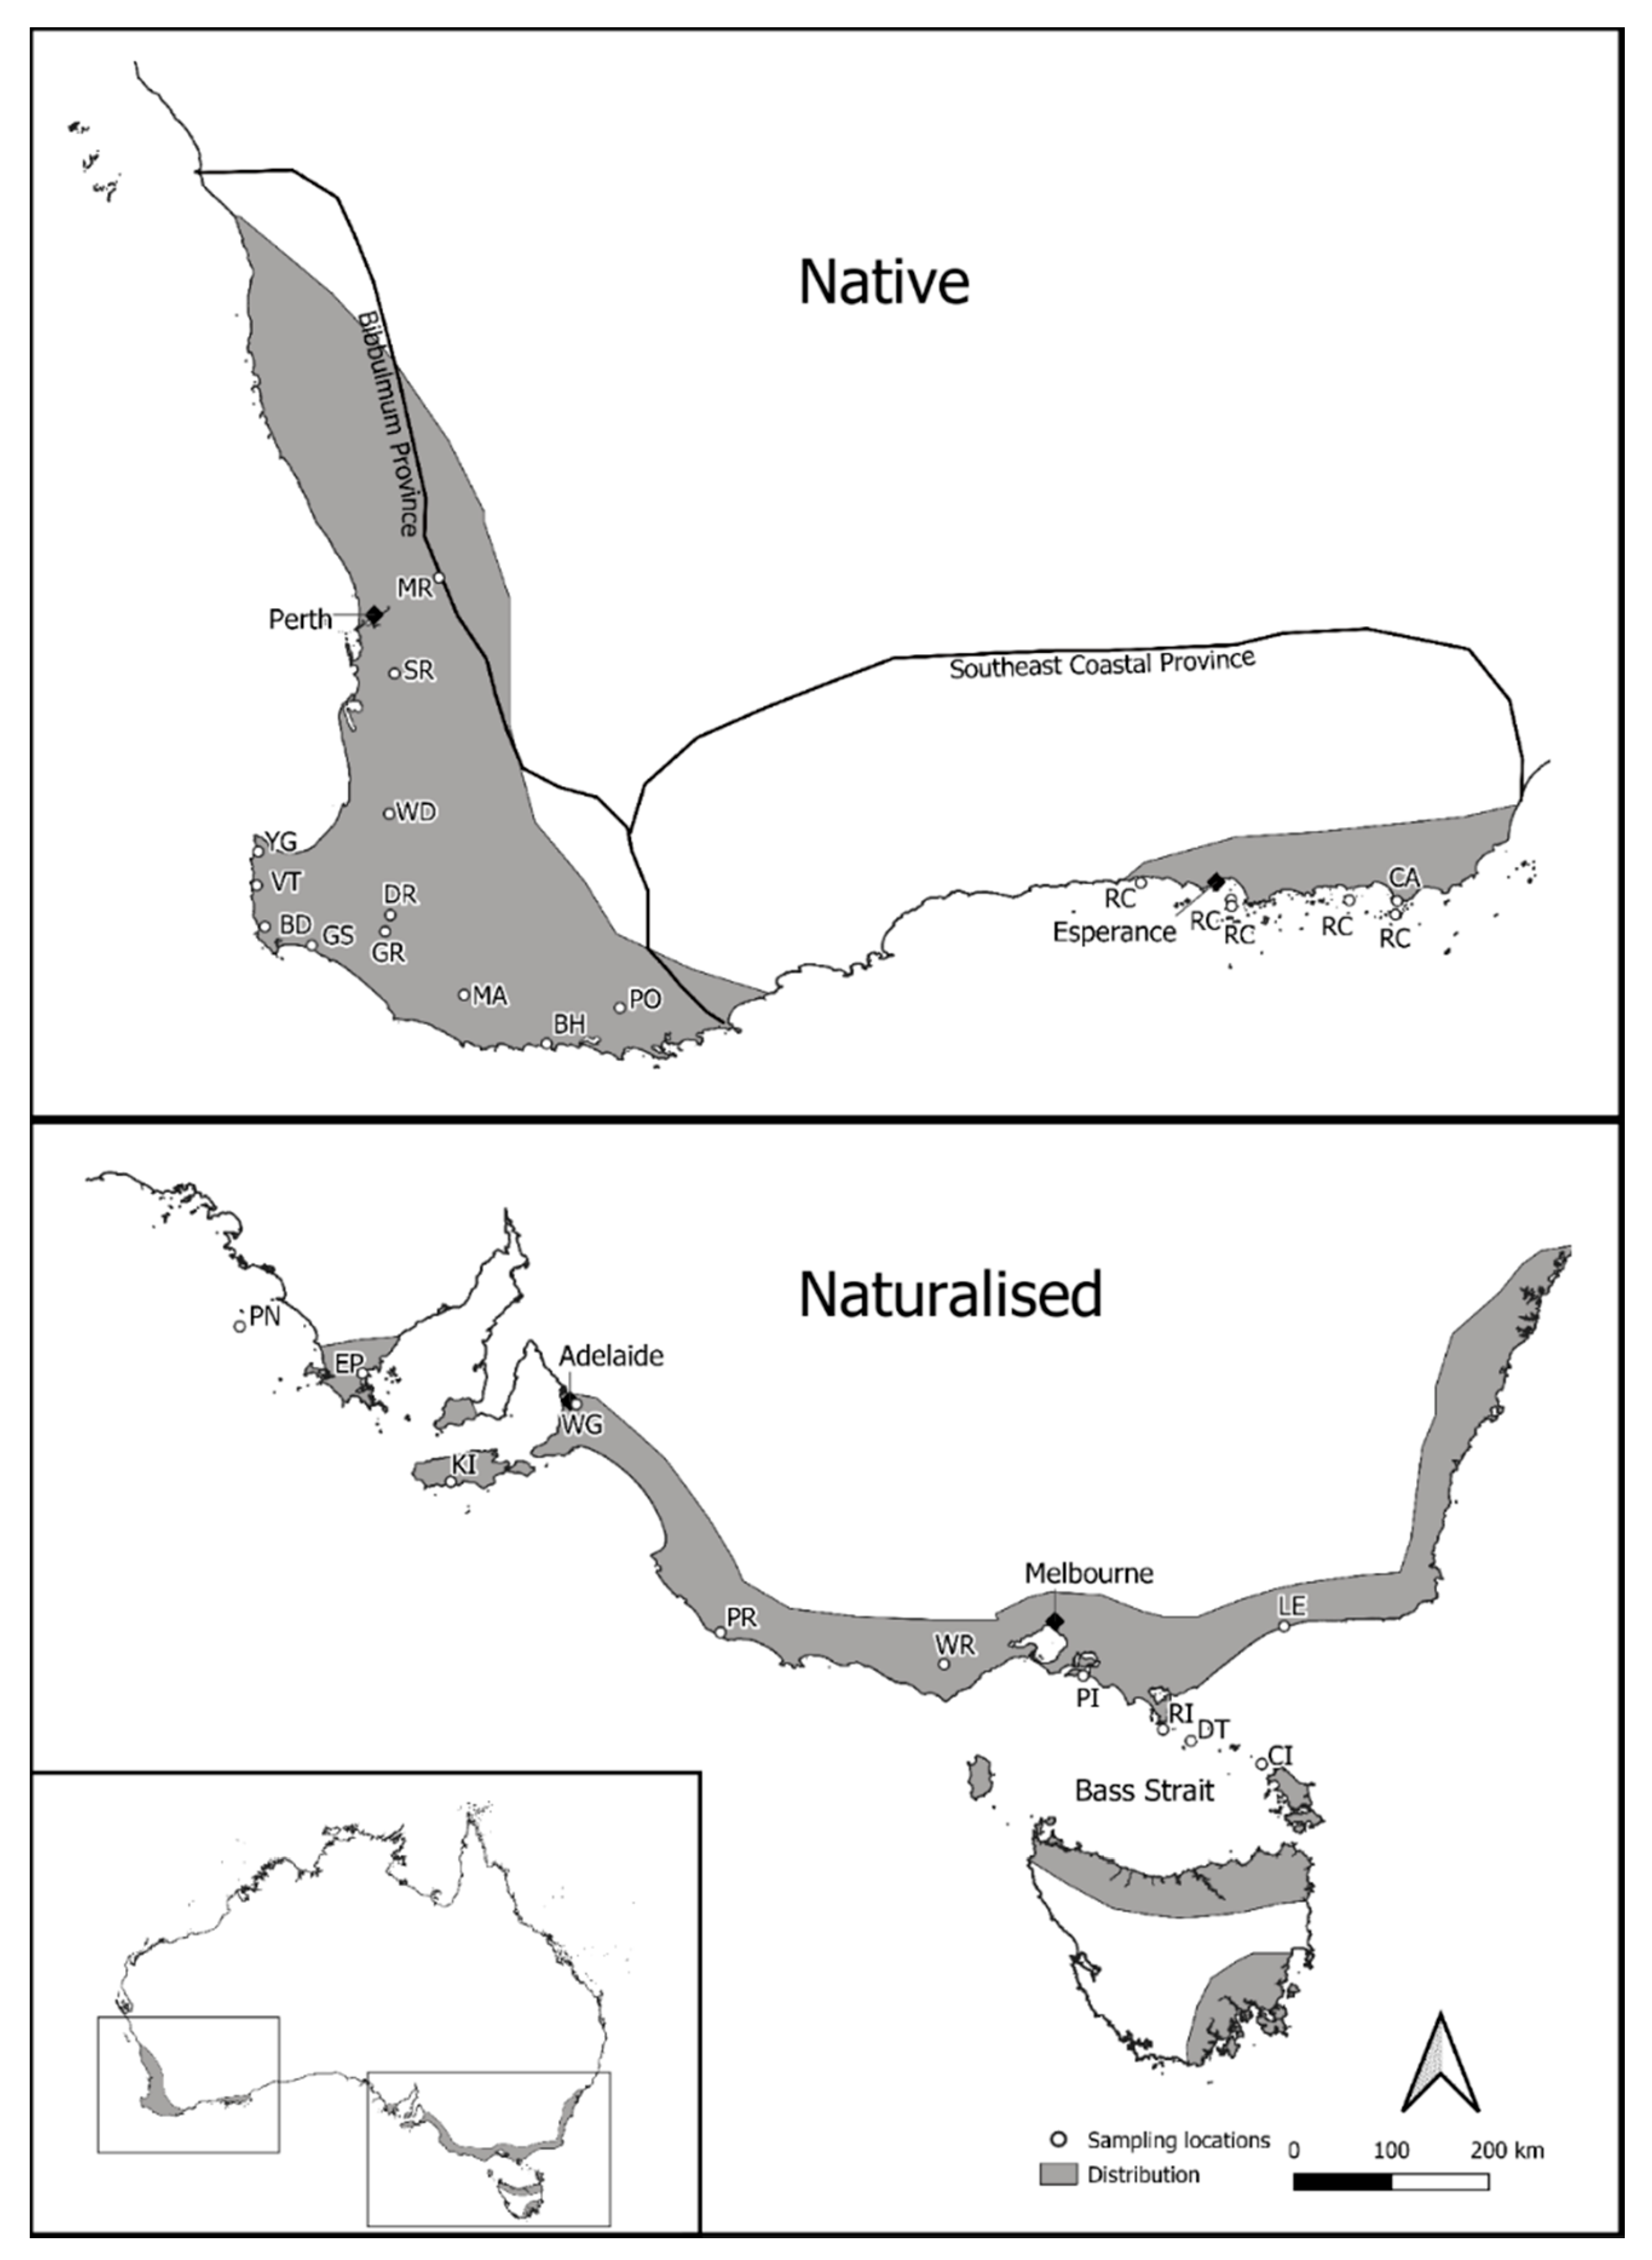
2.1. Sampling

One hundred and ninety-six individuals of P. lophantha representing 14 populations were sampled from the SW WA (native) region of Australia (Figure 1). Native population sampling ranged in size between one and 22 individuals per population, depending on the population size, and included one metapopulation (RC) sampled from vegetative tissue from herbarium specimens of five Recherche Islands off the southwest coast of Western Australia (Table S1). An additional 192 P. lophantha individuals were sampled from the southeastern region of Australia, representing 11 naturalized populations (Figure 1). Naturalized population samples ranged in size from one to 24 individuals per population and included vegetative tissue from herbarium samples collected on five islands off the southeast Australian mainland (Table S1). The growth and reproduction of P. lophantha are important components to consider for sampling. A minimum distance of 2 m was used between samples. The plant age could not be determined, but where there were multiple height cohorts, taken as a proxy for age, each cohort was sampled.

2.2. DNA Isolation

Genomic DNA was isolated from silica dried leaves and herbarium specimens (Table S1) using either the QIAGEN DNeasy Plant Mini Kit (QIAGEN Inc., Valencia, CA, USA) as per the manufacturer’s protocol or the Nucleospin Plant II Kit (Macherey-Nagel) with Lysis buffer PL1 at the Australian Genome Research Facility (AGRF, Adelaide, SA, Australia).

2.3. cpDNA Sequencing and Phylogeny

Three individuals per population, where possible, were randomly selected for amplification and sequencing three cpDNA loci. PCRs for all amplifications were run on an Eppendorf Mastercycler gradient thermal cycler. The intergenic spacers rpl32-trnL and trnQ-5′rps16 were amplified using primers from Shaw et al. [62]. The 5′trnK-matK region was amplified using primers trnK-3914 [63] and Ac283R [64]. PCR conditions used for rpl32-trnL and 5′trnK-matK were 94 °C for 4 min; 30 cycles of 94 °C for 1 min, 55 °C for 1 min, and 72 °C for 2 min; and one hold of 72 °C for 7 min. PCR conditions used for the trnQ-5′rps16 intergenic spacer were those of Shaw et al. [62].
Contiguous sequences were edited using SequencherTM v3.0 (Gene Codes Corporation, Ann Arbor, MI, USA) and manually aligned in BioEdit sequence alignment editor v.7.0.9.0 [65] for all regions separately. Sequences were lodged with GenBank (MW202048–MW202094, MW202095–MW202149, MW219976–MW220031). Any uncertain base positions and highly variable regions with uncertain sequence homology were excluded from analyses. Data sets for each chloroplast region were first analysed independently. As the results were not in conflict, the final analyses were performed based on a dataset of the three regions combined.
Phylogeny reconstruction was conducted using Bayesian analysis of the combined dataset in MrBayes 3.2.2 on the CIPRES Science Gateway v.3.3 (http://www.phylo.org/index.php/). The appropriate model (GTR) was estimated by the Akaike Information Criterion (AIC) in MrModeltest version 2.3 [66] and was applied to the sequence data. Five indel characters, coded as binary or unordered multistate characters following the simple indel coding method [67], were included as a separate partition and a standard discrete data model with a gamma shape parameter was applied to this partition. The Markov chain Monte Carlo search was run for three million generations, with trees sampled every 1000 generations. MrBayes performed two simultaneous analyses starting from different random trees (Nruns = 2, Nchains = 4) and using the default burn-in percentage (relburn-in = Yes burn-infrac = 0.25). All trees (excluding the trees from the burn-in) were summarized and the 50% majority rule tree (clade credibility tree) with posterior probability values was viewed in iTOL [68].

2.4. Microsatellite Amplification and Screening

Nine microsatellite loci found to be polymorphic in P. lophantha [69] were amplified using the Schuelke [70] method. Six of these loci were developed specifically for P. lophantha ([69]: Plop4, Plop6, Plop8, Plop11, Plop12, and Plop18) and three for species of Acacia ([71]: Am465; [72]: As2.17, and As2.46). Each 25 μL reaction contained 5 μL of HotStar Taq master mix (QIAGEN), 0.15 μL of 10 μM forward primer with a tail, 0.5 μL of 10 μM reverse primer, 0.2 μL of fluorescently labeled ‘M13′ primer, 1–11 ng of DNA, and H2O. The following PCR program was used: 95 °C for 15 min; followed by 30 cycles at 94 °C for 30 s, 55 °C for 30 s, and 72 °C for 30 s; and a final elongation step at 72 °C for 10 min. PCR products were run on a 3730 DNA Analyzer (Applied Biosystems) with a GS500LIZ_3730 size standard. Allele sizes were determined for each locus using PeakScanner version 1.0 (Applied Biosystems). Individuals with missing data for more than two microsatellite loci were removed from the dataset prior to analysis.

2.5. Genetic Analyses

Polyads of P. lophantha contain 16 pollen grains [73]. This reproductive feature could promote genetic structure, especially if full siblings are contained in an individual pod and recruit into a population [35,74,75,76]. The removal of siblings is not always considered necessary to circumvent bias in downstream analyses [77], but we identified siblings in order to test the effect of including or excluding siblings within populations. To test whether correlated mating could influence our genetic structure results due to the non-independence of genotypes, we used COLONY v 2 [78] to identify full-sibling groups within the dataset. The following settings were used: Polygamy for males and females; monoecious; genotyping errors estimated at 0.05%; and allele frequencies updated every 1000 permutations. Five replicates were used to check for the convergence of estimates. Based on COLONY results, a second reduced dataset was prepared, limiting siblings by including any individuals not members of a sibling group and one representative of each sibling group present in a population.
Genetic diversity parameters, including the mean number of effective alleles (Ne), estimate of observed heterozygosity (HO), estimate of expected heterozygosity (He), and Wright’s inbreeding coefficient (FIS), were calculated in GenoDive or Hierfstat with and without multiple siblings per population. An analysis of molecular variance (AMOVA) was performed in GenoDive v2.0b27 [79] on the full and reduced (limited siblings) datasets, and a further reduced dataset was produced where populations with n ≤ 2 were removed, in order to examine the distribution of genetic variation within and among populations and between native and naturalized regions. The significance of the estimates was tested using 9999 permutations of the data. Isolation by distance tests were performed in the Adegenet v1.4-0 [80] package in R v 3.0.3 [81], using the mantel.randtest argument to independently test within native and naturalized ranges. This measures the correlation between the Edward’s distances and Euclidean geographic distances between populations, and tests whether the empirical data are significantly different from the data set in the absence of spatial structure through 1000 permutations.
A discriminant analysis of principal components (DAPC) was performed using Adegenet v1.4-0 [80,81] to investigate the population and regional structure. DAPC aims to provide an efficient description of genetic clusters using synthetic variables, with the advantage that there is no assumption of random mating (i.e., Hardy–Weinberg equilibrium). The variables are constructed as linear combinations of the original variables (alleles) which have the largest between-group variance and the smallest within-group variance. Each eigenvalue created in the DAPC explains some variance in the PCA and the number of eigenvalues kept for the analysis will increase the cumulative variance explained. First, we calculated the differences between the two regions (native and naturalized), and then estimated the number of genetic clusters within the native populations using the directions within Adegenet documentation. Using this information, we visualized the genetic structure in a 2D PCA-like plot and employed this information to assign clusters to the individuals from naturalized populations (see below; Section 2.6 for details).
The program STRUCTURE v 2.3.1 was used to run the Bayesian model-based clustering method described by Pritchard et al. [82] using the admixture model with a correlated allele frequency to improve the clustering of closely related populations [83]. After preliminary tests were conducted to find the optimal burn-in period, we performed 15 independent runs for each value of K from one to 14 on all individuals, limited siblings, and for native (SW WA) individuals (all and limited siblings). Runs had a burn-in period of 100,000 iterations, followed by a sample of 900,000 Markov chain iterations. We used the Evanno method [84] in STRUCTURE HARVESTER [85] to determine the most appropriate number of clusters for the data. We then used CLUMPAK [86] to combine the results obtained from the 15 runs at each K and visualize the membership in clusters.

2.6. Assignment of Naturalized Individuals

Individuals of P. lophantha from naturalized areas in southeastern Australia (including islands) were assigned to the eight genetic clusters identified by DAPC in the native populations. To do this, we used the predict function to estimate a probability of assignment for each naturalized individual. We used image.plot from the fields v 10.3 package to visualize the assignments. The plot consisted of genetic clusters on the x-axis and naturalized individuals on the y-axis, with probability scores ranging from 0 (highly unlikely) to 1 (highly likely) for each combination (individual × cluster; 99 × 8).

2.7. Relationship between the Genetic Structure and Climate for Natural and Naturalized Populations

A Redundancy Analysis (RDA) in the R package Vegan [87] was used to identify differences in genetic–climate associations between the populations in native and naturalized regions. We calculated the relationship between precipitation, temperature, and genetic variation using climate data from worldclim: mean annual precipitation (BIO12); maximum temperature of the warmest month (BIO5); and isothermality (BIO3). Pearson’s correlation coefficient (PCC) was used to calculate the similarities between the three environmental variables, in order to ensure their independence and appropriateness for the analysis. PCC ranged from 1 (total positive correlation between the two variables) to −1 (total negative correlation). Population-level allele frequencies were the dependent variable used as the genetic data. To test the relationship between genotype and climate, we used the function rda on the genotypic data, and then fit the climate data to the genotype data using the envfit function employing 999 permutations. The results allowed us to compare how the genetic variation of the native and naturalized regions is differentially related to the climate.

3. Results

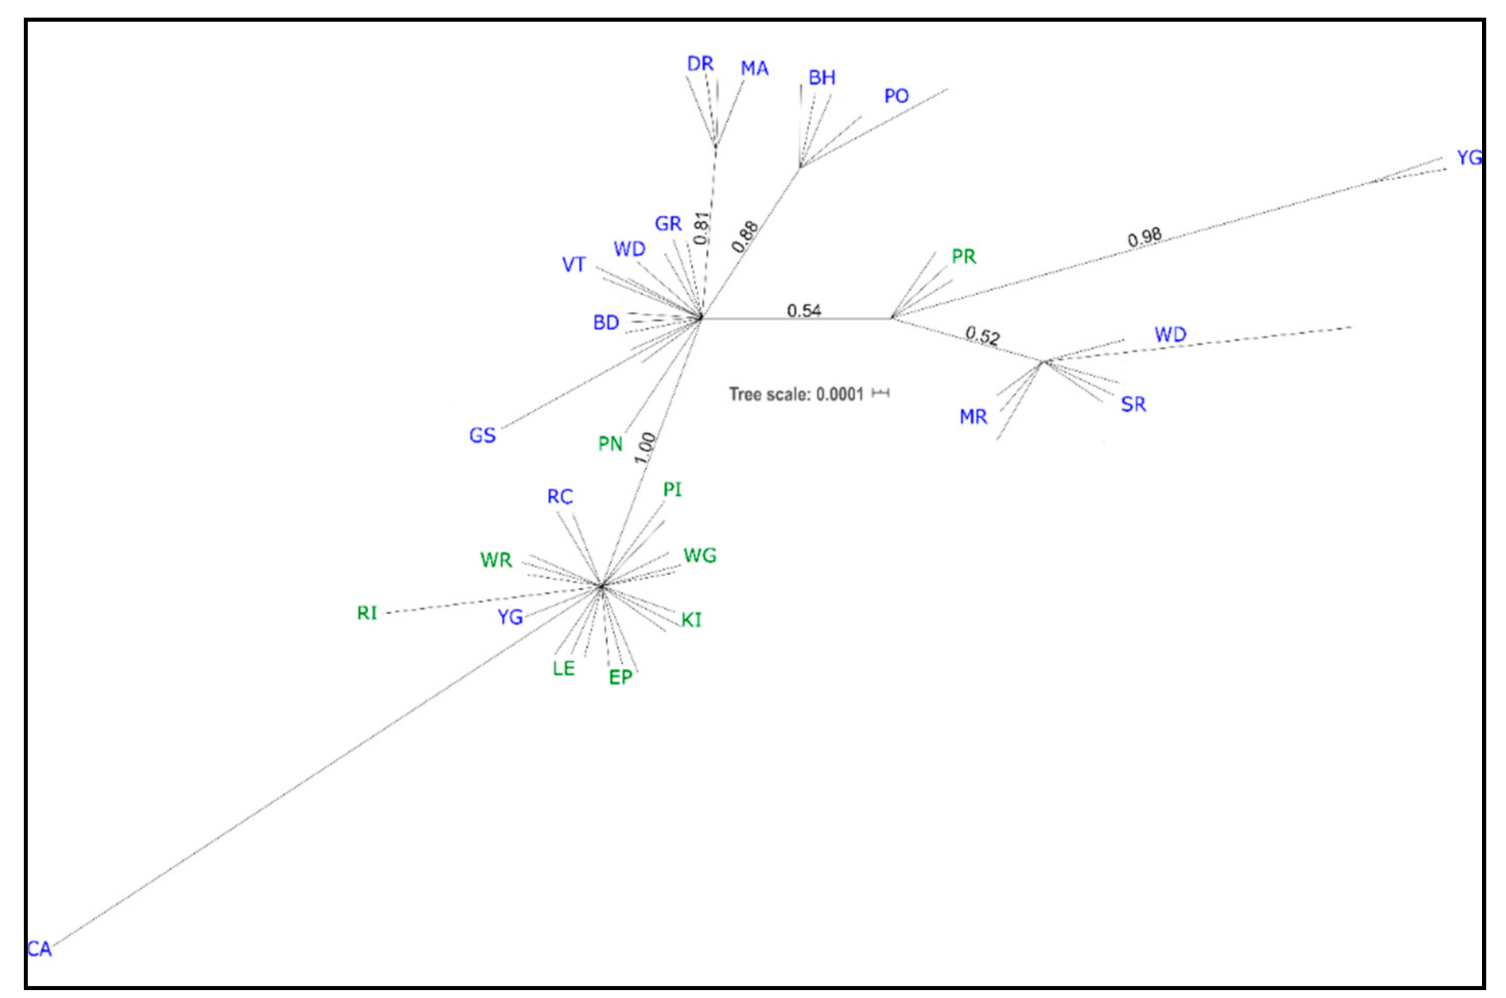
3.1. cpDNA Phylogeny

Many western individuals (GS, BD, VT, and WD in part, GR; see Table 1 for population codes) formed an unresolved polytomy, along with an eastern individual from PN (Figure 2; PN = Pearson Island, South Australia). Two western clades had moderate support; one grouping all BH and PO individuals (0.88 PP), and one including all DR and MA individuals (0.81 PP). A very weakly supported clade (0.52 PP) of WD (two of the three sampled individuals), SR, and MR (western), was related to a pair of YG individuals (0.98 PP) and three individuals from PR (eastern; 0.54 PP, Figure 2). All eastern individuals, except those noted above, formed a well-supported clade (PP 1.0) that also included three individuals from the west: RC; CA; and one individual from YG (Figure 2).

3.2. Assessment of the Genetic Diversity

The microsatellite dataset consisted of 289 samples from 24 populations. The sole representative from PN, sampled from a herbarium specimen, had insufficient microsatellite data, so was only included in the cpDNA phylogeny. In total, 83 microsatellite alleles were detected from nine loci. The reduced dataset, comprising one representative of each sibling group present in a population and all individuals not members of a sibling group, consisted of 199 samples. Summary statistics are provided for the full dataset and for the reduced dataset in Table 1. When considering all samples, the number of effective alleles (Ne) ranged from 1.15 (DR) to 3.28 (RC) in native populations, compared to 1.10 (EP) to 1.71 (WG) for naturalized populations. The observed (Ho) and expected heterozygosity (He) for native populations (0.00–0.44 and 0.08–0.67, respectively) had a greater range than Ho and He for naturalized populations (0.06–0.28 and 0.06–0.35, respectively). FIS was high in most native populations, with only two having an FIS value < 0.25 (BD and MR), whereas FIS varied greatly in naturalized populations, ranging from −1.00 (CI) to 0.50 (WR), and supported high heterozygosity in four out of eight naturalized populations where FIS values were negative.
Genotyping of the 289 individuals produced 192 multi-locus genotypes (MLGs), 31 of which were found more than once. Clonality has not been observed in the species and is not considered an explanation for recurrent MLGs. The limited number of microsatellites used and possible biparental inbreeding may have reduced our ability to differentiate between some closely related individuals, such as siblings. Recurrent MLGs were only shared across populations in the naturalized region, where six MLGs were found in more than one of five populations. Of those, three MLGs were missing data for one locus (Am465). For example, individuals from KI shared five MLGs with individuals from populations WR and LE, but two MLGs were missing data for the locus Am465. The other MLG shared across populations was found on CI and RI in Bass Strait, but those individuals were also missing data for Am465. Recurrent MLGs (i.e., those found in different populations) were retained for analysis to estimate similarities between populations (Table S2 for details).

3.3. Sibling Assessment

Siblings made up a high proportion of samples. From the full dataset of 289 individuals, 103 were assessed as belonging to one of seven sibling groups, with a probability of inclusion >0.80 (Groups 1–7; Table S3). An additional 174 samples were identified as belonging to another five sibling groups (Groups 8–13; Table S3); however, the probabilities of inclusion (<0.45) and exclusion (<0.21) were too low for them to be considered full siblings. Therefore, a reduced data set (n = 199) for analysis included one representative of each population from Groups 1–7, plus all other individuals (i.e., all those in Groups 8–13 and all those not assigned to a sibling group). Four full sibling groups (Groups 2, 3, 4, and 7) were restricted to single populations (GS, PR, BD, and WG), while the remaining three full sibling groups included individuals from more than one population. Group 1 shared individuals from the three Bass Strait islands (CI, RI, and DT). Groups 5 and 6 shared individuals across native populations: BH and PO, and BD, BH, YG, and VT, respectively.
Significant genetic structuring among regions, among populations, and within populations was indicated by the AMOVA for the full data set (p < 0.002 for all sources of variation). Most microsatellite variation was explained by differences among populations (44%), while 28% of the variation was explained by region (native vs. naturalized), and 29% within the populations. The removal of siblings did not have a large effect on the amount of variation explained in the data, with among populations accounting for 38% of the variation, within populations accounting for 31% of the variation, and among regions accounting for 31% of the variation (Table 2). The removal of populations with n ≤ 2 did not change the outcome of the AMOVA (Table S4). Isolation by distance (IBD) was significant for the native populations (p < 0.001), but not the naturalized populations (p = 0.181).

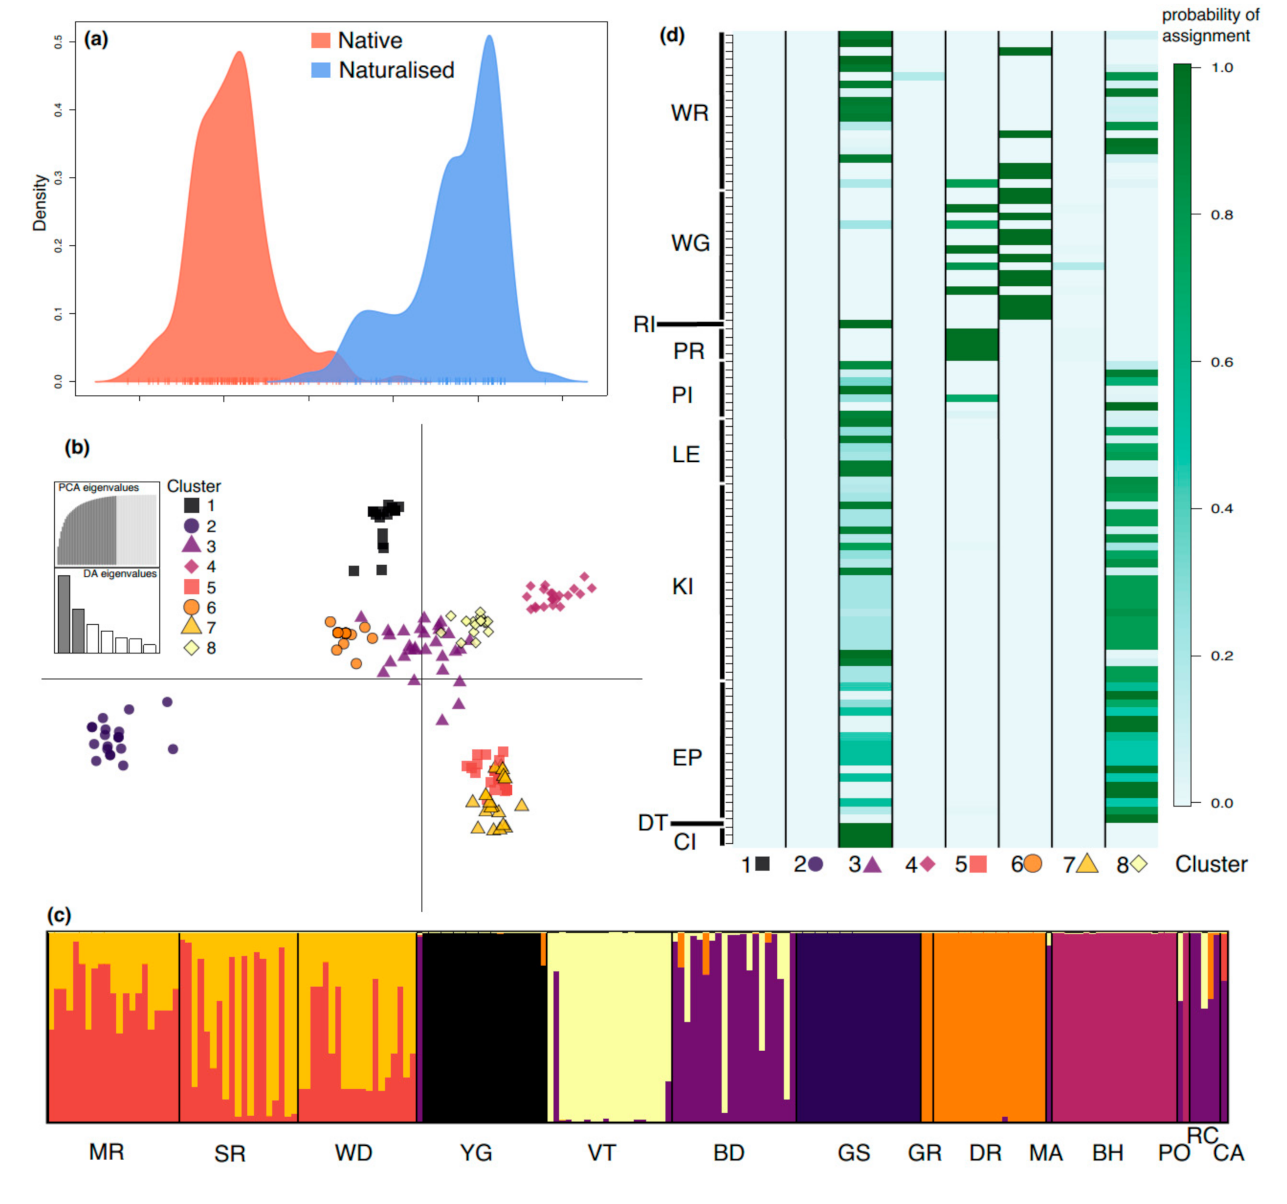
3.4. Cluster Analysis and Assignment of Naturalized Individuals

DAPC analysis showed distinct genetic signatures between native and naturalized regions with minimal overlap, which was able to explain 98% of the variation (Figure 3a). When looking at the variation among native populations, we found that they were grouped into eight genetic clusters, with 58.2% of the variation explained by the two DAPC axes (Figure 3b). While admixture occurred within some populations (MR, SR, WD, and BD), low levels of admixture were evident for several other populations, particularly YG, VT, GS, GR, and BH (Figure 3c). The assignment of naturalized individuals to native clusters (Figure 3d) revealed that native populations belonging to clusters 1, 2, 4, and 7 are unlikely to be the origin of naturalized plants found in eastern Australia. However, cluster 3 (populations BD/RC) and cluster 8 (population VT) exhibited a greater genetic similarity to individuals in the naturalized populations. A smaller proportion of naturalized individuals were assigned to the cluster of admixed populations MR, SR, and WD.
STRUCTURE identified an optimal K value of seven (K = 7) for all individuals, three (K = 3) for the dataset with limited siblings (Figure S1), and four (K = 4) for the native (WA) individuals (Figure 4). STRUCTURE results for all individuals (i.e., with siblings) were congruent with DAPC results, showing distinct genetic signatures for the native and naturalized regions and similar genetic clustering in the native range, despite identifying fewer genetic clusters (Figure 4; Figure S1). Native-only clusters were largely correlated with geographic areas consistent with the IBD results. Admixture was evident within populations BD, DR, GR, MA, and YG, but largely absent from populations MR, SR, WD, VT, GS, BH, and RC. Three clusters recovered with STRUCTURE, comprising GS (green), BH (orange), and VT (purple), were also identified from DAPC (Figure 3), whereas populations MR, SR, and WD displayed admixture in DAPC, but not STRUCTURE.

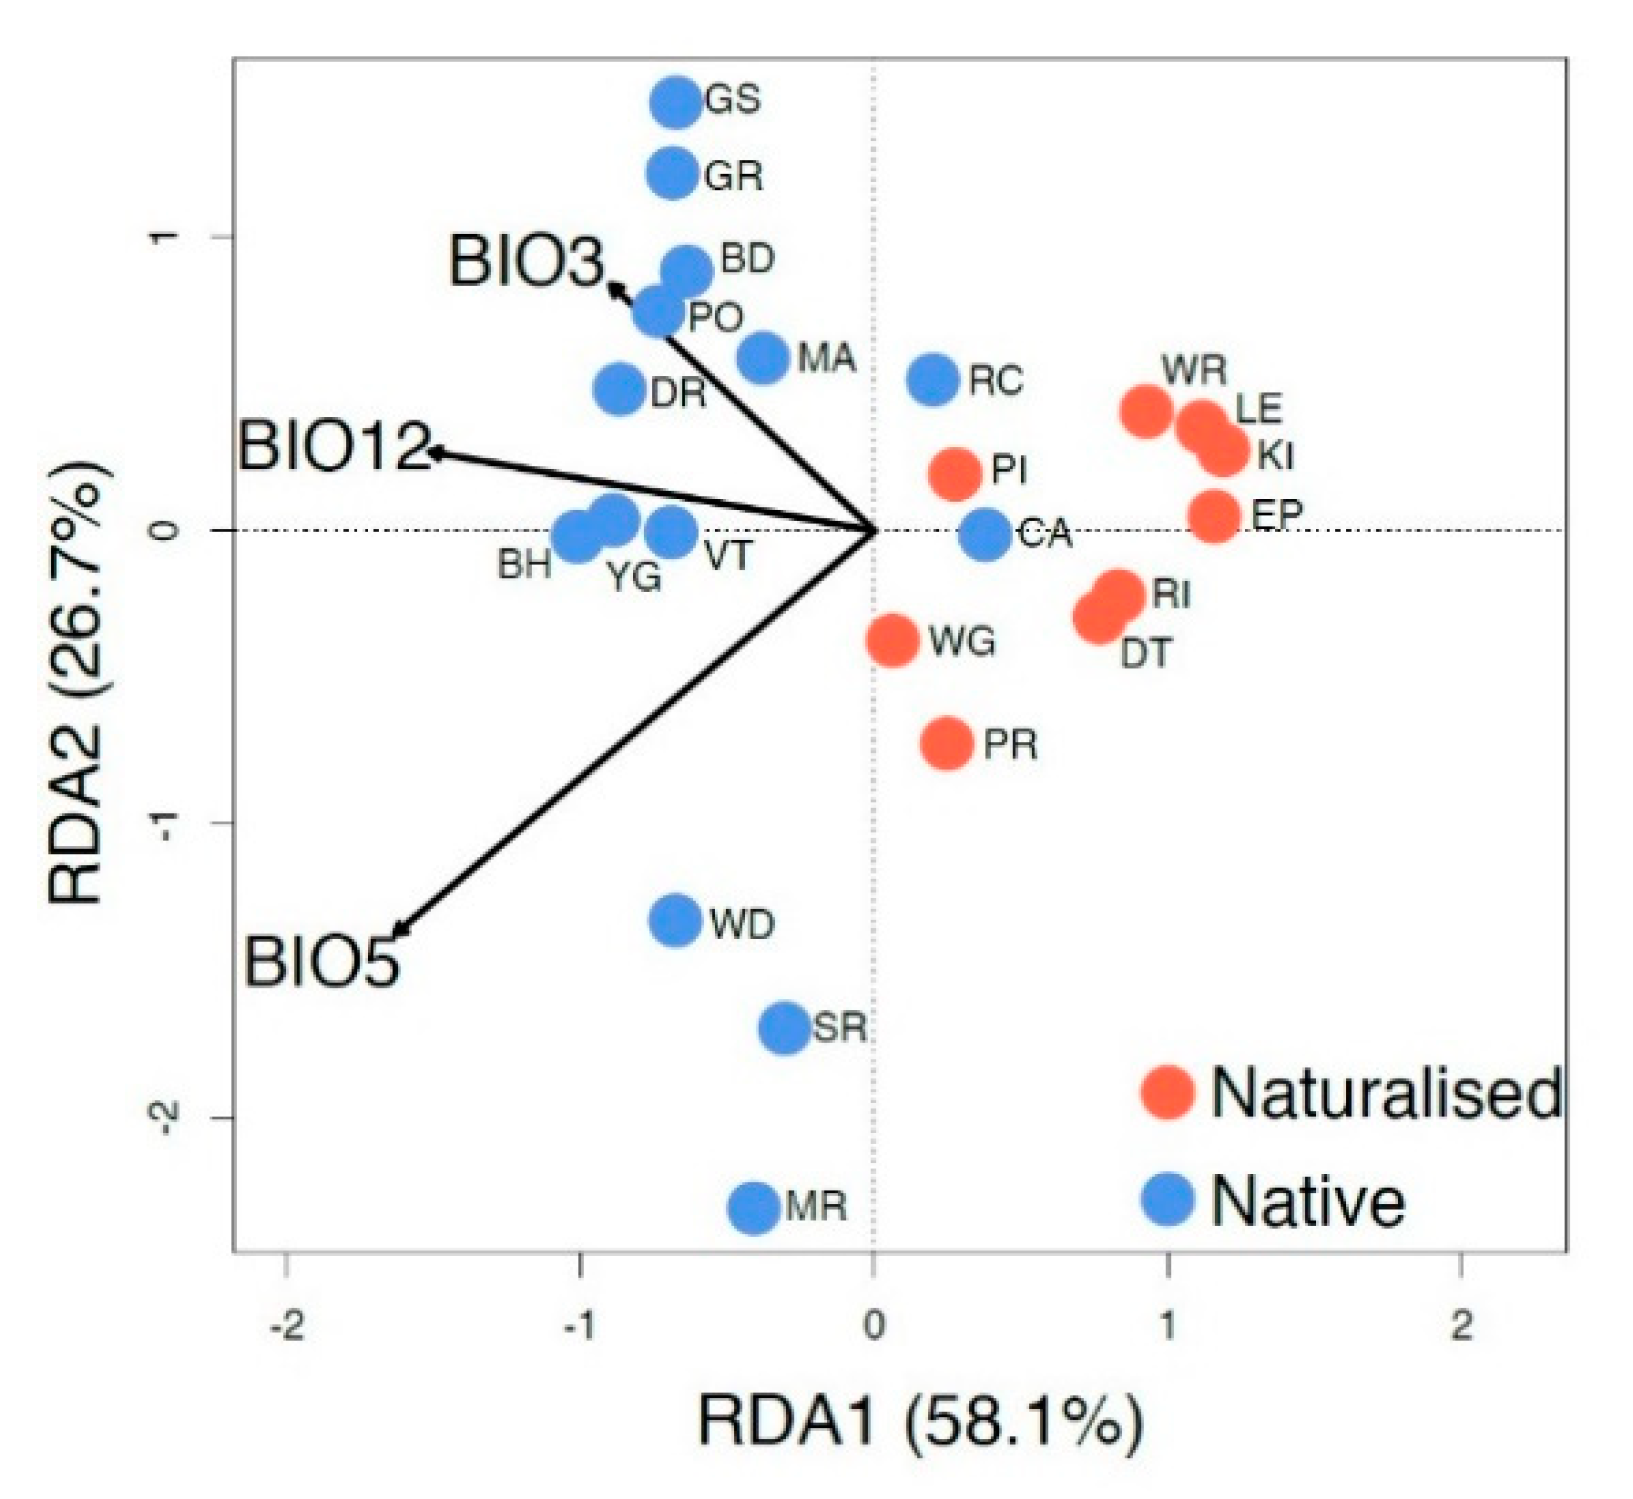
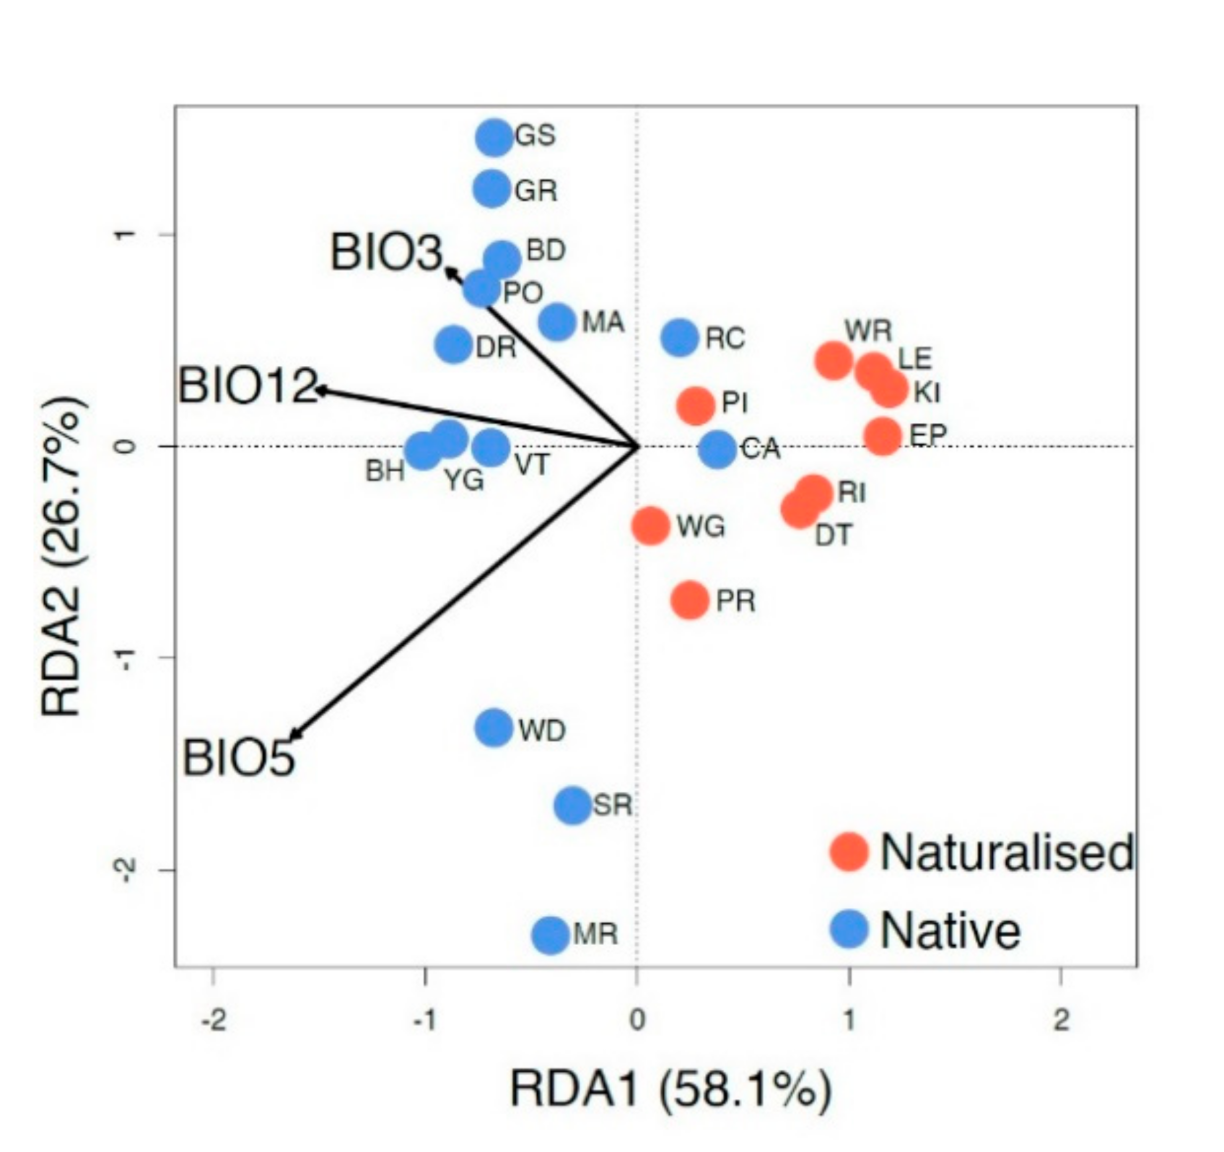
3.5. Relationship between the Genetic Structure and Climate

RDA analysis (Figure 5) shows the relationship between three independent climate variables and the genetic structure of native and naturalized populations. The regions not only have different genetic signatures but also have different relationships with the climate variables selected. However, the two native populations that overlap with the naturalized populations (CA and RC; to the right of the center line) are the most easterly native populations and are located at least 500 km from the other sampled native populations. Most of the genetic variation (84.8%) within the species can be explained by and is highly correlated with the three climatic variables of the mean annual precipitation (BIO12, p = 0.017, r2 = 0.61), maximum temperature of the warmest month (BIO5, p = 0.001, r2 = 0.32), and isothermality (BIO3, p = 0.097, r2 = 0.20). Based on significance, BIO5 was the most predictive climate variable for genetic variation.

4. Discussion

This study reports on differences found in the genetic signal and relationships between climate variables of Australian P. lophantha for native and naturalized regions and significant isolation-by-distance (IBD) within the native region, but not the naturalized region. However, within both regions, individual populations showed contrasting levels of genetic diversity and population structure that most likely reflect disparate gene flow rates, population history, and propagule sources. Differences between regions are consistent with generally limited dispersal restricting gene flow in native populations compared to opportunistic gene flow into naturalized regions due largely to recent human-assisted migration. Correlated mating and biparental inbreeding, attributable to the dispersal of pollen within potentially single-sire polyads, and population demography are likely to have contributed to the variable patterns seen in both regions, where some populations consisted of a large number of siblings (native: BH, GS, VT, and YG; naturalized: PR and WG).

4.1. Inbreeding and Allelic Diversity

Pollen in P. lophantha and its relatives (e.g., Acacia and Albizia) occurs in polyads, thus enabling a single pollen donor to be capable of siring all seeds within a single fruit [33,88]. This reproductive characteristic increases the chance that full siblings are contained in an individual seed pod [35,75] and the likelihood that individuals within populations have a high level of genetic similarity due to non-random mating. This could account for the low number of effective alleles and the high inbreeding values (FIS) found in this study. More native than naturalized populations appear to be inbred (90% vs. 50%, respectively), with differences likely to be influenced by the level of human-assisted migration of mixed source seed to the naturalized region. Inbreeding has been detected in other studies of P. lophantha [37] and related taxa [34,89,90,91,92,93,94,95,96]. Many species of mimosoid legumes are self-incompatible, or if self-compatible, preferentially outcross which results in higher pod yields from outcrossed pollinations [97,98,99,100]. We cannot rule out the possibility of selfing or biparental inbreeding within the species contributing to the different levels of inbreeding we found between native and naturalized populations.
Comparing only those populations for which Ho and He can be calculated for datasets with and without multiple siblings, Ho was lower than He in all native populations except MR, whereas this was the case in only half the naturalized populations. All populations of P. lophantha lack allelic diversity, irrespective of their location. Allelic diversity has been shown to be a good indicator of long-term adaptive potential [101], but the success of P. lophantha outside its native range suggests that there are other influences at play. For example, the reduced seed predation and higher seed viability found in the naturalized range in Australia has been proposed as an indication that invasion success is most strongly associated with the germination stage of the life-cycle [102]. More generally, contemporary adaptation to climatic conditions in a new environment [103] or escape from biological constraints present in the native range [104] may bestow considerable flexibility in P. lophantha’s naturalized range.

4.2. Phylogeographic Patterns of P. lophantha within Its Native Range in Australia

In the forests of the Bibbulmun Floristic Province (BFP) of southwest Western Australia (SW WA), populations of P. lophantha are geographically structured and reveal a genetic signal that follows temperature and geographic gradients aligned with IBRA7 (sub)regions [105]. Many studies from southwestern Australia indicate that the genetic structuring in the broad SW WA region has been largely shaped by climatic fluctuations that varied with phytogeographic location during the late Pliocene and Pleistocene. Today’s predominantly sclerophyllous SW WA flora evolved from old lineages in isolated pockets on nutrient-deficient soils in landscapes dominated by rainforests that are now locally extinct [29]. Climatic structuring can be indicative of patterns of local adaptation [106], and geographically-correlated genetic differences have been reported for several plant and animal species in SW WA [59,61,107,108]. The significant patterns of IBD in Western Australian populations is in contrast to the results of Thompson et al. [37], who found no evidence of IBD in P. lophantha. However, the current study included a broader sampling of individuals from the native range, with 196 individuals from 14 populations compared to 70 individuals from 7 populations [37], which may explain the different results.
The three most northerly populations of P. lophantha (MR, SR, and WD) are more similar to each other and appear to be isolated from southern populations with minimal admixture [37]. The presence of northern and southern lineages has been documented in other SW WA plants, e.g., Corymbia calophylla [109] and Calothamnus quadrifidus [107], where conditions have led to historical disjunction and a generalized restriction of gene flow. The metapopulation dynamics of populations, including turnover, often small size, and potentially establishment or expansion with related individuals, is likely to have contributed to the further structuring we identified amongst the southern populations. These observations are consistent with the findings of Broadhurst et al. [110], who found that differentiation in Australian species was strongly influenced by the species abundance and disjunction, with higher than average population differentiation in species with patchy distributions and/or disjunct occurrences.
For the southerly SW WA populations of P. lophantha, the genetic structure is largely geographic. Population GS was clearly differentiated from the others in the DAPC, possibly due to isolation-by-environment (precipitation and soil type) rather than distance, as it is found in a swampy area and is no more geographically isolated than other populations in the south. In the very southwest corner, populations YG, VT, and BD are geographically close (c. 60 km), yet are genetically differentiated from each other. YG has a composite genetic signal, which has been found in other plant species in the area, for example, in Corymbia calophylla, three haplotypes [109] and strong signals of adaptation to temperature were identified [111], and in two species of Stylidium (S. affine and S. lateriticola) outliers occur on the granite of Yallingup (Wege, pers. comm.). This area sits on one of the youngest sediments in SW WA [112], in a complex area where three biogeographic regions (Jarrah Forest, Swan Coastal Plain, and Warren) meet [105].
The southwest coast genetic cluster containing populations BH and PO is located close to where the BFP and Southeast Coastal Province (SCP) meet [27]. This area was hypothesized to be a refugium in the Pliocene and Pleistocene [58,107], but there is no evidence of this in P. lophantha. However, in another proposed refugial area sitting on the oldest geology in SW WA [58], populations DR, MA, and GR form a cluster in DAPC and contribute to the genetic admixture of populations YG, BD, and RC.
In its native range, the most easterly SW WA populations of P. lophantha (CA and RC) are found in the Esperance district [27], where a gap of several hundred kilometers separates them from the nearest known westward individuals [27,113] (BH and PO). Vegetation within the gap is floristically more similar to inland areas where P. lophantha is not known to occur, so the area may be a historical barrier to gene flow (Figure 9 in [27]). The few phylogeographic studies of SW WA species with distributions extending to Esperance have shown the area to be genetically distinct [61,107]. In contrast, P. lophantha from near Esperance exhibits relationships to other native populations (microsatellites) and also to the naturalized populations (cpDNA; Figure 2). While the habitat is similar to other native populations found on granite geology, the climatic variables overlap with the naturalized populations so it is uncertain whether the presence of P. lophantha in the Esperance region could be considered an example of movement outside the species PDE.

4.3. Genetic Diversity of P. lophantha in the Naturalized Range in Australia

The overall genetic variation in the naturalized populations of P. lophantha in Australia is lower compared to the native populations as previously reported [37,38] and there is a distinct but different genetic signal related to climate variables in the naturalized region. However, in contrast to Thompson et al. [37], the observed heterozygosity was less than expected in half of the naturalized Australian populations in this study. The difference between studies could be due to our greater sampling depth across a wider geographic range within Australia, compared to Thompson et al. [37], who compared naturalizations across the world. Four of the largest naturalized Australian populations showed remarkably little genetic differentiation (EP, KI, WR, and LE; Figure S1) and three of these (KI, WR, and LE) share MLGs, despite considerable geographic distances between the populations (350–650 km). The genetic structure and higher observed heterozygosity may indicate that the populations have not yet reached genetic equilibrium [114] and therefore may be in a transient state [115]. These results are consistent with a recent bottleneck [38] if the naturalized populations were established from a small number of founders from few source populations in Western Australia (Figure 3d; [37]) and/or the movement of genetically similar germplasm within the naturalized range.
The genetic structure within the naturalized Australian region is best explained through recent human-mediated introductions but the only evidence we have found for P. lophantha being deliberately introduced into eastern Australia are reports of Ferdinand von Mueller encouraging its planting by distributing packets of seed [42]. However, the assignment of naturalized plants in Australia to native populations in two areas—VT and BD (clusters 3 and 8, Figure 3d) found near the west coast and GR and DR (cluster 6, Figure 3d) located close to each other more centrally—suggests that seed may have been moved via shipping routes. Both areas in the native region have a history of built structures (from c. 1880) to facilitate the movement of people and goods [116], and sealers’ settlements were established in eastern Bass Strait from 1798 as part of a shipping route between Western Australia and Sydney [39]. The difference in the relationship to climate variables of naturalized and native regions also supports the anthropogenic movement of P. lophantha beyond its natural dispersal envelope. While the most parsimonious explanation of dispersal is human-mediated, there is still a chance that P. lophantha seeds travelled to the islands naturally via sea currents and/or animal vectors. Seeds of Acacia melanoxylon have been reported to germinate after 10 years of being submerged in sea-water [117], and with a similar biology, P. lophantha may also be able to germinate after long periods of submergence while travelling long distances [118]. However, dispersal of mixed source seed and its establishment at all these locations would be required for the genetic characteristics we identified, and we consider that an unlikely scenario. Individuals sampled from the three Bass Strait islands (CI, DT, and RI) are linked to the western coastal cluster (BD), so our data do not support the hypothesis of Carlyon et al. [40] that P. lophantha is native to Rodondo Island (RI), Bass Strait.

4.4. Genetic Implications for Conservation and Management

The difference in genetic signals between the naturalized and native range in Australia is consistent with recent human-mediated movement and the establishment of P. lophantha in eastern Australia beyond its projected natural dispersal envelope. This is a concern for naturalized Australian regions where natural constraints on expansion may be absent and disturbance such as fire may enhance recruitment at the expense of other species [104]. The dominance and effect of P. lophantha on the integrity of recipient vegetation communities in the naturalized range but not the native range, highlight the need for a different approach to conservation and management in the two regions. For example, P. lophantha responds favorably to fire, which has been found to promote the spread of the species in SW Europe over the native vegetation [36]. This is a concern for its management in naturalized Australian regions that are prone to fires, particularly as young seedlings cannot be distinguished from native species of Acacia (M. O’Leary, pers. comm.).
The patterns of diversity in the native range of P. lophantha reflect the species’ evolutionary history. Therefore, an evolutionarily-based approach to conservation is recommended within the native range, where the emphasis should be placed on maintaining current levels of variation and conserving ongoing evolutionary processes [6,119]. Rossetto et al. [120] found substantial differences in the landscape genetics of five co-distributed naturally-occurring species of Acacia and demonstrated the importance of species-specific genetic and environmental data for obtaining evolutionarily representative germplasm for restoration. Ongoing habitat modification from climate change across SW WA has already caused massive forest dieback [121] and these outcomes undoubtedly create contemporary patterns of gene flow that are different from historical patterns. This is important because genetic connectivity is crucial to the future-proofing of species [120]. Therefore, we conclude that intervention may be required to maintain effective landscape-level connectivity and the ability of the species to respond to environmental change in the native range. This approach is in contrast to the management of naturalized populations where negative impacts of invasiveness need immediate attention and control by deploying strategies that prevent spread, establishment, and persistence (including the soil seedbank) and result in the protection of the recipient ecosystems and their services, but not P. lophantha [36,41]. The results of this study demonstrate the complexity of managing species that have become naturalized outside their native distribution. Improved environmental data will be a valuable addition for future management. In the meantime, balancing competing land uses will become more frequent as humans continue to alter ecosystems, resulting in dichotomous management strategies for one species within geopolitical boundaries.

Supplementary Materials

The following are available online at https://www.mdpi.com/1424-2818/12/11/422/s1: Figure S1: STRUCTURE analysis on native and naturalized samples. (a) K = 7 when all samples included and (b) K = 3 when no sibs. included (as per colony analysis); Table S1: Accession numbers and population codes (from Table 1) of sampled herbarium specimens and representative specimens of each population lodged from field collections. Detailed specimen data are available from the Australasian Virtual Herbarium (https://doi.org/10.26197/ala.6131e24d-bdf2-4c98-a487-dd6390da3c15); Table S2: Multi-locus genotypes (MLGs) shared across populations; Table S3: Sibling groups identified by colony. Groups 1–7, Pr > 0.80 (full sibs.); *Groups 8–13, Pr < 0.8; Prob(incl.) = probability of inclusion in group; Prob(excl.) = probability of exclusion from the group; nSibs = individuals per sib. group; nPopn = total num.; Table S4: Analysis of molecular variance (AMOVA) of all samples with small populations (n = 1 or 2: CA, GR, MA, PO, CI, DT, and RI) removed.

Author Contributions

Conceptualization, G.K.B.; methodology, G.K.B., C.W.A., C.L.S., and E.A.J.; validation, G.K.B., C.W.A., C.L.S., and E.A.J.; formal analysis, G.K.B., C.W.A., and C.L.S.; investigation, G.K.B., C.W.A., C.L.S., and E.A.J.; resources, G.K.B.; data curation, G.K.B., C.L.S., and C.W.A.; writing—original draft preparation, G.K.B.; writing—review and editing, G.K.B., E.A.J., C.W.A., and C.L.S.; visualization, G.K.B., C.W.A.; supervision, G.K.B.; project administration, G.K.B.; funding acquisition, G.K.B. All authors have read and agreed to the published version of the manuscript.

Funding

This research was funded by the University of Melbourne (Early Career Research Grant & School of Botany) and the Environmental Futures Network, ECR program.

Acknowledgments

We would like to thank Mike Gardner (University of Adelaide) for assistance developing microsatellite markers and AGRF Adelaide and Melbourne nodes for microsatellite screening. Thank you to Mike Bayly, Adele Gibbs, Adib Jamiran, Steven Watson, and Zoë Knapp for assistance with field work. Additional leaf material was also provided by John Wilson and Genevieve Thompson (University of Stellenbosch). AD, HO, PERTH, and MEL provided herbarium specimens for study.

Conflicts of Interest

The authors declare no conflict of interest.

References

  1. Levin, D.A. The Origin, Expansion and Demise of Plant Species; Oxford University Press: New York, NY, USA, 2000. [Google Scholar]
  2. Anderson, J.T.; Willis, J.H.; Mitchell-Olds, T. Evolutionary genetics of plant adaptation. Trends Genet. 2011, 27, 258–266. [Google Scholar] [CrossRef] [PubMed] [Green Version]
  3. Kireta, D.; Christmas, M.J.; Lowe, A.J.; Breed, M.F. Disentangling the evolutionary history of three related shrub species using genome-wide molecular markers. Conserv. Genet. 2019, 20, 1101–1112. [Google Scholar] [CrossRef]
  4. Givnish, T.J. The rise and fall of plant species: A population biologist’s perspective. Am. J. Bot. 2001, 88, 1928–1934. [Google Scholar] [CrossRef]
  5. Byrne, M. Phylogeography provides an evolutionary context for the conservation of a diverse and ancient flora. Aust. J. Bot. 2007, 55, 316–325. [Google Scholar] [CrossRef]
  6. Hoffmann, A.A.; Sgró, C.M. Climate change and evolutionary adaptation. Nature 2011, 470, 479–485. [Google Scholar] [CrossRef]
  7. Hoffmann, A.; Griffin, P.; Dillon, S.; Catullo, R.; Rane, R.; Byrne, M.; Jordan, R.; Oakeshott, J.; Weeks, A.; Joseph, L.; et al. A framework for incorporating evolutionary genomics into biodiversity conservation and management. Clim. Chang. Responses 2015, 2. [Google Scholar] [CrossRef] [Green Version]
  8. Leimu, R.; Fischer, M. A Meta-Analysis of Local Adaptation in Plants. PLoS ONE 2008, 3, e4010. [Google Scholar] [CrossRef] [Green Version]
  9. Abbott, R.J.; Brennan, A.C.; James, J.K.; Forbes, D.G.; Hegarty, M.J.; Hiscock, S.J. Recent hybrid origin and invasion of the British Isles by a self-incompatible species, Oxford ragwort (Senecio squalidus L., Asteraceae). Biol. Invasions 2009, 11, 1145–1158. [Google Scholar] [CrossRef]
  10. Antonelli, A.; Fry, C.; Smith, R.J.; Simmonds, M.S.J.; Kersey, P.J.; Pritchard, H.W.; Abbo, M.S.; Acedo, C.; Adams, J.; Ainsworth, A.M.; et al. State of the World’s Plants and Fungi 2020; Royal Botanic Gardens, Kew: Richmond, UK, 2020; p. 100. [Google Scholar] [CrossRef]
  11. Commander, L.E.; Coates, D.; Broadhurst, L.; Offord, C.A.; Makinson, R.O.; Matthes, M. Guidelines for the Translocation of Threatened Plants in Australia, 3rd ed.; Australian Network for Plant Conservation: Canberra, Australia, 2018; ISBN 9780975219133. [Google Scholar]
  12. Finger, A.; Kettle, C.J.; Kaiser-Bunbury, C.N.; Valentin, T.; Doudee, D.; Matatiken, D.; Ghazoul, J. Back from the brink: Potential for genetic rescue in a critically endangered tree. Mol. Ecol. 2011, 20, 3773–3784. [Google Scholar] [CrossRef]
  13. Gleadow, R.M.; Ashton, D.H. Invasion by Pittosporum undulatum of the Forests of Central Victoria. I. Invasion patterns and plant morphology. Aust. J. Bot. 1981, 29, 705–720. [Google Scholar] [CrossRef]
  14. Bean, A.R. A new system for determining which plant species are indigenous in Australia. Aust. Syst. Bot. 2007, 20, 1–43. [Google Scholar] [CrossRef]
  15. Olden, J.D.; Comte, L.; Giam, X. Biotic Homogenisation. eLS 2016, 1–8. [Google Scholar] [CrossRef]
  16. Dodd, A.J.; Burgman, M.A.; McCarthy, M.A.; Ainsworth, N. The changing patterns of plant naturalization in Australia. Divers. Distrib. 2015, 21, 1038–1050. [Google Scholar] [CrossRef]
  17. Cook, G.D.; Dias, L. It was no accident: Deliberate plant introductions by Australian government agencies during the 20th century. Aust. J. Bot. 2006, 54, 601. [Google Scholar] [CrossRef]
  18. Pyšek, P.; Richardson, D.M. Traits Associated with Invasiveness in Alien Plants: Where Do we Stand? In Biological Invasions; Nentwig, W., Ed.; Springer: Berlin/Heidelberg, Germany, 2008; pp. 97–125. [Google Scholar]
  19. Webber, B.L.; Scott, J.K. Rapid global change: Implications for defining natives and aliens. Glob. Ecol. Biogeogr. 2012, 21, 305–311. [Google Scholar] [CrossRef]
  20. Duxbury, K. Out of the garden and into the bush. Aust. Gard. Hist. 2002, 14, 2–4. [Google Scholar]
  21. Nielsen, I.; Guinet, P.; Baretta-Kuipers, T. Studies in the Malesian, Australian and Pacific Ingeae (Leguminosae-Mimosoideae): The genera Archidendropsis, Wallaceodendron, Paraserianthes, Pararchidendron and Serianthes (part 2). Bull. Muséum Natl. d’Histoire Nat. Sect. B Adansonia Bot. Phytochim. 1983, 5, 335–360. [Google Scholar]
  22. Brown, G.K. Systematics of the tribe Ingeae (Leguminosae-Mimosiodeae) over the last 25 years. Muelleria 2008, 26, 27–42. [Google Scholar]
  23. Brown, G.K.; Murphy, D.J.; Miller, J.T.; Ladiges, P.Y. Acacia s.s. and its Relationship Among Tropical Legumes, Tribe Ingeae (Leguminosae: Mimosoideae). Syst. Bot. 2008, 33, 739–751. [Google Scholar] [CrossRef]
  24. GBIF Paraserianthes lophantha subsp. montana GBIF Occurrence Records. Available online: https://www.gbif.org/occurrence/search?country=ID&taxon_key=2943721 (accessed on 27 October 2020).
  25. Nielsen, I. Mimosaceae (Leguminosae-Mimosoideae). Flora Males. Ser. I Spermatophyta 1992, 11, 1–226. [Google Scholar]
  26. Hopper, S.D. Biogeographical aspects of speciation in the southwest Australian flora. Annu. Rev. Ecol. Syst. 1979, 10, 399–422. [Google Scholar] [CrossRef]
  27. Gioia, P.; Hopper, S.D. A new phytogeographic map for the Southwest Australian Floristic Region after an exceptional decade of collection and discovery. Bot. J. Linn. Soc. 2017, 184, 1–15. [Google Scholar] [CrossRef]
  28. Cowan, R.S. Mimosaceae (excl. Acacia), Caesalpiniaceae. In Flora of Australia; CSIRO: Melbourne, Australia, 1998. [Google Scholar]
  29. Hopper, S.D.; Gioia, P. The Southwest Australian Floristic Region: Evolution and Conservation of a Global Hot Spot of Biodiversity. Annu. Rev. Ecol. Evol. Syst. 2004, 35, 623–650. [Google Scholar] [CrossRef]
  30. Characteristic Soils of South Western Australia. Geogr. Inf. Serv. Maps 2012. Available online: https://researchlibrary.agric.wa.gov.au/gis_maps/13/ (accessed on 1 November 2020).
  31. Tjio, J.H. The somatic chromosomes of some tropical plants. Hereditas 1948, 34, 135–146. [Google Scholar] [CrossRef]
  32. Fedorov, A.A. (Ed.) Chromosome Numbers of Flowering Plants; Komarov Botanical Institute: Leningrad, Russia, 1969. [Google Scholar]
  33. Kenrick, J.; Knox, R.B. Function of the polyad in reproduction of Acacia. Ann. Bot. 1982, 50, 721–727. [Google Scholar] [CrossRef]
  34. Dunphy, B.K.K.; Hamrick, J.L.L. Gene flow among established Puerto Rican populations of the exotic tree species, Albizia lebbeck. Heredity 2005, 94, 418–425. [Google Scholar] [CrossRef]
  35. Ruiz Guajardo, J.C.; Schnabel, A.; Ennos, R.; Preuss, S.; Otero-Arnaiz, A.; Stone, G. Landscape genetics of the key African acacia species Senegalia mellifera (Vahl)- the importance of the Kenyan Rift Valley. Mol. Ecol. 2010, 19, 5126–5139. [Google Scholar] [CrossRef]
  36. García-Duro, J.; Cruz, O.; Casal, M.; Reyes, O. Fire as driver of the expansion of Paraserianthes lophantha (Willd.) I. C. Nielsen in SW Europe. Biol. Invasions 2019, 21, 1427–1438. [Google Scholar] [CrossRef]
  37. Thompson, G.D.; Richardson, D.M.; Wilson, J.R.U.U.; Bellstedt, D.U.; Le Roux, J.J. Genetic diversity and structure of the globally invasive tree, Paraserianthes lophantha subspecies lophantha, suggest an introduction history characterised by varying propagule pressure. Tree Genet. Genomes 2016, 12. [Google Scholar] [CrossRef]
  38. Harris, C.J.; Dormontt, E.E.; Le Roux, J.J.; Lowe, A.; Leishman, M.R. No consistent association between changes in genetic diversity and adaptive responses of Australian acacias in novel ranges. Evol. Ecol. 2012, 26, 1345–1360. [Google Scholar] [CrossRef]
  39. Harris, S.; Davis, G. The vegetation and flor of Deal Island, Kent Group. Pap. Proc. R. Soc. Tasman. 1995, 129, 43–51. [Google Scholar]
  40. Carlyon, K.; Visoiu, M.; Hawkins, C.; Richards, K.; Alderman, R. Rodondo Island, Bass Strait: Biodiversity & Oil Spill Response Survey, January 2015. Nature Conservation Report Series 15/04; Natural and Cultural Heritage Division, DPIPWE: Hobart, Australia, 2015. [Google Scholar]
  41. Santamarina, S.; Alfaro-Saiz, E.; Llamas, F.; Acedo, C. Different approaches to assess the local invasion risk on a threatened species: Opportunities of using high-resolution species distribution models by selecting the optimal model complexity. Glob. Ecol. Conserv. 2019, 20. [Google Scholar] [CrossRef]
  42. Australian Weeds Committee Cape Leeuwin Wattle Weeds Australia. Available online: https://web.archive.org/web/20080804001332/http://www.weeds.org.au/cgi-bin/weedident.cgi?tpl=plant.tpl&ibra=all&card=E10 (accessed on 13 July 2020).
  43. Eurobodalla Shire Council South Coast Weeds—Cape Wattle. Available online: https://www.erbg.org.au/education-in-the-botanic-gardens/identify-your-weed/a-to-z-south-coast-weeds/ (accessed on 13 July 2020).
  44. Le Roux, J.J.; Brown, G.K.; Byrne, M.; Ndlovu, J.; Richardson, D.M.; Thompson, G.D.; Wilson, J.R.U. Phylogeographic consequences of different introduction histories of invasive Australian Acacia species and Paraserianthes lophantha (Fabaceae) in South Africa. Divers. Distrib. 2011, 17, 861–871. [Google Scholar] [CrossRef]
  45. Stirton, C. Plant Invaders: Beautiful, but Dangerous: A Guide to the Identification and Control of Twenty-Six Plant Invaders of the Province of the Cape of Good Hope; The Department of Nature and Environment Conservation of the Provincial Administration of the Cape of Good Hope, ABC Press: Cape Town, South Africa, 1978; ISBN 0798400927. [Google Scholar]
  46. Dennill, G.B.; Donnelly, D. Biological control of Acacia longifolia and related weed species (Fabaceae) in South Africa. Agric. Ecosyst. Environ. 1991, 37, 115–135. [Google Scholar] [CrossRef]
  47. Carr, G.W.; Yugovic, J.V.; Robinson, K.E. Environmental Weed Invasions in Victoria: Conservation and Management Implications; Dept. of Conservation and Environment and Ecological Horticulture Pty Ltd.: Melbourne, Australia, 1992. [Google Scholar]
  48. Schmidt, F.; Hoffmann, J.H.; Donnelly, D. Levels of damage caused by Melanterius servulus Pascoe (Coleoptera: Curculionidae), a seed-feeding weevil introduced into South Africa for biological control of Paraserianates lophantha (Fabaceae). Afr. Entomol. 1999, 7, 107–112. [Google Scholar]
  49. Henderson, L. Alien Weeds and Invasive Plants. A Complete Guide to Declared Weeds and Invaders in South Africa; Agricultural Research Council: Pretoria, South Africa, 2001; ISBN 1868491927. [Google Scholar]
  50. Muyt, A. Bush Invaders of South-East Australia: A Guide to the Identification and Control of Environmental Weeds Found in South-East Australia; R.G. and F.J. Richardson: Meredith, Australia, 2001; ISBN 0958743975. [Google Scholar]
  51. Lewis, G.P.; Rico Arce, M.L. Tribe Ingeae. In Legumes of the World; RBG Kew: Richmond, UK, 2005; pp. 193–213. [Google Scholar]
  52. Cunze, S.; Leiblein, M.C.; Tackenberg, O. Range Expansion of Ambrosia artemisiifolia in Europe Is Promoted by Climate Change. ISRN Ecol. 2013, 2013, 1–9. [Google Scholar] [CrossRef] [Green Version]
  53. Brown, G.K.; Murphy, D.J.; Ladiges, P.Y. Relationships of the Australo-Malesian genus Paraserianthes (Mimosoideae: Leguminosae) identifies the sister group of Acacia sensu stricto and two biogeographical tracks. Cladistics 2011, 27, 380–390. [Google Scholar] [CrossRef]
  54. Wheeler, M.A.; Byrne, M. Congruence between phylogeographic patterns in cpDNA variation in Eucalyptus marginata (Myrtaceae) and geomorphology of the Darling Plateau, south-west of Western Australia. Aust. J. Bot. 2006, 54, 17–26. [Google Scholar] [CrossRef]
  55. Byrne, M.; MacDonald, B.; Coates, D.J. Phylogeographical patterns in chloroplast DNA variation within the Acacia acuminata (Leguminosae: Mimosoideae) complex in Western Australia. J. Evol. Biol. 2002, 15, 576–587. [Google Scholar] [CrossRef]
  56. Byrne, M.; Hines, B. Phylogeographical analysis of cpDNA variation in Eucalyptus loxophleba (Myrtaceae). Aust. J. Bot. 2004, 52, 459–470. [Google Scholar] [CrossRef]
  57. Gouws, G.; Stewart, B.A.; Daniels, S.R. Phylogeographic structure of a freshwater crayfish (Decapoda: Parastacidae: Cherax preissii) in south-western Australia. Mar. Freshw. Res. 2006, 57, 837–848. [Google Scholar] [CrossRef]
  58. Edwards, D.L.; Dale Roberts, J.; Scott Keogh, J. Climatic fluctuations shape the phylogeography of a mesic direct-developing frog from the south-western Australian biodiversity hotspot. J. Biogeogr. 2008, 35, 1803–1815. [Google Scholar] [CrossRef] [Green Version]
  59. Cooper, S.J.B.; Harvey, M.S.; Saint, K.M.; Main, B.Y. Deep phylogeographic structuring of populations of the trapdoor spider Moggridgea tingle (Migidae) from southwestern Australia: Evidence for long-term refugia within refugia. Mol. Ecol. 2011, 20, 3219–3236. [Google Scholar] [CrossRef] [PubMed]
  60. Levy, E.; Kennington, W.J.; Tomkins, J.L.; Lebas, N.R. Phylogeography and population genetic structure of the Ornate Dragon Lizard, Ctenophorus ornatus. PLoS ONE 2012, 7, e46351. [Google Scholar] [CrossRef] [PubMed] [Green Version]
  61. Kay, G.M.; Keogh, J.S. Molecular phylogeny and morphological revision of the Ctenotus labillardieri (Reptilia: Swuamata: Scincidae) species group and a new species of immediate conservation concern in the southwestern Australian biodiversity hotspot. Zootaxa 2012, 3390, 1–18. [Google Scholar] [CrossRef]
  62. Shaw, J.; Lickey, E.B.; Schilling, E.E.; Small, R.L. Comparison of whole chloroplast genome sequences to choose noncoding regions for phylogenetic studies in angiosperms: The Tortoise and the hare III. Am. J. Bot. 2007, 94, 275–288. [Google Scholar] [CrossRef] [PubMed] [Green Version]
  63. Johnson, L.A.; Soltis, D.E. matK DNA Sequences and Phylogenetic Reconstruction in Saxifragaceae s. str. Syst. Bot. 1994, 19, 143–156. [Google Scholar] [CrossRef]
  64. Miller, J.T.; Bayer, R.J. Molecular phylogenetics of Acacia (Fabaceae: Mimosoideae) based on the chloroplast matK coding sequence and flanking trnK intro spacer regions. Am. J. Bot. 2001, 88, 697–705. [Google Scholar] [CrossRef]
  65. Hall, T.A. BioEdit: A user-friendly biological sequence alignment editor and analysis program for Windows 95/98/NT. Nucleic Acids Symp. Ser. 1999, 41, 95–98. [Google Scholar]
  66. Nylander, J.A.A. MrModeltest v2. Program distributed by the author. Evol. Biol. Cent. Upps. Univ. 2004, 2, 1–2. [Google Scholar]
  67. Simmons, M.P.; Ochoterena, H. Gaps as characters in sequence-based phylogenetic analyses. Syst. Biol. 2000, 49, 369–381. [Google Scholar] [CrossRef] [PubMed] [Green Version]
  68. Letunic, I.; Bork, P. Interactive Tree Of Life (iTOL) v4: Recent updates and new developments. Nucleic Acids Res. 2019, 47, W256–W259. [Google Scholar] [CrossRef] [PubMed] [Green Version]
  69. Brown, G.K.; Gardner, M.G. Isolation, characterisation and transferability of microsatellites for Paraserianthes lophantha, Cape Wattle (Leguminosae: Mimosoideae): A significant weed worldwide. Muelleria 2011, 29, 87–92. [Google Scholar]
  70. Schuelke, M. An economic method for the fluorescent labeling of PCR fragments. Nat. Biotechnol. 2000, 18, 233–234. [Google Scholar] [CrossRef] [PubMed]
  71. Butcher, P.A.; Decroocq, S.; Gray, Y.; Moran, G.F. Development, inheritance and cross-species amplification of microsatellite markers from Acacia mangium. Theor. Appl. Genet. 2000, 101, 1282–1290. [Google Scholar] [CrossRef]
  72. Millar, M.A.; Byrne, M. Characterization of polymorphic microsatellite DNA markers for Acacia saligna (Labill.) H.L.Wendl. (Mimosaceae). Mol. Ecol. Notes 2007, 7, 1372–1374. [Google Scholar] [CrossRef]
  73. Grimes, J. Inflorescence morphology, heterochrony, and phylogeny in the mimosoid tribes Ingeae and Acacieae (Leguminosae: Mimosoideae). Bot. Rev. 1999, 65, 317–347. [Google Scholar] [CrossRef]
  74. Kress, W.J. Sibling Competition and Evolution of Pollen Unit, Ovule Number, and Pollen Vector in Angiosperms. Syst. Bot. 1981, 6, 101. [Google Scholar] [CrossRef]
  75. Muona, O.; Moran, G.F.; Bell, J.C. Hierarchical patterns of correlated mating in Acacia melanoxylon. Genetics 1991, 127, 619–626. [Google Scholar]
  76. Casiva, P.V.; Vilardi, J.C.; Cialdella, A.M.; Saidman, B.O. Mating system and population structure of Acacia aroma and A. macracantha (Fabaceae). Am. J. Bot. 2004, 91, 58–64. [Google Scholar] [CrossRef] [Green Version]
  77. Waples, R.S.; Anderson, E.C. Purging putative siblings from population genetic data sets: A cautionary view. Mol. Ecol. 2017, 26, 1211–1224. [Google Scholar] [CrossRef] [PubMed] [Green Version]
  78. Jones, O.R.; Wang, J. COLONY: A program for parentage and sibship inference from multilocus genotype data. Mol. Ecol. Resour. 2010, 10, 551–555. [Google Scholar] [CrossRef] [PubMed]
  79. Meimans, P.G.; Van Tienderen, P.H.; Meirmans, P.G.; Van Tienderen, P.H. Genotype and Genodive: Two programs for the analysis of genetic diversity of asexual organisms. Mol. Ecol. Notes 2004, 4, 792–794. [Google Scholar] [CrossRef]
  80. Jombart, T. Adegenet: A R package for the multivariate analysis of genetic markers. Bioinformatics 2008, 24, 1403–1405. [Google Scholar] [CrossRef] [PubMed] [Green Version]
  81. R Core Development Team. R: A Language and Environment for Statistical Computing; R foundation for Statistical Computing: Vienna, Austria, 2015. [Google Scholar]
  82. Pritchard, J.K.; Stephens, M.; Donnelly, P. Inference of Population Structure Using Multilocus Genotype Data. Genetics 2000, 155, 945–959. [Google Scholar] [CrossRef]
  83. Falush, D.; Stephens, M.; Pritchard, J.K. Inference of population structure using multilocus genotype data: Linked loci and correlated allele frequencies. Genetics 2003, 164, 1567–1587. [Google Scholar] [CrossRef]
  84. Evanno, G.; Regnaut, S.; Goudet, J. Detecting the number of clusters of individuals using the software structure: A simulation study. Mol. Ecol. 2005, 14, 2611–2620. [Google Scholar] [CrossRef] [Green Version]
  85. Earl, D.A.; VonHoldt, B.M. STRUCTURE HARVESTER: A website and program for visualizing STRUCTURE output and implementing the Evanno method. Conserv. Genet. Resour. 2012, 4, 359–361. [Google Scholar] [CrossRef]
  86. Kopelman, N.M.; Mayzel, J.; Jakobsson, M.; Rosenberg, N.A.; Mayrose, I. CLUMPAK: A program for identifying clustering modes and packaging population structure inferences across K. Mol. Ecol. Resour. 2015, 15, 1179–1191. [Google Scholar] [CrossRef] [Green Version]
  87. Oksanen, J.; Blanchet, F.G.; Friendly, M.; Kindt, R.; Legendre, P.; McGlinn, D.; Minchin, P.R.; O’Hara, R.B.; Simpson, G.L.; Solymos, P.; et al. Vegan: Community Ecology Package. R Package Version 2.5-3. 2018. Available online: https://cran.r-project.org/web/packages/vegan/ (accessed on 1 November 2020).
  88. Elias, T.S. The genera of Mimosoideae (Leguminosae) in the Southeastern United States. J. Arnold Arbor. 1974, 1, 67–118. [Google Scholar]
  89. Broadhurst, L.; Coates, D.J. Genetic diversity within and divergence between rare and geographically widespread taxa of the Acacia acuminata Benth. (Mimosaceae) complex. Heredity 2002, 88, 250–257. [Google Scholar] [CrossRef] [PubMed] [Green Version]
  90. Butcher, P.A.; Moran, G.F.; Perkins, H.D. RFLP diversity in the nuclear genome of Acacia mangium. Heredity 1998, 81, 205–213. [Google Scholar] [CrossRef]
  91. Khasa, P.D.; Cheliak, W.M.; Bousquet, J. Mating system of Racosperma auriculiforme in a seed production area in Zaire. Can. J. Bot. 1993, 71, 779–785. [Google Scholar] [CrossRef]
  92. McDonald, M.W.; Butcher, P.A.; Bell, J.C.; Nguyen, C. V Clinal variation and genetic divergence in Acacia tumida (Mimosaceae). Aust. Syst. Bot. 2003, 16, 57–68. [Google Scholar] [CrossRef]
  93. Millar, M.A.; Byrne, M. Biogeographic origins and reproductive mode of naturalised populations of Acacia saligna. Aust. J. Bot. 2012, 60, 383–395. [Google Scholar] [CrossRef]
  94. Millar, M.A.; Coates, D.J.; Byrne, M. Genetic connectivity and diversity in inselberg populations of Acacia woodmaniorum, a rare endemic of the Yilgarn Craton banded iron formations. Heredity 2013, 111, 437. [Google Scholar] [CrossRef] [Green Version]
  95. Playford, J.; Bell, J.C.; Moran, G.F. A Major Disjunction in Genetic Diversity over the Geographic Range of Acacia melanoxylon R. Br. Aust. J. Bot. 1993, 41, 355–368. [Google Scholar] [CrossRef]
  96. Searle, S.D.; Bell, J.C.; Moran, G.F. Genetic diversity in natural populations of Acacia mearnsii. Aust. J. Bot. 2000, 48, 279–286. [Google Scholar] [CrossRef]
  97. Kenrick, J.; Knox, R.B. Quantitative Analysis of Self-Incompatibility in Trees of Seven Species of Acacia. J. Hered. 1989, 80, 240–245. [Google Scholar] [CrossRef]
  98. Endress, P.K. Diversity and Evolutionary Biology of Tropical Flowers; Cambridge University Press: Cambridge, UK; New York, NY, USA, 1996; ISBN 9780521565103. [Google Scholar]
  99. Bumrungsri, S.; Harbit, A.; Benzie, C.; Carmouche, K.; Sridith, K.; Racey, P. The pollination ecology of two species of Parkia (Mimosaceae) in southern Thailand. J. Trop. Ecol. 2008, 24, 467–475. [Google Scholar] [CrossRef]
  100. Pometti, C.L.; Bessega, C.F.; Vilardi, J.C.; Saidman, B.O. Comparison of mating system parameters and genetic structure in three natural scenarios of Acacia visco (Leguminosae, Mimosoideae). Plant. Syst. Evol. 2013, 299, 761–771. [Google Scholar] [CrossRef]
  101. Vilas, A.; Pérez-Figueroa, A.; Quesada, H.; Caballero, A. Allelic diversity for neutral markers retains a higher adaptive potential for quantitative traits than expected heterozygosity. Mol. Ecol. 2015, 24, 4419–4432. [Google Scholar] [CrossRef] [PubMed]
  102. Harris, C.J.; Manea, A.; Moles, A.T.; Murray, B.R.; Leishman, M.R. Differences in life-cycle stage components between native and introduced ranges of five woody Fabaceae species. Austral. Ecol. 2017, 42, 404–413. [Google Scholar] [CrossRef]
  103. Colautti, R.I.; Barrett, S.C.H. Rapid adaptation to climate facilitates range expansion of an invasive plant. Science 2013, 342, 364–366. [Google Scholar] [CrossRef] [PubMed]
  104. Hallett, S.G. Dislocation from coevolved relationships: A unifying theory for plant invasion and naturalization? Weed Sci. 2006, 54, 282–290. [Google Scholar] [CrossRef]
  105. Commonwealth of Australia IBRA7 Interim Biogeographic Regionalisation for Australia 2012, 02. Available online: https://www.environment.gov.au/system/files/pages/5b3d2d31-2355-4b60-820c-e370572b2520/files/bioregions-new.pdf (accessed on 1 November 2020).
  106. Rajora, O.P.; Eckert, A.J.; Zinck, J.W.R. Single-locus versus multilocus patterns of local adaptation to climate in eastern white pine (Pinus strobus, Pinaceae). PLoS ONE 2016, 11, 1–26. [Google Scholar] [CrossRef] [Green Version]
  107. Nistelberger, H.; Gibson, N.; Macdonald, B.; Tapper, S.; Byrne, M. Phylogeographic evidence for two mesic refugia in a biodiversity hotspot. Heredity 2014, 113, 454–463. [Google Scholar] [CrossRef] [Green Version]
  108. Walters, S.J.; Robinson, T.P.; Byrne, M.; Wardell-Johnson, G.W.; Nevill, P. Contrasting patterns of local adaptation along climatic gradients between a sympatric parasitic and autotrophic tree species. Mol. Ecol. 2020, 1–16. [Google Scholar] [CrossRef]
  109. Sampson, J.; Tapper, S.; Coates, D.J.; Hankinson, M.; Mcarthur, S.; Byrne, M. Persistence with episodic range expansion from the early Pleistocene: The distribution of genetic variation in the forest tree Corymbia calophylla (Myrtaceae) in south-western Australia. Biol. J. Linn. Soc. 2018, 123, 545–560. [Google Scholar] [CrossRef]
  110. Broadhurst, L.; Breed, M.F.; Lowe, A.; Bragg, J.; Catullo, R.; Coates, D.J.; Encinas-viso, F.; Gellie, N.; James, E.; Krauss, S.; et al. Genetic diversity and structure of the Australian flora. Divers. Distrib. 2017, 23, 41–52. [Google Scholar] [CrossRef] [Green Version]
  111. Ahrens, C.W.; Byrne, M.; Rymer, P.D. Standing genomic variation within coding and regulatory regions contributes to the adaptive capacity to climate in a foundation tree species. Mol. Ecol. 2019, 28, 2502–2516. [Google Scholar] [CrossRef] [PubMed]
  112. Raymond, O.L.; Gallagher, R.; Shaw, R.; Yeates, A.N.; Doutch, H.F.; Palfreyman, W.D.; Blake, D.H.; Highet, L. Surface Geology of Australia 1:2.5 Million Scale Dataset, 2012 ed.; Commonwealth of Australia (Geoscience Australia): Canberra, Australia, 2012. [Google Scholar] [CrossRef]
  113. Atlas Of Living Australia ALA Paraserianthes Occurrence Records. Available online: https://doi.ala.org.au/doi/10.26197/5d8c4e6842581 (accessed on 26 September 2019).
  114. Stojanova, B.; Šurinová, M.; Zeisek, V.; Münzbergová, Z.; Pánková, H. Low genetic differentiation despite high fragmentation in the endemic serpentinophyte Minuartia smejkalii (M. verna agg., Caryophyllaceae) revealed by RADSeq SNP markers. Conserv. Genet. 2020, 21, 187–198. [Google Scholar] [CrossRef]
  115. Cornuet, J.M.; Luikart, G. Description and Power Analysis of Two Tests for Detecting Recent Population Bottlenecks From Allele Frequency Data. Genetics 1996, 144, 2001–2014. [Google Scholar] [PubMed]
  116. Cumming, D.A.; Garratt, D.; McCarthy, M.; Wolfe, A. Port Related Structures on the Coast of Western Australia; No.98; Department of Maritime Archaeology, Western Australian Maritime Museum: Fremantle, Australia, 1995. [Google Scholar]
  117. Cambage, R.H. Acacia seedlings Part I. J. R. Soc. New South Wales 1915, 49, 81–121. [Google Scholar]
  118. Godfrey, J.S.; Ridgway, K.R. The Large-Scale Environment of the Poleward-Flowing Leeuwin Current, Western Australia: Longshore Steric Height Gradients, Wind Stresses and Geostrophic Flow. J. Phys. Oceanogr. 1985, 15, 481–495. [Google Scholar] [CrossRef] [Green Version]
  119. Sgrò, C.M.; Lowe, A.J.; Hoffmann, A.A. Building evolutionary resilience for conserving biodiversity under climate change. Evol. Appl. 2011, 4, 326–337. [Google Scholar] [CrossRef]
  120. Rossetto, M.; Wilson, P.D.; Bragg, J.; Cohen, J.; Fahey, M.; Yap, J.S.; van der Merwe, M. Perceptions of Similarity Can Mislead Provenancing Strategies—An Example from Five Co-Distributed Acacia Species. Diversity 2020, 12, 306. [Google Scholar] [CrossRef]
  121. Brouwers, N.; Matusick, G.; Ruthrof, K.; Lyons, T.; Hardy, G. Landscape-scale assessment of tree crown dieback following extreme drought and heat in a Mediterranean eucalypt forest ecosystem. Landsc. Ecol. 2013, 28, 69–80. [Google Scholar] [CrossRef] [Green Version]
Figure 1. Dark gray areas show the broad extent of native and naturalized populations based on herbarium records on The Australasian Virtual Herbarium from 1826 to the present day. Small white circles show the location of sample sites. Approximate southwest Western Australia (SW WA) floristic provinces as per [27] indicated for the natural range. Details on population codes (e.g., PR and YG) can be found in Table 1.
Diversity 12 00422 g001
Figure 2. cpDNA Bayesian phylogeny. Unrooted tree with posterior probabilities shown for each clade. Individuals are labeled with their population (as in Table 1); those given in blue are native and those in green are naturalized.
Diversity 12 00422 g002
Figure 3. Discriminant analysis of principal components (DAPC) reveals genetic structuring at the regional and native population levels, while also revealing sources of genetic material for the naturalized populations. (a) Differences in the structure and amount of genetic variation between native and naturalized populations. (b) Genetic differences between native populations explaining 58.2% of the variation (x-axis: 37.2%; y-axis: 21.0%). (c) For the native populations, individual probabilities of the eight genetic clusters, where each bar represents an individual and the y-axis is the probability, with 0 at the bottom and 1 at the top. (d) Probabilities of assignment of naturalized individuals to native genetic clusters, with naturalized populations on the y-axis and genetic clusters on the x-axis. Genetic cluster colors for a, b, and c indicate the same clusters, and shapes for b and c are the same.
Diversity 12 00422 g003
Figure 4. STRUCTURE analysis identified an optimal value of K = 4 when only all native (WA) samples were included.
Diversity 12 00422 g004
Figure 5. Redundancy analysis with the mean annual precipitation (BIO12), maximum temperature of the warmest month (BIO5), and isothermality (BIO3). Individuals are labeled with their population (as in Table 1). Arrow length indicates the magnitude of variation explained (r2) for each climate variable (BIO12, p = 0.017, r2 = 0.61; BIO5, p = 0.001, r2 = 0.32; BIO3, p = 0.097, r2 = 0.20).
Diversity 12 00422 g005
Table 1. Population information and genetic diversity for 14 native and 10 naturalized populations of Paraserianthes lophantha. N = number of individuals, Ne = number of effective alleles, Ho = observed heterozygosity (bold = Ho < He), He = expected heterozygosity, and FIS = Wright’s inbreeding coefficient.
All IndividualsNo Siblings in Populations
PopnLocationNNeHoHeFISNNeHoHeFIS
Native
BDBoranup Drive202.3050.3890.4690.178182.3080.3820.4760.192
BHBoat Harbour201.4570.2110.280.24531.4410.2410.3330.195
CACape Arid1-0.444--1-0.444--
DRDonnelly River181.14800.1061181.14800.1061
GRGraphit Rd21.2670.0560.250.521.2670.0560.250.5
GSGingilup Swamp201.310.0810.1760.351-0.222--
MAManjimup1-0.22--1-0.222--
MRMorangup Reserve211.1670.0730.0780.023211.1670.0730.0780.023
POPorongorups21.66700.667121.66700.6671
RCRecherche Islands53.2770.4440.6580.3553.2770.4440.6580.35
SRSerpentine River National Park192.0980.1950.3410.429192.0980.1950.3410.429
VTVan Tripp Rd201.3030.1190.1960.3761-0.111--
WDWellington Dam191.3020.0930.1870.313191.3020.0930.1870.313
YGYallingup211.2930.0710.1910.74521.8810.1670.7220.714
Naturalized
CICraggy Island21.1250.1250.063−11-0.125--
DTDevil’s Tower1-0.25--1-0.25--
EPEyre Peninsula171.0970.0590.0740.43171.0970.0590.0740.43
KIKangaroo Island241.2430.2180.137−0.245241.2430.2180.137−0.245
LELakes Entrance81.3520.2780.173−0.59181.3520.2780.173−0.591
PIPhillip Island71.5210.2380.2940.06871.5210.2380.2940.068
PRPudney’s Rd41.2580.1880.141−0.31-0.143--
RIRodondo Island1-0.125--1-0.125--
WGWaterfall Gully161.7050.220.3530.361.6650.2590.4390.278
WRWye River201.4790.1570.2710.498201.4790.1570.2710.498
Table 2. Results of hierarchical analysis of molecular variance (AMOVA) based on Fst for populations of P. lophantha for all samples and for the reduced dataset.
SourcedfSums of SquaresMean Sum of SquaresEstimated Variation % Variationp Value
all samples (n = 289)
Among Regions1425.66425.662.89727.70.001
Among Pops221262.50457.3874.57843.70.001
Within Pops265792.8642.9922.99228.6
reduced dataset (n = 199)
Among Regions1355.749355.7493.08931.30.001
Among Pops22697.67131.7121.92137.90.001
Within Pops175532.4443.0432.86330.8
Publisher’s Note: MDPI stays neutral with regard to jurisdictional claims in published maps and institutional affiliations.

