
A Multichannel Fluorescent Tongue for Amyloid-β Aggregates Detection
 and
and 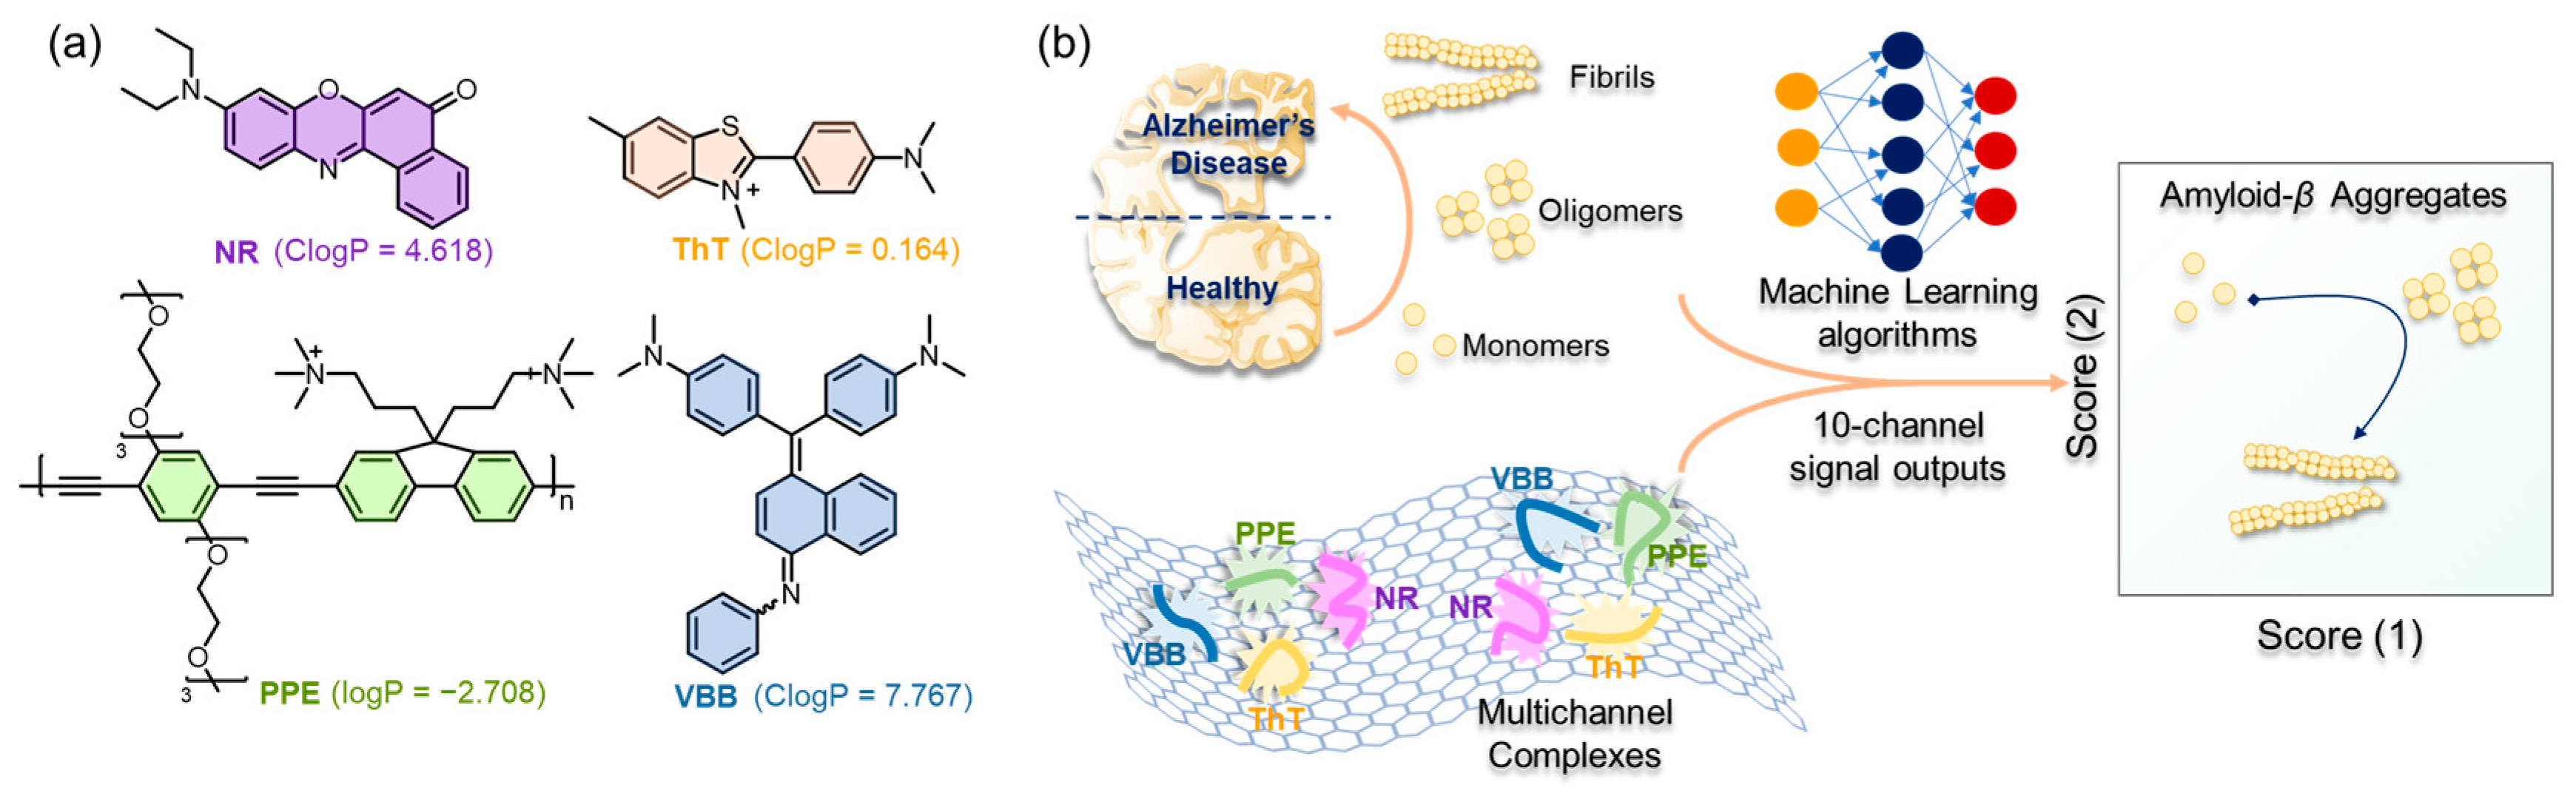
Abstract
:1. Introduction
2. Results and Discussion
3. Methods and Materials
3.1. Reagent
3.2. Instrumentation
3.3. Machine Learning Algorithms
3.4. Linear Discriminant Analysis
3.5. Titration Experiment and Preparation of Sensor
3.6. Pretreatment of Aβ Proteins
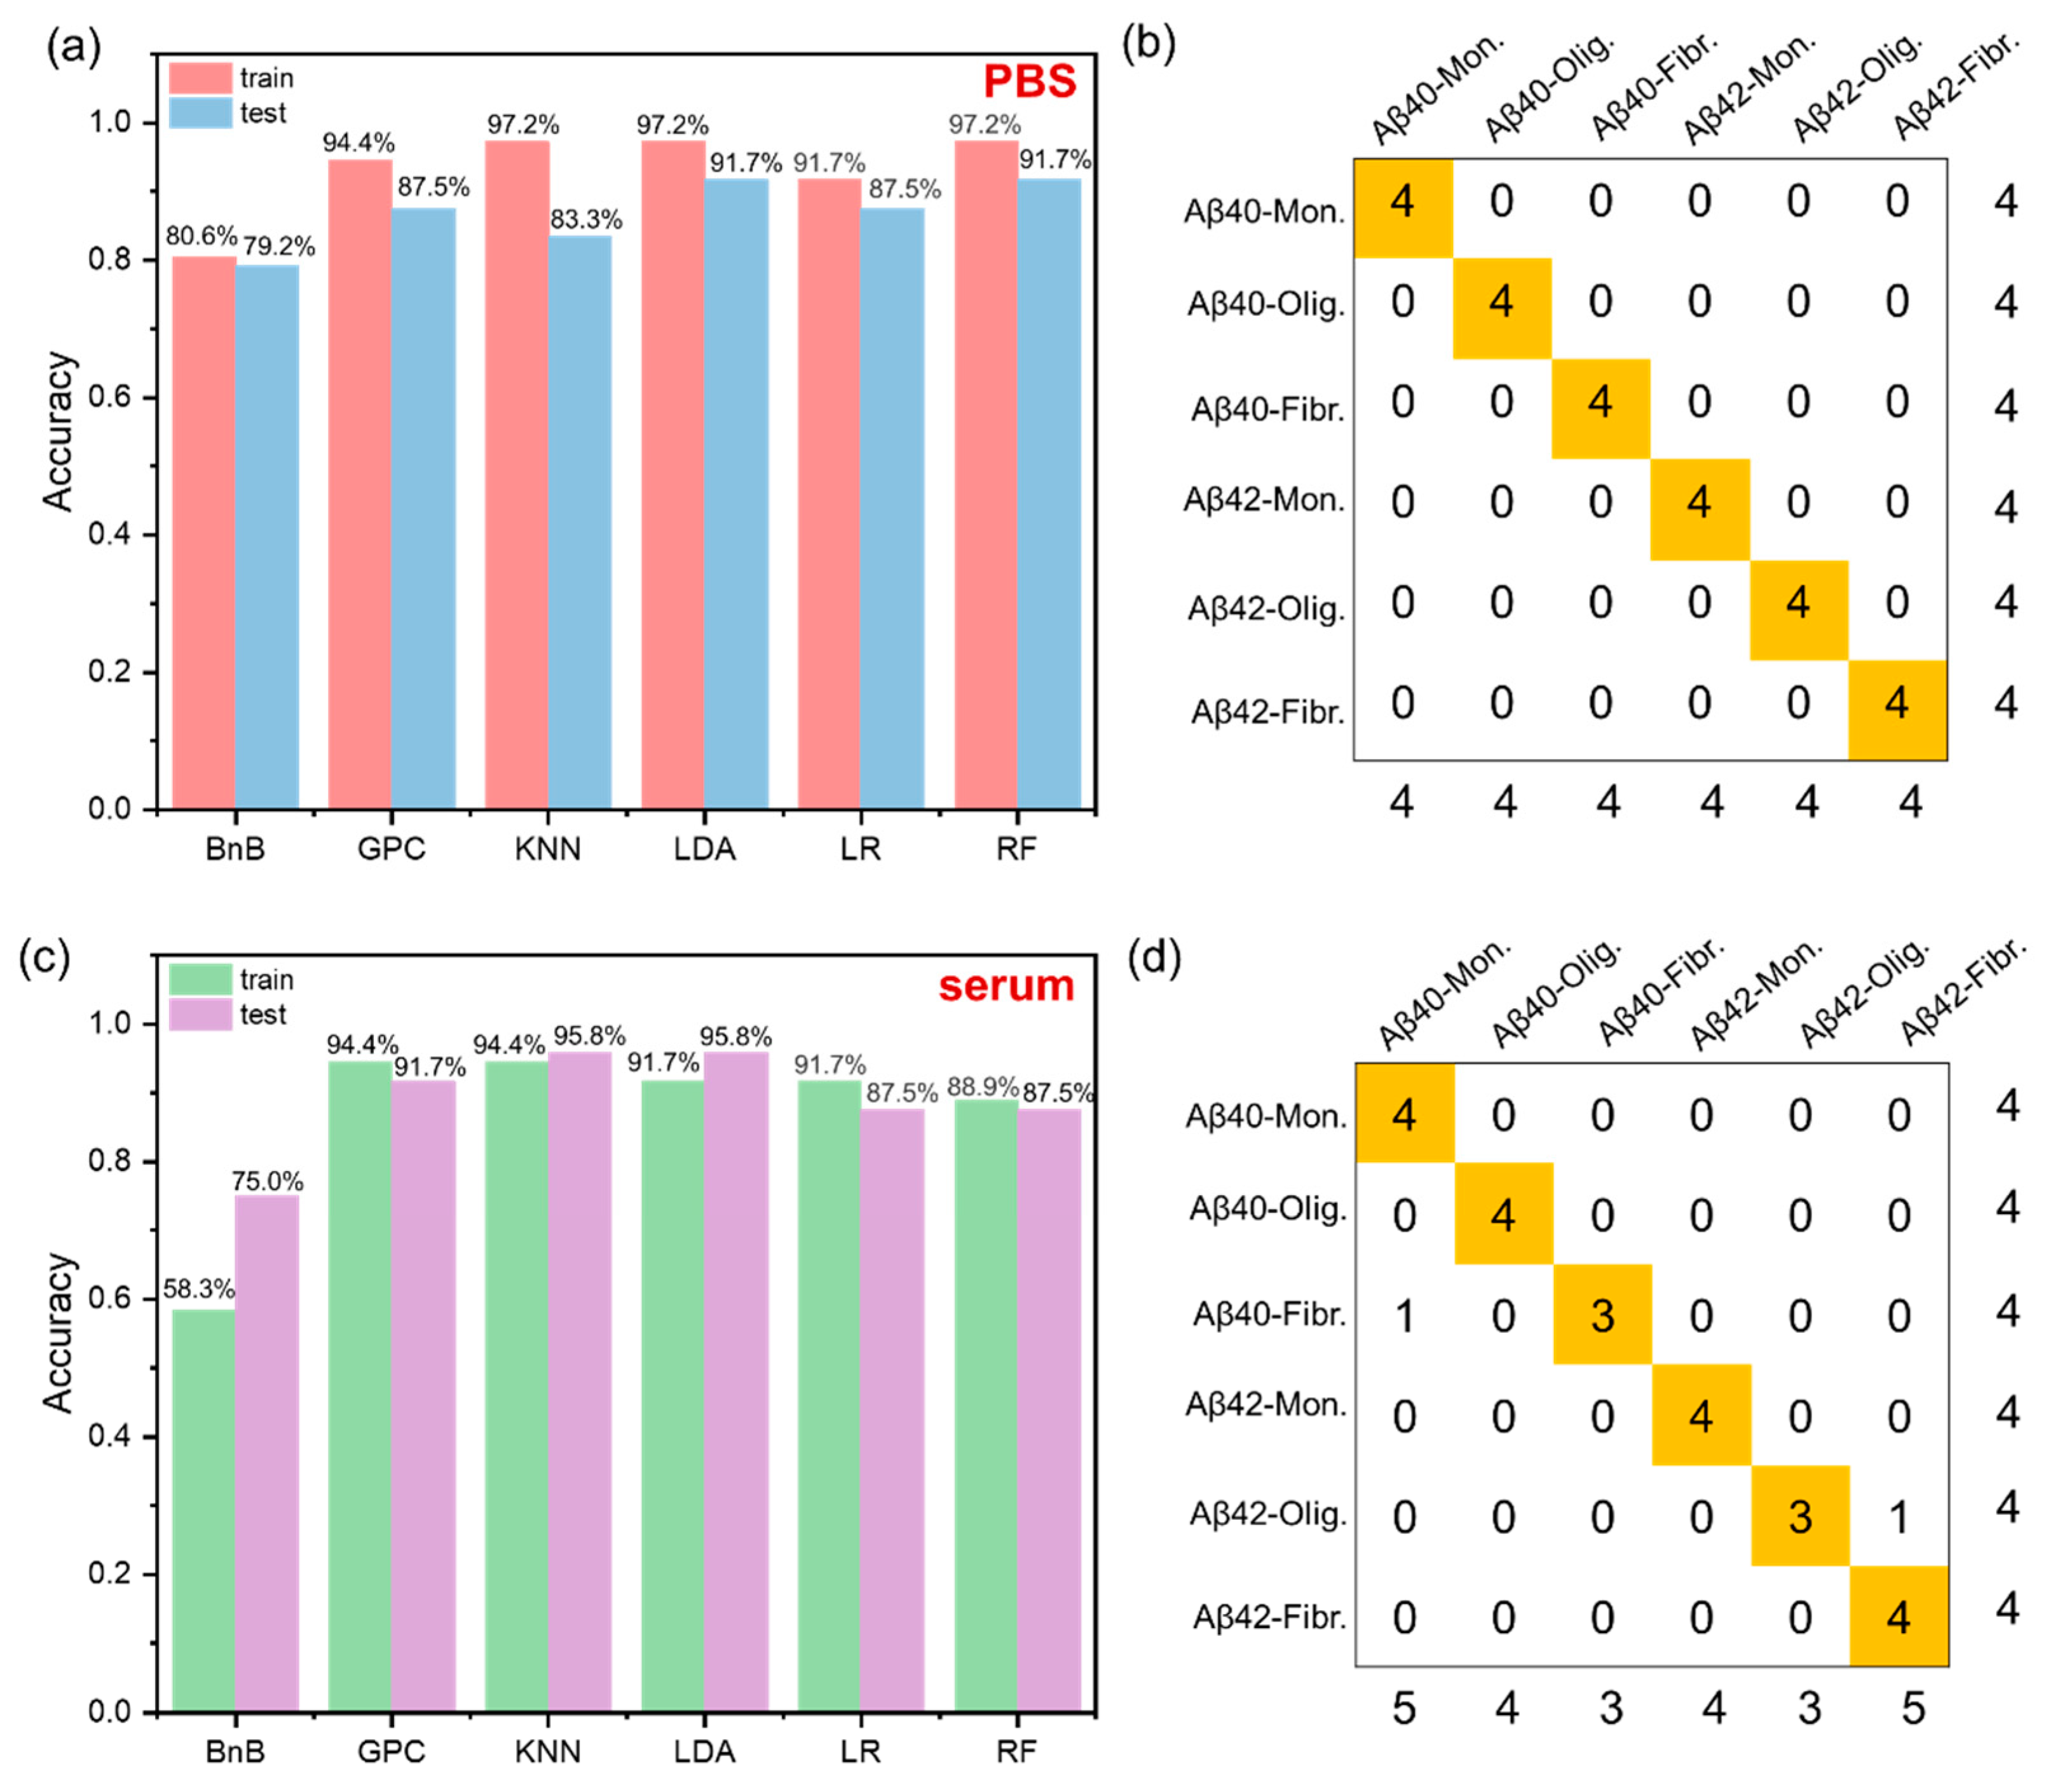
3.7. Aβ40/Aβ42 Aggregates Identification
4. Conclusions
Supplementary Materials
Author Contributions
Funding
Institutional Review Board Statement
Informed Consent Statement
Data Availability Statement
Conflicts of Interest
References
- Zhang, P.; Tan, C. Cross-Reactive Fluorescent Sensor Array for Discrimination of Amyloid Beta Aggregates. Anal. Chem. 2022, 94, 5469–5473. [Google Scholar] [CrossRef] [PubMed]
- Duan, Y.; Chen, J.; Jin, Y.; Tu, Q.; Wang, S.; Xiang, J. Antibody-Free Determinations of Low-Mass, Soluble Oligomers of Abeta42 and Abeta40 by Planar Bilayer Lipid Membrane-Based Electrochemical Biosensor. Anal. Chem. 2021, 93, 3611–3617. [Google Scholar] [CrossRef] [PubMed]
- Xu, L.; Wang, H.; Xu, Y.; Cui, W.; Ni, W.; Chen, M.; Huang, H.; Stewart, C.; Li, L.; Li, F.; et al. Machine Learning-Assisted Sensor Array Based on Poly(amidoamine) (PAMAM) Dendrimers for Diagnosing Alzheimer’s Disease. ACS Sens. 2022, 7, 1315–1322. [Google Scholar] [CrossRef] [PubMed]
- Fu, W.; Yan, C.; Guo, Z.; Zhang, J.; Zhang, H.; Tian, H.; Zhu, W.H. Rational Design of Near-Infrared Aggregation-Induced-Emission-Active Probes: In Situ Mapping of Amyloid-beta Plaques with Ultrasensitivity and High-Fidelity. J. Am. Chem. Soc. 2019, 141, 3171–3177. [Google Scholar] [CrossRef] [PubMed]
- Tago, T.; Furumoto, S.; Okamura, N.; Harada, R.; Adachi, H.; Ishikawa, Y.; Yanai, K.; Iwata, R.; Kudo, Y. Structure-Activity Relationship of 2-Arylquinolines as PET Imaging Tracers for Tau Pathology in Alzheimer Disease. J. Nucl. Med. 2016, 57, 608–614. [Google Scholar] [CrossRef] [PubMed] [Green Version]
- Ariza, M.; Kolb, H.C.; Moechars, D.; Rombouts, F.; Andres, J.I. Tau Positron Emission Tomography (PET) Imaging: Past, Present, and Future. J. Med. Chem. 2015, 58, 4365–4382. [Google Scholar] [CrossRef]
- Liu, T.C.; Lee, Y.C.; Ko, C.Y.; Liu, R.S.; Ke, C.C.; Lo, Y.C.; Hong, P.S.; Chu, C.Y.; Chang, C.W.; Wu, P.W.; et al. Highly sensitive/selective 3D nanostructured immunoparticle-based interface on a multichannel sensor array for detecting amyloid-beta in Alzheimer’s disease. Theranostics 2018, 8, 4210–4225. [Google Scholar] [CrossRef]
- Pietroboni, A.M.; Colombi, A.; Carandini, T.; Sacchi, L.; Fenoglio, C.; Marotta, G.; Arighi, A.; De Riz, M.A.; Fumagalli, G.G.; Castellani, M.; et al. Amyloid PET imaging and dementias: Potential applications in detecting and quantifying early white matter damage. Alzheimer’s Res. Ther. 2022, 14, 33. [Google Scholar] [CrossRef]
- Perez-Grijalba, V.; Fandos, N.; Canudas, J.; Insua, D.; Casabona, D.; Lacosta, A.M.; Montanes, M.; Pesini, P.; Sarasa, M. Validation of Immunoassay-Based Tools for the Comprehensive Quantification of Abeta40 and Abeta42 Peptides in Plasma. J. Alzheimer’s Dis. 2016, 54, 751–762. [Google Scholar] [CrossRef] [Green Version]
- Li, F.; Stewart, C.; Yang, S.; Shi, F.; Cui, W.; Zhang, S.; Wang, H.; Huang, H.; Chen, M.; Han, J. Optical Sensor Array for the Early Diagnosis of Alzheimer’s Disease. Front. Chem. 2022, 10, 874864. [Google Scholar] [CrossRef] [PubMed]
- Kim, K.; Kim, M.J.; Kim, D.W.; Kim, S.Y.; Park, S.; Park, C.B. Clinically accurate diagnosis of Alzheimer’s disease via multiplexed sensing of core biomarkers in human plasma. Nat. Commun. 2020, 11, 119. [Google Scholar] [CrossRef] [PubMed] [Green Version]
- Han, X.; Man, Z.; Xu, S.; Cong, L.; Wang, Y.; Wang, X.; Du, Y.; Zhang, Q.; Tang, S.; Liu, Z.; et al. A gold nanocluster chemical tongue sensor array for Alzheimer’s disease diagnosis. Colloids Surf. B 2019, 173, 478–485. [Google Scholar] [CrossRef] [PubMed]
- Anzenbacher, P., Jr.; Lubal, P.; Bucek, P.; Palacios, M.A.; Kozelkova, M.E. A practical approach to optical cross-reactive sensor arrays. Chem. Soc. Rev. 2010, 39, 3954–3979. [Google Scholar] [CrossRef] [PubMed]
- Qiao, M.; Fan, J.; Ding, L.; Fang, Y. Fluorescent Ensemble Sensors and Arrays Based on Surfactant Aggregates Encapsulating Pyrene-Derived Fluorophores for Differentiation Applications. ACS Appl. Mater. Interfaces 2021, 13, 18395–18412. [Google Scholar] [CrossRef]
- Li, Z.; Askim, J.R.; Suslick, K.S. The Optoelectronic Nose: Colorimetric and Fluorometric Sensor Arrays. Chem. Rev. 2019, 119, 231–292. [Google Scholar] [CrossRef]
- Li, Z.; Suslick, K.S. The Optoelectronic Nose. Acc. Chem. Res. 2021, 54, 950–960. [Google Scholar] [CrossRef] [PubMed]
- Sedgwick, A.C.; Brewster, J.T.; Wu, T.; Feng, X.; Bull, S.D.; Qian, X.; Sessler, J.L.; James, T.D.; Anslyn, E.V.; Sun, X. Indicator displacement assays (IDAs): The past, present and future. Chem. Soc. Rev. 2021, 50, 9–38. [Google Scholar] [CrossRef]
- You, L.; Zha, D.; Anslyn, E.V. Recent Advances in Supramolecular Analytical Chemistry Using Optical Sensing. Chem. Rev. 2015, 115, 7840–7892. [Google Scholar] [CrossRef]
- Han, J.; Cheng, H.; Wang, B.; Braun, M.S.; Fan, X.; Bender, M.; Huang, W.; Domhan, C.; Mier, W.; Lindner, T.; et al. A Polymer/Peptide Complex-Based Sensor Array That Discriminates Bacteria in Urine. Angew. Chem. Int. Ed. 2017, 56, 15246–15251. [Google Scholar] [CrossRef]
- Fan, X.; Xu, W.; Han, J.; Jiang, X.; Wink, M.; Wu, G. Antimicrobial peptide hybrid fluorescent protein based sensor array discriminate ten most frequent clinic isolates. Biochim. Biophys. Acta Gen. Sub. 2019, 1863, 1158–1166. [Google Scholar] [CrossRef]
- Zheng, L.; Qi, P.; Zhang, D. Identification of bacteria by a fluorescence sensor array based on three kinds of receptors functionalized carbon dots. Sens. Actuators B Chem. 2019, 286, 206–213. [Google Scholar] [CrossRef]
- Rochat, S.; Gao, J.; Qian, X.; Zaubitzer, F.; Severin, K. Cross-reactive sensor arrays for the detection of peptides in aqueous solution by fluorescence spectroscopy. Chemistry 2010, 16, 104–113. [Google Scholar] [CrossRef] [PubMed] [Green Version]
- Ghasemi, F.; Hormozi-Nezhad, M.R.; Mahmoudi, M. Label-free detection of beta-amyloid peptides (Abeta40 and Abeta42): A colorimetric sensor array for plasma monitoring of Alzheimer’s disease. Nanoscale 2018, 10, 6361–6368. [Google Scholar] [CrossRef] [PubMed]
- Xu, S.; Wu, Y.; Sun, X.; Wang, Z.; Luo, X. A multicoloured Au NCs based cross-reactive sensor array for discrimination of multiple proteins. J. Mater. Chem. B 2017, 5, 4207–4213. [Google Scholar] [CrossRef] [PubMed]
- Rasouli, Z.; Ghavami, R. A 3 × 3 visible-light cross-reactive sensor array based on the nanoaggregation of curcumin in different pH and buffers for the multivariate identification and quantification of metal ions. Talanta 2021, 226, 122131. [Google Scholar] [CrossRef]
- Mohan, B.; Xing, T.; Kumar, S.; Kumar, S.; Ma, S.; Sun, F.; Xing, D.; Ren, P. A chemosensing approach for the colorimetric and spectroscopic detection of Cr3+, Cu2+, Fe3+, and Gd3+ metal ions. Sci. Total Environ. 2022, 845, 157242. [Google Scholar] [CrossRef]
- Chen, L.; Li, L.; Wu, D.; Tian, X.; Xia, D.; Lu, L.; Yang, C.; Nie, Y. Construction of multi-channel fluorescence sensor array and its application for accurate identification and sensitive quantification of multiple metal ions. Sens. Actuators B Chem. 2020, 303, 127277. [Google Scholar] [CrossRef]
- Wang, H.; Chen, M.; Sun, Y.; Xu, L.; Li, F.; Han, J. Machine Learning-Assisted Pattern Recognition of Amyloid Beta Aggregates with Fluorescent Conjugated Polymers and Graphite Oxide Electrostatic Complexes. Anal. Chem. 2022, 94, 2757–2763. [Google Scholar] [CrossRef]
- Harrison, E.E.; Waters, M.L. Application of an Imprint-and-Report Sensor Array for Detection of the Dietary Metabolite Trimethylamine N-Oxide and Its Precursors in Complex Mixtures. Angew. Chem. Int. Ed. 2022, 61, e202205193. [Google Scholar] [CrossRef]
- Wang, H.; Zhou, L.; Qin, J.; Chen, J.; Stewart, C.; Sun, Y.; Huang, H.; Xu, L.; Li, L.; Han, J.; et al. One-Component Multichannel Sensor Array for Rapid Identification of Bacteria. Anal. Chem. 2022, 94, 10291–10298. [Google Scholar] [CrossRef]
- Sulatskaya, A.I.; Maskevich, A.A.; Kuznetsova, I.M.; Uversky, V.N.; Turoverov, K.K. Fluorescence quantum yield of thioflavin T in rigid isotropic solution and incorporated into the amyloid fibrils. PLoS ONE 2010, 5, e15385. [Google Scholar] [CrossRef] [PubMed] [Green Version]
- Younan, N.D.; Viles, J.H. A Comparison of Three Fluorophores for the Detection of Amyloid Fibers and Prefibrillar Oligomeric Assemblies. ThT (Thioflavin T); ANS (1-Anilinonaphthalene-8-sulfonic Acid); and bisANS (4,4′-Dianilino-1,1′-binaphthyl-5,5′-disulfonic Acid). Biochemistry 2015, 54, 4297–4306. [Google Scholar] [CrossRef] [PubMed]
- Lindberg, D.J.; Wranne, M.S.; Gilbert Gatty, M.; Westerlund, F.; Esbjorner, E.K. Steady-state and time-resolved Thioflavin-T fluorescence can report on morphological differences in amyloid fibrils formed by Abeta(1-40) and Abeta(1-42). Biochem. Biophys. Res. Commun. 2015, 458, 418–423. [Google Scholar] [CrossRef] [PubMed] [Green Version]
- Mishra, R.; Sjolander, D.; Hammarstrom, P. Spectroscopic characterization of diverse amyloid fibrils in vitro by the fluorescent dye Nile red. Mol. Biosyst. 2011, 7, 1232–1240. [Google Scholar] [CrossRef] [PubMed]
- Bongiovanni, M.N.; Godet, J.; Horrocks, M.H.; Tosatto, L.; Carr, A.R.; Wirthensohn, D.C.; Ranasinghe, R.T.; Lee, J.E.; Ponjavic, A.; Fritz, J.V.; et al. Multi-dimensional super-resolution imaging enables surface hydrophobicity mapping. Nat. Commun. 2016, 7, 13544. [Google Scholar] [CrossRef] [Green Version]
- Nie, J.; Tian, P.; Chen, Z. Victoria Blue B acts as a protein isomerization targeting probe for monitoring lysozyme fibrillation. Sens. Actuators B Chem. 2019, 293, 45–52. [Google Scholar] [CrossRef]
- Nie, J.; Chen, Z. Protein-Based Nano-Vessels Facilitates the Victoria Blue B Mediated Inhibition of Amyloid Fibrillation. Macromol. Rapid Commun. 2020, 41, e2000368. [Google Scholar] [CrossRef]
- Udeh-Momoh, C.; Zheng, B.; Sandebring-Matton, A.; Novak, G.; Kivipelto, M.; Jonsson, L.; Middleton, L. Blood Derived Amyloid Biomarkers for Alzheimer’s Disease Prevention. J. Prev. Alzheimer’s Dis. 2022, 9, 12–21. [Google Scholar] [CrossRef]
- West, T.; Kirmess, K.M.; Meyer, M.R.; Holubasch, M.S.; Knapik, S.S.; Hu, Y.; Contois, J.H.; Jackson, E.N.; Harpstrite, S.E.; Bateman, R.J.; et al. A blood-based diagnostic test incorporating plasma Abeta42/40 ratio, ApoE proteotype, and age accurately identifies brain amyloid status: Findings from a multi cohort validity analysis. Mol. Neurodegener. 2021, 16, 30. [Google Scholar] [CrossRef]
- Li, Y.; Schindler, S.E.; Bollinger, J.G.; Ovod, V.; Mawuenyega, K.G.; Weiner, M.W.; Shaw, L.M.; Masters, C.L.; Fowler, C.J.; Trojanowski, J.Q.; et al. Validation of Plasma Amyloid-beta 42/40 for Detecting Alzheimer Disease Amyloid Plaques. Neurology 2022, 98, e688–e699. [Google Scholar] [CrossRef]
- Schindler, S.E.; Bollinger, J.G.; Ovod, V.; Mawuenyega, K.G.; Li, Y.; Gordon, B.A.; Holtzman, D.M.; Morris, J.C.; Benzinger, T.L.S.; Xiong, C.; et al. High-precision plasma beta-amyloid 42/40 predicts current and future brain amyloidosis. Neurology 2019, 93, e1647–e1659. [Google Scholar] [CrossRef] [PubMed]
- Wang, B.; Han, J.; Zhang, H.; Bender, M.; Biella, A.; Seehafer, K.; Bunz, U.H.F. Detecting Counterfeit Brandies. Chemistry 2018, 24, 17361–17366. [Google Scholar] [CrossRef] [PubMed]
- Hatai, J.; Motiei, L.; Margulies, D. Analyzing Amyloid Beta Aggregates with a Combinatorial Fluorescent Molecular Sensor. J. Am. Chem. Soc. 2017, 139, 2136–2139. [Google Scholar] [CrossRef] [PubMed]


Publisher’s Note: MDPI stays neutral with regard to jurisdictional claims in published maps and institutional affiliations. |
© 2022 by the authors. Licensee MDPI, Basel, Switzerland. This article is an open access article distributed under the terms and conditions of the Creative Commons Attribution (CC BY) license (https://creativecommons.org/licenses/by/4.0/).
Share and Cite
Li, F.; Zhou, L.; Gao, X.; Ni, W.; Hu, J.; Wu, M.; Chen, S.; Han, J.; Wu, J. A Multichannel Fluorescent Tongue for Amyloid-β Aggregates Detection. Int. J. Mol. Sci. 2022, 23, 14562. https://doi.org/10.3390/ijms232314562
Li F, Zhou L, Gao X, Ni W, Hu J, Wu M, Chen S, Han J, Wu J. A Multichannel Fluorescent Tongue for Amyloid-β Aggregates Detection. International Journal of Molecular Sciences. 2022; 23(23):14562. https://doi.org/10.3390/ijms232314562
Chicago/Turabian StyleLi, Fei, Lingjia Zhou, Xu Gao, Weiwei Ni, Jiabao Hu, Meicen Wu, Shouwang Chen, Jinsong Han, and Jin Wu. 2022. "A Multichannel Fluorescent Tongue for Amyloid-β Aggregates Detection" International Journal of Molecular Sciences 23, no. 23: 14562. https://doi.org/10.3390/ijms232314562