2.1. Volumetric Properties
The apparent molar volume of the glymes (
) values in the DMF + W mixture were calculated using the experimental values of the solution density via Equation (1).
where
M2 is the molecular mass of glyme;
are the densities of solution and mixed solvent, respectively; and
m is the concentration of glyme in moles of solute per kg of the mixed solvent.
Equation (2) (proposed by Redlich and Mayer) was used [
23] to the analyze the function
.
where
is the limiting partial molar volume of the solute (glyme),
bV is the coefficient that provides information on the interaction between the solute (glyme) molecules, and
m is the concentration of solution in moles of the solute (glyme) per kg of mixed solvent.
The limiting apparent molar volume (
) for investigating the glymes in the mixed solvent was calculated using Equation (3) and is presented in
Table 1 and
Table 2.
where
is the limiting partial molar volume of glymes.
As seen in
Table 1 and
Table 2, the limiting partial molar volume of the glymes increased with the temperature increased. However, this increase was slight. It is known that an increase in temperature favors the weakening of the interactions between the molecules present in the solution, which causes an increase in the limiting partial molar volume of glymes in a mixture at a given composition.
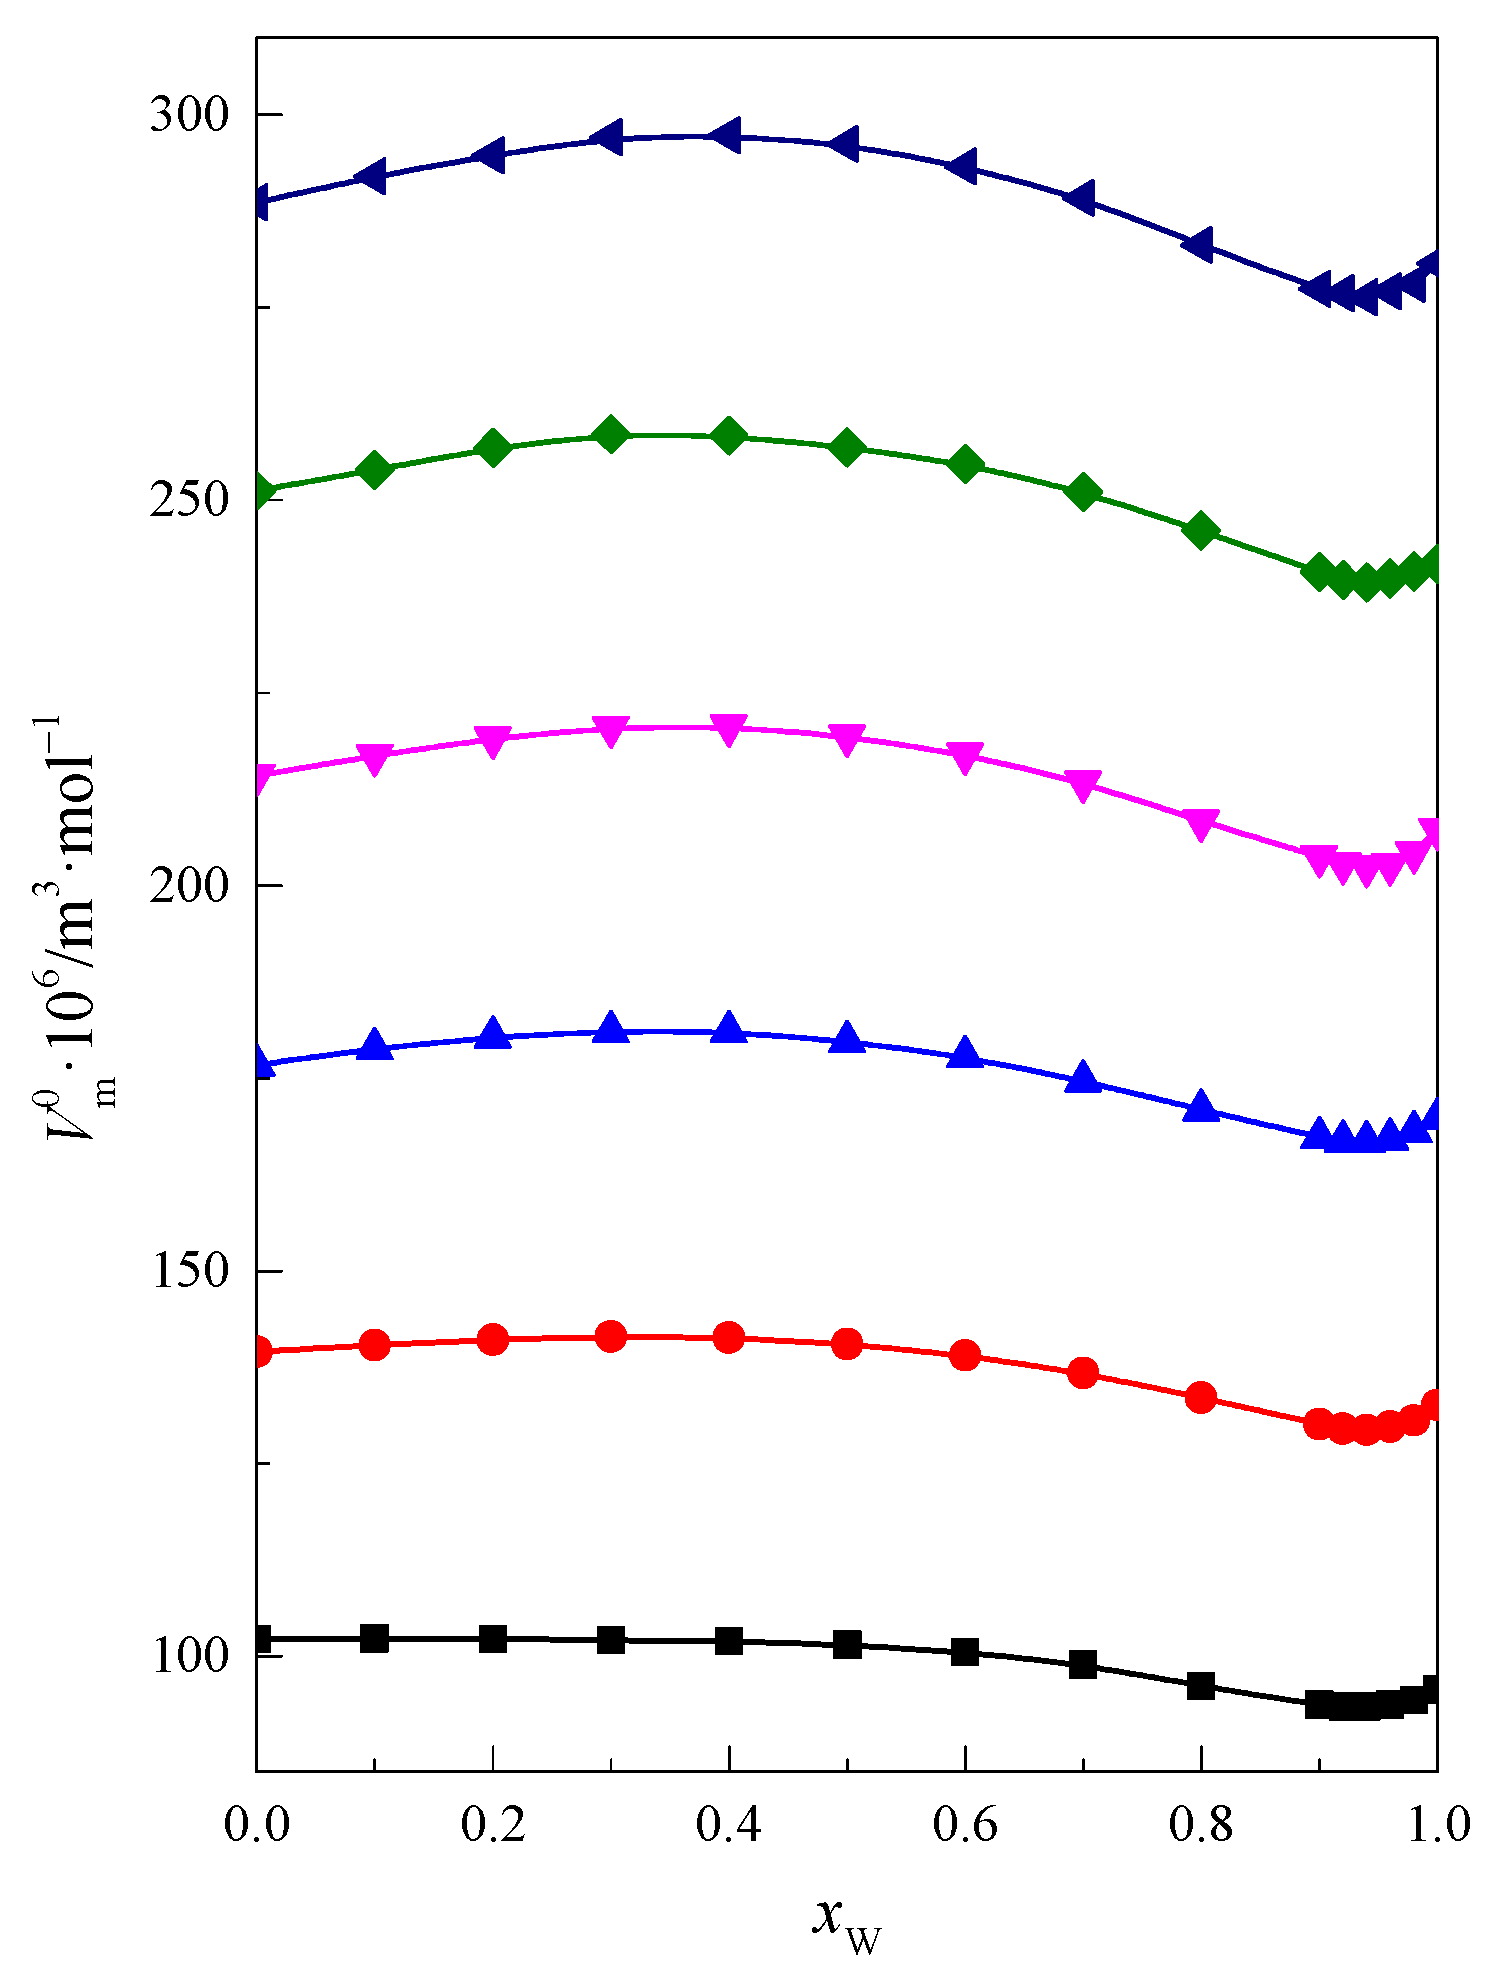
Using the values of the limiting partial molar volume of glymes with shorter chains [
21] in
Figure 1, the function
for glymes with 2 ≤
m–O– ≤ 7 (
m–O– is the number of oxygen atoms in the glyme molecule) is presented.
As is seen in
Figure 1, the curves are similar to each other for all the investigated glymes. They are typical for aqueous–organic systems and moreover illustrate the hydrophobic properties of the solute [
21,
24,
25]. The limiting partial molar volume
of the glymes increases with the increase in the number of oxyethylene groups in the glyme molecule (
Figure 1). Additionally, with the increase in the number of oxyethylene groups in glyme molecules, their hydrophobic character increases. Thus, this arrangement of the curves on the graph is closely related to the information above.
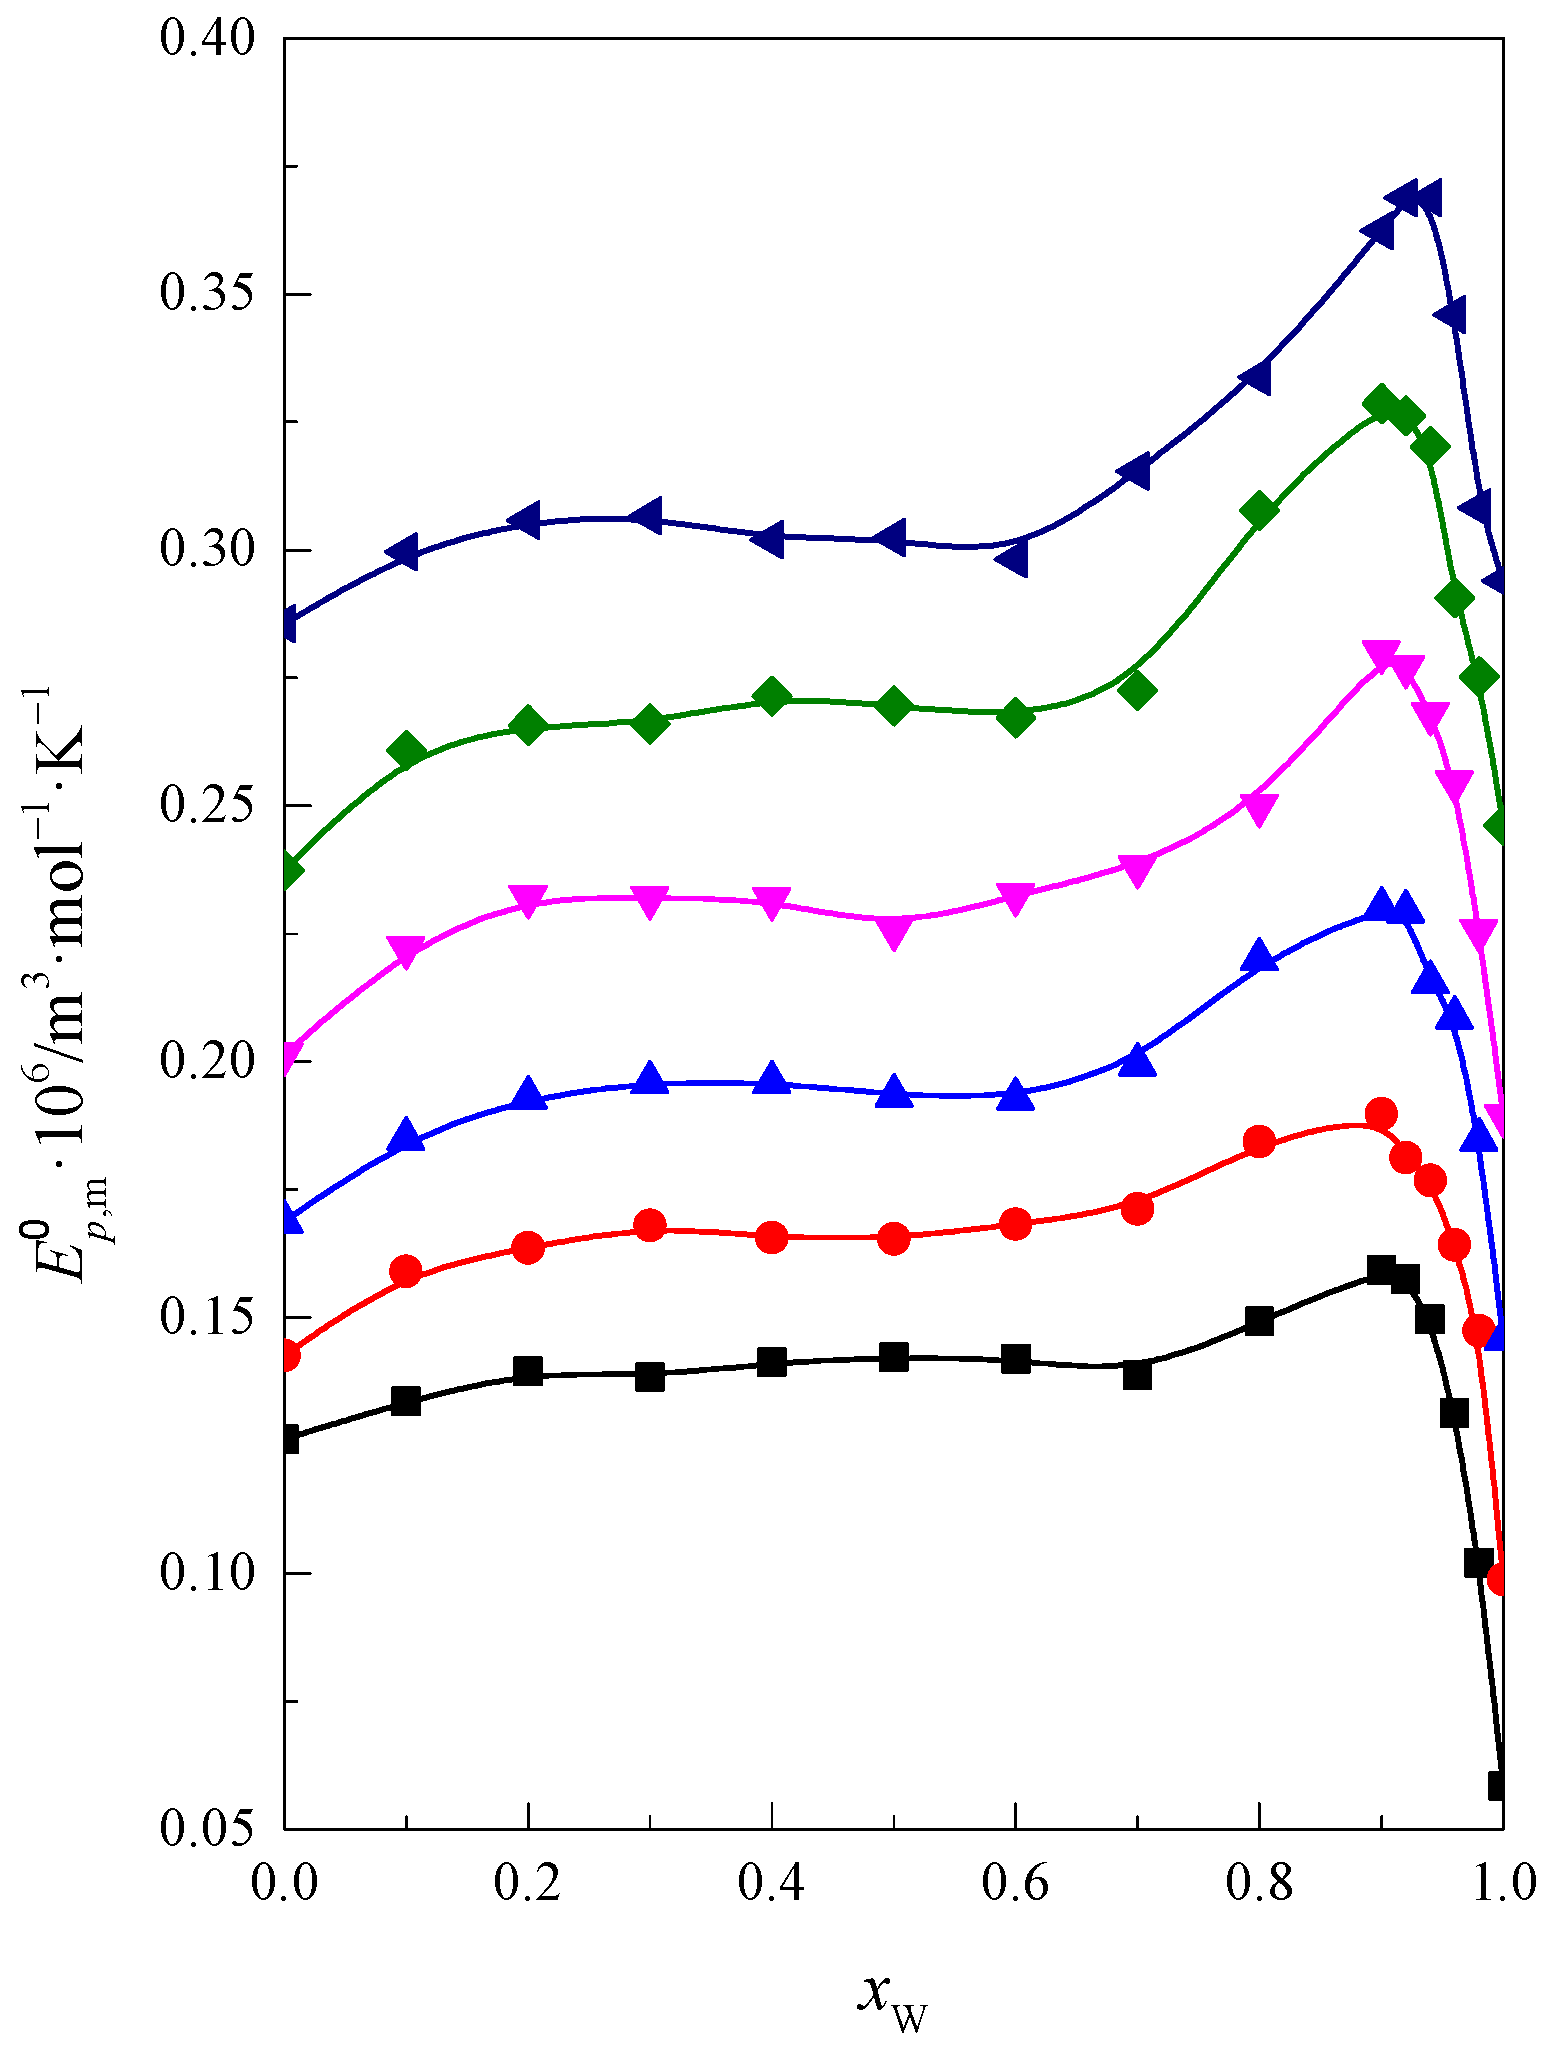
Using the values of the limiting partial molar volume of the glymes
at four temperatures (
T) and Equation (4), the isobaric molar thermal expansion of the glymes,
, in the DMF + W mixture was calculated, and the results are presented in
Table 3 and in
Figure 2 (together with analogous data for monoglyme, diglyme, triglyme, and tetraglyme [
21]) as a function of
xW in the DMF + W mixed solvent.
As you can see in
Figure 2, the shapes of all the presented curves are similar to each other. The course of the curve up to range
xW < 0.6 is gentle and then goes through a maximum at
xW ≈ 0.92. The intensity of the maximum increases with increasing hydrophobicity of the examined glymes. After passing through the maximum, there is a decrease in the value of limiting partial molar expansion
of the glymes. This is related to the stiffening of the solvent structure caused by the hydrophobic hydration of the glymes. Within this range of mixed solvent composition, water is dominant in the mixture. The resulting phenomena are less susceptible to temperature changes. This effect increases with the increase in the hydrophobic nature of the glymes.
2.2. Acoustic Properties
The isentropic compressibility (
κS) values were calculated using Equation (5), and the obtained data are presented in
Tables S7 and S8 (see
Supplementary Materials).
where
u and
ρ are the speed of sound and density of the glyme + DMF + W system, respectively.
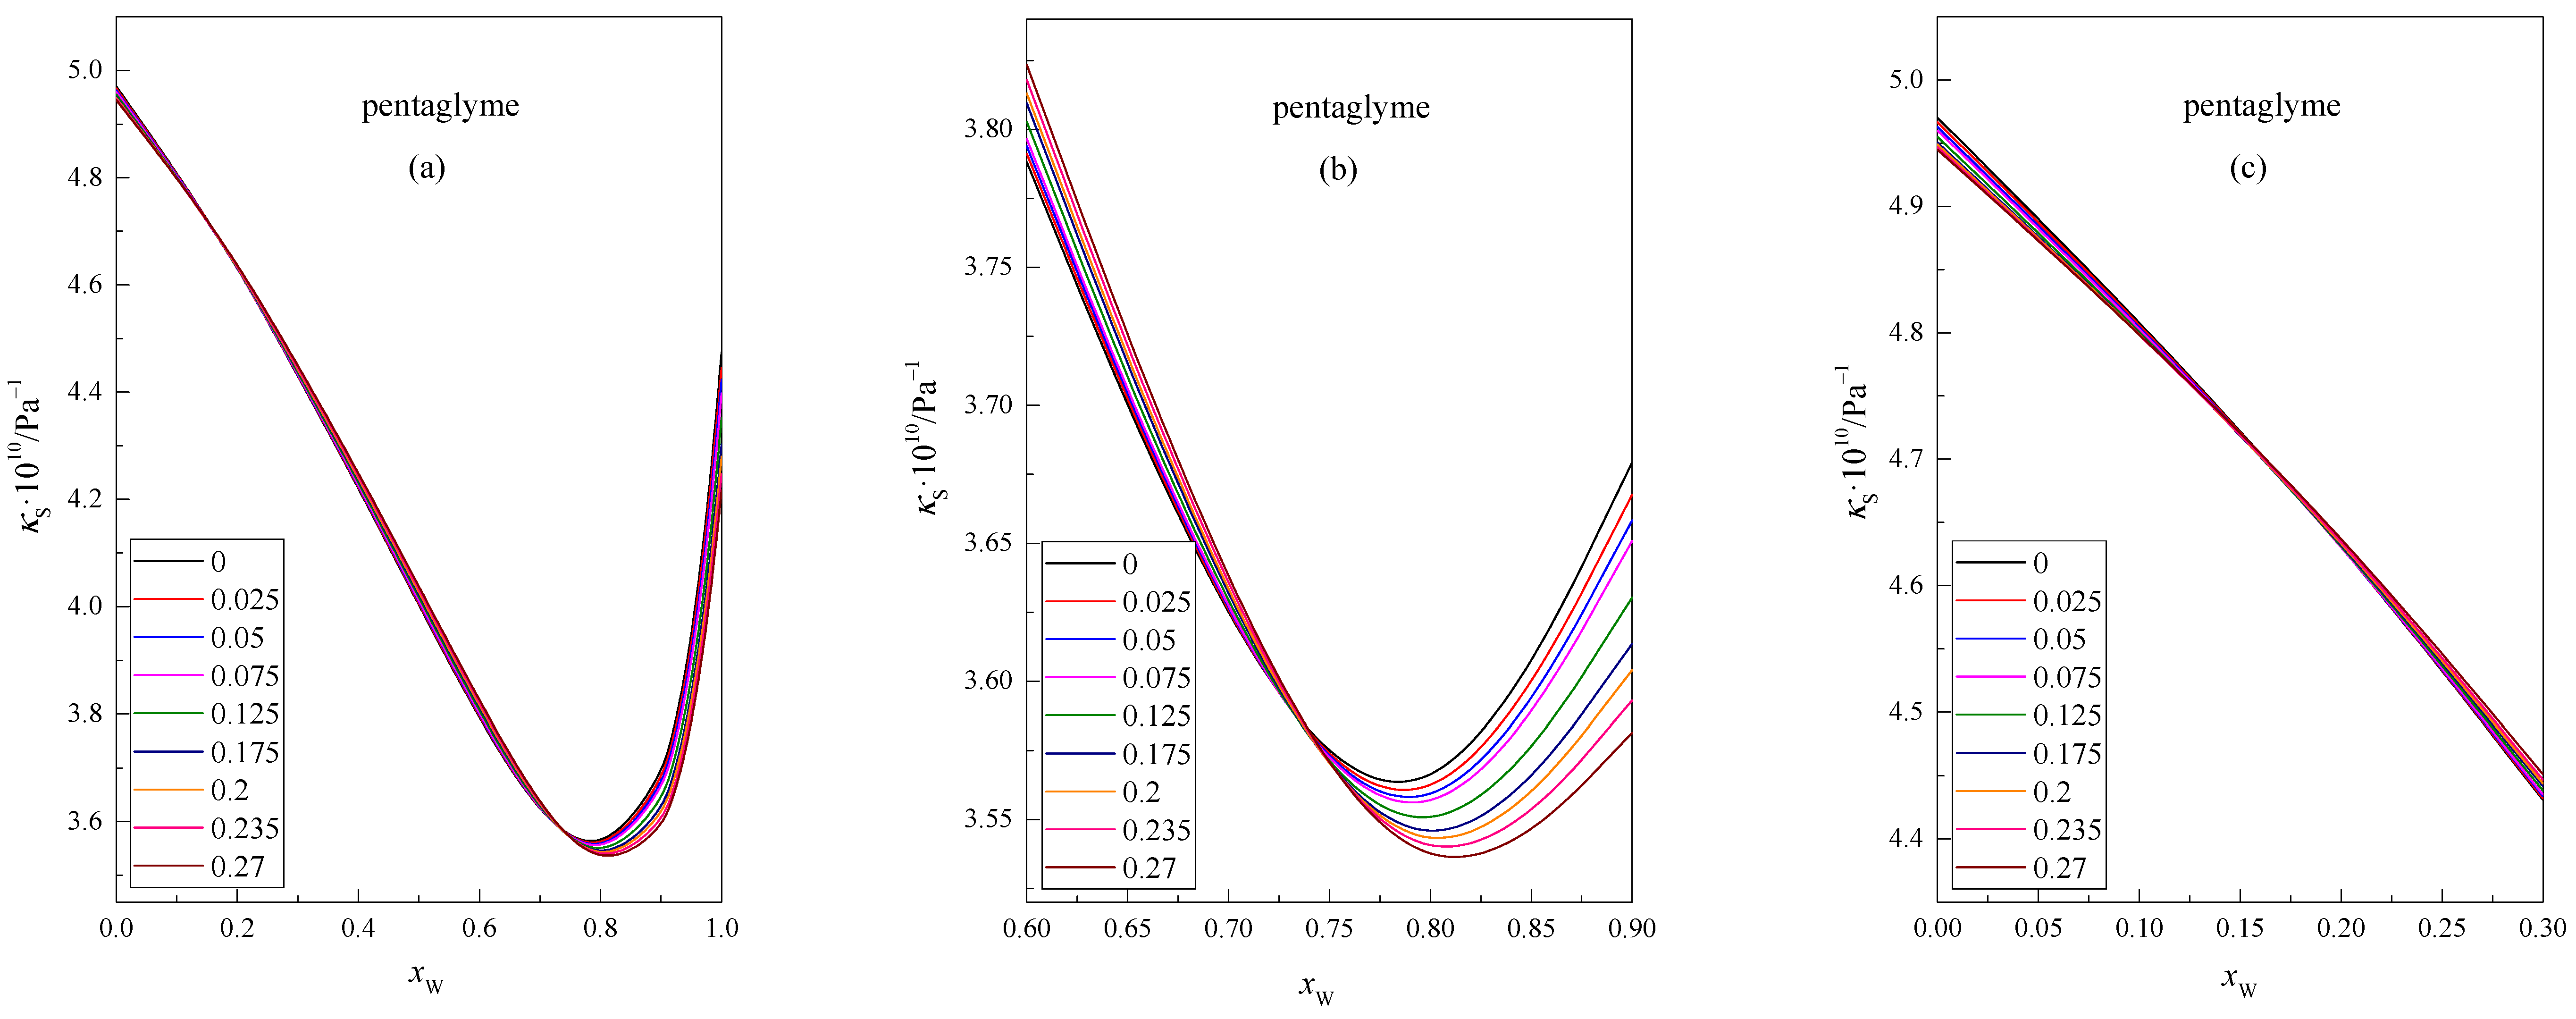
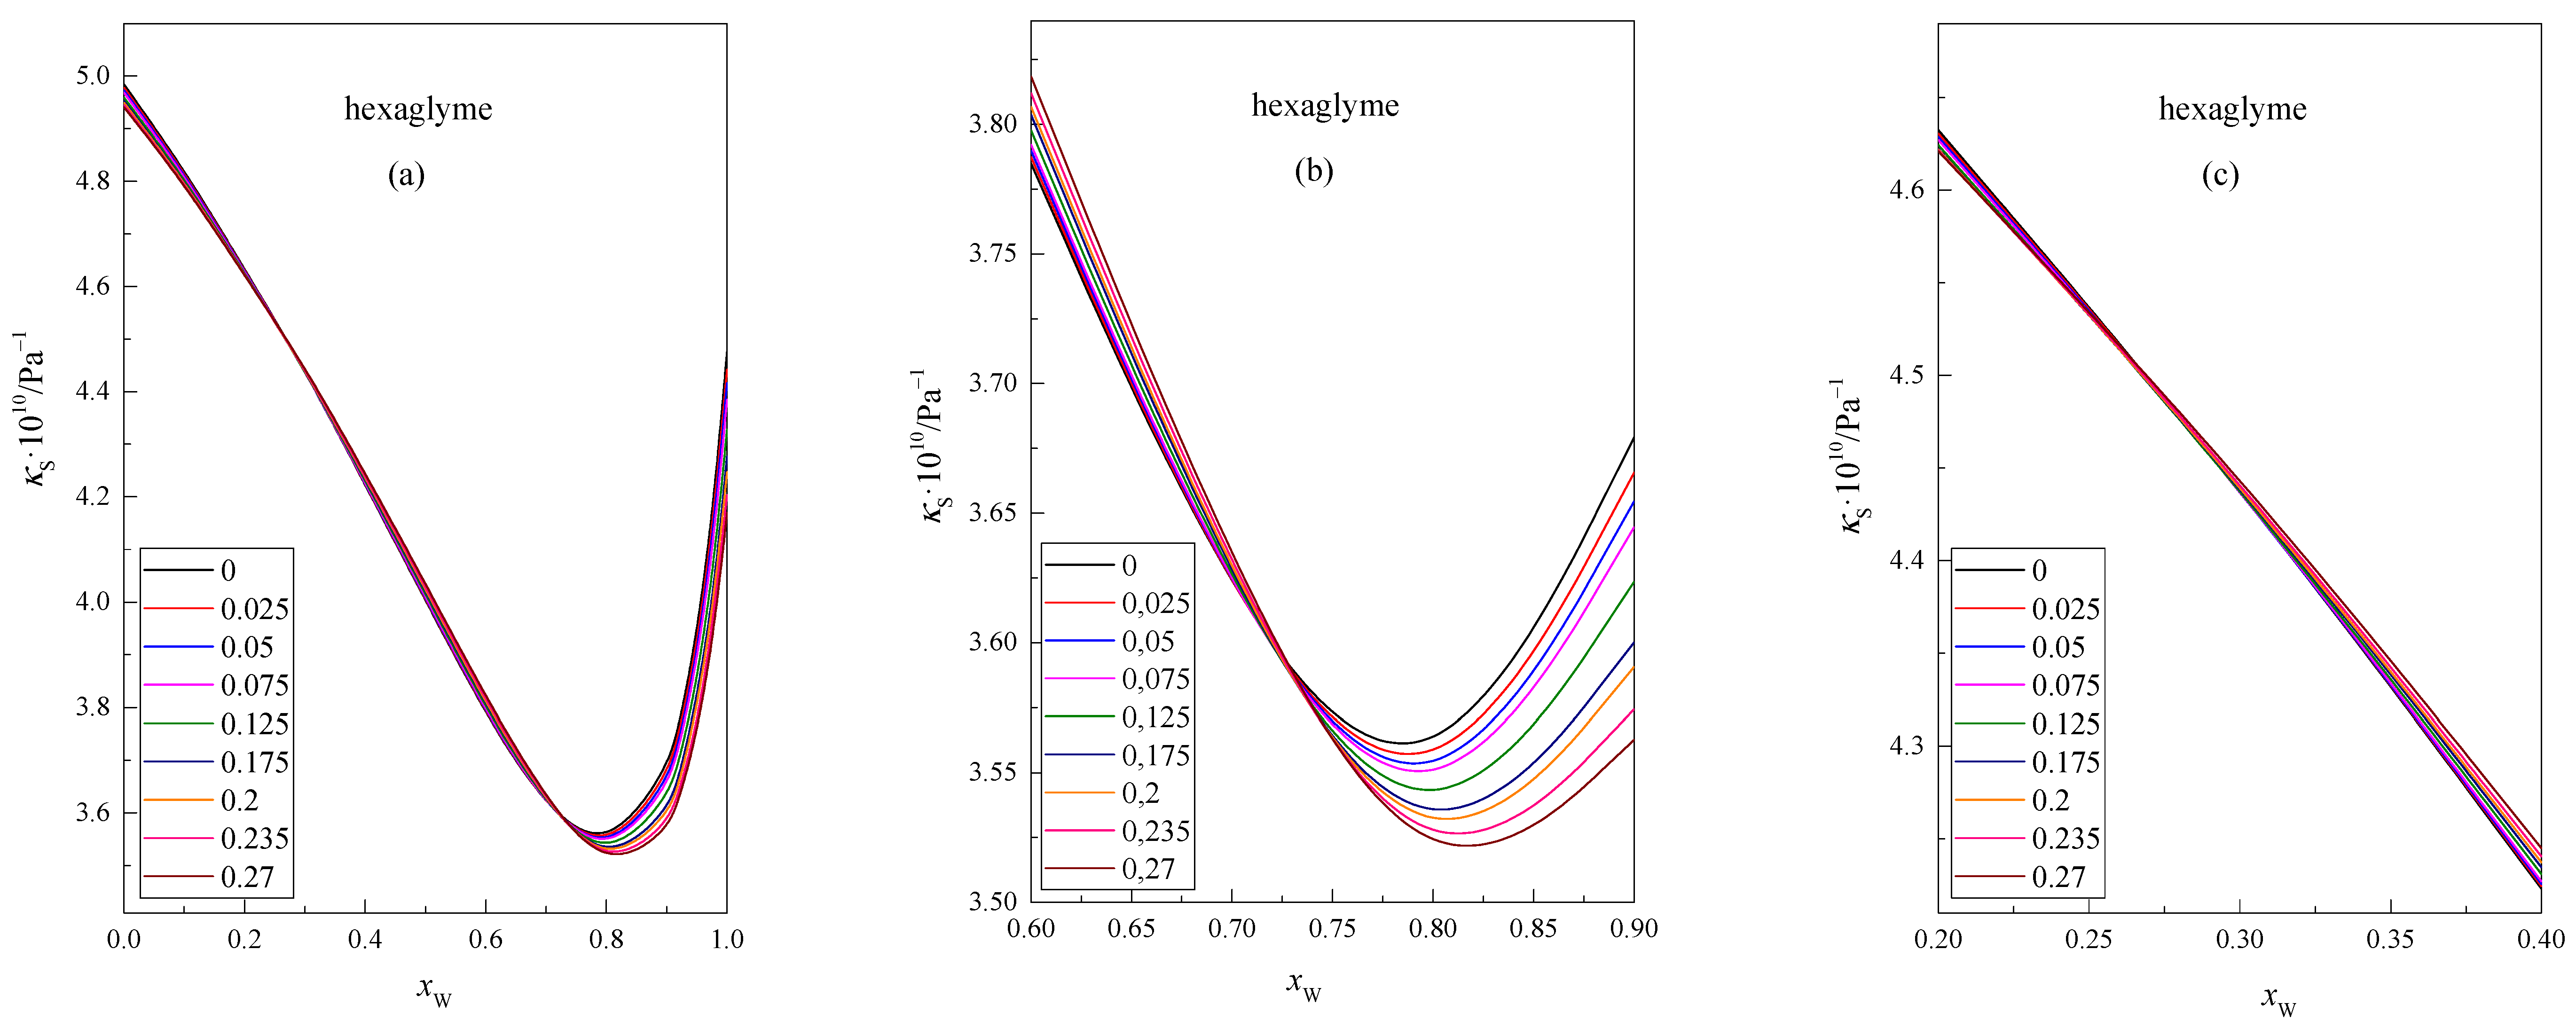
The values of the isentropic compressibility
of the isomolal glyme solution in the DMF + W mixed solvent, as a function of the mole fraction of water
xW in this mixture at 298.15 K, are presented in
Figure 3 and
Figure 4. Each of the lines represents the function
at a given concentration of glyme, i.e., 0, 0.025, 0.05, 0.075, 0.125, 0.175, 0.2, 0.235, and 0.27. To make the intersection points of the curves more visible, the points that correspond to the values of the function have been omitted.
In
Figure 3 and
Figure 4, it can be seen that the
values reach a minimum at
xW ≈ 0.8 for all concentrations of the glyme in the DMF + W solvent. This decrease in the compressibility value is related to the incorporation of glyme molecules into the structure of the mixed solvent DMF + W. With a higher water content in the mixture
xW > 0.8, the isentropic compressibility values of the mixtures increase with increasing water content. This is probably related to the characteristic structure of the DMF + W mixture in this range of mixture composition. A similar situation was observed for the DMF + W systems containing shorter glyme chains [
22].
Among others, de Visser et al. [
26] believe that hydrogen bonds formed between water molecules and the carbonyl group of DMF molecules are stronger than hydrogen bonds formed between molecules in pure water. In addition, complexes may form in the DMF + W system when
xW < 0.8, which most likely causes a decrease in the compressibility coefficient of glyme solutions. In this region (
xW < 0.8), the glyme molecules are probably mainly solvated by DMF molecules. With the increase in water content, the DMF molecules present in the solvation shell of the glymes are exchanged for water molecules. Due to their properties, both glymes and DMF tend to stabilize the water structure. The presence of glyme molecules solvated by DMF and water molecules and the ordered structure of the mixed solvent most likely cause a decrease in the
κS value in this composition range (
xW < 0.8).
The analysis of
Figure 3 and
Figure 4 shows the area where the isotherms of the isentropic compressibility versus the mole fraction of water show the intersection point before the function reaches the minimum value. Similar points are observed in the range of lower water content, i.e.,
xW ≈ 0.15 and
xW ≈ 0.25, for pentaglyme and hexaglyme, respectively. The location of the intersection points is different for each glyme. According to Endo [
27,
28], in the compositions corresponding to the intersection points, clathrate structures may be formed in the range of rich water content in the mixture. In the resulting associations, the ratio of the number of solvent molecules to the number of solute molecules varies depending on the composition of the mixture. However, this interpretation is somewhat controversial and is discussed in the literature. It is probable that the dipole–dipole interactions of glyme molecules with DMF molecules (instead of interactions between glyme molecules and water molecules) cause the existence of second intersection points in the range of low water content in the mixture.
The location (
xW) of the intersection points of isomolal functions
for the investigated glymes, together with the literature values for glymes with shorter chains, is presented in
Table 4.
As presented in
Table 4, when the number of oxygen atoms in the glyme molecule increases, the water content in the mixture decreases for the first intersection point. For the second intersection points, the dependence is opposite.
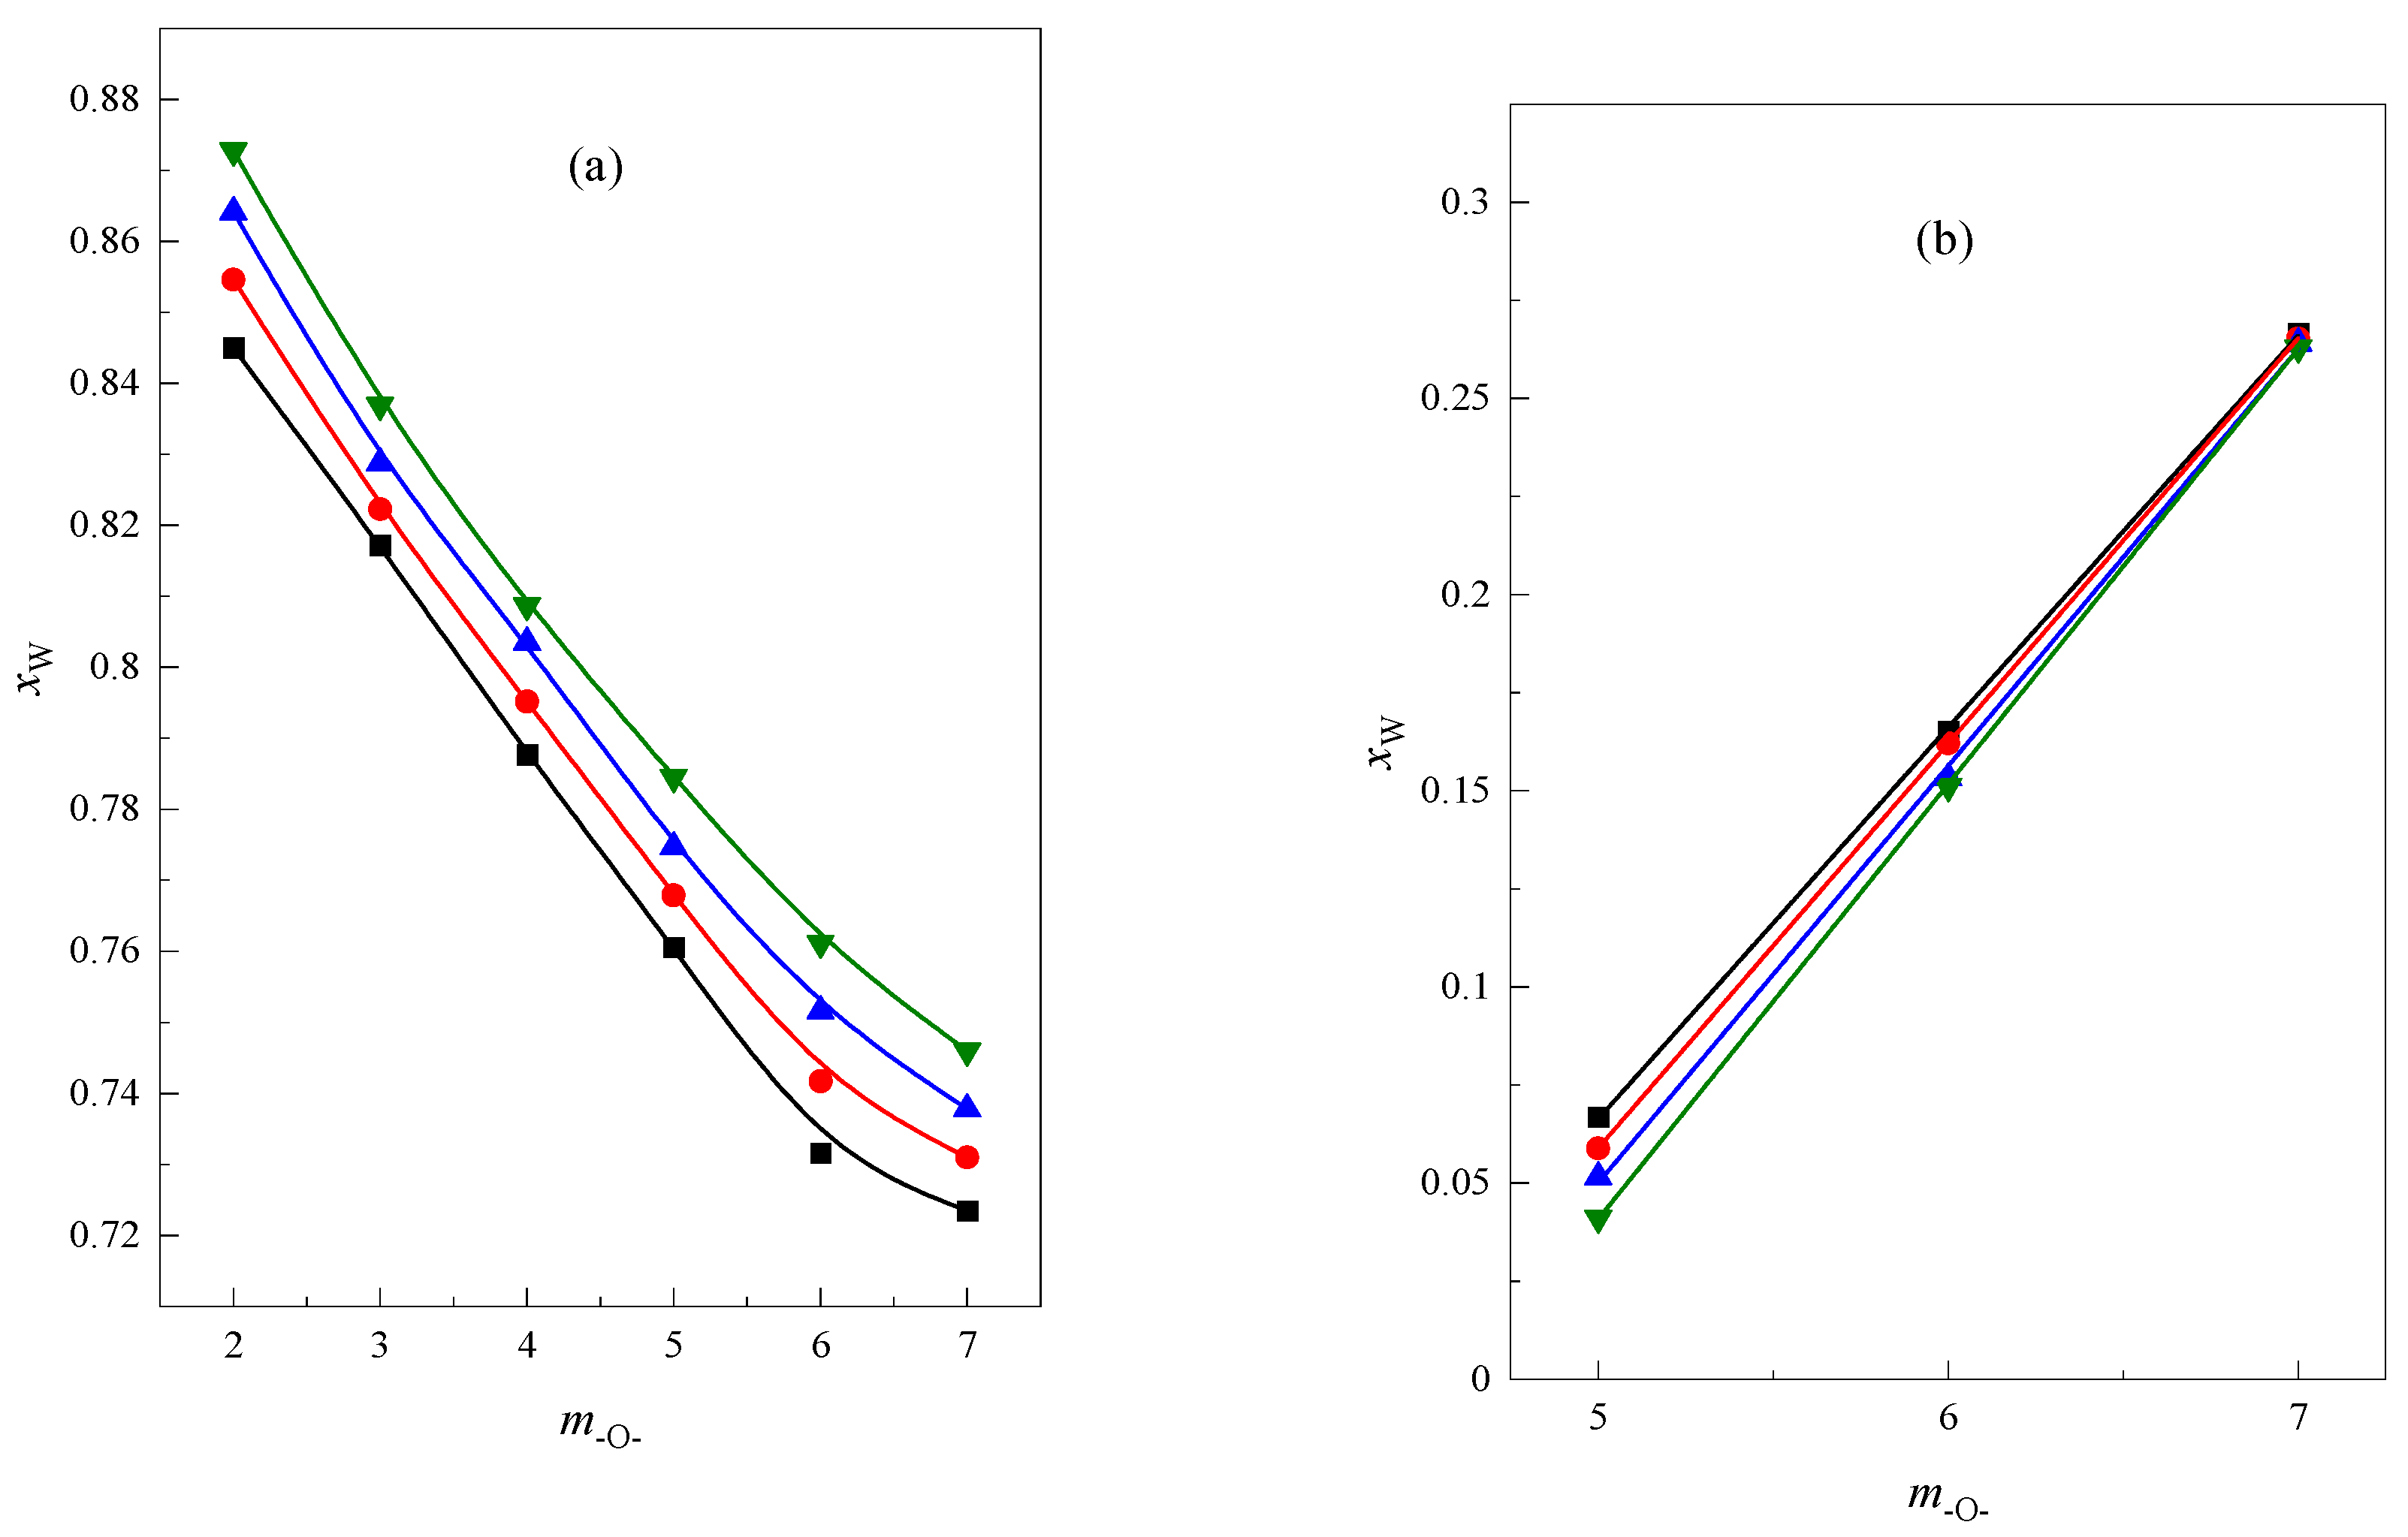
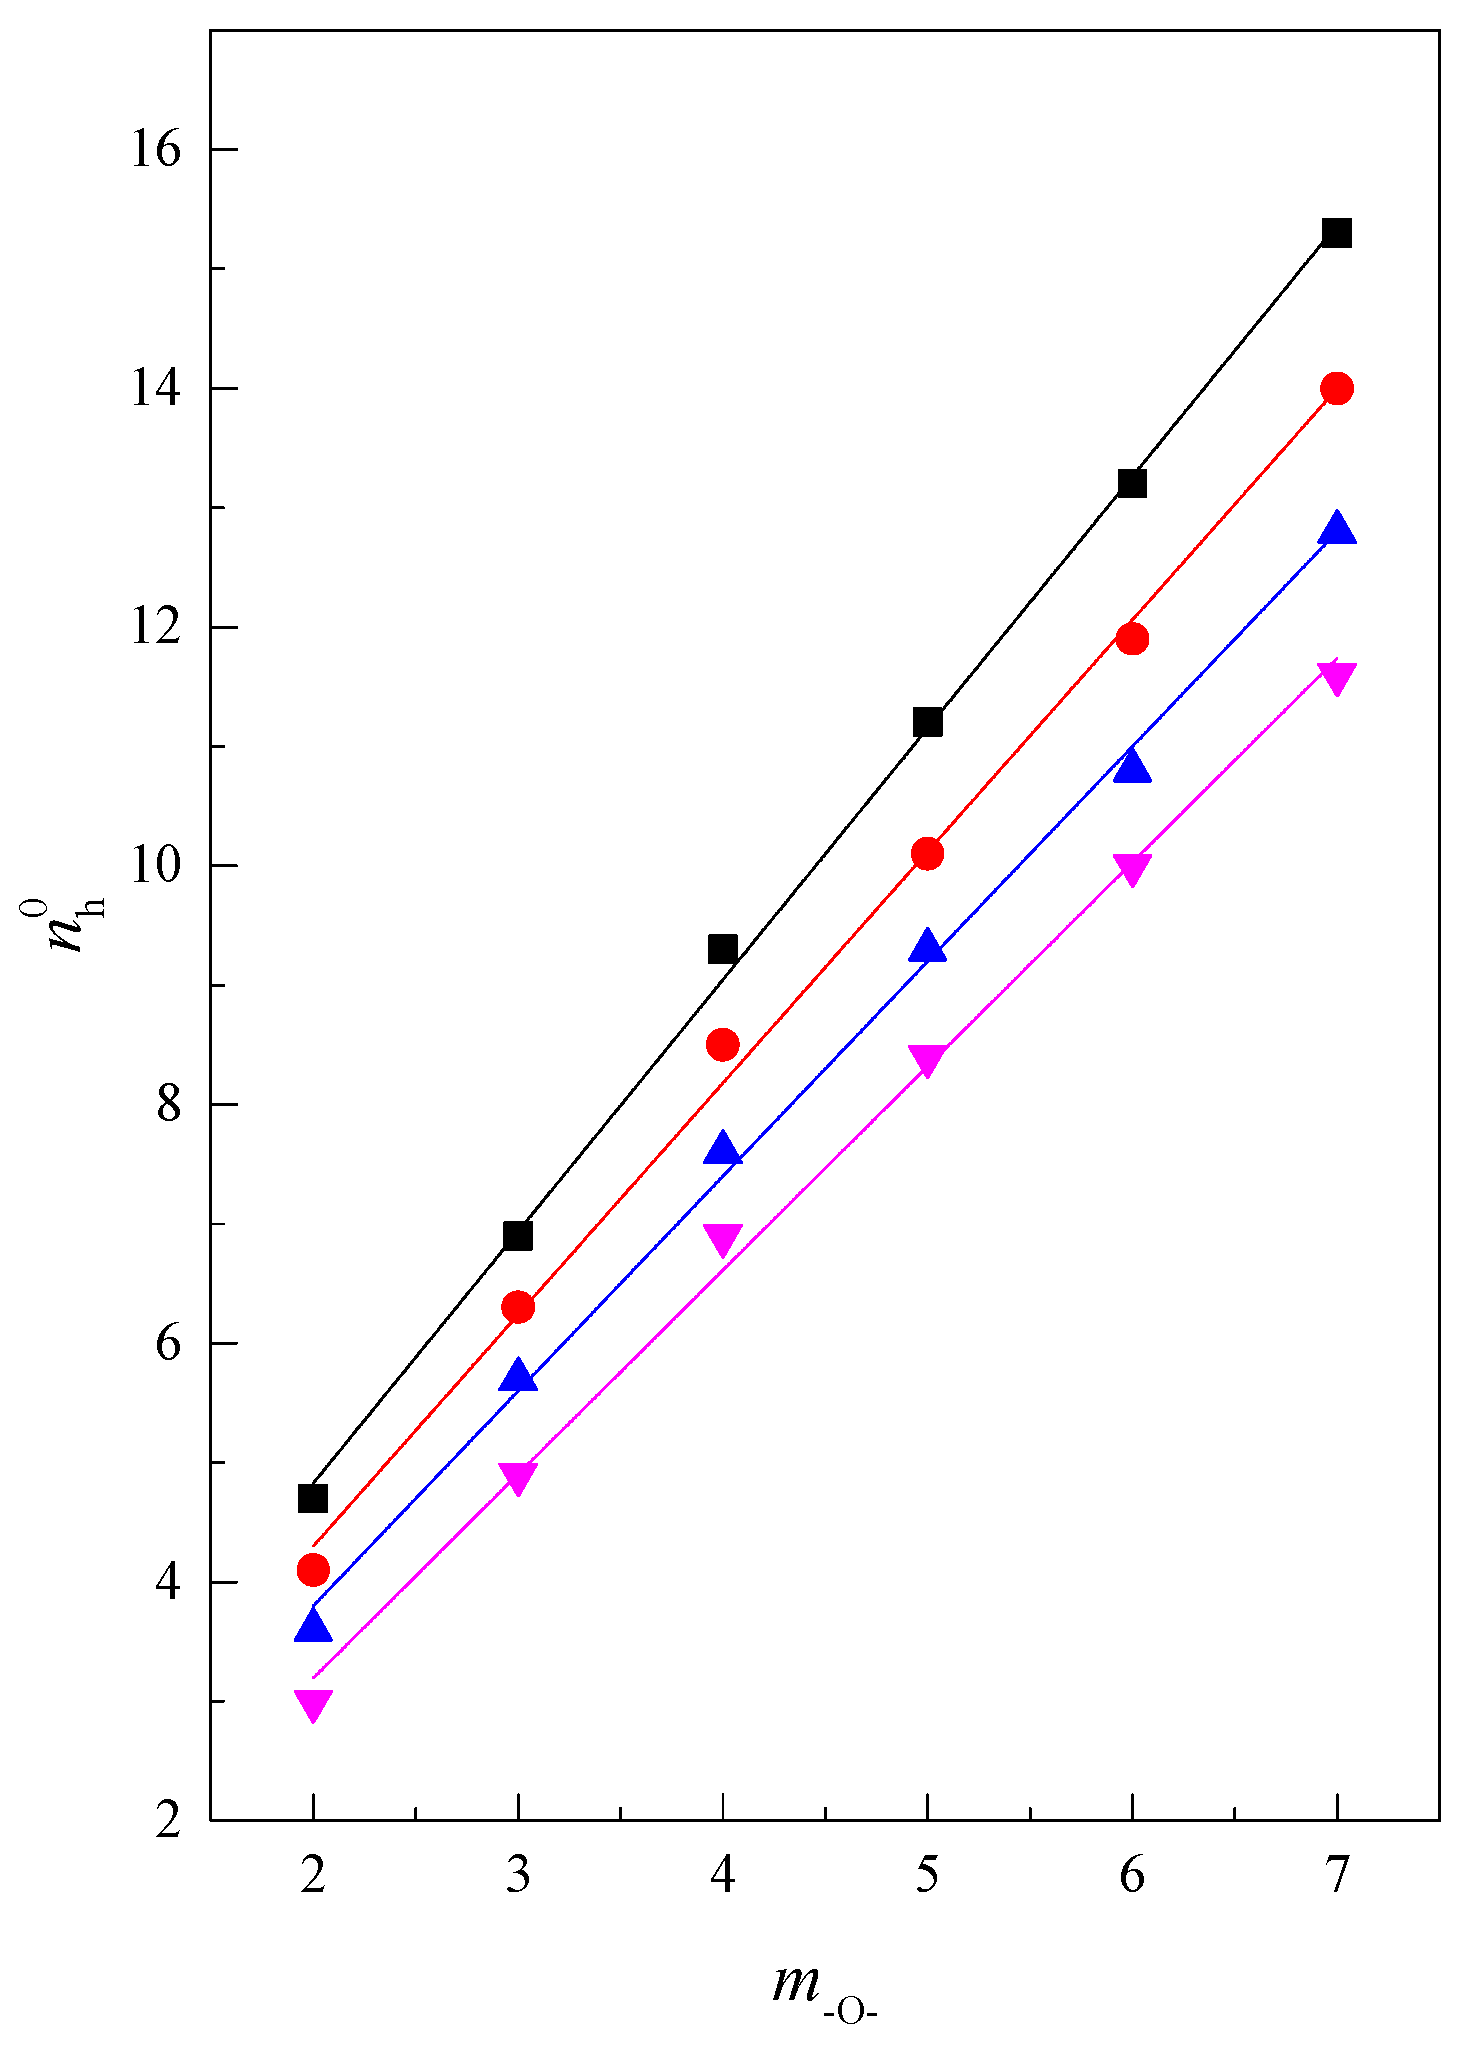
In
Figure 5 the dependence of the location (
xW) of the first and second intersection points of the isomolal functions
derived for glymes solutions in the mixture DMF + W as a function of the number of oxygen atoms in the glyme molecules (
m–O–) is presented at different temperatures. In
Figure 5a, the presented dependence is almost linear, but the function presented in
Figure 5b is linear. The placement of the straight lines in
Figure 5a is almost parallel, showing that the influence of the temperature on the first intersection point is similar for all glymes. In
Figure 5b in the low water content of the mixture, the influence of diversified temperature is seen for long-chain glymes. One can notice that for hexaglyme, the position of the intersection point is almost not dependent on the temperature. Furthermore, according to
Figure 5b, the less intensive temperature dependence for the second location (
xW) of the intersection point is observed, i.e., the longer chain of the glyme. The mentioned influence of temperature is more visible in
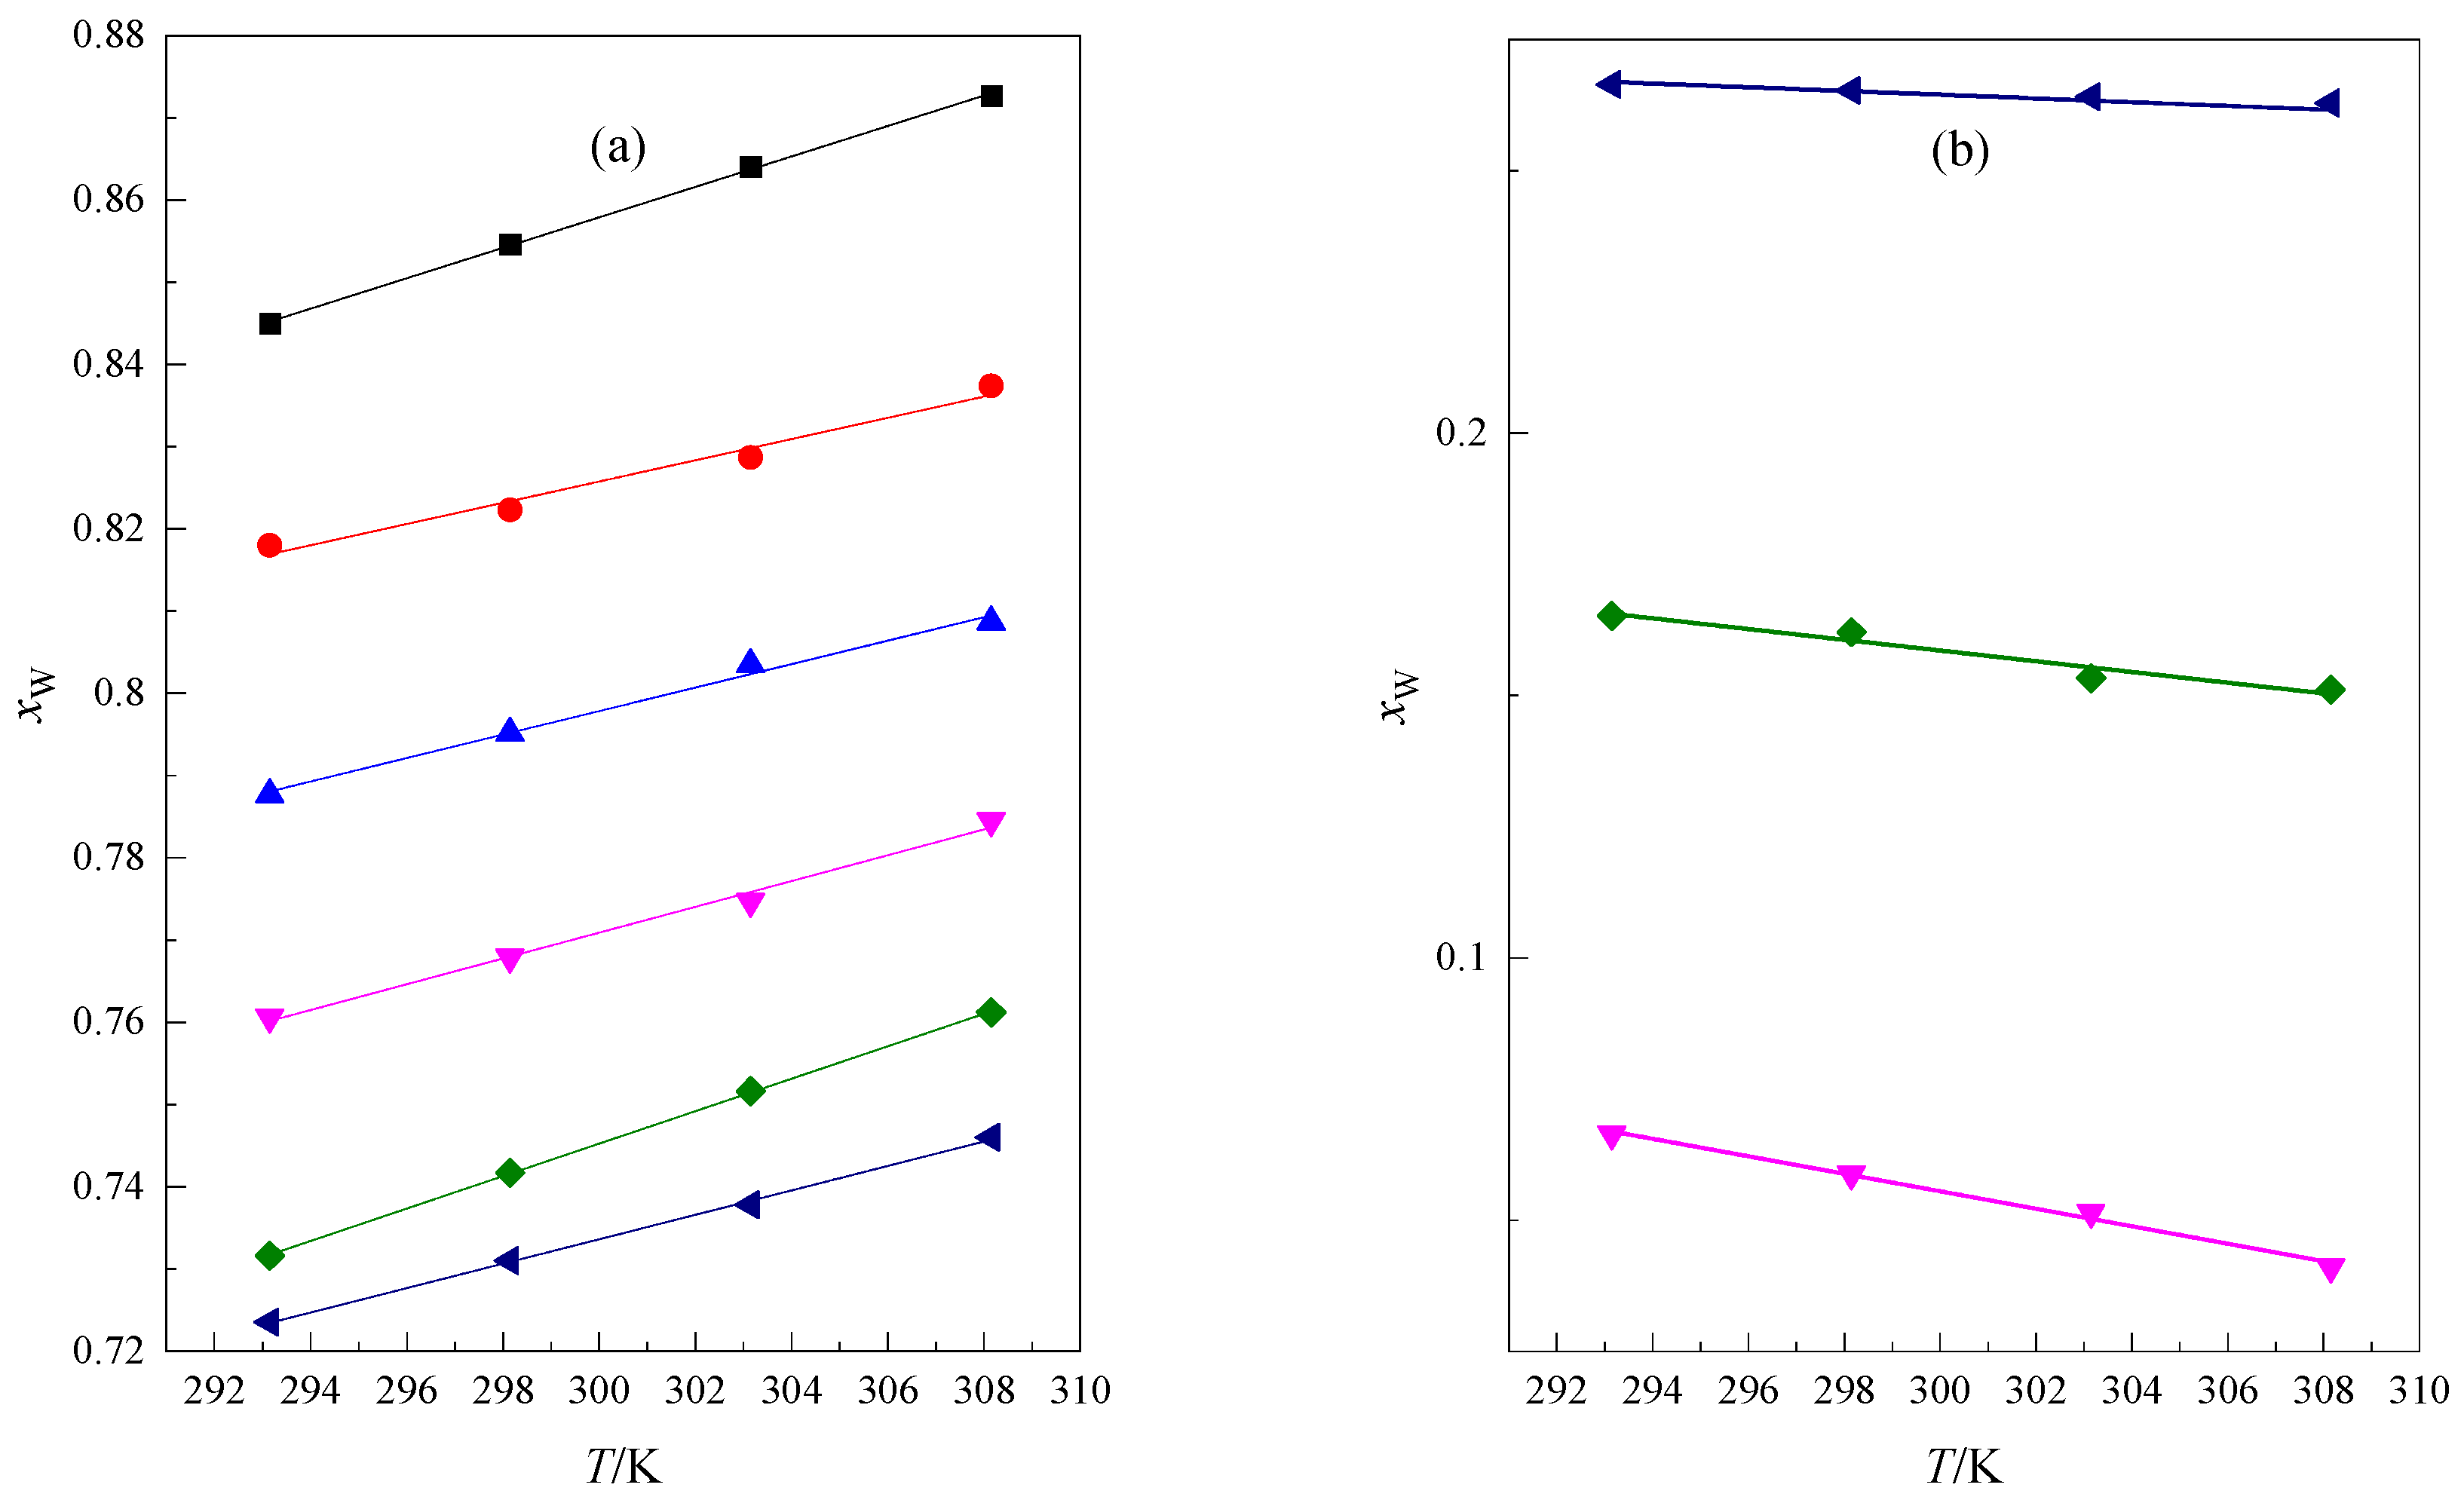
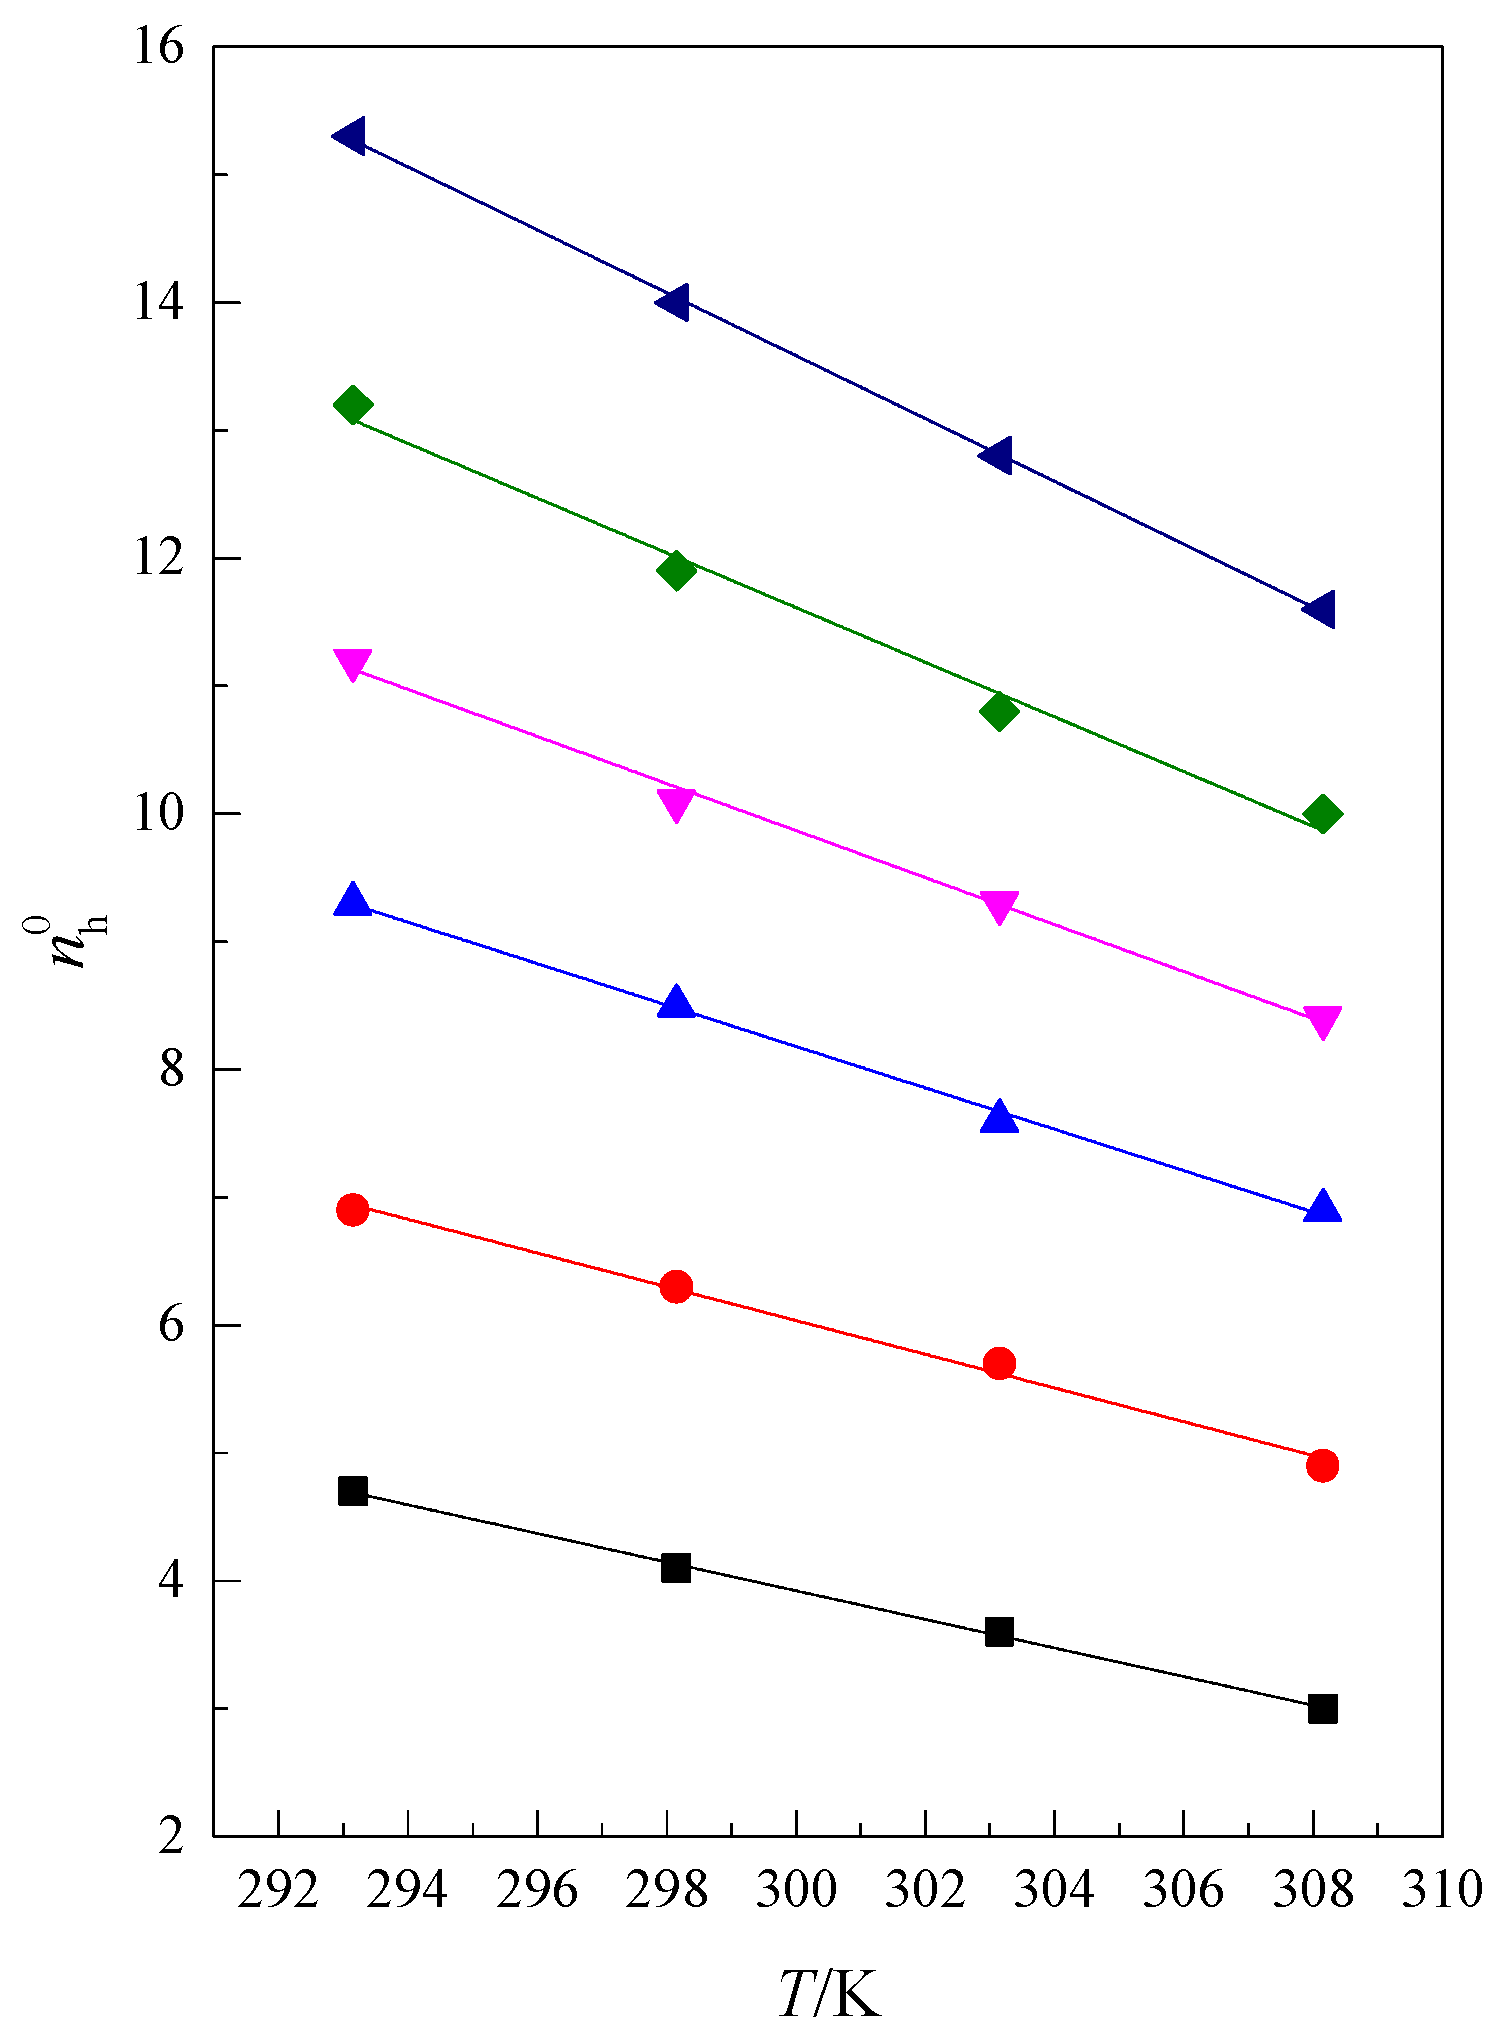
Figure 6a,b.
In
Figure 6, the dependence of the composition of the solvent (
xW) corresponding to the first and second intersection points of the isomolal curves
in relation to the temperature obtained for the examined glymes in the DMF + W mixed solvent is presented. In this case, this dependence is seen to be linear. As the temperature increases, this intersection point shifts towards a lower water content in the mixture. In a high water content, this may indicate that at a higher temperature, there is a greater disturbance in the clathrate-like structure as a result of increased thermal movements. In the mixture where DMF is dominating as a solvent, the location (
xW) of the second intersection point increases with the temperature increase. The parameters of the linear function
presented in
Figure 6 are shown in
Table 5. The determination coefficient and the standard deviation show that this linear relationship is very good. Using the values presented in
Table 5, the location of the first and second intersection points can be calculated at a selected temperature.
The values of apparent molar isentropic compression of glymes (
) in the DMF + W solvent were calculated using Equation (6) and are presented in
Tables S9 and S10 (see
Supplementary Materials):
where
M2 is the molar mass of glyme;
are the densities of solution and mixed solvent, respectively;
,
are the isentropic compressibility coefficients of the solution and solvent, respectively; and
m is the concentration of the solution in moles of solute per kg of mixed solvent.
Equation (7) was used for analyzing the function
.
The values of
and
bK were obtained by using the least-squares method. The limiting apparent molar isentropic compression (
) is equal to the limiting partial molar isentropic compression of glyme (
). The values of
for investigated glymes in the mixed solvent were calculated using Equation (8) and are presented in
Table 6 and
Table 7.
As seen in
Table 6 and
Table 7, the standard partial molar compression of pentaglyme and hexaglyme in the DMF + W mixed solvent increases with increasing temperature, similar to that in the case of glymes with shorter chains [
22].
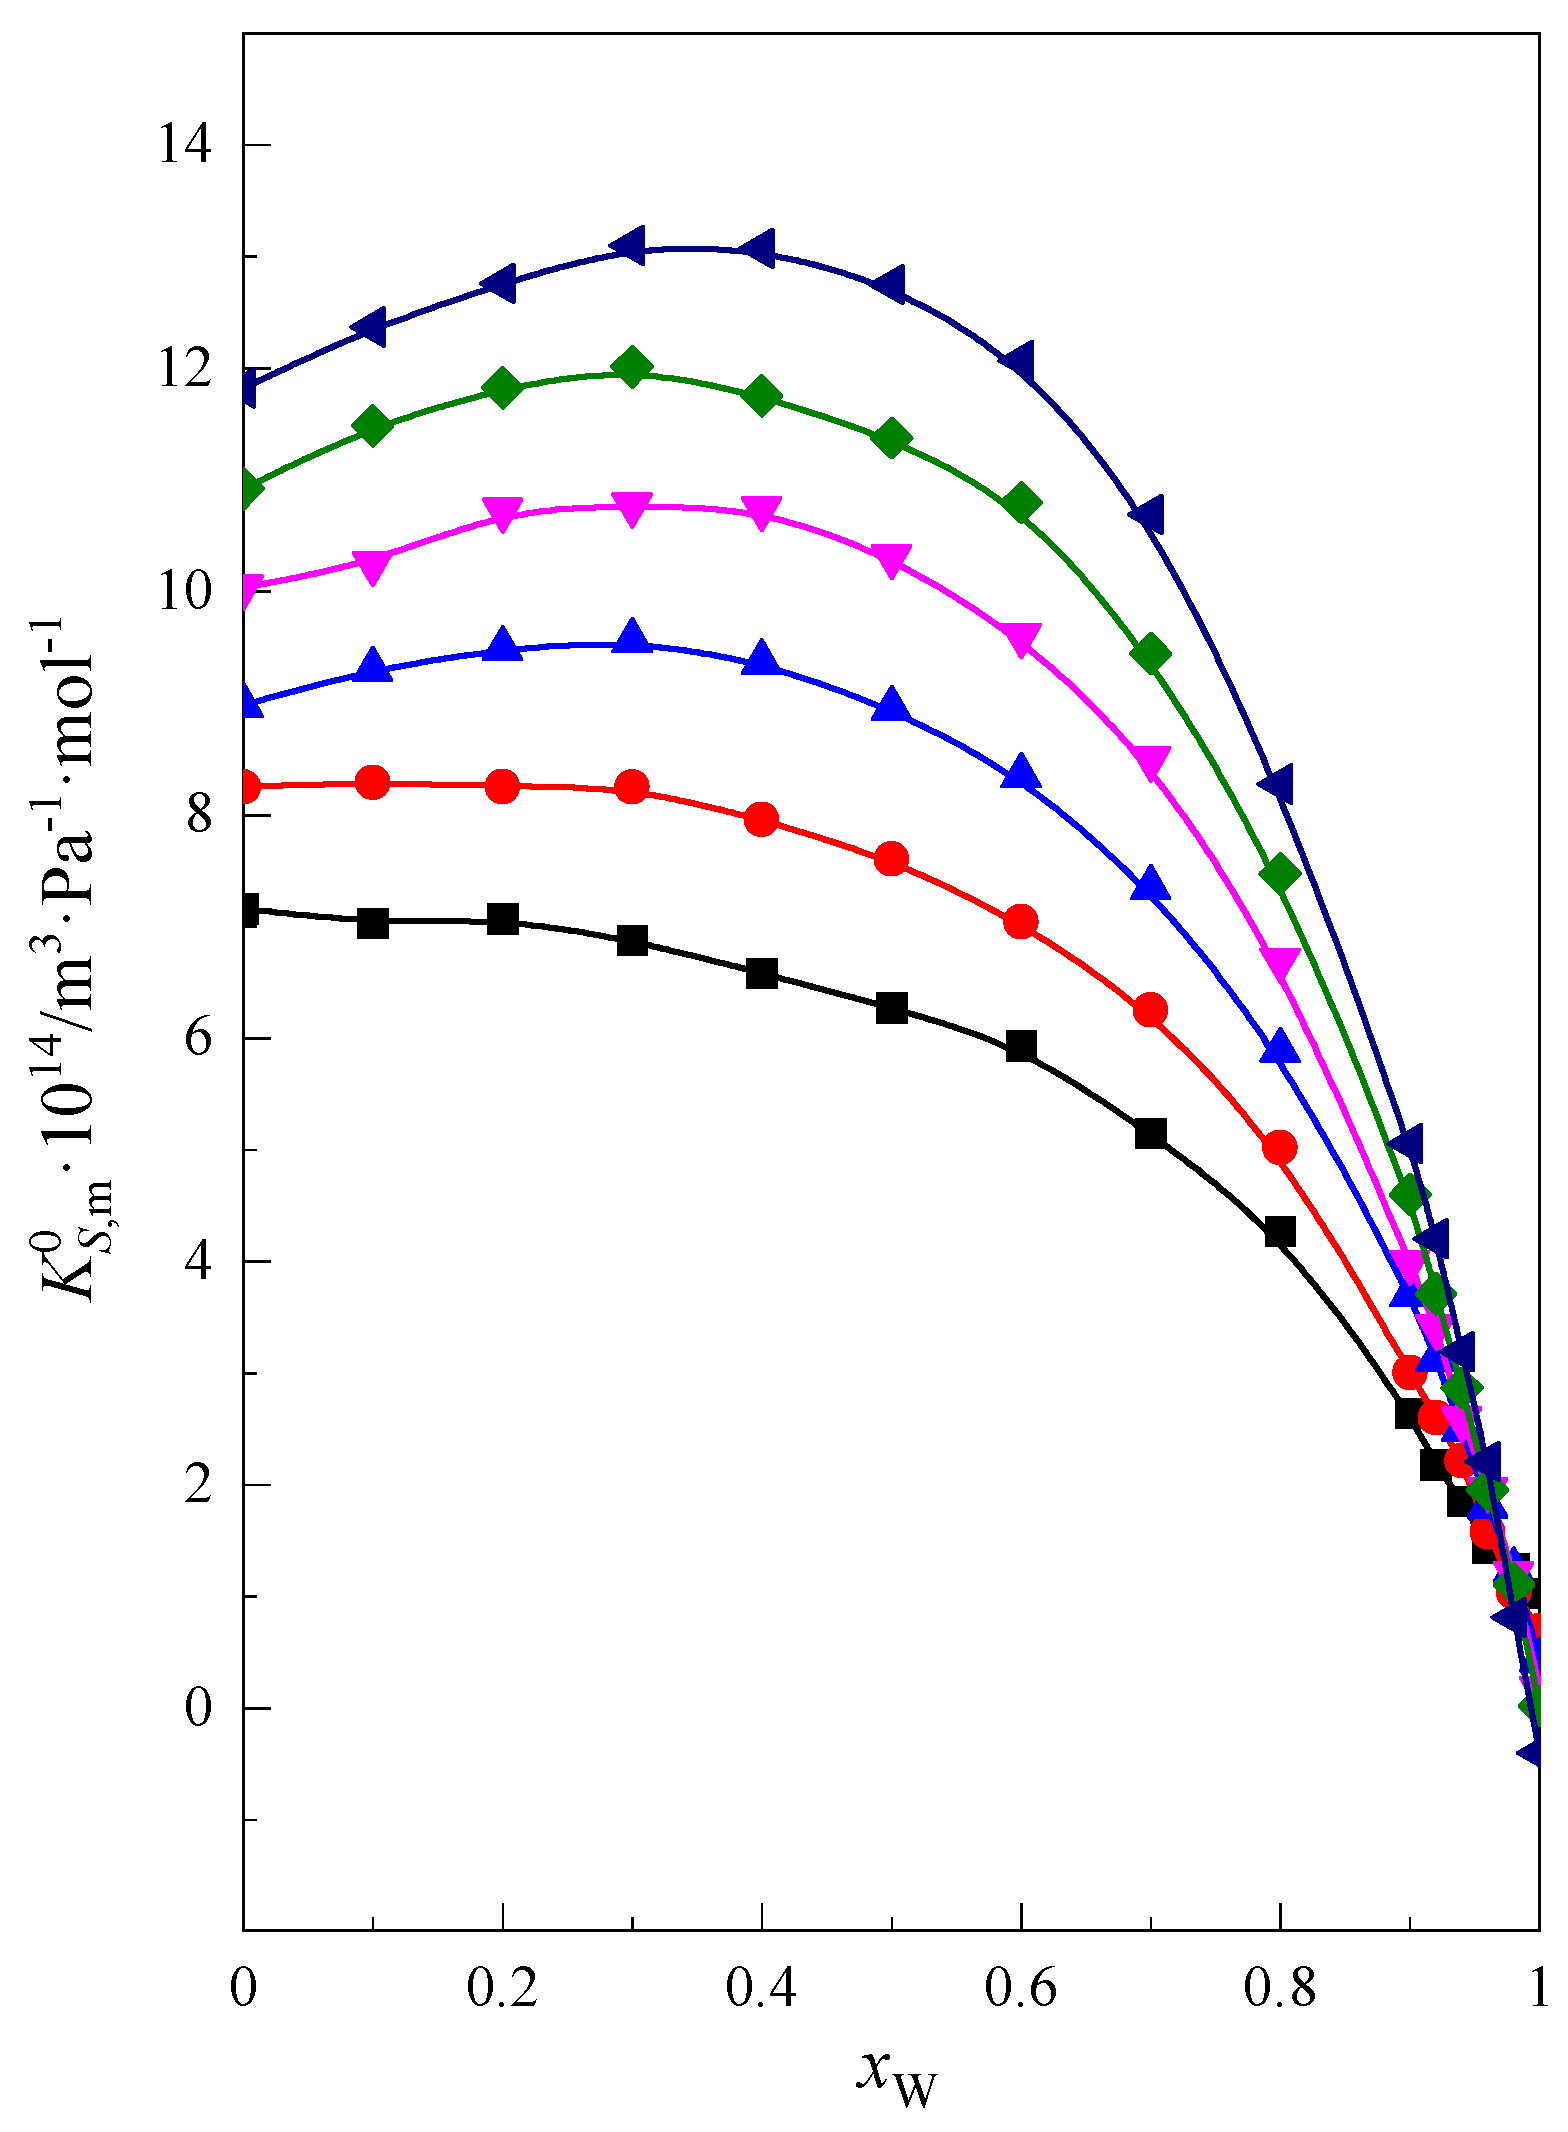
As can be seen in
Figure 7, the longer the chain of glymes and the greater the hydrophobic nature of these molecules, the greater the limiting molar value of isentropic compressibility of glymes. The limiting partial molar isentropic compression of tri-, tetra-, penta-, and hexaglyme passes through maxima in the range of medium water content in the mixture DMF + W, i.e.,
xW < 0.7. The height of this maximum increases with the increase in the hydrophobic nature of the studied glymes. This may suggest that in the high and medium DMF content of the mixed solvent, we can observe weaker interaction between the glyme and mixed-solvent molecules. This may be the reason for the weakening of the bonds’ structure in the system and the contribution to a slightly greater compression of the system in this range of concentrations of the mixture. This conclusion is confirmed by the lack of observed changes in the limiting partial molar expansion of glymes in the same concentration range of the DMF + W mixture, as shown in Equation (4). For shorter chain glymes (monoglyme and diglyme), one can observe only the change in the slope of the curve.
In the range of high water content in the mixture (
xW > 0.7), the compression of the investigated systems decreases with increasing water content. The higher the water content in the mixture, the more clearly the process of the hydrophobic hydration of glymes, which have a hydrophobic character, is observed. This stiffens the structure of the system and thus reduces the compressibility [
22,
29].
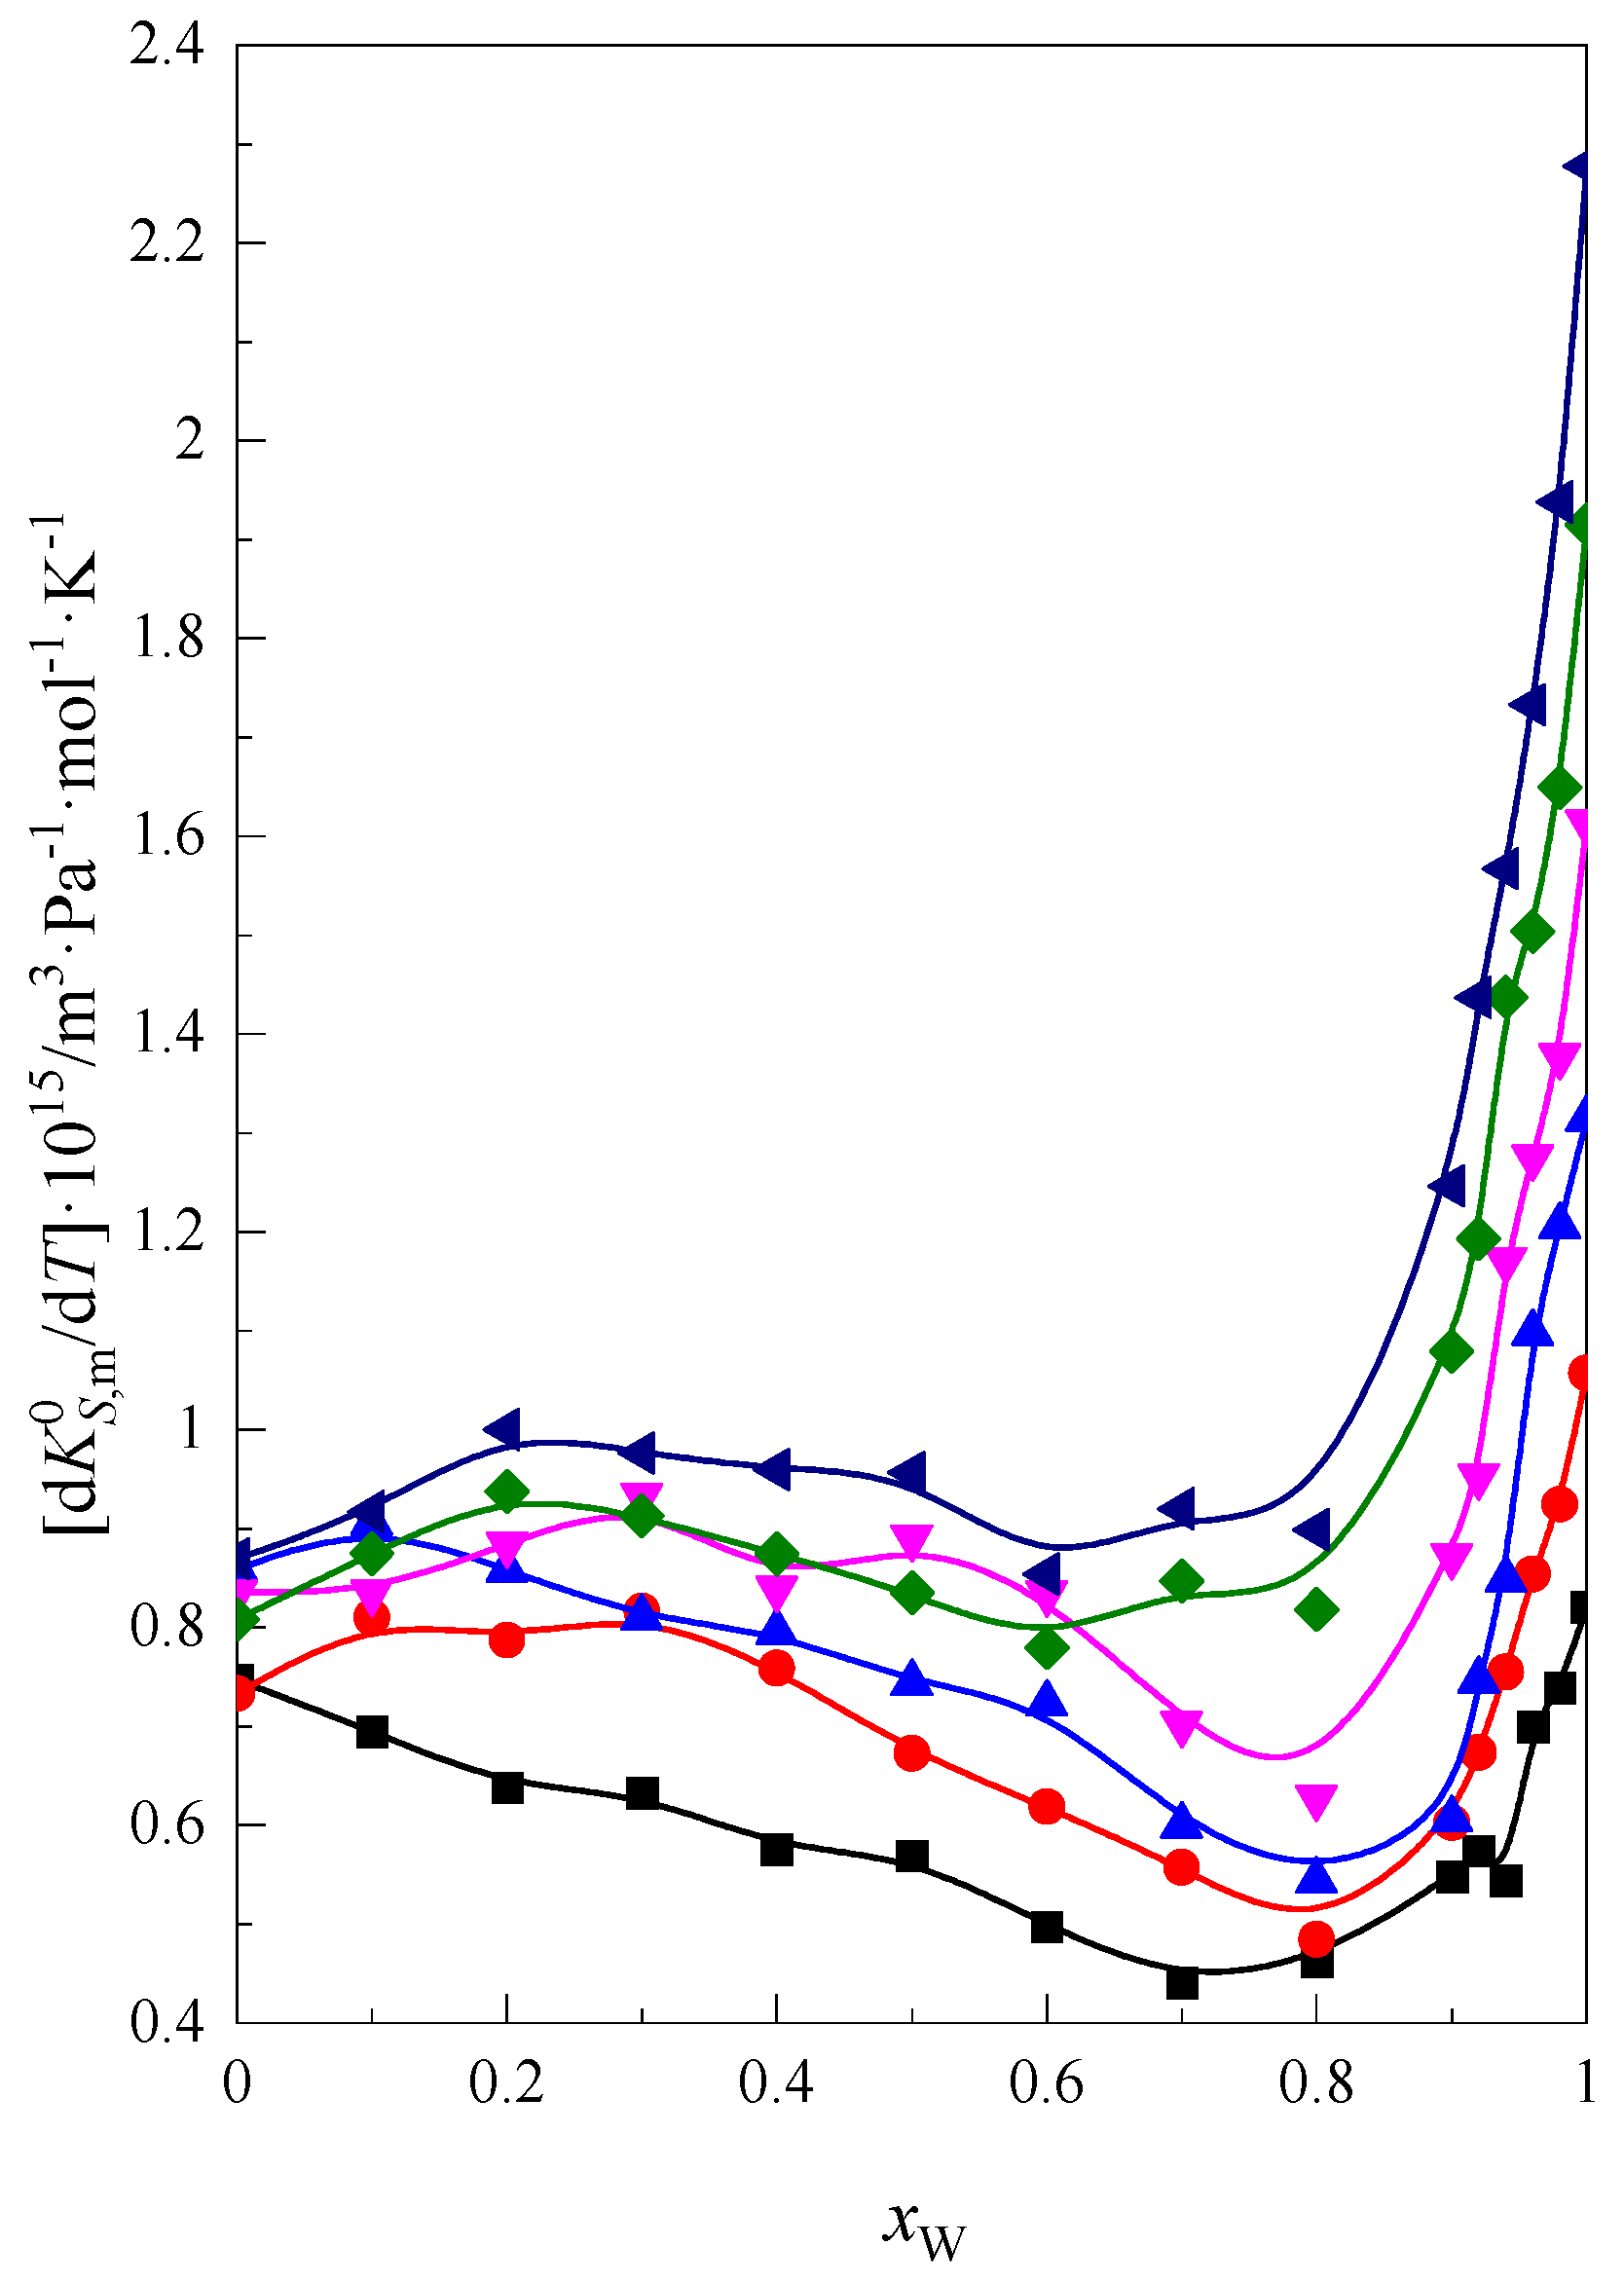
In
Figure 8, the
values as a function of water content (
xW) are presented for the glymes in the mixture DMF + W. As in the case of other functions, the greatest changes are seen with respect to the large amount of water in the system. The greatest influence of temperature on
is observed for solutions with a high water content, in which the hydrophobic hydration of the glymes plays a significant role.
2.4. The Contribution of the –CH2– and –O– Groups
The values of limiting molar volume (
), limiting molar expansion (
), and limiting molar compression (
) for the solution of glymes with the number of oxygen atoms in molecule 2 ≤
m–O– ≤ 7 made it possible to calculate the contribution of the –CH
2– and –O– groups in these values. Using the analogous method proposed by Savage and Wood [
33] the contribution of groups to the enthalpy of solvation of different compounds in pure solvent to be calculated. Thus, the average effect of the interaction between the –CH
2– or –O– group (in glyme molecule) and molecules of the DMF + W mixed solvent for the values of
,
, and
for glymes with 2 ≤
m–O– ≤ 7 in the DMF + W mixture has been calculated.
For the calculation, it was assumed that –CH
3 is equal to 1,5∙–CH
2– [
34], and Equation (10), as well as the nonlinear regression method, was used.
where
Z =
,
, and
;
n is the number of the –CH
2CH
2O– group in the glyme molecule;
P1 is the contribution of the –CH
2– group; and
P2 is the contribution of the ether oxygen atom –O–.
The obtained values of the average effect of the interaction between the –CH
2– or –O– group and molecules of the DMF + W mixed solvent are presented in
Table 10,
Table 11 and
Table 12 for
,
, and
, respectively, and in
Figure 11.
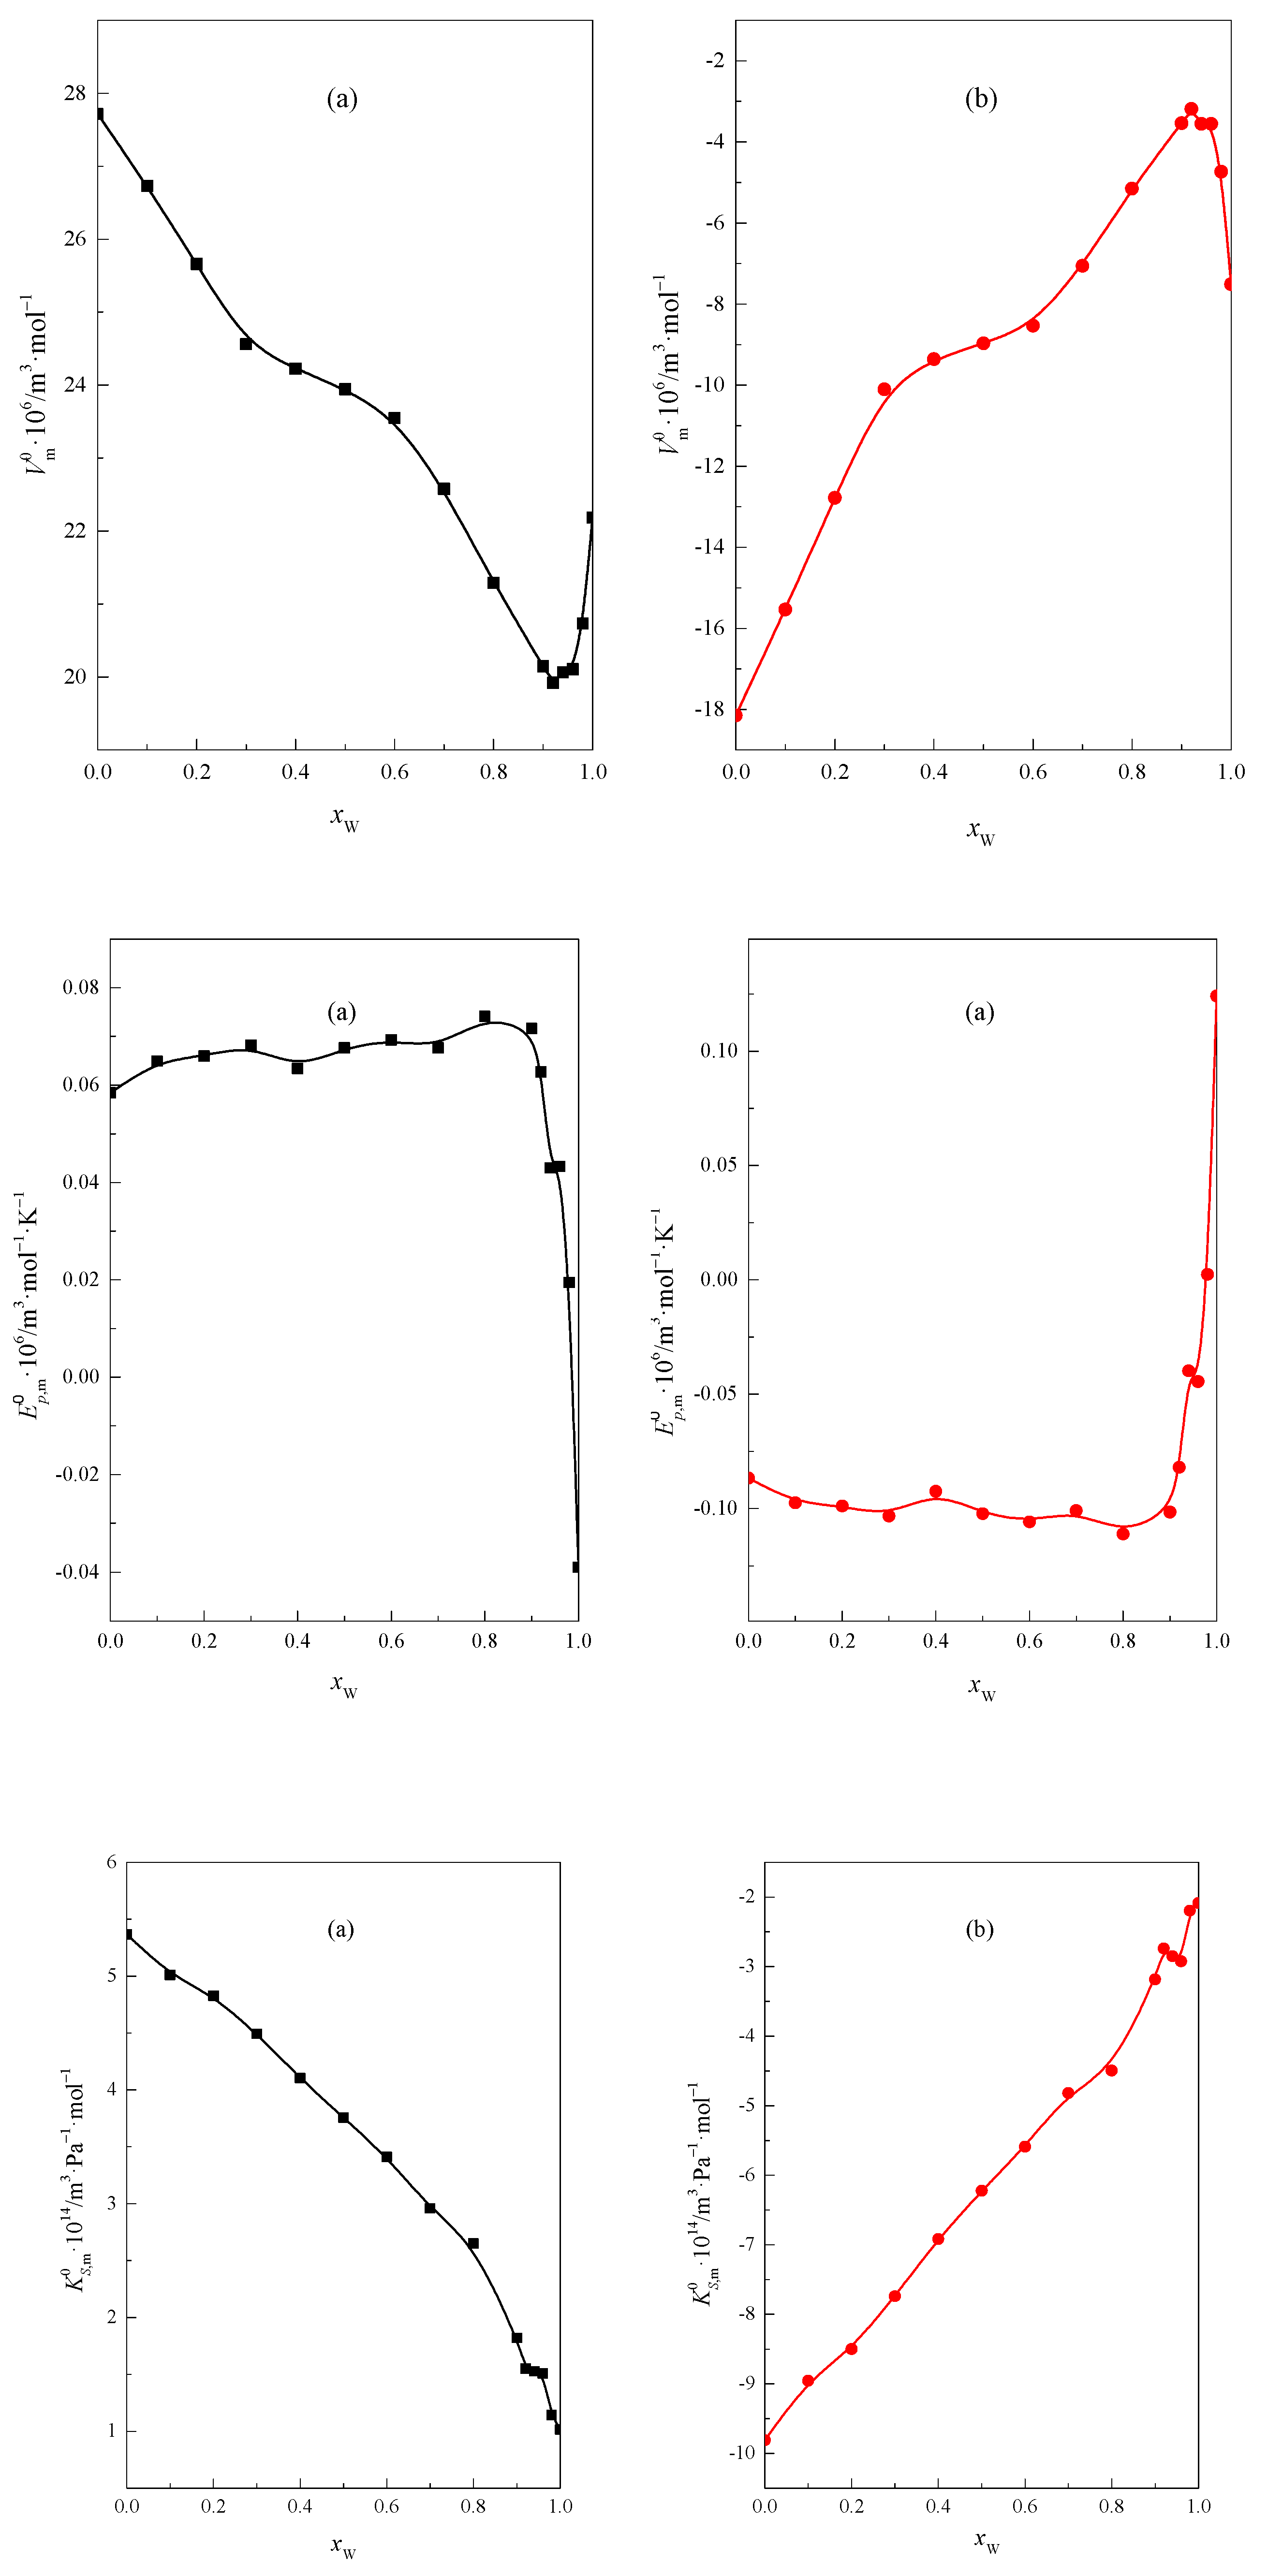
As can be seen in
Figure 11, the courses of the functions describing the contribution delivered by the –CH
2– group and the ether oxygen atom –O– to the
,
, and
functions, depending on the mole fraction of water
xW in the mixed solvent, are opposite to each other. The contribution of the –CH
2– group is positive, and, by the ether oxygen atom –O–, negative in all analyzed functions in the entire range of composition of the mixed solvent DMF + W.
In the range of high water content in the DMF + W mixed solvent characteristic, changes are observed in the functions and , and these prove that the hydrophobic nature of the –CH2– group influences the structure of the mixture. Analogous opposite changes are observed in the case of the hydrophilic oxygen atom. Moreover, the contribution of the –CH2– and –O– to the function is almost constant for small and medium water content in the mixture. In the case of group contributions obtained for standard partial molar compression, it can be seen that the function curve is monotonic. No characteristic course of the functions is observed in the area with high water content. This is probably related to the lower sensitivity of this function to changes in the hydrophobic–hydrophilic character. The increasing contribution of the atom –O– to the suggests that the presence of an oxygen atom in the low and medium water content of the DMF + W mixture also contributes to increasing the values of in this range of the mixture.
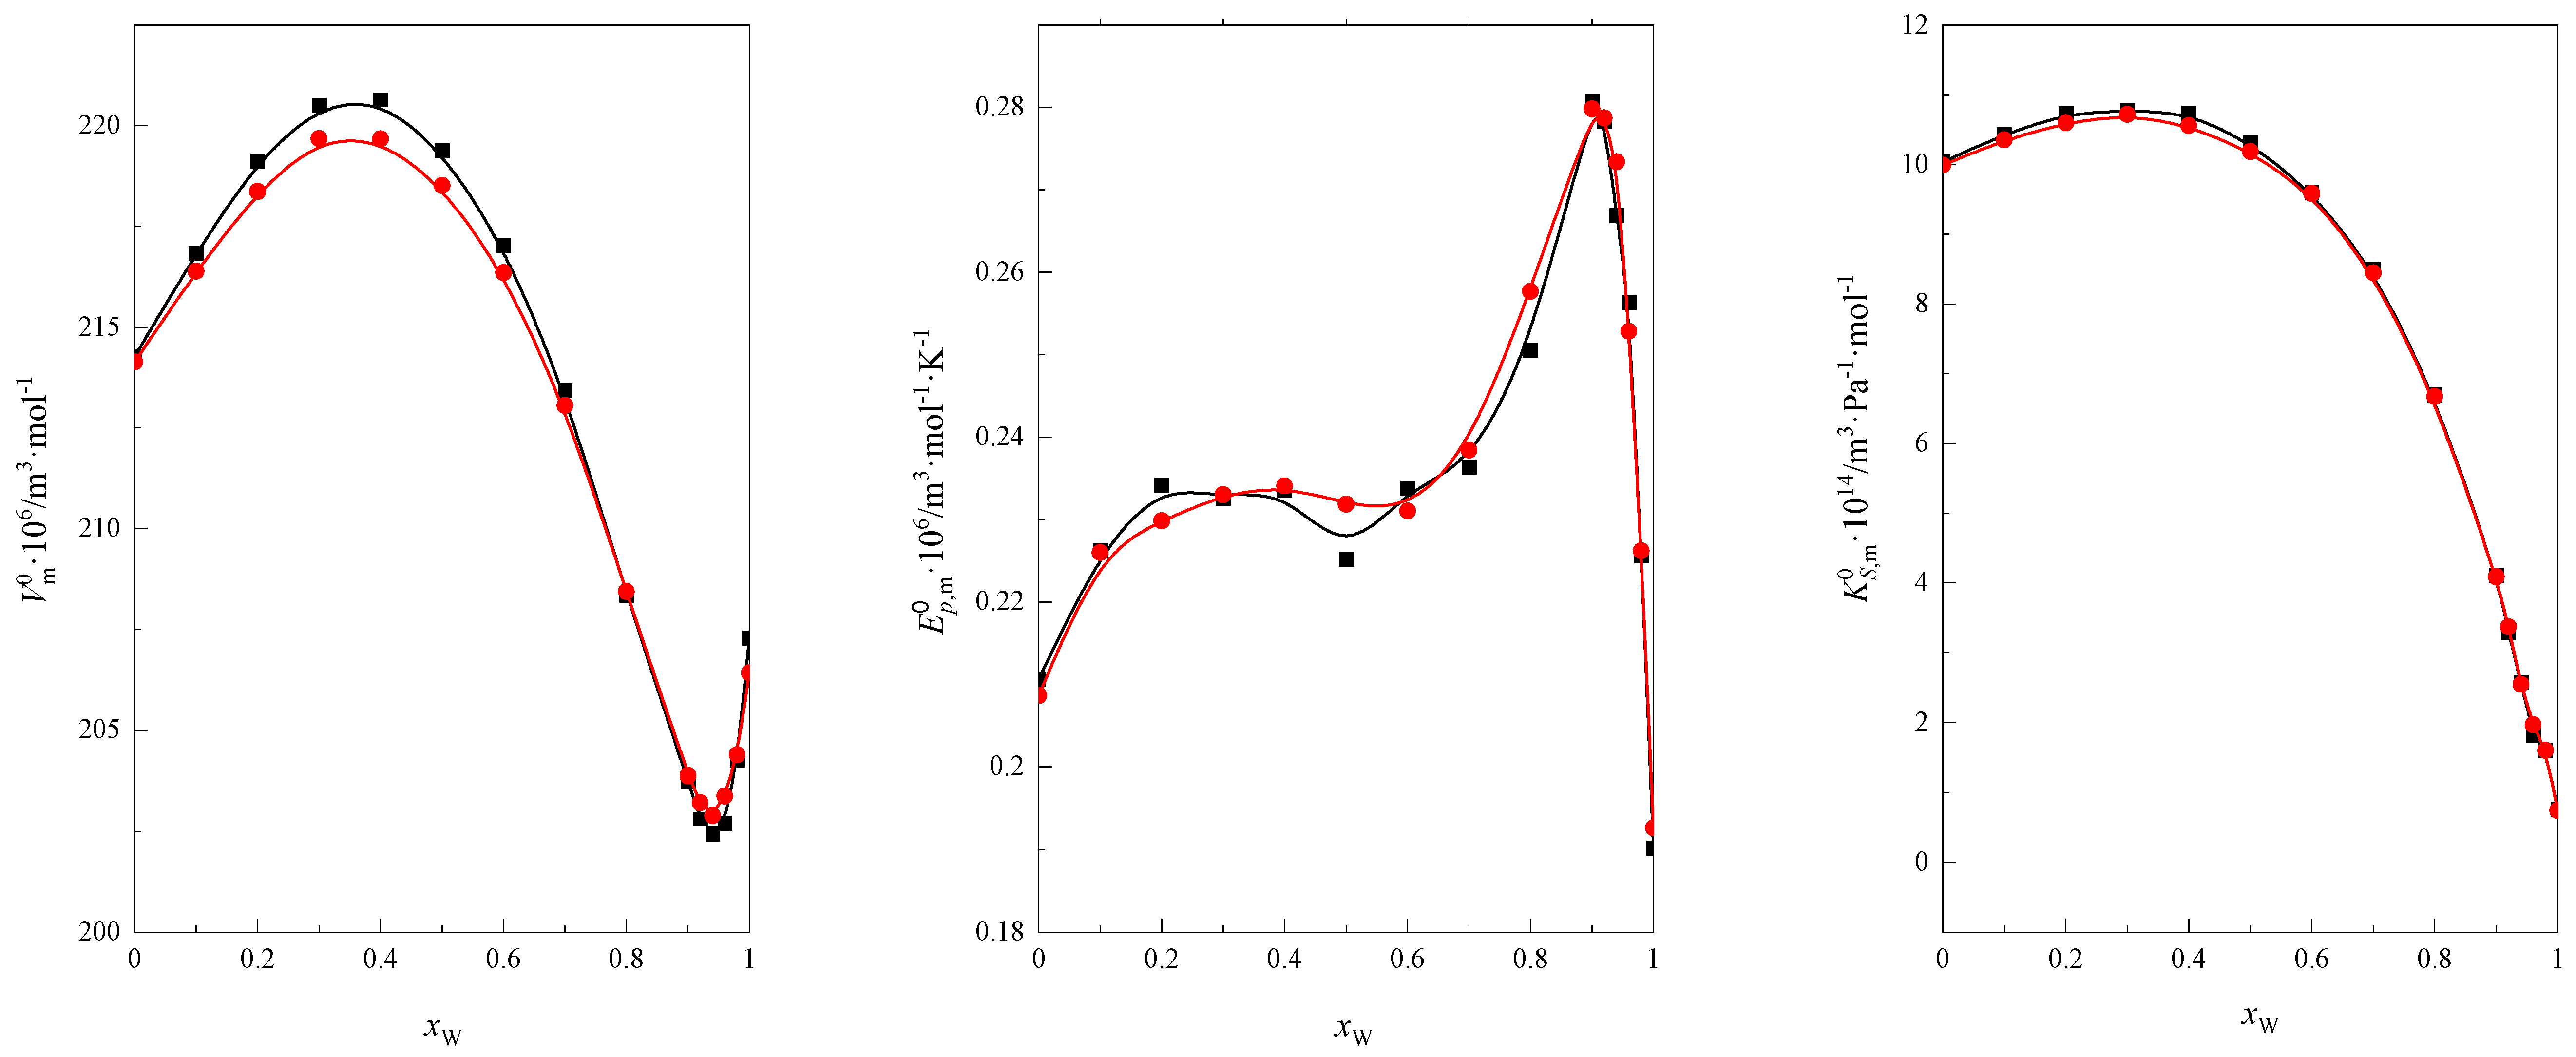
For example, in
Figure 12, the function courses
,
, and
, calculated using the group contribution and calculated using experimental data for tetraglyme at 298.15 K in the DMF + W mixed solvent, are compared. As shown in
Figure 12, the consistency of the obtained dependencies is satisfactory.


