
Conductometric Studies of Formation the Inclusion Complexes of Phenolic Acids with β-Cyclodextrin and 2-HP-β-Cyclodextrin in Aqueous Solutions

Abstract
:
1. Introduction
2. Results and Discussion
3. Materials and Methods
3.1. Materials
3.2. Characterization Methods
4. Conclusions
Supplementary Materials
Funding
Informed Consent Statement
Data Availability Statement
Conflicts of Interest
References
- Szetjli, J. Introduction and general overview of cyclodextrin chemistry. Chem. Rev. 1998, 98, 1743–1753. [Google Scholar]
- Munzos-Botella, S.; del Castillo, B.; Martin, M.A. Cyclodextrin properties and applications of inclusion complex formation. ARS Pharm. 1995, 36, 187–198. [Google Scholar]
- Martin Del Valle, E.M. Cyclodextrin and their uses: A review. Process Biochem. 2004, 39, 1033–1046. [Google Scholar] [CrossRef]
- Fujishima, N.; Kusaka, K.; Umino, T.; Urushinata, T.; Terumi, K. Flour based foods containing highly branched cyclodextrins. Jpn. Pat. JP 2001, 136, 898. [Google Scholar]
- Bhardway, R.; Dorr, R.T.; Blanchard, J. Approaches to reducing toxicity of parenteral anticancer drug formulations using cyclodextrins. J. Pharm. Sci. Technol. 2000, 54, 233–239. [Google Scholar]
- Bibby, D.C.; Davies, N.M.; Tucker, I.G. Mechanism by which cyclodextrins modify drug release from polymeric drug delivery systems. Int. J. Pharm. 2000, 197, 1–11. [Google Scholar] [CrossRef] [PubMed]
- Buschmann, H.J.; Scollmeyer, E. Applications of cyclodextrins in cosmetic products: A review. J. Cosmet. Sci. 2002, 53, 185–191. [Google Scholar]
- Foley, P.R.; Kaiser, C.E.; Sadler, J.D.; Burckhardt, E.E.; Liu, Z. Detergent Composition with Cyclodextrin Perfume Complexes to Mask Malodours. U.S. Patent WO2001023516A1, 29 September 2000. [Google Scholar]
- Hedges, R.A. Industrial applications of cyclodextrins. Chem. Rev. 1998, 98, 2035–2044. [Google Scholar] [CrossRef] [PubMed]
- Baudin, C.; Pean, C.; Perly, B.; Goselin, P. Inclusion of organic pollutants in cyclodextrin and derivatives. Int. J. Environ. Anal. Chem. 2000, 77, 233–242. [Google Scholar] [CrossRef]
- Lezcano, M.; Ai-Soufi, W.; Novo, M.; Rodriguez-Nunez, E.; Tato, J.V. Complexation of several benzimidazoletype fugicides with alpha and beta- cyclodextrins. J. Agric. Food Chem. 2002, 50, 108–112. [Google Scholar] [CrossRef]
- Koukiekolo, R.; Desseaux, V.; Moreau, Y.; Marchis, M.G.; Santimone, M. Mechanism of porcine pancreatic alphaamylase inhibition of amylose and maltopentaose hydrolysis by alpha, beta- and gamma-cyclodextrins. Eur. J. Biochem. 2001, 268, 841–848. [Google Scholar] [CrossRef] [PubMed]
- Schneiderman, E.; Stalcup, A.M. Cyclodextrins: A versatile tool in separation science. J. Chromatogr. B Biomed. Sci. Appl. 2000, 745, 83–102. [Google Scholar] [CrossRef] [PubMed]
- Lu, X.; Chen, Y. Chiral separation of amino acids derivatives with fluoresceine-5-isothiocyanate by capillary electrophoresis and laser-induced fluorescene detection using mixed selectors of beta-cyclodextrin and sodium taurocholate. J. Chromatogr. A 2002, 955, 133–140. [Google Scholar] [CrossRef] [PubMed]
- Zarzycki, P.K.; Kulhanek, K.M.; Smith, R. Chromatographic behaviour of selected steroids and their inclusion complexes with beta-cyclodextrin on octadecylsilica stationary phases with different carbon loads. J. Chromatogr. A 2002, 955, 125–131. [Google Scholar] [CrossRef] [PubMed]
- Szejtli, J.; Szente, L. Elimination of bitter, disgusting tastes of drugs and foods by cyclodextrin. Eur. J. Pharm. Biopharm. 2005, 61, 115–125. [Google Scholar] [CrossRef] [PubMed]
- Siquet, C.; Paiva-Martins, F.; Lima, J.; Reis, S.; Borges, F. Antioxidant profile of dihydroxy- and trihydroxyphenolic acid—A structure—Activity relationship study. Free Radic. Res. 2006, 40, 433–442. [Google Scholar] [CrossRef]
- Cuvelier, M.E.; Richard, H.; Berset, C. Comparison of the antioxidative activity of some acid-phenols: Structure—Activity relationship. Biosci. Biotechnol. Biochem. 1992, 56, 324–325. [Google Scholar] [CrossRef] [Green Version]
- Chen, J.H.; Ho, C.-T. Antioxidant activities of caffeic acid and its related hydroxy- cinnamic acid compounds. J. Agric. Food Chem. 1997, 45, 2374–2378. [Google Scholar] [CrossRef]
- Medina, I.; Gallardo, J.M.; González, M.J.; Lois, A.S.; Hedges, N. Effect of molecular structure of phenolic families as hydroxycinnamic acids and catechins on their antioxidant effectiveness in minced fish muscle. J. Agric. Food Chem. 2007, 55, 3889–3895. [Google Scholar] [CrossRef]
- Sroka, Z.; Cisowski, W. Hydrogen peroxide scavenging, antioxidant and anti-radical activity of some phenolic acids. Food Chem. Toxicol. 2003, 41, 753–758. [Google Scholar] [CrossRef]
- Cheng, J.-C.; Dai, F.; Zhou, B.; Yang, L.; Liu, Z.L. Antioxidant activity of hydrocinnamic acid derivative in human low density lipoprotein: Mechanism and structure-activity relationship. Food Chem. 2007, 104, 132–139. [Google Scholar] [CrossRef]
- Marinova, E.M.; Toneva, A.; Yanishlieva, N. Comparison of the antioxidative properties of caffeic and chlorogenic acids. Food Chem. 2009, 114, 1498–1502. [Google Scholar] [CrossRef]
- Kinart, Z.; Tomaš, R. Studies of the Formation of Inclusion Complexes Derivatives of Cinnamon Acid with α-Cyclodextrin in a Wide Range of Temperatures Using Conductometric Methods. Molecules 2022, 27, 4420. [Google Scholar] [CrossRef] [PubMed]
- Salomon, M.; Hefter, G.T. Mobilities of cation-macrocyclic ligand complexes. Pure Appl. Chem. 1993, 65, 1533–1540. [Google Scholar] [CrossRef] [Green Version]
- Salomon, M. Conductometric study of cationic and anionic complexes in propylene carbonate. J. Solut. Chem. 1990, 19, 1225–1236. [Google Scholar] [CrossRef]
- Hoglen, N.C.; Waller, S.C.; Sipes, I.G.; Liebler, D.C. Reactions of peroxynitrite with gam-ma-tocopherol. Chem. Res. Toxicol. 1997, 10, 401–407. [Google Scholar] [CrossRef]
- Conney, R.V.; Harwood, P.J.; Franke, A.A.; Narala, K.; Sundstrom, A.K.; Berggren, P.O.; Mordan, L.J. Products of γ-tocopherol reaction with NO2 and their formation in rat insu- linoma (RINm5F) cells. Free. Radic. Biol. Med. 1995, 19, 259–269. [Google Scholar] [CrossRef]
- Conney, R.V.; Franke, A.A.; Harwood, P.J.; Hatch-pigott, V.; Custer, L.J. γ-Tocopherol detoxification of nitrogen dioxide: Superiority to α-tocopherol. Proc. Natl. Acad. Sci. USA 1993, 90, 1771–1775. [Google Scholar] [CrossRef] [Green Version]
- Ohkatsu, Y.; Kajiyama, T.; Arai, Y. Antioxidant acivities of tocopherols. Polym. Degrad. Stab. 2001, 72, 303–311. [Google Scholar] [CrossRef]
- Williamson, K.S.; Gabbita, S.P.; Mou, S.; West, M.; Pye, Q.N.; Markesbery, W.R.; Cooney, R.V.; Grammas, P.; Reimann-Philipp, U.; Floyd, R.A.; et al. The nitration product 5-nitro-gamma-tocopherol is increased in the Alzheimer brain. Nitric Oxide 2002, 6, 221–227. [Google Scholar] [CrossRef] [Green Version]
- Mura, P. Analytical techniques for characterization of cyclodextrin complexes in aqueous solution: A review. J. Pharm. Biomed. Anal. 2014, 101, 238–250. [Google Scholar] [CrossRef] [PubMed]
- Górnas, P.; Neunert, G.; Baczyńśki, K.; Polewski, K. Beta-cyclodextrin complexes with chlorogenic and caffeic acids from coffeebrew: Spectroscopic, thermodynamic and molecular modelling study. Food Chem. 2009, 114, 190–196. [Google Scholar] [CrossRef]
- Aksamija, A.; Tomao, V.; Dangles, O.; Plasson, R. Encapsulation of phenolic acids into cyclodextrins: A globalstatistical analysis of the effects of pH, temperature and concentrations on binding constants measured by ACE methods. Electrophoresis 2022, 43, 2290–2301. [Google Scholar] [CrossRef] [PubMed]
- Matejczyk, M.; Swisłocka, R.; Golonko, A.; Lewandowski, W.; Hawrylik, E. Cytotoxic, genotoxic and antimicrobial activity of caffeic and rosmarinic acids and their lithium, sodium and potassium salts as potential anticancer compounds. Adv. Med. Sci. 2018, 63, 14–21. [Google Scholar] [CrossRef] [PubMed]
- Swisłocka, R. Spectroscopic (FT-IR, FT-Raman, UV absorption, 1H and 13C NMR) and theoretical (in B3LYP/6-311++G** level) studies on alkalimetal salts of caffeic acid. Spectrochim. Acta Part A Mol. Biomol. Spectrosc. 2013, 100, 21–30. [Google Scholar] [CrossRef] [PubMed]
- Kinart, Z.; Tomaš, R. Conductivity properties of selected aliphatic monocarboxylic acid anions in water at 298.15 K. Int. J. Electrochem. Sci. 2020, 15, 10007–10027. [Google Scholar] [CrossRef]
- Bešter-Rogač, M.; Neueder, R.; Barthel, J.; Appeblat, A. Conductivity studies on aqueous solutions of stereoisomers of tartaricacids and tartrates. Part III. Acidic tartrates. J. Solut. Chem. 1998, 27, 299–307. [Google Scholar] [CrossRef]
- Barthel, J.; Feuerlein, F.; Neueder, R.; Wachter, R. Calibration of conductance cells at various temperatures. J. Solut. Chem. 1980, 9, 209–219. [Google Scholar] [CrossRef]
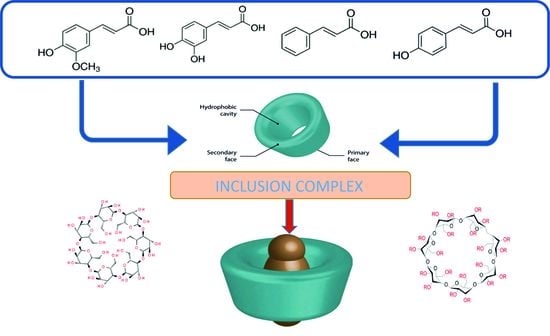
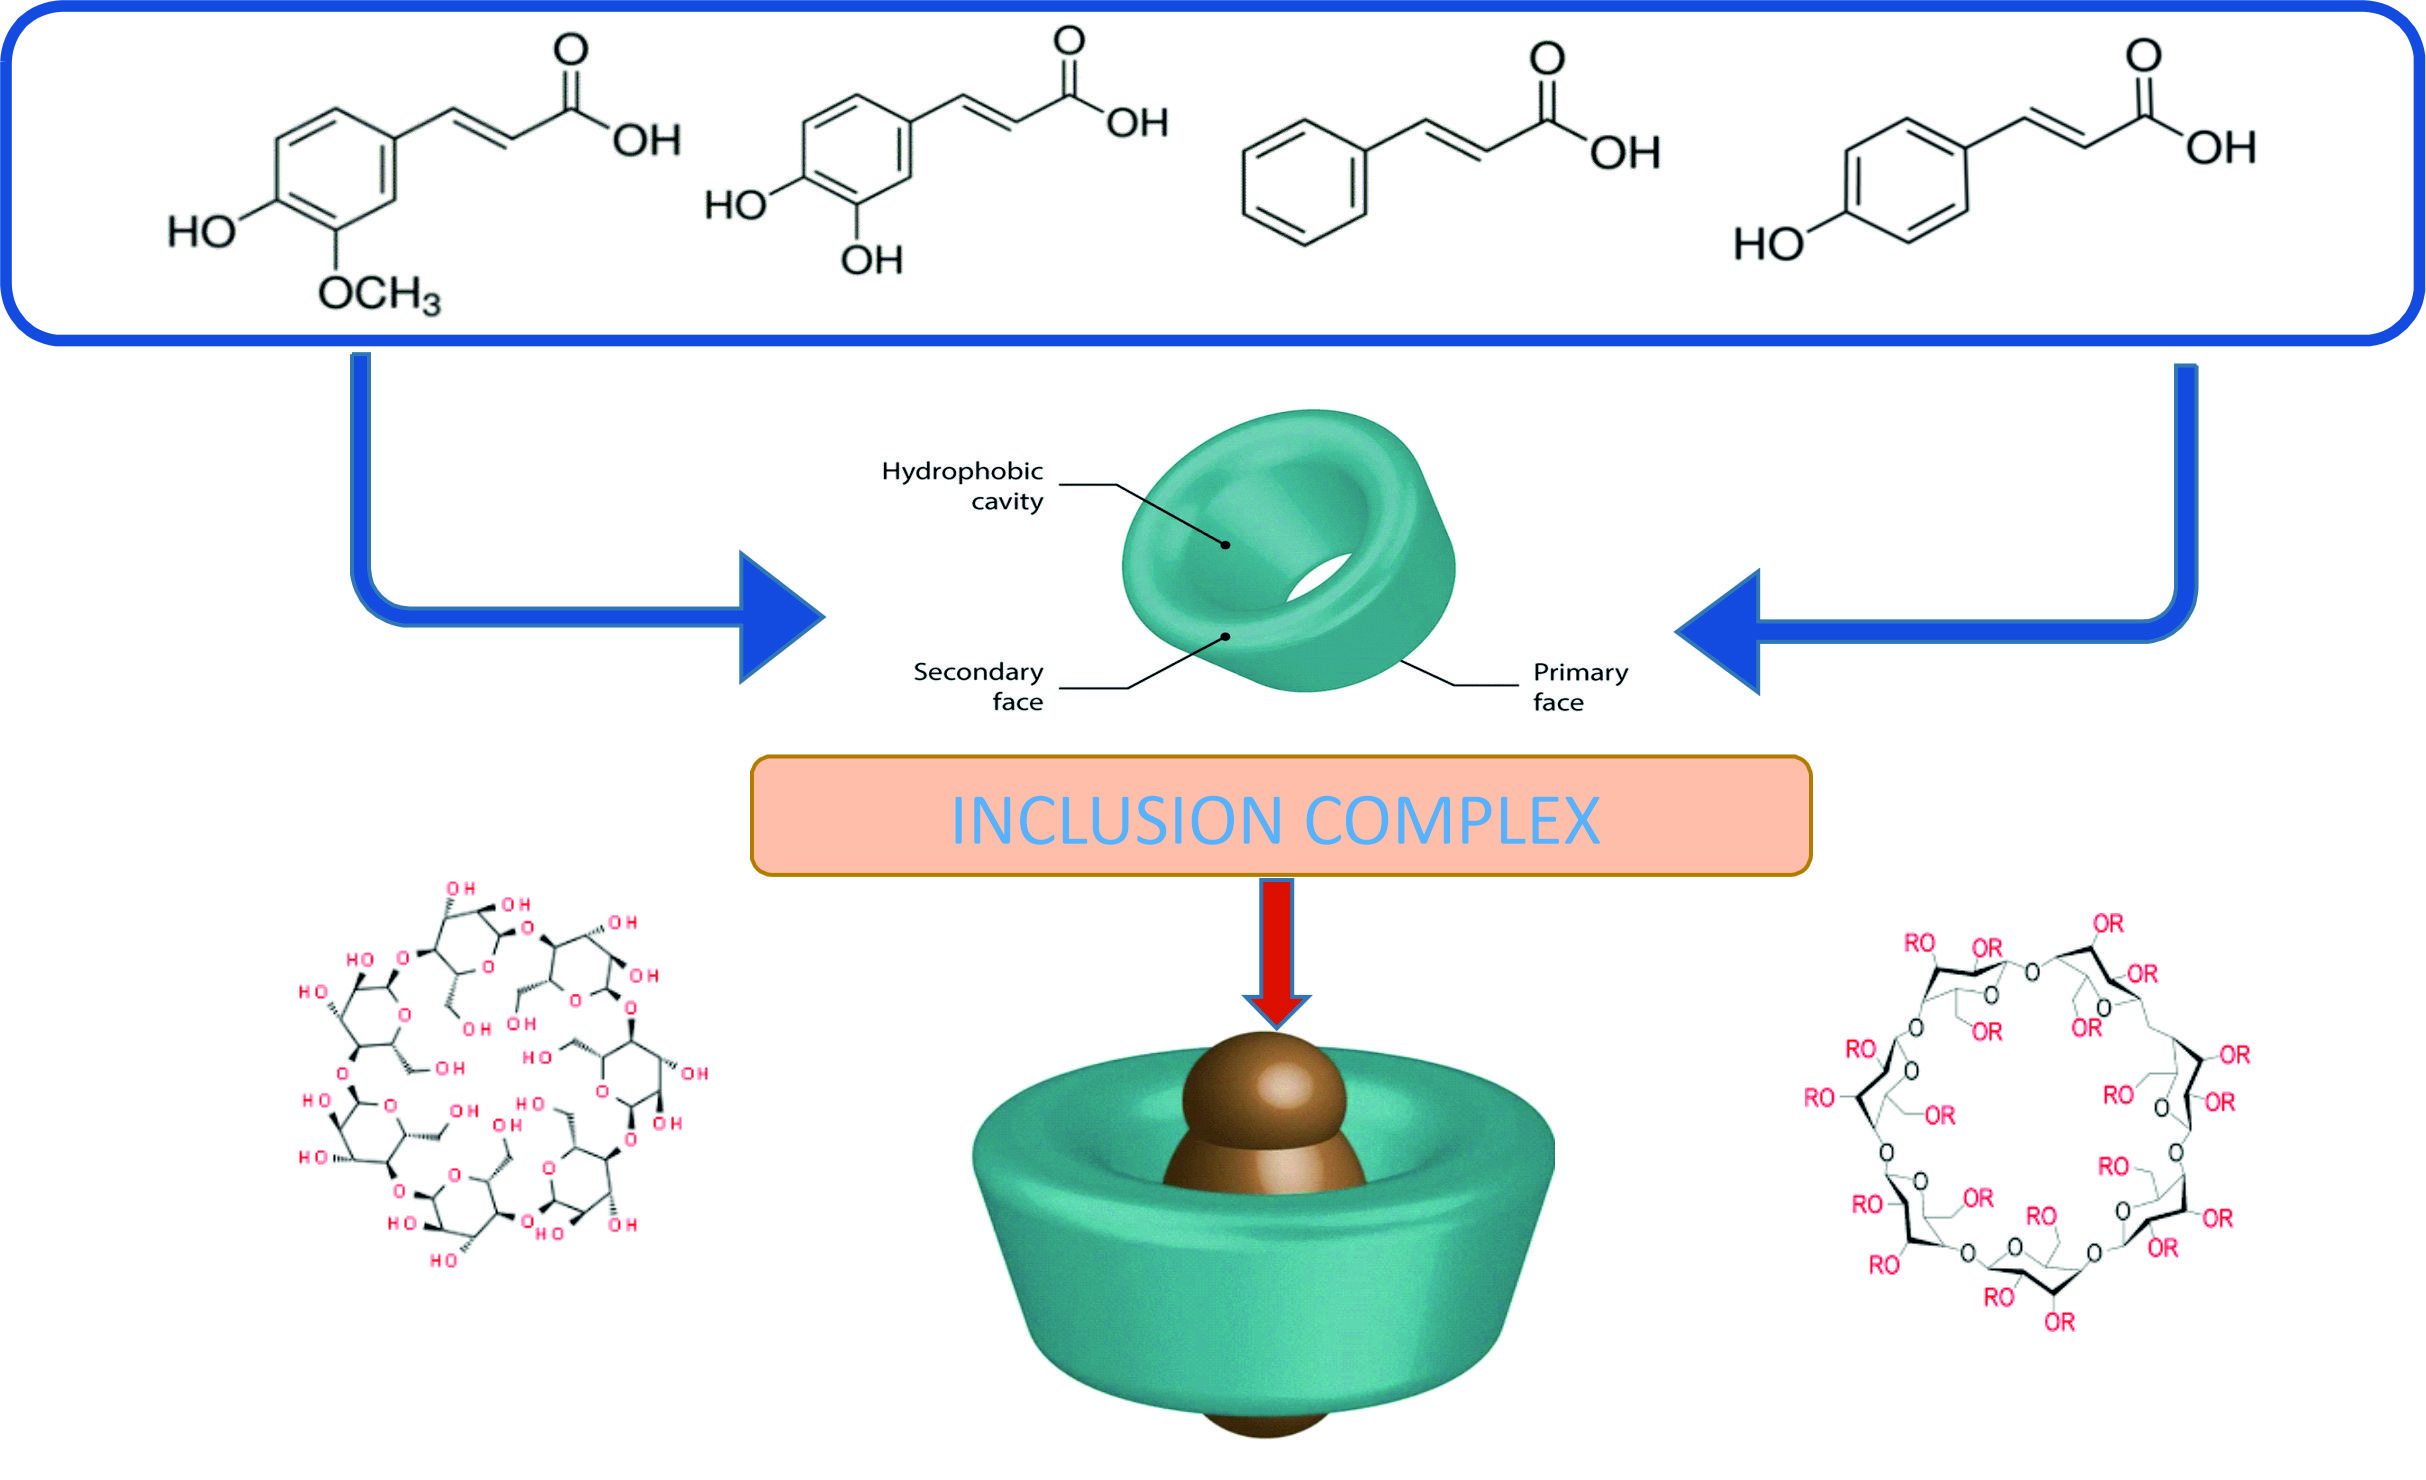
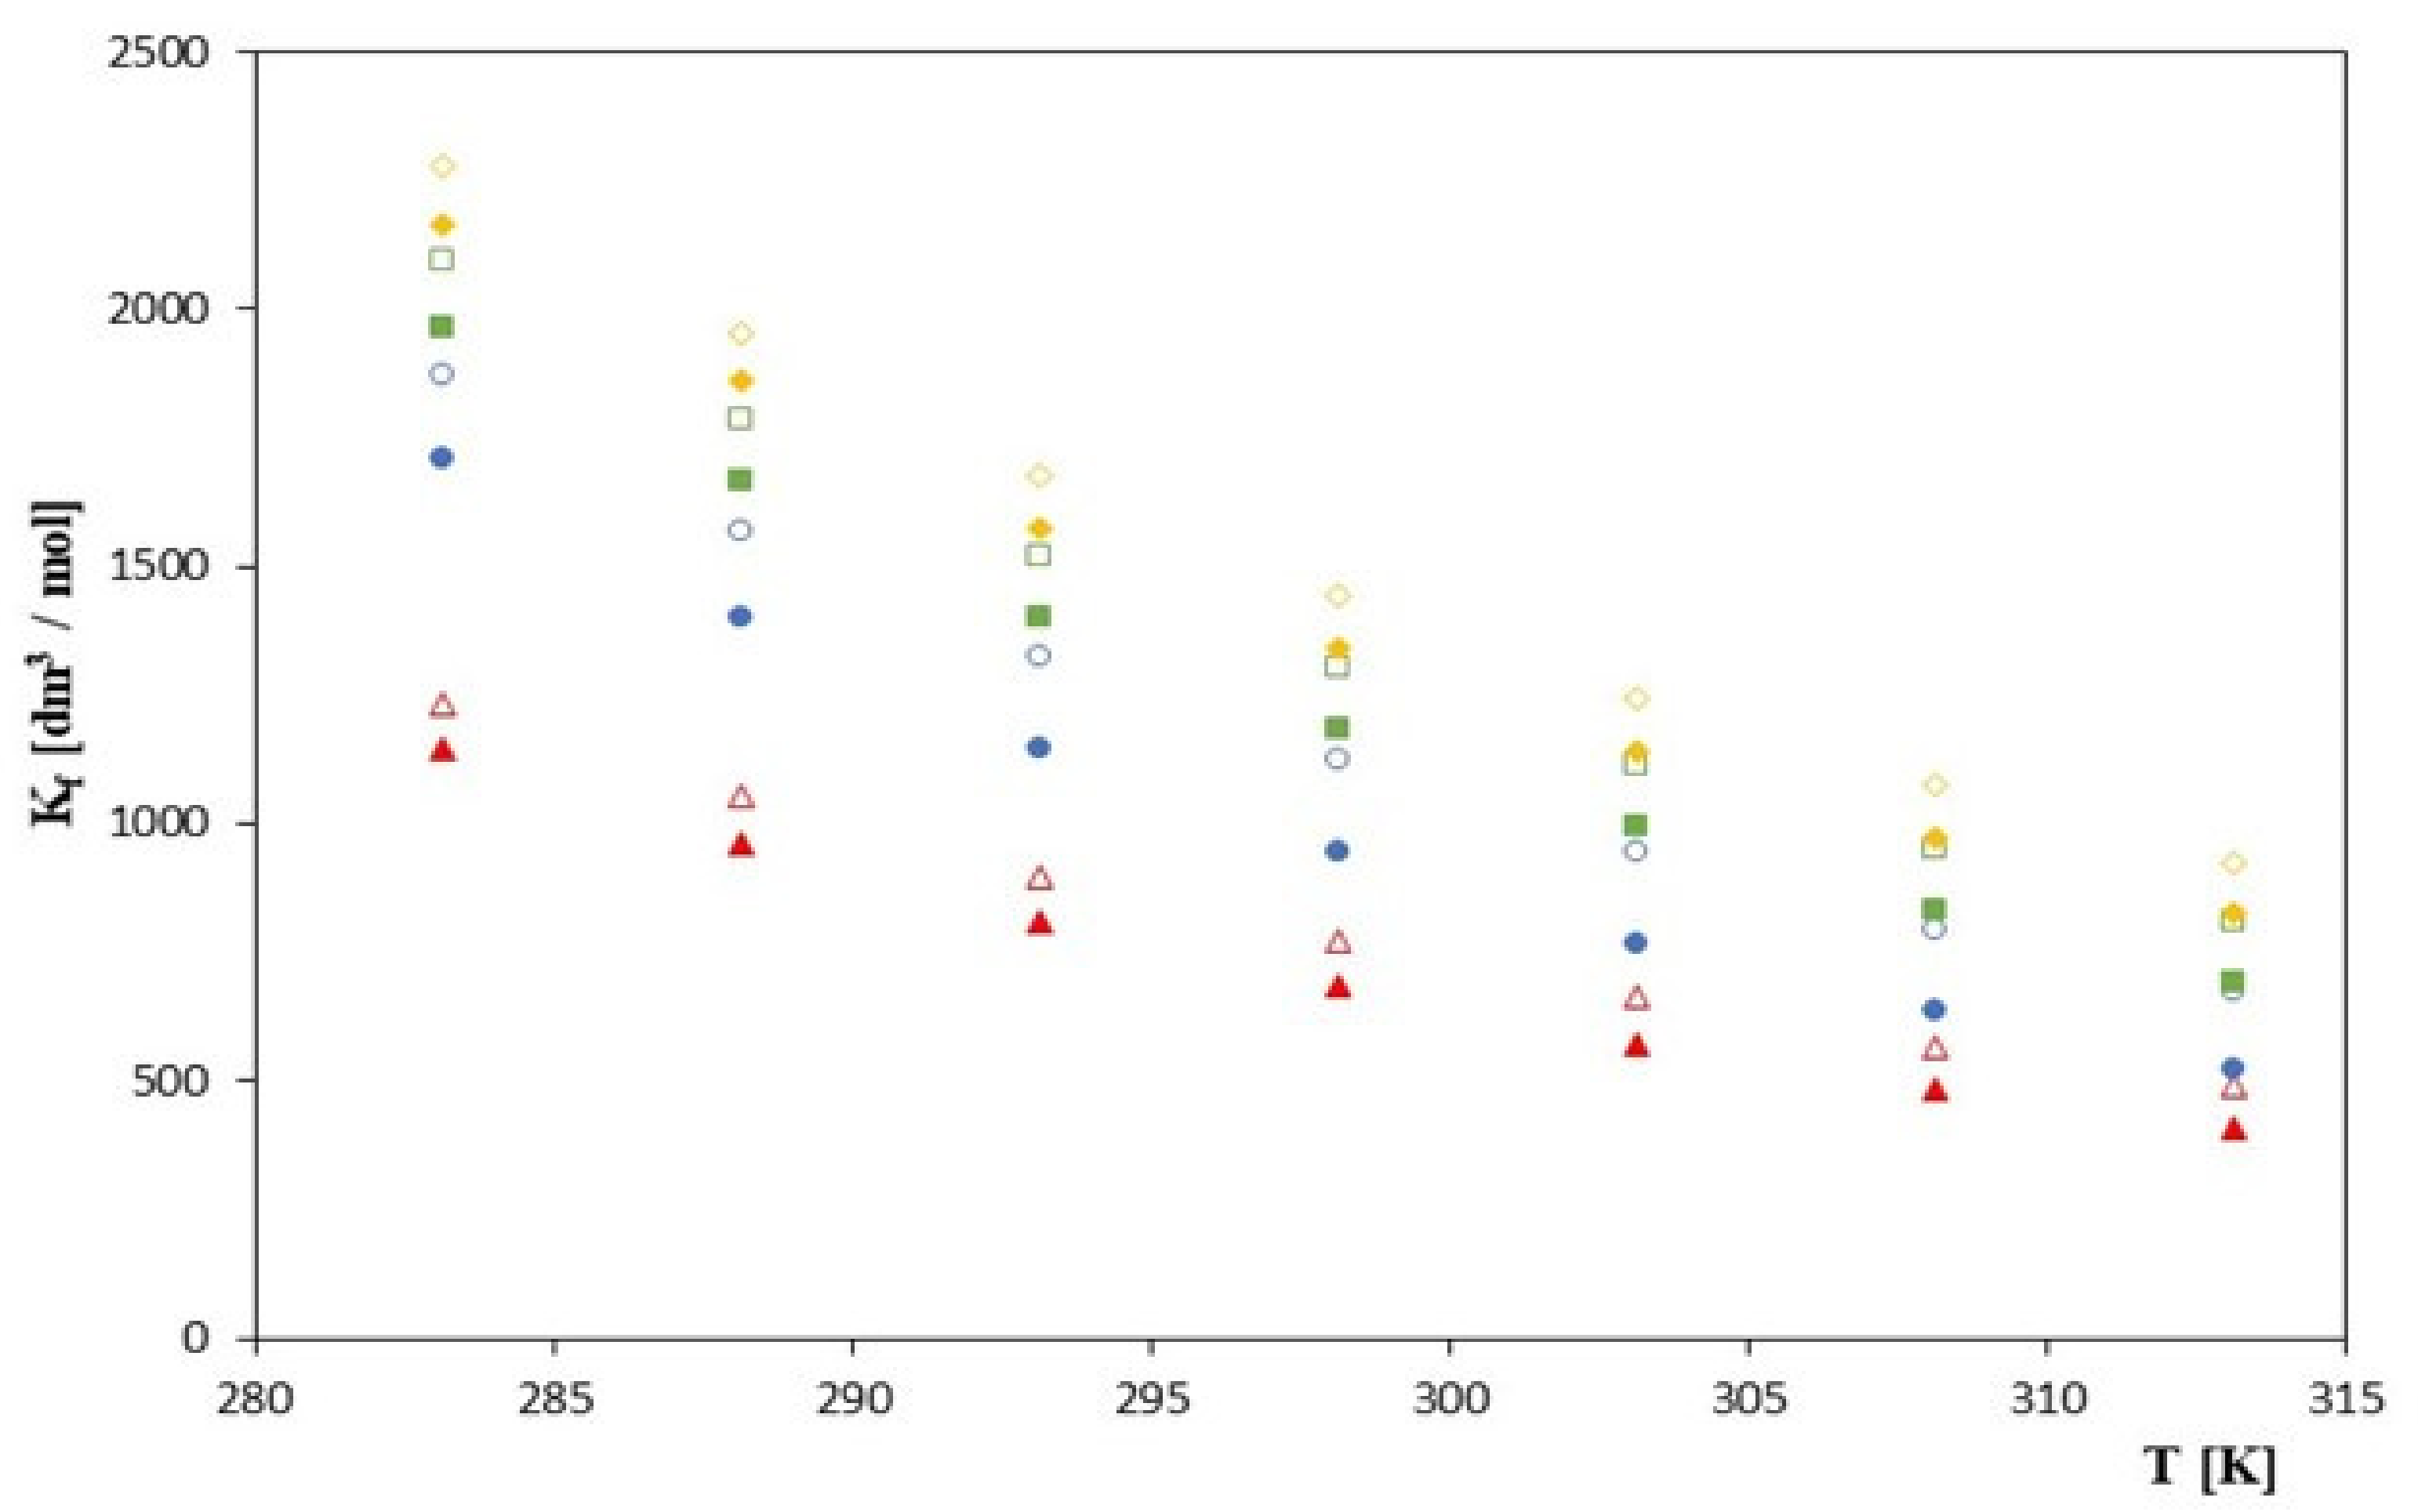
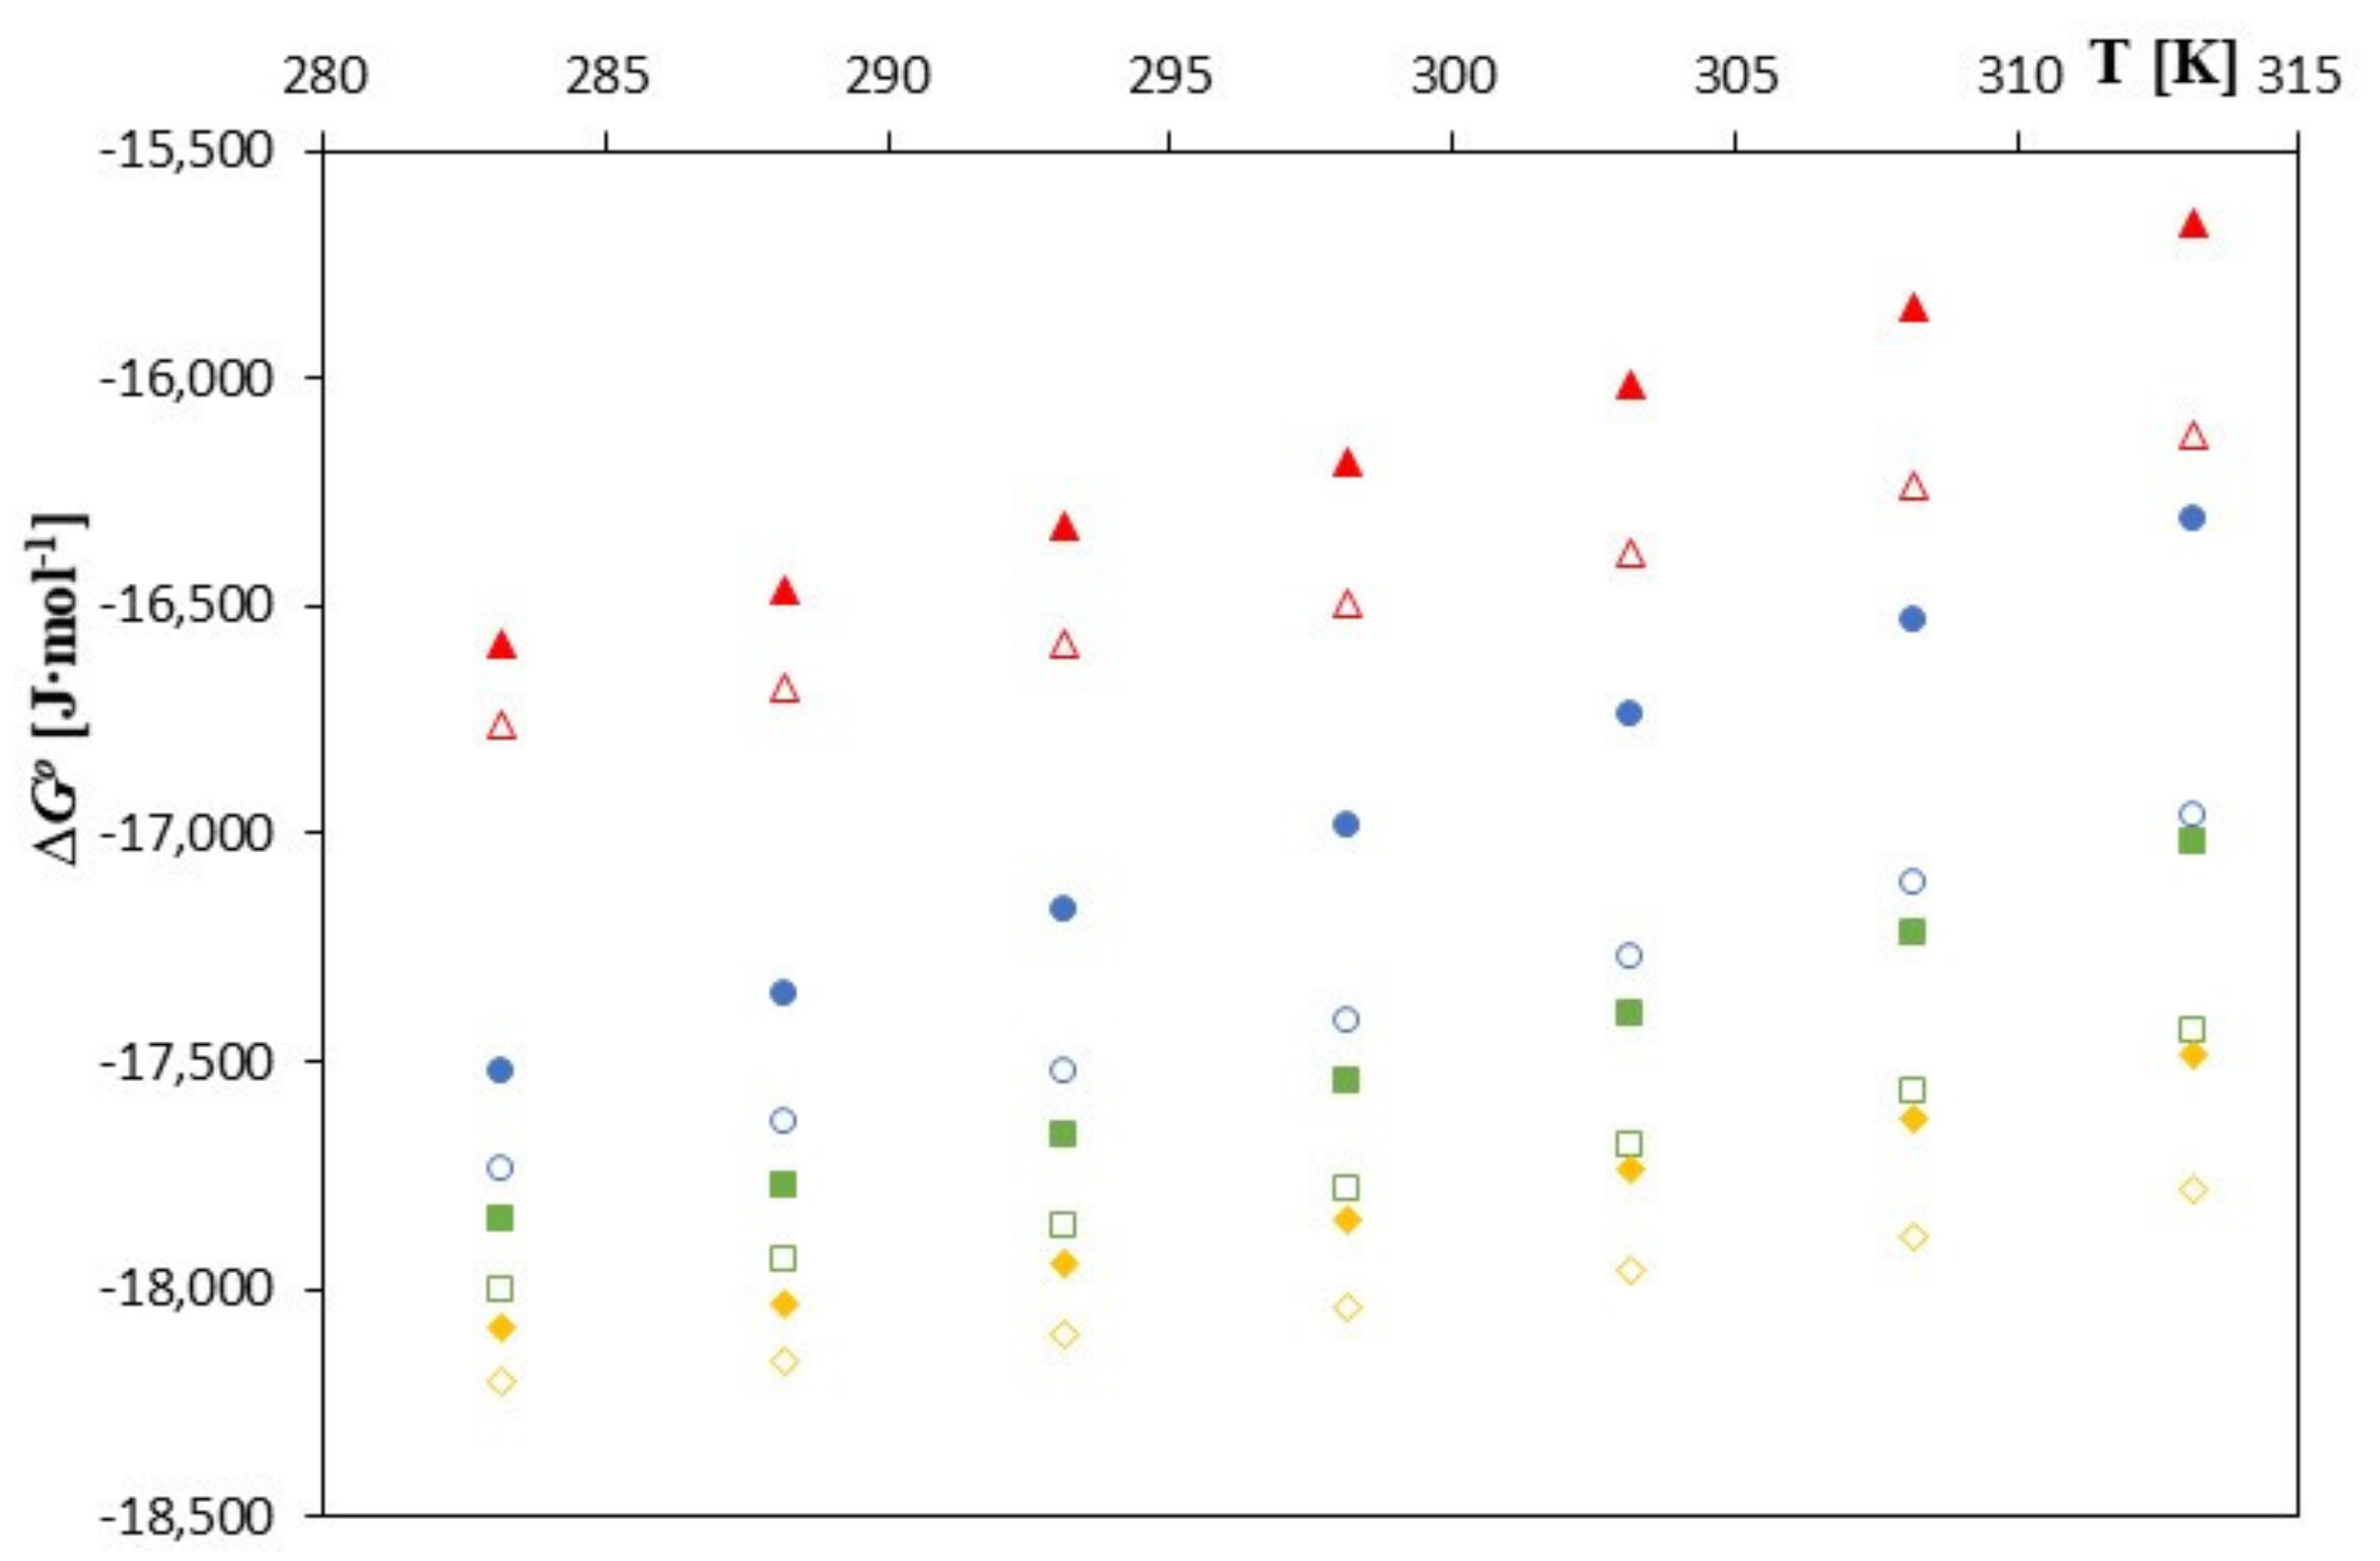
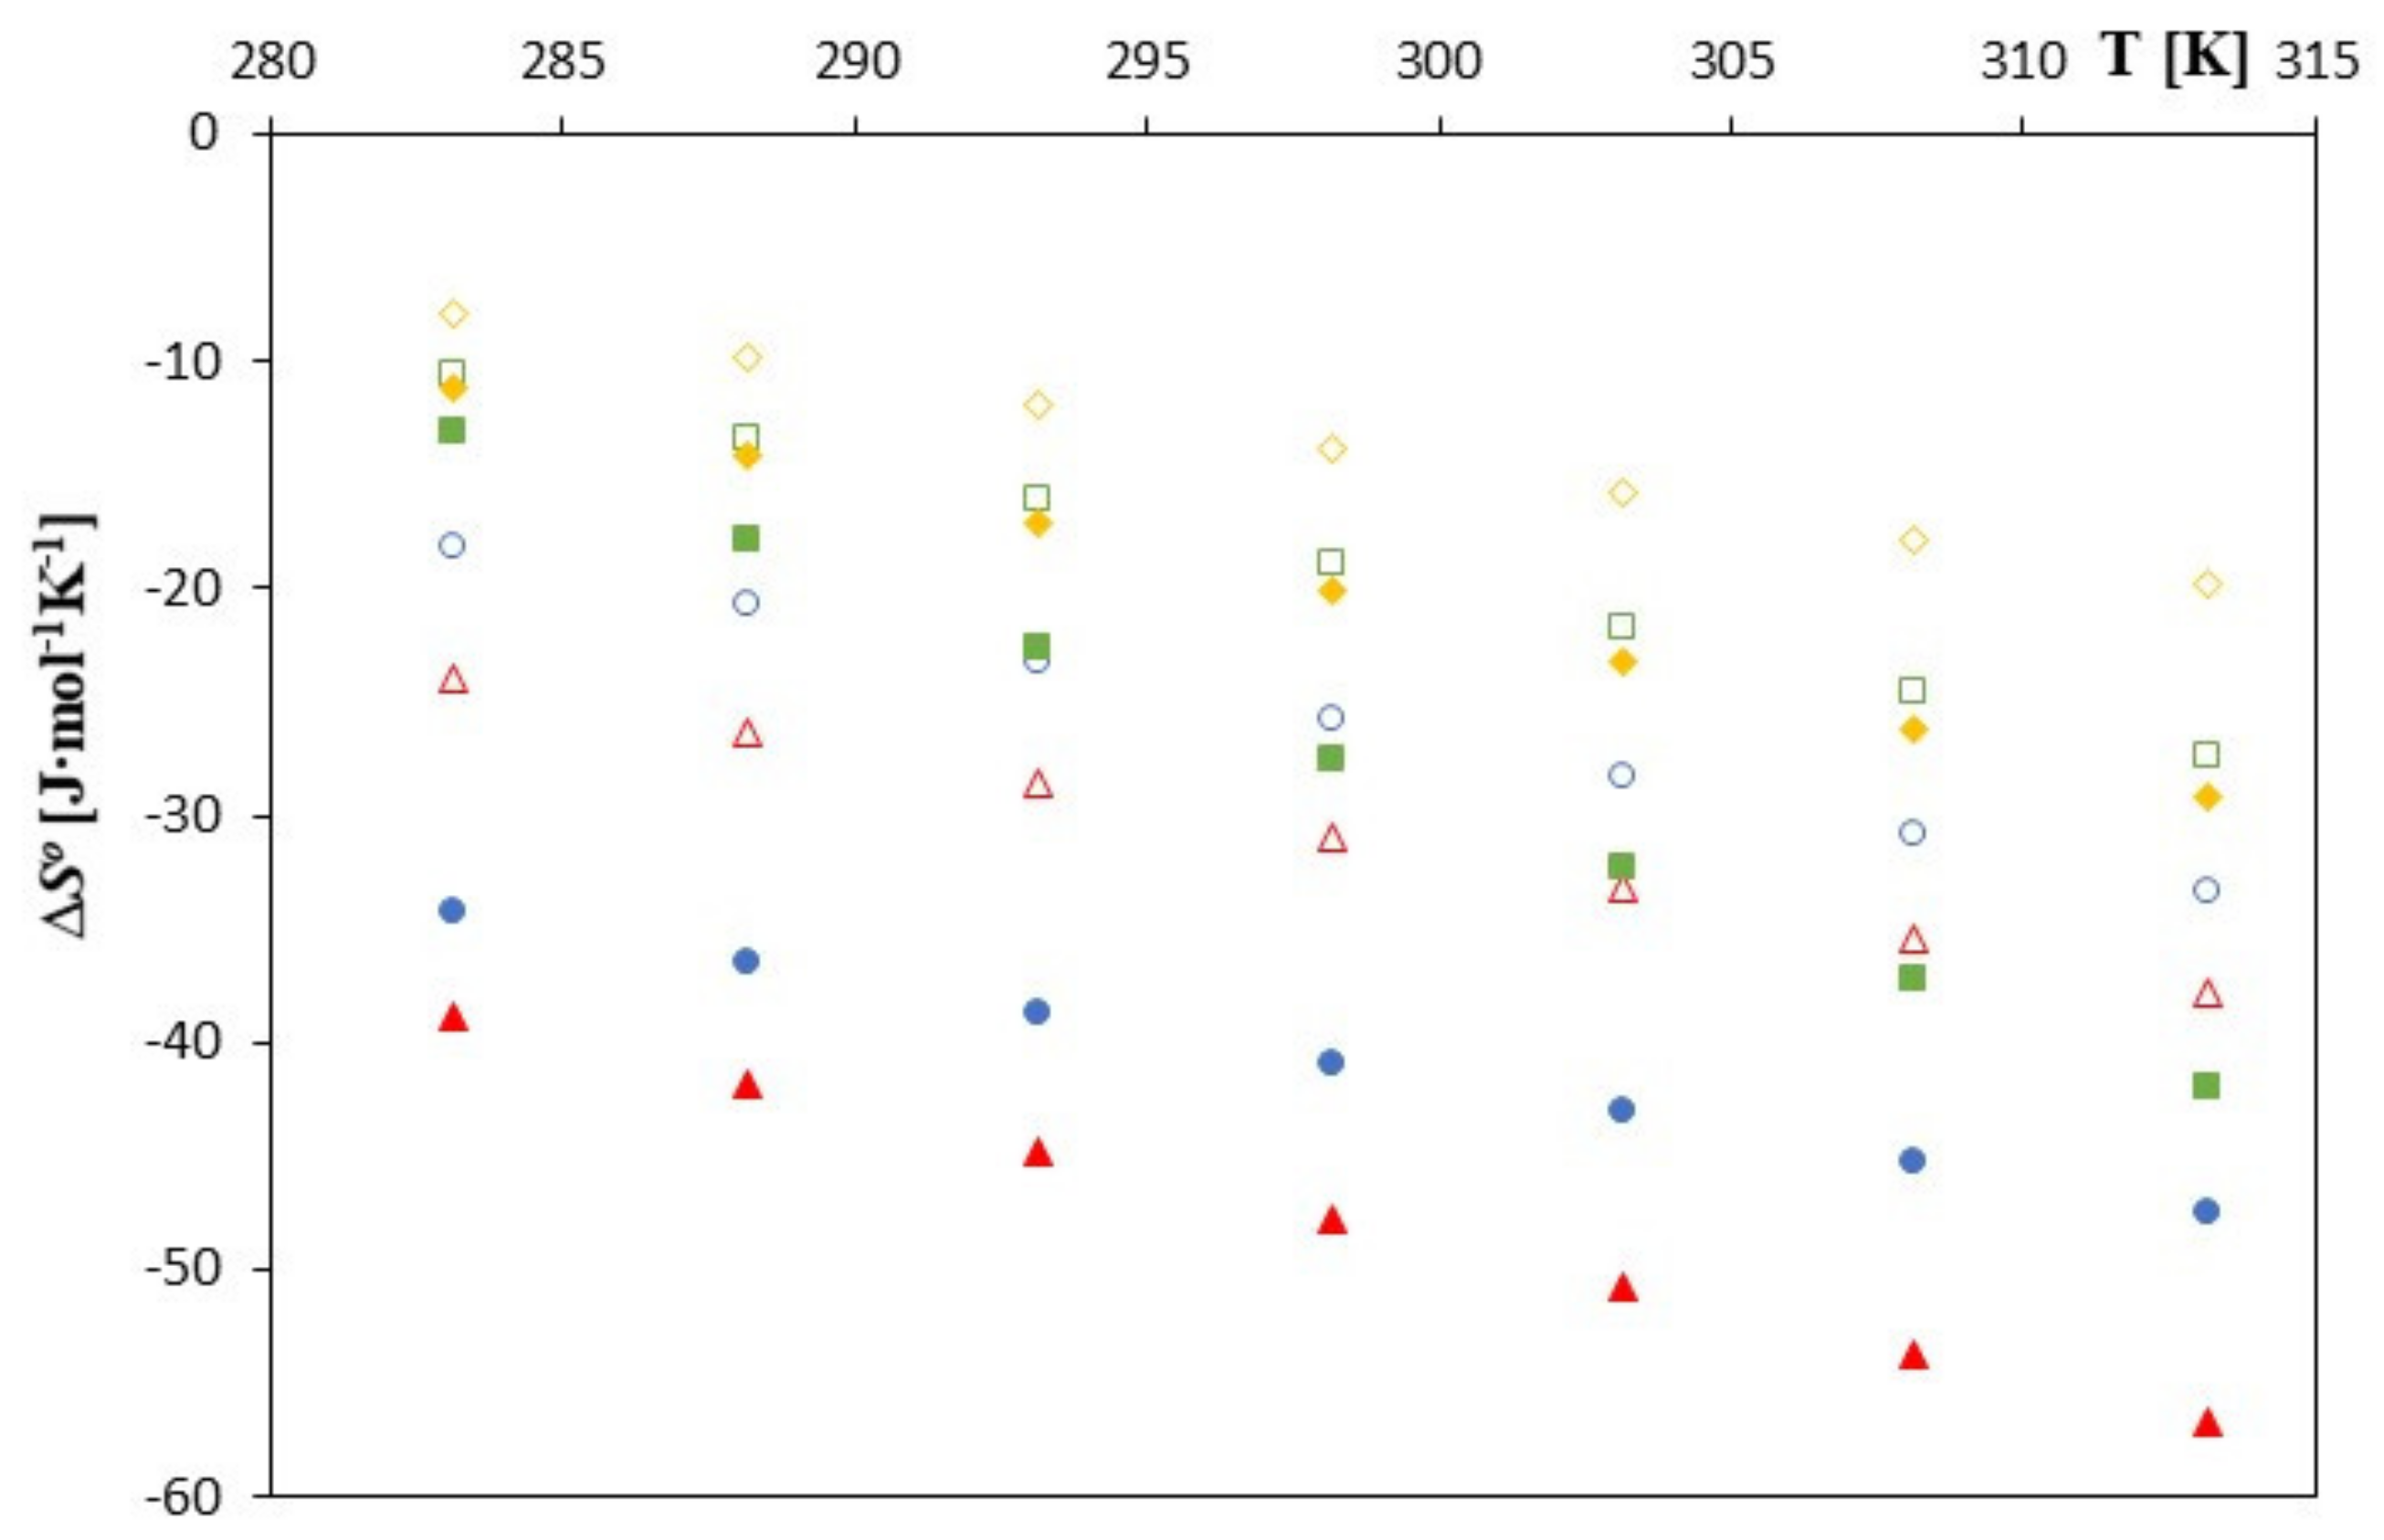
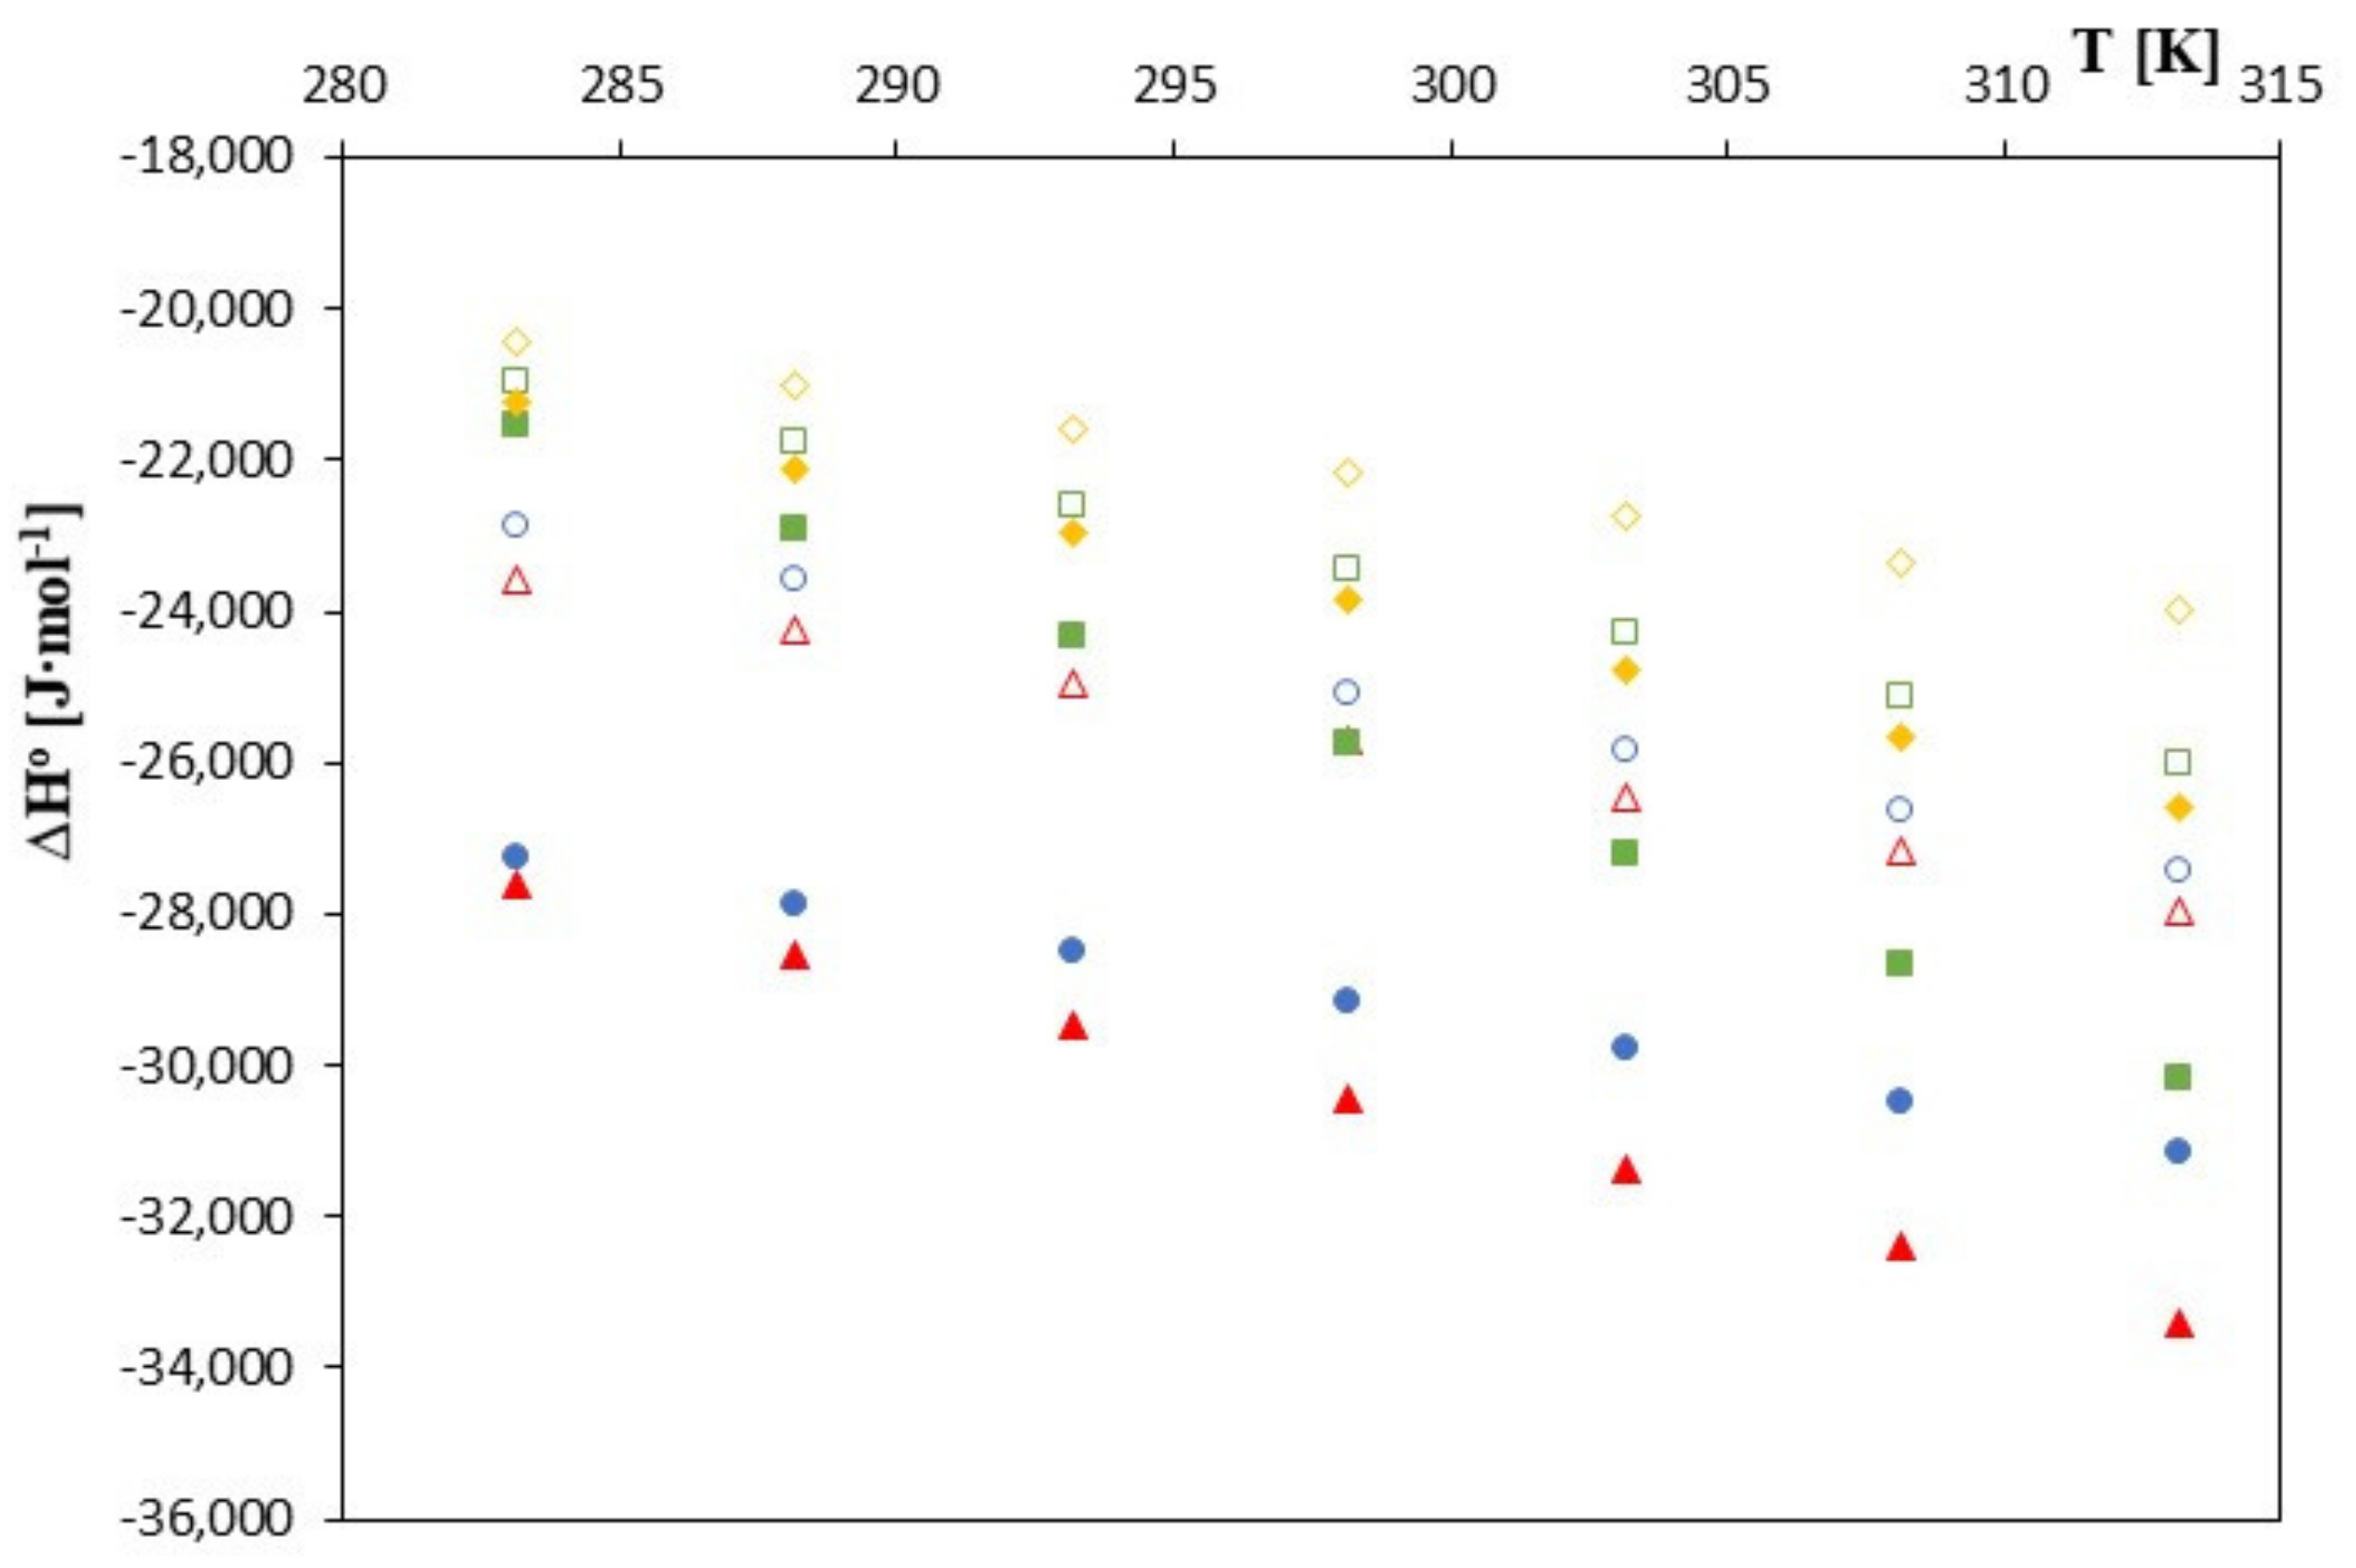
 -trans-cinnamic acid;
  -trans–p-coumaric acid;
  -trans-caffeic acid;
  -trans-ferulic acid and 2-HP-β-cyclodextrin with the studied salts.:
  -trans-cinnamic acid;
  -trans–p-coumaric acid;
  -trans-caffeic acid;
  -trans-ferulic acid.
-trans-cinnamic acid; -trans–p-coumaric acid; -trans-caffeic acid; -trans-ferulic acid and 2-HP-β-cyclodextrin with the studied salts.: -trans-cinnamic acid; -trans–p-coumaric acid; -trans-caffeic acid; -trans-ferulic acid.
-trans-ferulic acid.
-trans-cinnamic acid; -trans–p-coumaric acid; -trans-caffeic acid; -trans-ferulic acid and 2-HP-β-cyclodextrin with the studied salts.: -trans-cinnamic acid; -trans–p-coumaric acid; -trans-caffeic acid; -trans-ferulic acid.
 -trans-cinnamic acid;
  -trans–p-coumaric acid;
  -trans-caffeic acid;
  -trans-ferulic acid and 2-HP-β-cyclodextrin with the studied salts.:
  -trans-cinnamic acid;
  -trans –p-coumaric acid;
  -trans-caffeic acid;
  -trans-ferulic acid.
-trans-cinnamic acid; -trans–p-coumaric acid; -trans-caffeic acid; -trans-ferulic acid and 2-HP-β-cyclodextrin with the studied salts.: -trans-cinnamic acid; -trans –p-coumaric acid; -trans-caffeic acid; -trans-ferulic acid.
-trans-ferulic acid.
-trans-cinnamic acid; -trans–p-coumaric acid; -trans-caffeic acid; -trans-ferulic acid and 2-HP-β-cyclodextrin with the studied salts.: -trans-cinnamic acid; -trans –p-coumaric acid; -trans-caffeic acid; -trans-ferulic acid.
 -trans-cinnamic acid;
  -trans–p-coumaric acid;
  -trans-caffeic acid;
  -trans-ferulic acid and 2-HP-β-cyclodextrin with the studied salts.:
  -trans-cinnamic acid;
  -trans–p-coumaric acid;
  -trans-caffeic acid;
  -trans-ferulic acid.
-trans-cinnamic acid; -trans–p-coumaric acid; -trans-caffeic acid; -trans-ferulic acid and 2-HP-β-cyclodextrin with the studied salts.: -trans-cinnamic acid; -trans–p-coumaric acid; -trans-caffeic acid; -trans-ferulic acid.
-trans-ferulic acid.
-trans-cinnamic acid; -trans–p-coumaric acid; -trans-caffeic acid; -trans-ferulic acid and 2-HP-β-cyclodextrin with the studied salts.: -trans-cinnamic acid; -trans–p-coumaric acid; -trans-caffeic acid; -trans-ferulic acid.

| β-Cyclodextrin | 2-HP-β-Cyclodextrin | |||||||
|---|---|---|---|---|---|---|---|---|
| T [K] | Kf [dm3/mol] | lnKf [dm3/mol] | ΛCDNaDod [S∙cm2/mol−1] | σ(Λ) | Kf [dm3/mol] | lnKf [dm3/mol] | ΛCDNaDod [S∙cm2/mol−1] | σ(Λ) |
| 283.15 | 1235 ± 8 | 7.1188 | 47.56 ± 0.02 | 0.01 | 1145 ± 8 | 7.0432 | 44.75 ± 0.01 | 0.01 |
| 288.15 | 1055 ± 4 | 6.9613 | 57.55 ± 0.01 | 0.01 | 965 ± 6 | 6.8721 | 56.23 ± 0.01 | 0.02 |
| 293.15 | 900 ± 2 | 6.8024 | 68.52 ± 0.01 | 0.02 | 810 ± 4 | 6.6970 | 66.32 ± 0.02 | 0.02 |
| 298.15 | 775 ± 2 | 6.6529 | 83.235 ± 0.02 | 0.02 | 685 ± 3 | 6.5294 | 80.75 ± 0.01 | 0.01 |
| 303.15 | 665 ± 3 | 6.4998 | 93.62 ± 0.01 | 0.01 | 575 ± 3 | 6.3544 | 90.45 ± 0.01 | 0.01 |
| 308.15 | 565 ± 2 | 6.3368 | 105.24 ± 0.01 | 0.01 | 485 ± 2 | 6.1841 | 103.23 ± 0.01 | 0.01 |
| 313.15 | 489 ± 0.9 | 6.1924 | 117.32 ± 0.01 | 0.01 | 409 ± 1 | 6.0137 | 113.15 ± 0.01 | 0.02 |
| β-Cyclodextrin | 2-HP-β-Cyclodextrin | |||||||
|---|---|---|---|---|---|---|---|---|
| T [K] | Kf [dm3/mol] | lnKf [dm3/mol] | ΛCDNaDod [S∙cm2/mol−1] | σ(Λ) | Kf [dm3/mol] | lnKf [dm3/mol] | ΛCDNaDod [S∙cm2/mol−1] | σ(Λ) |
| 283.15 | 1870 ± 7 | 7.5337 | 41.24 ± 0.01 | 0.01 | 1710 ± 6 | 7.4442 | 40.11 ± 0.01 | 0.02 |
| 288.15 | 1570 ± 4 | 7.3588 | 51.73 ± 0.01 | 0.01 | 1400 ± 5 | 7.2442 | 49.52 ± 0.02 | 0.02 |
| 293.15 | 1324 ± 3 | 7.1884 | 58.23 ± 0.02 | 0.02 | 1144 ± 4 | 7.0423 | 56.85 ± 0.01 | 0.02 |
| 298.15 | 1124 ± 3 | 7.0246 | 66.56 ± 0.01 | 0.02 | 944 ± 2 | 6.8501 | 64.78 ± 0.02 | 0.01 |
| 303.15 | 945 ± 2 | 6.8512 | 73.87 ± 0.02 | 0.01 | 765 ± 1 | 6.6399 | 72.54 ± 0.01 | 0.01 |
| 308.15 | 795 ± 1 | 6.6783 | 81.56 ± 0.01 | 0.01 | 635 ± 0.9 | 6.4536 | 80.12 ± 0.01 | 0.01 |
| 313.15 | 675 ± 0.8 | 6.5147 | 87.52 ±0.01 | 0.02 | 525 ± 0.9 | 6.2634 | 86.65 ± 0.02 | 0.02 |
| β-Cyclodextrin | 2-HP-β-Cyclodextrin | |||||||
|---|---|---|---|---|---|---|---|---|
| T [K] | Kf [dm3/mol] | lnKf [dm3/mol] | ΛCDNaDod [S∙cm2/mol−1] | σ(Λ) | Kf [dm3/mol] | lnKf [dm3/mol] | ΛCDNaDod [S∙cm2/mol−1] | σ(Λ) |
| 283.15 | 2092 ± 6 | 7.6459 | 35.12 ± 0.01 | 0.01 | 1962 ± 6 | 7.5817 | 38.05 ± 0.01 | 0.01 |
| 288.15 | 1785 ± 4 | 7.4872 | 45.55 ± 0.01 | 0.01 | 1665 ± 5 | 7.4176 | 43.89 ± 0.01 | 0.02 |
| 293.15 | 1522 ± 4 | 7.3278 | 51.42 ± 0.02 | 0.02 | 1402 ± 3 | 7.2457 | 49.52 ± 0.01 | 0.02 |
| 298.15 | 1305 ± 2 | 7.1740 | 58.74 ± 0.01 | 0.02 | 1185 ± 2 | 7.0775 | 56.32 ± 0.02 | 0.01 |
| 303.15 | 1115 ± 1 | 7.0166 | 65.32 ± 0.01 | 0.01 | 995 ± 1 | 6.9027 | 63.12 ± 0.02 | 0.01 |
| 308.15 | 950 ± 0.9 | 6.8565 | 74.59 ± 0.01 | 0.01 | 830 ± 1 | 6.7214 | 72.56 ± 0.01 | 0.01 |
| 313.15 | 810 ± 0.8 | 6.6970 | 80.45 ± 0.01 | 0.01 | 690 ± 0.9 | 6.5367 | 78.15 ± 0.01 | 0.01 |
| β-Cyclodextrin | 2-HP-β-Cyclodextrin | |||||||
|---|---|---|---|---|---|---|---|---|
| T [K] | Kf [dm3/mol] | lnKf [dm3/mol] | ΛCDNaDod [S∙cm2/mol−1] | σ(Λ) | Kf [dm3/mol] | lnKf [dm3/mol] | ΛCDNaDod [S∙cm2/mol−1] | σ(Λ) |
| 283.15 | 2280 ± 7 | 7.7319 | 37.28 ± 0.01 | 0.02 | 2165 ± 5 | 7.6802 | 36.11 ± 0.01 | 0.02 |
| 288.15 | 1955 ± 6 | 7.5781 | 42.31 ± 0.01 | 0.01 | 1860 ± 5 | 7.5283 | 41.10 ± 0.01 | 0.02 |
| 293.15 | 1680 ± 5 | 7.4265 | 49.47 ± 0.02 | 0.02 | 1575 ± 4 | 7.3620 | 48.11 ± 0.01 | 0.02 |
| 298.15 | 1446 ± 3 | 7.2766 | 54.95 ± 0.01 | 0.02 | 1341 ± 4 | 7.2012 | 53.05 ± 0.01 | 0.01 |
| 303.15 | 1244 ± 2 | 7.1261 | 61.73 ± 0.02 | 0.01 | 1139 ± 3 | 7.0379 | 60.1 ± 0.01 | 0.01 |
| 308.15 | 1076 ± 2 | 6.9810 | 68.41 ± 0.01 | 0.01 | 971 ± 2 | 6.8783 | 67.14 ± 0.01 | 0.01 |
| 313.15 | 925 ± 1 | 6.8298 | 75.95 ± 0.01 | 0.02 | 825 ± 1 | 6.7154 | 73.12 ± 0.02 | 0.01 |
| β-Cyclodextrin | 2-HP-β-Cyclodextrin | |||||
|---|---|---|---|---|---|---|
| T [K] | ∆G0 [J∙mol−1] | ∆S0 [J∙mol−1] | ∆H0 [J∙mol−1] | ∆G0 [J∙mol−1] | ∆S0 [J∙mol−1‧K−1] | ∆H0 [J∙mol−1] |
| 283.15 | −16,758 | −24.036 | −23,565 | −16,580 | −38.888 | −27,592 |
| 288.15 | −16,677 | −26.319 | −24,261 | −16,463 | −41.844 | −28,521 |
| 293.15 | −16,579 | −28.602 | −24,964 | −16,322 | −44.800 | −29,456 |
| 298.15 | −16,491 | −30.885 | −25,700 | −16,185 | −47.756 | −30,424 |
| 303.15 | −16,382 | −33.168 | −26,437 | −16,016 | −50.712 | −31,389 |
| 308.15 | −16,235 | −35.451 | −27,159 | −15,844 | −53.668 | −32,382 |
| 313.15 | −16,122 | −37.734 | −27,939 | −15,657 | −56.624 | −33,389 |
| β-Cyclodextrin | 2-HP-β-Cyclodextrin | |||||
|---|---|---|---|---|---|---|
| T [K] | ∆G0 [J∙mol−1] | ∆S0 [J∙mol−1] | ∆H0 [J∙mol−1] | ∆G0 [J∙mol−1] | ∆S0 [J∙mol−1‧K−1] | ∆H0 [J∙mol−1] |
| 283.15 | −17,735 | −18.180 | −22,883 | −17,525 | −34.296 | −27,235 |
| 288.15 | −17,629 | −20.714 | −23,598 | −17,355 | −36.486 | −27,868 |
| 293.15 | −17,520 | −23.248 | −24,335 | −17,164 | −38.676 | −28,502 |
| 298.15 | −17,413 | −25.782 | −25,100 | −16,980 | −40.866 | −29,164 |
| 303.15 | −17,268 | −28.316 | −25,852 | −16,735 | −43.056 | −29,787 |
| 308.15 | −17,110 | −30.850 | −26,616 | −16,534 | −45.246 | −30,476 |
| 313.15 | −16,961 | −33.384 | −27,416 | −16,307 | −47.436 | −31,161 |
| β-Cyclodextrin | 2-HP-β-Cyclodextrin | |||||
|---|---|---|---|---|---|---|
| T [K] | ∆G0 [J∙mol−1] | ∆S0 [J∙mol−1] | ∆H0 [J∙mol−1] | ∆G0 [J∙mol−1] | ∆S0 [J∙mol−1‧K−1] | ∆H0 [J∙mol−1] |
| 283.15 | −17,999 | −10.534 | −20,982 | −17,848 | −13.040 | −21,540 |
| 288.15 | −17,937 | −13.343 | −21,782 | −17,770 | −17.865 | −22,918 |
| 293.15 | −17,860 | −16.152 | −22,594 | −17,660 | −22.690 | −24,311 |
| 298.15 | −17,783 | −18.961 | −23,436 | −17,544 | −27.515 | −25,747 |
| 303.15 | −17,685 | −21.770 | −24,284 | −17,398 | −32.340 | −27,201 |
| 308.15 | −17,566 | −24.579 | −25,140 | −17,220 | −37.165 | −28,672 |
| 313.15 | −17,436 | −27.388 | −26,012 | −17,018 | −41.990 | −30,168 |
| β-Cyclodextrin | 2-HP-β-Cyclodextrin | |||||
|---|---|---|---|---|---|---|
| T [K] | ∆G0 [J∙mol−1] | ∆S0 [J∙mol−1] | ∆H0 [J∙mol−1] | ∆G0 [J∙mol−1] | ∆S0 [J∙mol−1‧K−1] | ∆H0 [J∙mol−1] |
| 283.15 | −18,202 | −7.9240 | −20,445 | −18,080 | −11.204 | −21,252 |
| 288.15 | −18,155 | −9.8990 | −21,007 | −18,035 | −14.191 | −22,125 |
| 293.15 | −18,101 | −11.874 | −21,581 | −17,943 | −17.178 | −22,979 |
| 298.15 | −18,037 | −13.849 | −22,166 | −17,850 | −20.165 | −23,863 |
| 303.15 | −17,960 | −15.824 | −22,758 | −17,738. | −23.152 | −24,757 |
| 308.15 | −17,885 | −17.799 | −23,370 | −17,622 | −26.139 | −25,677 |
| 313.15 | −17,782 | −19.774 | −23,974 | −17,484 | −29.126 | −26,604 |
| Chemical Name | Chemical Formula | Chemical Formula | Source | CAS No | Mass Fraction Purity |
|---|---|---|---|---|---|
| Trans-ferulic acid | C10H10O4 |  | TCI * | 537-98-4 | ≥0.998 |
| Trans-caffeic acid | C9H8O4 |  | TCI * | 331-39-5 | ≥0.998 |
| Trans –p-coumaric acid | C9H8O3 |  | TCI * | 501-98-4 | ≥0.998 |
| Trans-cinnamic acid | C9H8O2 |  | TCI * | 140-10-3 | ≥0.998 |
| β -cyclodextrin | C42H70O35 |  | TCI * | 7585-39-9 | ≥0.998 |
| 2-HP-β-cyclodextrin Sodium hydroxide micropills | C66H112O42 NaOH |  | TCI * Avantor | 128446-35-5 1310-73-2 | ≥0.998 ≥0.998 |
Disclaimer/Publisher’s Note: The statements, opinions and data contained in all publications are solely those of the individual author(s) and contributor(s) and not of MDPI and/or the editor(s). MDPI and/or the editor(s) disclaim responsibility for any injury to people or property resulting from any ideas, methods, instructions or products referred to in the content. |
© 2022 by the author. Licensee MDPI, Basel, Switzerland. This article is an open access article distributed under the terms and conditions of the Creative Commons Attribution (CC BY) license (https://creativecommons.org/licenses/by/4.0/).
Share and Cite
Kinart, Z. Conductometric Studies of Formation the Inclusion Complexes of Phenolic Acids with β-Cyclodextrin and 2-HP-β-Cyclodextrin in Aqueous Solutions. Molecules 2023, 28, 292. https://doi.org/10.3390/molecules28010292
Kinart Z. Conductometric Studies of Formation the Inclusion Complexes of Phenolic Acids with β-Cyclodextrin and 2-HP-β-Cyclodextrin in Aqueous Solutions. Molecules. 2023; 28(1):292. https://doi.org/10.3390/molecules28010292
Chicago/Turabian StyleKinart, Zdzisław. 2023. "Conductometric Studies of Formation the Inclusion Complexes of Phenolic Acids with β-Cyclodextrin and 2-HP-β-Cyclodextrin in Aqueous Solutions" Molecules 28, no. 1: 292. https://doi.org/10.3390/molecules28010292