Article

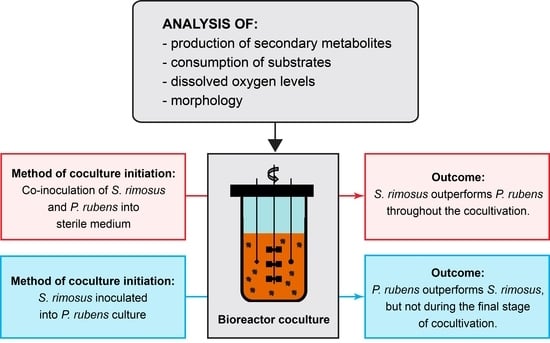
Effects of the Coculture Initiation Method on the Production of Secondary Metabolites in Bioreactor Cocultures of Penicillium rubens and Streptomyces rimosus

Department of Bioprocess Engineering, Faculty of Process and Environmental Engineering, Lodz University of Technology, ul. Wolczanska 213, 93-005 Lodz, Poland
*
Author to whom correspondence should be addressed.
Molecules 2023, 28(16), 6044; https://doi.org/10.3390/molecules28166044
Submission received: 7 June 2023 / Revised: 1 August 2023 / Accepted: 10 August 2023 / Published: 13 August 2023
(This article belongs to the Special Issue Natural Secondary Metabolites III)

Abstract

:
Bioreactor cocultures involving Penicillium rubens and Streptomyces rimosus were investigated with regard to secondary metabolite production, morphological development, dissolved oxygen levels, and carbon substrate utilization. The production profiles of 22 secondary metabolites were analyzed, including penicillin G and oxytetracycline. Three inoculation approaches were tested, i.e., the simultaneous inoculation of P. rubens with S. rimosus and the inoculation of S. rimosus delayed by 24 or 48 h relative to P. rubens. The delayed inoculation of S. rimosus into the P. rubens culture did not prevent the actinomycete from proliferating and displaying its biosynthetic repertoire. Although a period of prolonged adaptation was needed, S. rimosus exhibited growth and the production of secondary metabolites regardless of the chosen delay period (24 or 48 h). This promising method of coculture initiation resulted in increased levels of metabolites tentatively identified as rimocidin B, 2-methylthio-cis-zeatin, chrysogine, benzylpenicilloic acid, and preaustinoid D relative to the values recorded for the monocultures. This study demonstrates the usefulness of the delayed inoculation approach in uncovering the metabolic landscape of filamentous microorganisms and altering the levels of secondary metabolites.

Graphical Abstract

1. Introduction

Microorganisms are a rich source of chemical substances of great industrial importance, including pharmaceutically relevant metabolites and enzymes [1,2]. The common approach to producing these valuable molecules is to employ monocultures (axenic cultures) of the selected production strains. However, the conditions of monocultivation greatly differ from those normally observed in the natural environment, where interactions among microorganisms are inevitable. The metabolic characteristics of microorganisms evolve in the context of their surrounding communities [3]. Many microbial species establish symbiotic relationships with other organisms that support mutual development or provide protection against harmful factors [4,5]. Other species compete for nutrients or space, using secondary metabolites and other “chemical weapons” to inhibit the growth of their competitors. Notably, every microbial species has a repertoire of secondary metabolites that are important for survival, e.g., metal-transporting agents or protective pigments [6]. To date, knowledge regarding the induction of secondary metabolic pathways for industrial applications is still limited. Microorganisms can be stimulated to produce secondary metabolites by manipulating the growth conditions or media composition [7]. A novel strategy is to grow different microbial species together in a single vessel to promote either cooperative or competitive interactions. Such an approach, referred to as coculture, is an effective unconventional method that unlocks the biosynthetic potential of microorganisms [8,9]. The investigation of cocultures opens the door for the discovery of novel metabolic pathways, an improved understanding of the interactions between microorganisms, and the development of methods for the increased production of secondary metabolites. Most importantly, this approach allows for expanding the diversity of chemical compounds produced by microorganisms [10]. Cocultures may involve species of the same (e.g., bacterium vs. bacterium) or different (e.g., fungus vs. bacterium) kingdoms [11]. Depending on the goals, microbial cocultivation can be carried out on laboratory plates, in glass flasks, or by using large-scale stirred tank bioreactors. Fundamental experiments regarding the influence of cocultivation on fungal secondary metabolism were performed using Petri dishes [12], and today, the plate-based approach is still widely used for the investigation of microbial interactions. Regarding submerged conditions, flat-bottom flasks and Erlenmeyer flasks are among the most frequently used coculture vessels. One example of a flask-based cocultivation study is the investigation of the effects exerted by the bacterium Mycobacterium smegmatis on the fungus Aspergillus niger. An important observation made in the study concerned the enhancement of the cytotoxic activity of the cultivation broth extract on prostate cancer cells [13]. An example of bioreactor cocultivation was reported by Luti and Mavituna [14], who focused on the improvement of undecylprodigiosin production by Streptomyces coelicolor in response to E. coli.
Fungal and bacterial cocultivation has become a powerful tool to enhance microbial secondary metabolism. Penicillium rubens is one of the most common household molds and is known to proliferate vigorously under high-humidity conditions. It is also recognized for producing β-lactam antibiotics, especially penicillin G [15]. This microorganism served as a coculture partner of Aspergillus terreus in shake flask experiments performed by Boruta et al. [16,17]. It was observed that P. rubens showed a tendency to be outperformed by A. terreus unless given an advantage in the form of delayed inoculation or modified ratios of the preculture volume. However, to the best of our knowledge, P. rubens has never been studied in the context of stirred tank bioreactor cocultivation. In the present work, P. rubens was cocultivated with the actinomycete, S. rimosus, a filamentous bacterium that exhibits a broad spectrum of secondary metabolites. S. rimosus is mostly recognized for its ability to produce a widely used antibiotic known as oxytetracycline [18]. In the previous work of Boruta and Ścigaczewska [19], S. rimosus was confronted with several filamentous microorganisms in shake flask cultures. The pairing of S. rimosus and Streptomyces noursei resulted in enhanced oxytetracycline production. Moreover, the authors investigated the influence of the coculture initiation time on oxytetracycline formation. They delayed the introduction of S. rimosus into the growth medium relative to S. noursei inoculation, which resulted in the lack of S. rimosus domination and inhibited biosynthesis of its secondary metabolites. A similar approach was applied by Boruta et al. [20], where S. rimosus and A. terreus were cocultured in stirred tank bioreactors. Two out of nine experiments were carried out with shifted S. rimosus inoculation times, which led to drastic changes in terms of the cocultivation outcomes (i.e., the domination of S. rimosus over A. terreus was nonexistent in these two experiments). To date, the interactions between the actinomycete, S. rimosus, and the fungus, P. rubens, in bioreactor cocultures have not been addressed in the literature.
The aim of this work was to study the influence of the coculture initiation method on the secondary metabolism of Penicillium rubens ATCC 28089 and Streptomyces rimosus ATCC 10970. The experiments were performed in stirred tank bioreactors, where each coculture was investigated simultaneously with the corresponding monocultures of P. rubens and S. rimosus.

2. Results

2.1. Secondary Metabolic Repertoire in Mono- and Cocultures

The experiments led to the detection of a broad biosynthetic landscape of 22 secondary metabolites (Table 1).
The identities of oxytetracycline and penicillin G were confirmed with the use of analytical standards. The remaining metabolites were tentatively identified on the basis of mass spectrometry data. However, their identities were not confirmed due to a lack of standards. Hence, with the exception of oxytetracycline and penicillin G, the secondary metabolites discussed here should be regarded as “putative” or “tentatively identified”. Among the detected products, sixteen molecules were assigned to the metabolic spectrum of S. rimosus, whereas the remaining six were suggested to be the products of P. rubens. In addition to oxytetracycline, the group of S. rimosus metabolites encompassed the molecules previously identified in the “A. terreus vs. S. rimosus” cocultivation study [20], including the metabolites representing the rimocidin family, i.e., rimocidin, CE-108, and rimocidin (27-ethyl), the products of the milbemycin family, i.e., milbemycin A3, milbemycin A3 + [4O], and milbemycin β11 + [4O]. Furthermore, the analysis revealed the presence of rimosamide A, which was previously reported for S. rimosus [28]. To the best of our knowledge, the remaining metabolites identified here have not yet been detected in S. rimosus but have been found in members of the Streptomyces genus, including rimocidin B, turgichelin, spinoxazine A, lucensomycin, 7-demethyl-glucopiericidin A, and the metabolite referred to as the “unnamed angucycline metabolite previously isolated from Streptomyces sp. QL37” [31]. The exception was 2-methylthio-cis-zeatin, a metabolite not yet found in Streptomyces but identified in Actinomycetia, the class that includes the Streptomyces genus. As far as the products of P. rubens are concerned, the analysis revealed the presence of penicillin G, chrysogine, benzylpenicilloic acid, and metabolites that, to the best of our knowledge, were not previously found in P. rubens but have been identified in other fungi representing the Penicillium genus, namely, adenophostin B, cyclopiamide D, and preaustinoid D. For comparative purposes, the total ion chromatograms (TICs) illustrating the evolution of chemical profiles over the course of PRSR1, PRSR2, and PRSR3 cultivations were analyzed. In the PRSR1 run (Figures S4–S11), the TICs corresponding to the coculture and S. rimosus monoculture overlapped throughout the duration of the process. In the PRSR2 (Figures S12–S20) and PRSR3 (Figures S21–S30) experiments, the overlap of TICs was observed only in the initial phase of cocultivation. More specifically, the last time the TICs overlapped was at the moment of S. rimosus inoculation, i.e., at t = 24 h and t = 48 h in the PRSR2 and PRSR3 runs, respectively. In addition to the metabolites presented in Table 1, the traces of the product with m/z value of longicatenamycin B were also detected (with Δm/z = +0.0019 for the [M + H]+ ion) in the samples from the PRSR1 coculture and the PRSR1 monoculture of S. rimosus. This metabolite was recently characterized by Li et al. [40] as the metabolite of S. rimosus.

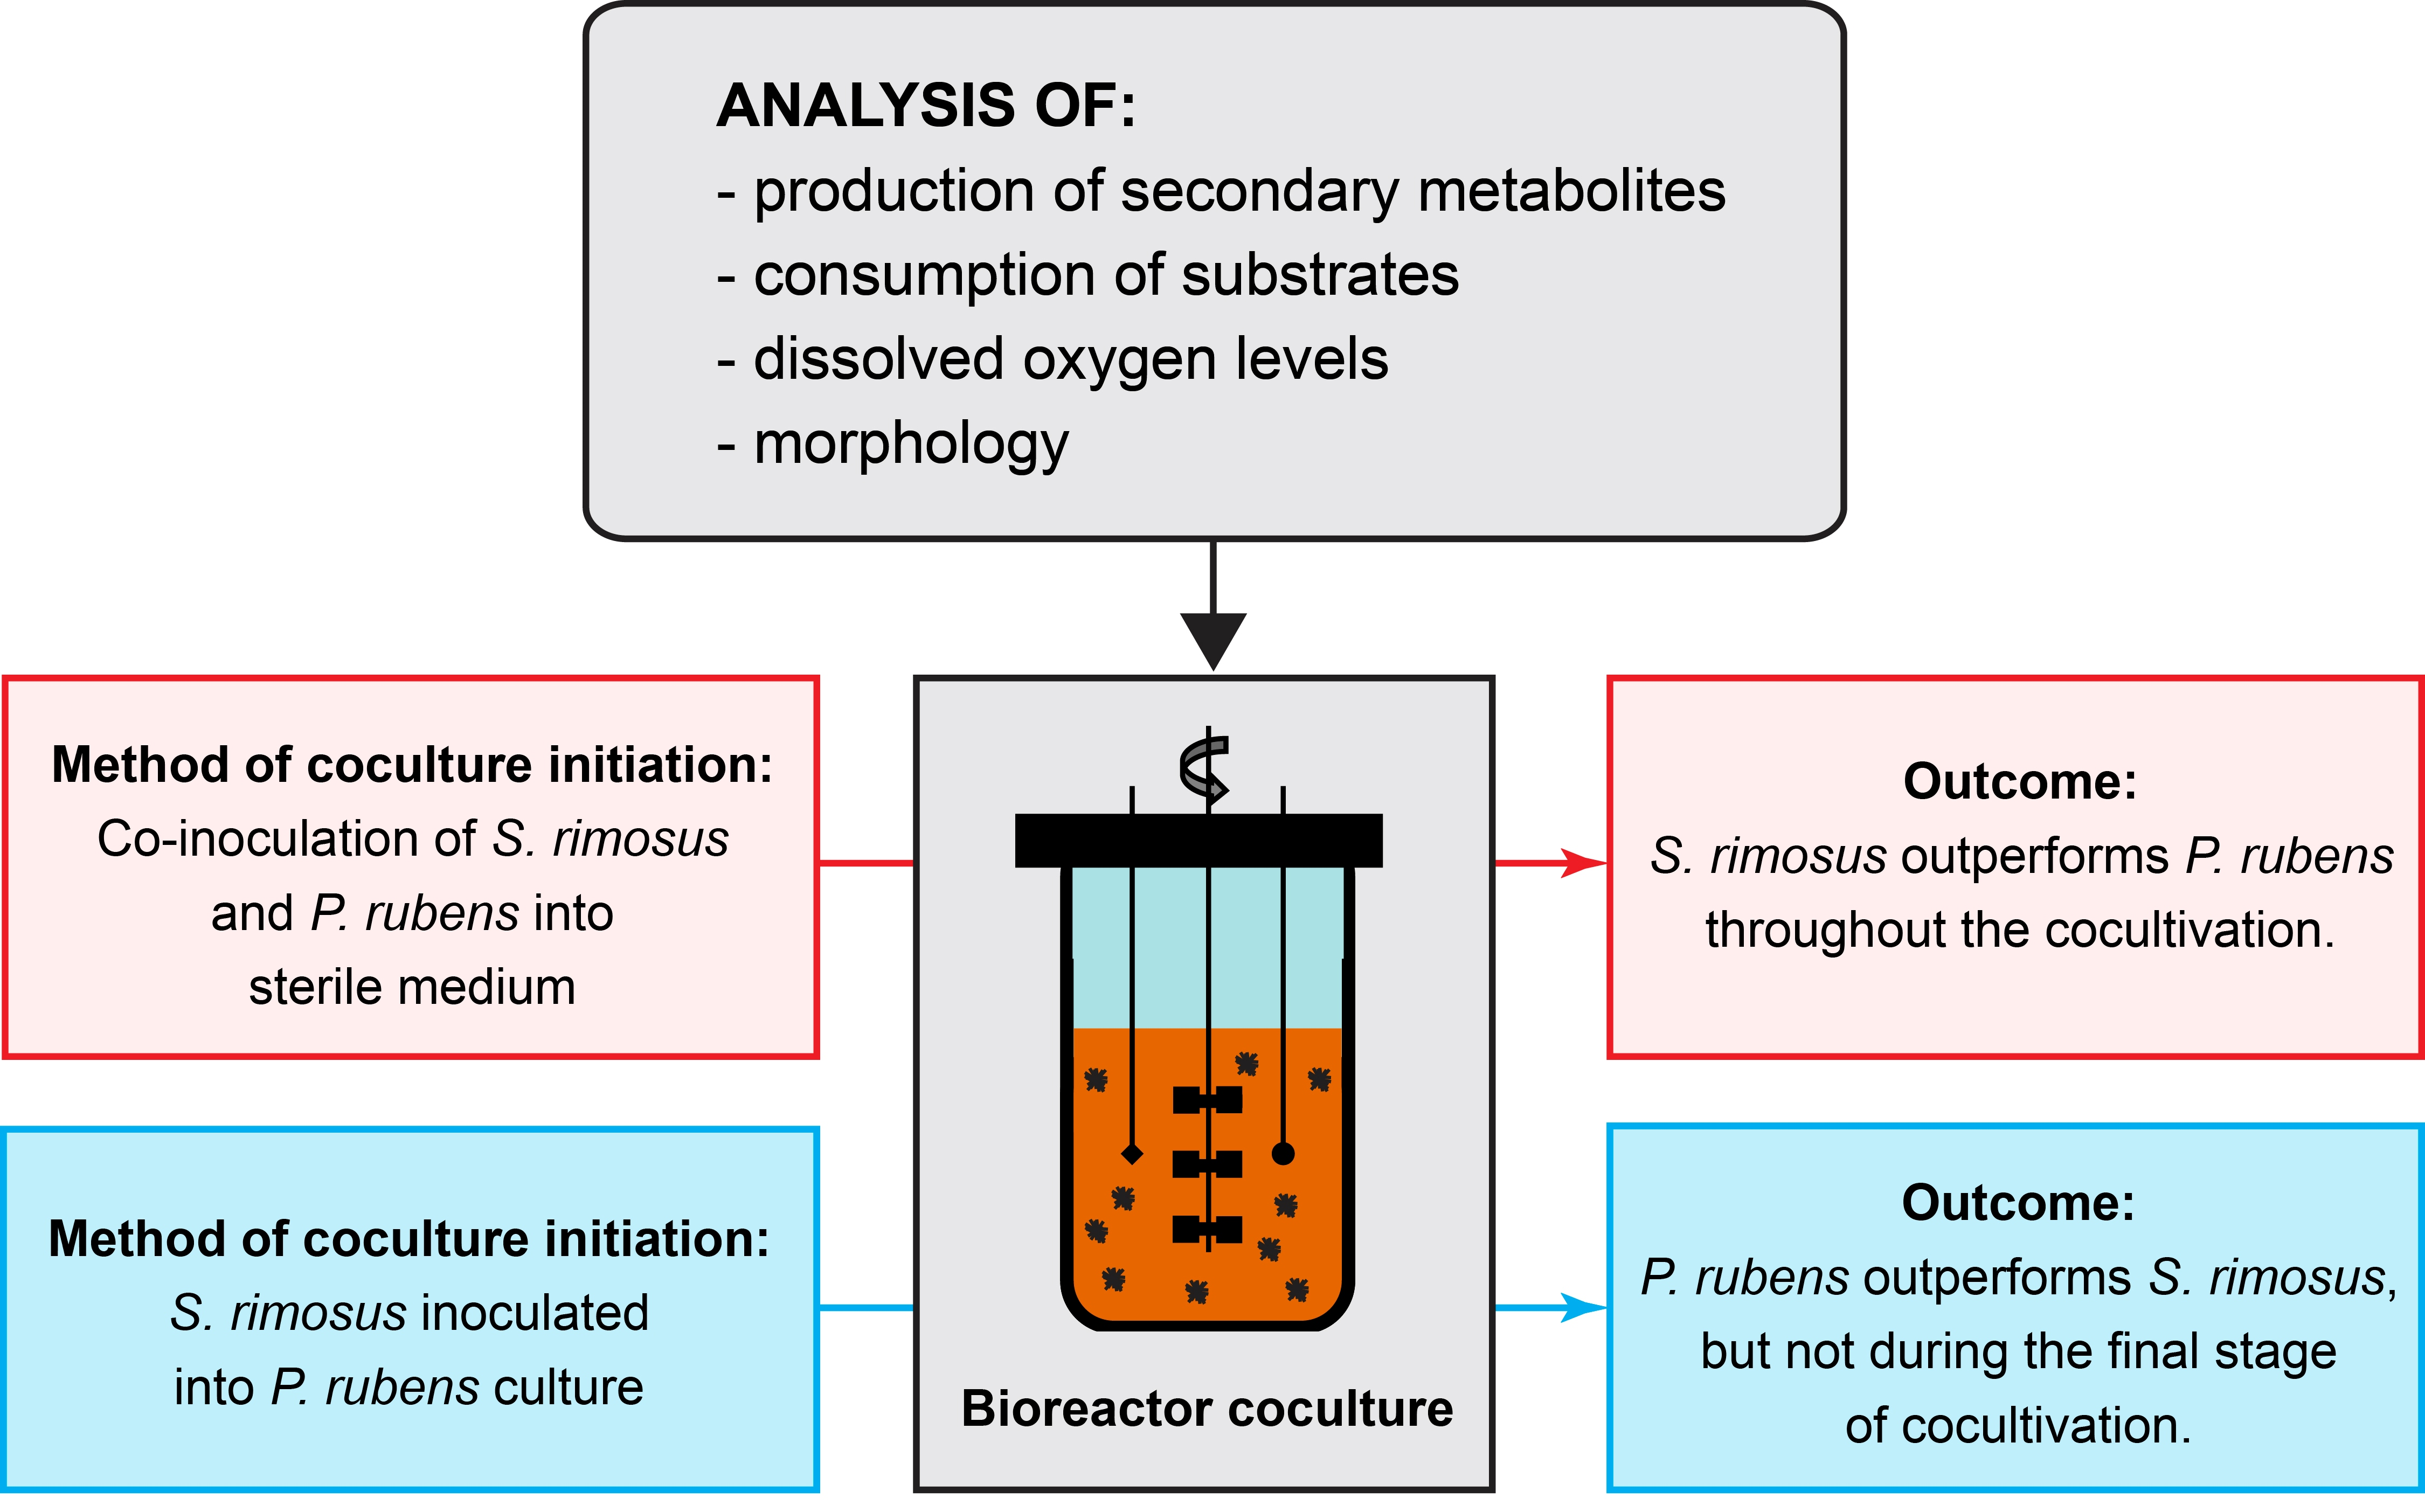
2.2. Production of Secondary Metabolites by S. rimosus

In the PRSR1 coculture, which was initiated with the simultaneous inoculation of S. rimosus and P. rubens, the production profiles of S. rimosus metabolites (Figure 1) in most cases closely resembled those recorded for the corresponding S. rimosus monocultures. For example, the PRSR1 curves representing the coculture and monoculture levels of rimocidin (Figure 1b), rimocidin B (Figure 1c), turgichelin (Figure 1e), and rimosamide A (Figure 1g) practically overlapped. However, there were two secondary metabolites for which the PRSR1 coculture levels exceeded those observed for the monoculture variant, namely, 2-acetyl-2-decarboxamido-oxytetracycline (Figure S37) and the “unnamed angucycline metabolite previously isolated from Streptomyces sp. QL37” (Figure 1d).
In the PRSR2 and PRSR3 cocultures, P. rubens was introduced into the bioreactor 24 and 48 h prior to S. rimosus inoculation, respectively. In these experiments, one could observe three distinct outcomes in terms of the secondary metabolite production by S. rimosus, namely, the blocked biosynthesis of a given metabolite, biosynthesis that was observable but led to lower product levels than in the corresponding S. rimosus monoculture, or biosynthesis that resulted in higher metabolite levels than those observed in the monoculture. The first of these outcomes were recorded for spinoxazine A (Figure 1i), lucensomycin (Figure 1h), and 7-demethyl-glucopiericidin A (Figure S36), which were practically not produced in the PRSR2 and PRSR3 cocultures despite being found in the PRSR2 and PRSR3 monocultures. The second scenario was noted for oxytetracycline (Figure 1a), rimocidin (Figure 1b), CE-108 (Figure S31), 27-ethyl rimocidin (Figure S32), milbemycins (Figures S33–S35), and 2-acetyl-2-decarboxamido-oxytetracycline (Figure S37). The maximum levels of these metabolites in the PRSR2 and PRSR3 cocultures did not exceed those reached in the corresponding monocultures. Furthermore, the start of the production was visibly delayed compared to the monocultures, and the time of delay depended on the molecule. For example, the biosynthesis of oxytetracycline (Figure 1a) was confirmed after 48 h of S. rimosus growth in the PRSR2 and PRSR3 monocultures, whereas in the PRSR2 and PRSR3 cocultures, this metabolite was first detected as late as 120 h after S. rimosus inoculation, when trace amounts of oxytetracycline were found in the broth. In the case of rimocidin (Figure 1b), the onset of production in PSRS2 and PRSR3 cocultures was delayed by 96 h relative to their monoculture counterparts. Finally, in the third recorded scenario, the levels of several metabolites were found to be higher in the cocultures than in their monoculture counterparts. In this group, the stimulating effect of cocultivation could be observed either in one of the runs (either in PRSR2 or PRSR3) or in both, depending on the metabolite. The biosynthesis of rimocidin B (Figure 1c), which was the only member of the rimocidin family that displayed the cocultivation-related improvement in titer, was found to be visibly stimulated in the PRSR2 and PRSR3 cocultures, with the PRSR3 coculture being the most effective variant in this context. Similar stimulatory effects were noted for the biosynthesis of the “unnamed angucycline metabolite previously isolated from Streptomyces sp. QL37” (Figure 1d). In addition, the PRSR3 coculture led to a considerable increase in rimosamide A (Figure 1g) and turgichelin (Figure 1e) levels compared to the monocultures, while the PRSR2 coculture led to the stimulated formation of 2-methylthio-cis-zeatin (Figure 1f). With regard to the “cocultivation-enhanced” group of metabolites, it was observed that the time to reach the maximum titers in the PRSR2 and PRSR3 cocultures was visibly delayed compared to that in the monocultures (Figure 1b–e). The exception was 2-methylthio-cis-zeatin (Figure 1f), which was detected at 24 h after S. rimosus inoculation regardless of the cultivation mode (i.e., mono- or cocultivation).

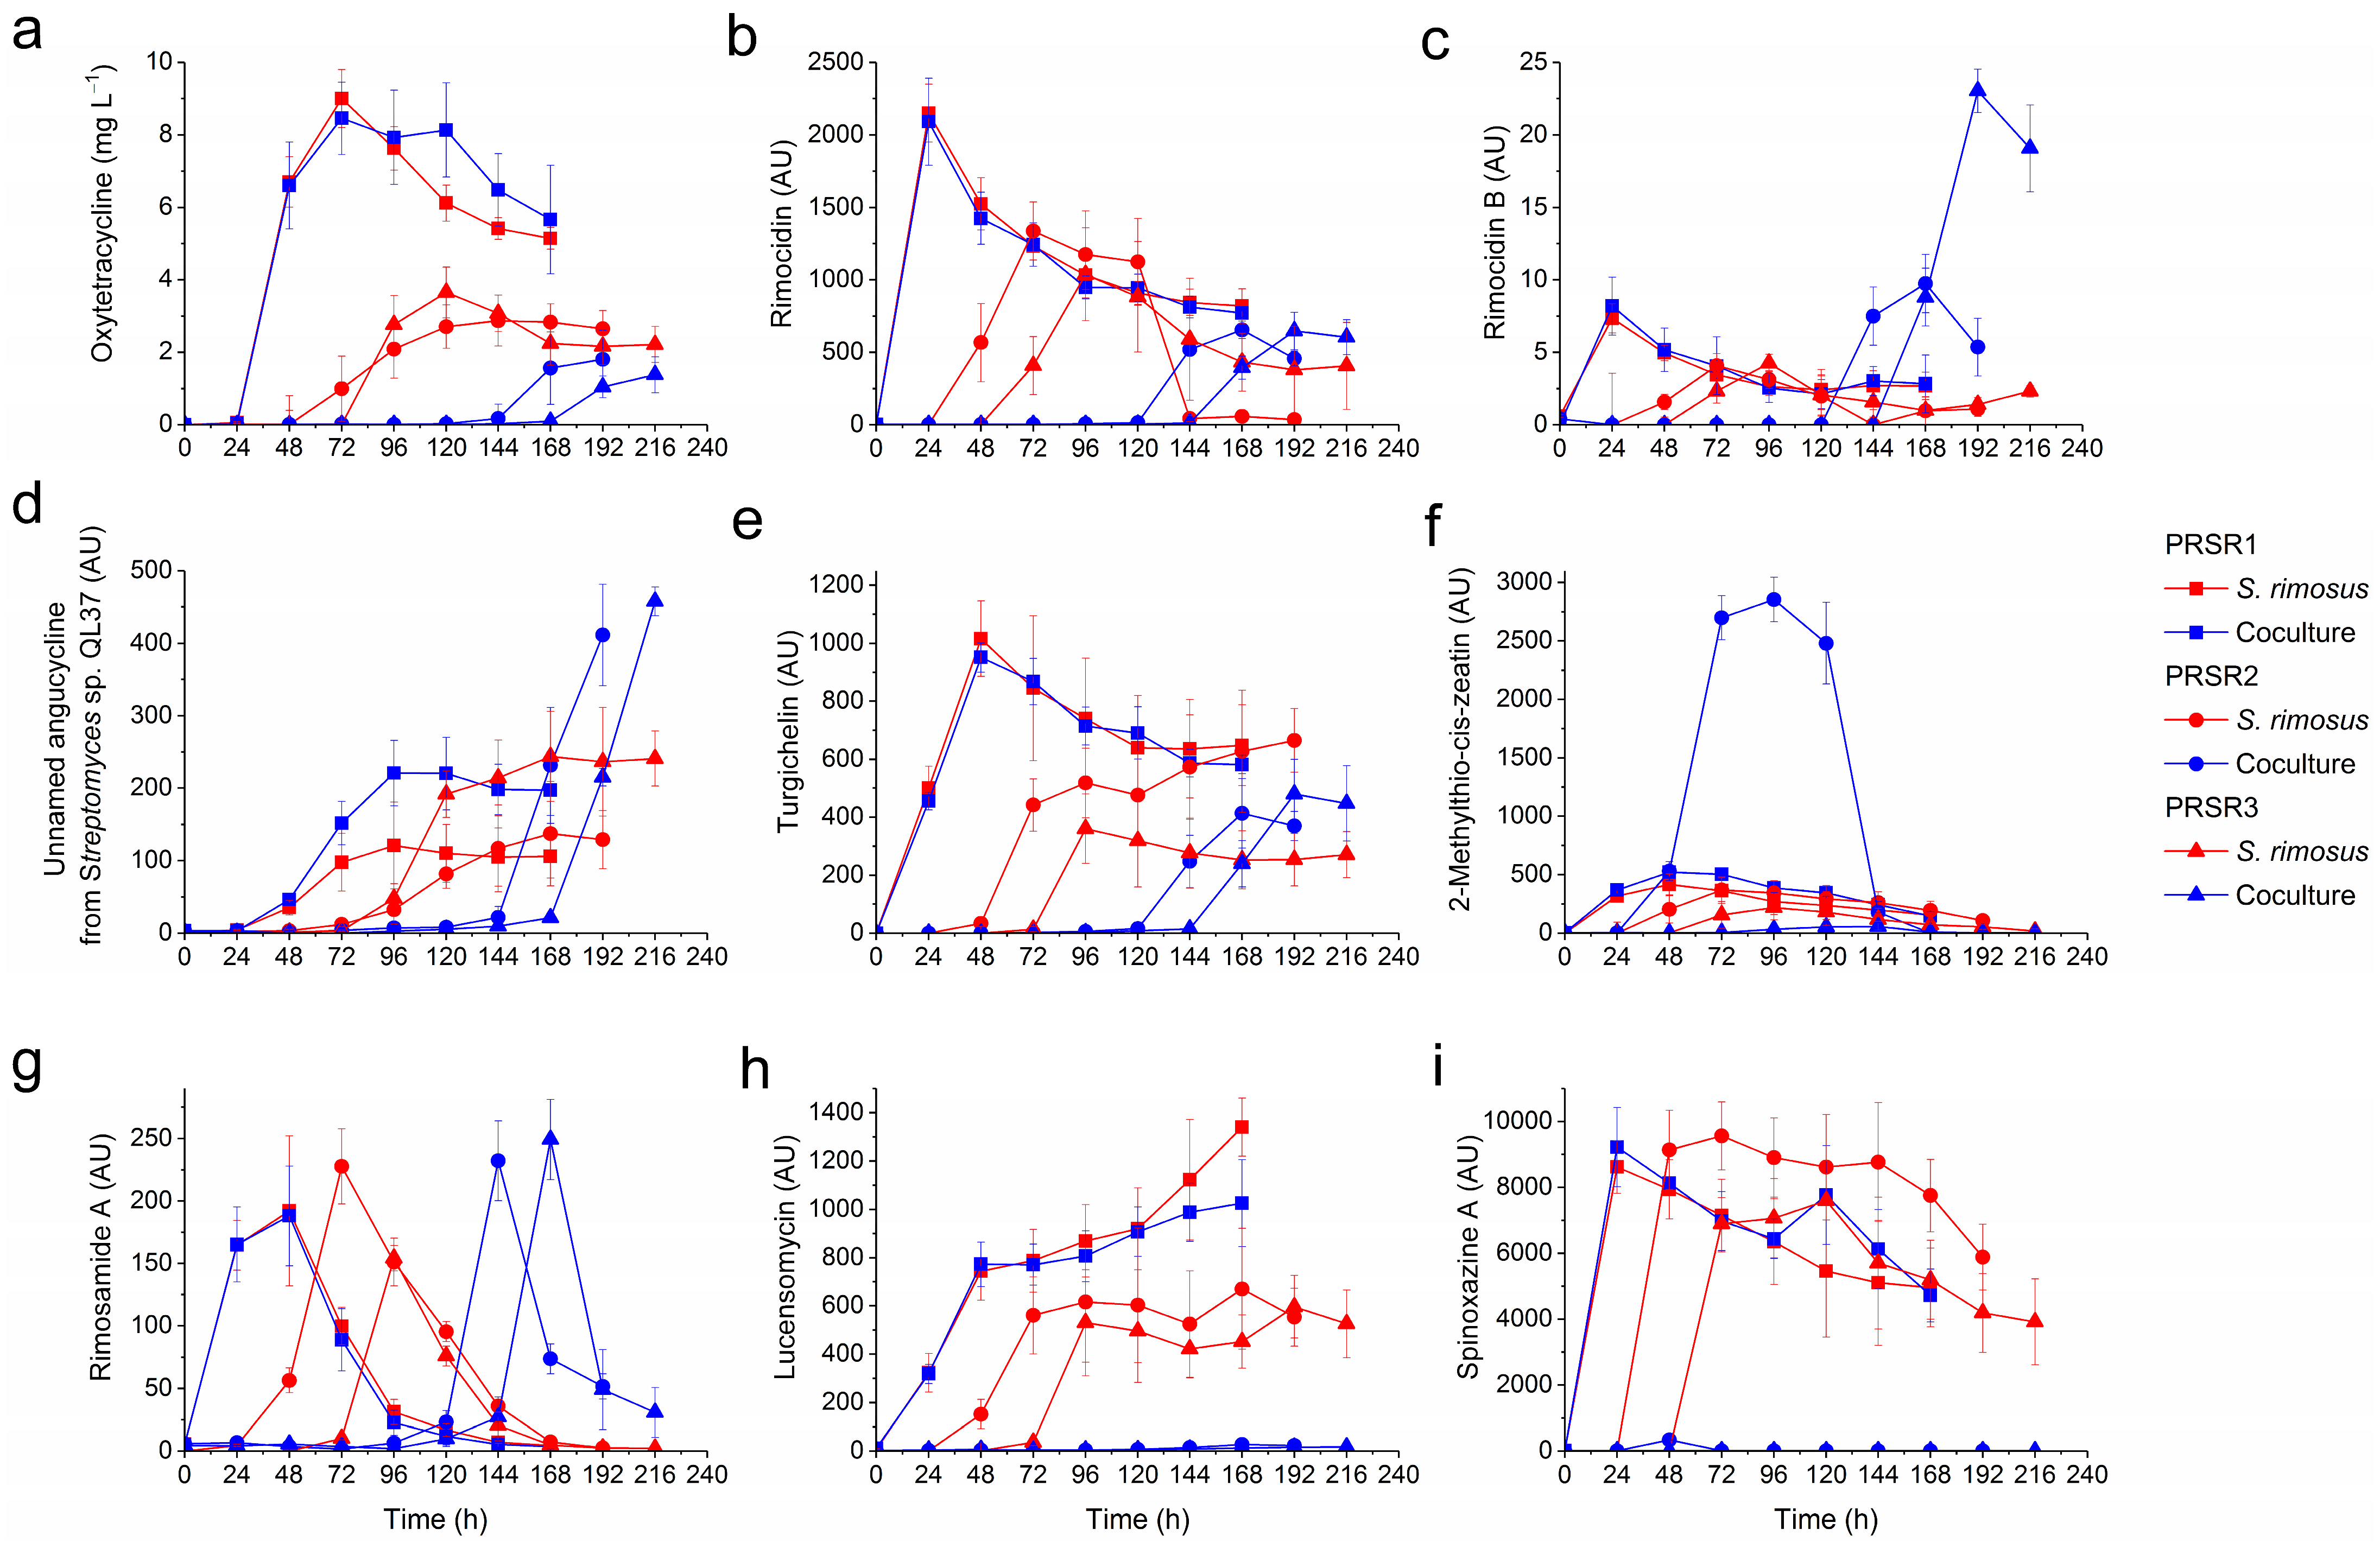
2.3. Production of Secondary Metabolites by P. rubens

The production of P. rubens secondary metabolites in the PRSR1 coculture was found to be completely blocked, as opposed to the biosynthetic repertoire displayed in the PRSR1 fungal monoculture (Figure 2). In the PRSR2 and PRSR3 cocultures, on the other hand, the outcome of the mono- vs. coculture comparison varied from metabolite to metabolite.
Regarding the production of penicillin G (Figure 2a), cocultivation clearly exerted negative effects on the biosynthetic process. Among the tested cocultures, only PRSR3 resulted in detectable levels, although the corresponding titers were very low, i.e., not exceeding 1 mg L−1 (Figure 2a). An even stronger inhibitory effect was noted with regard to cyclopiamide D production (Figure 2e), which was completely turned off as a result of cocultivation. In contrast, there was an evident boost in benzylpenicilloic acid (Figure 2c) and preaustinoid D (Figure 2f) levels in the PRSR2 and PRSR3 cocultures compared to the corresponding P. rubens monocultures. Furthermore, the stimulation of adenophostin B (Figure 2d) and chrosogine (Figure 2b) biosynthesis was recorded for the PRSR2 cocultivation. The levels of P. rubens metabolites in the PRSR2 and PRSR3 cocultures increased only until a certain time point (e.g., 144 or 168 h in the case of adenophostin B production in the PRSR2 and PRSR3 experiments, respectively, as shown in Figure 2d) and then declined toward the end of the cocultivation process.

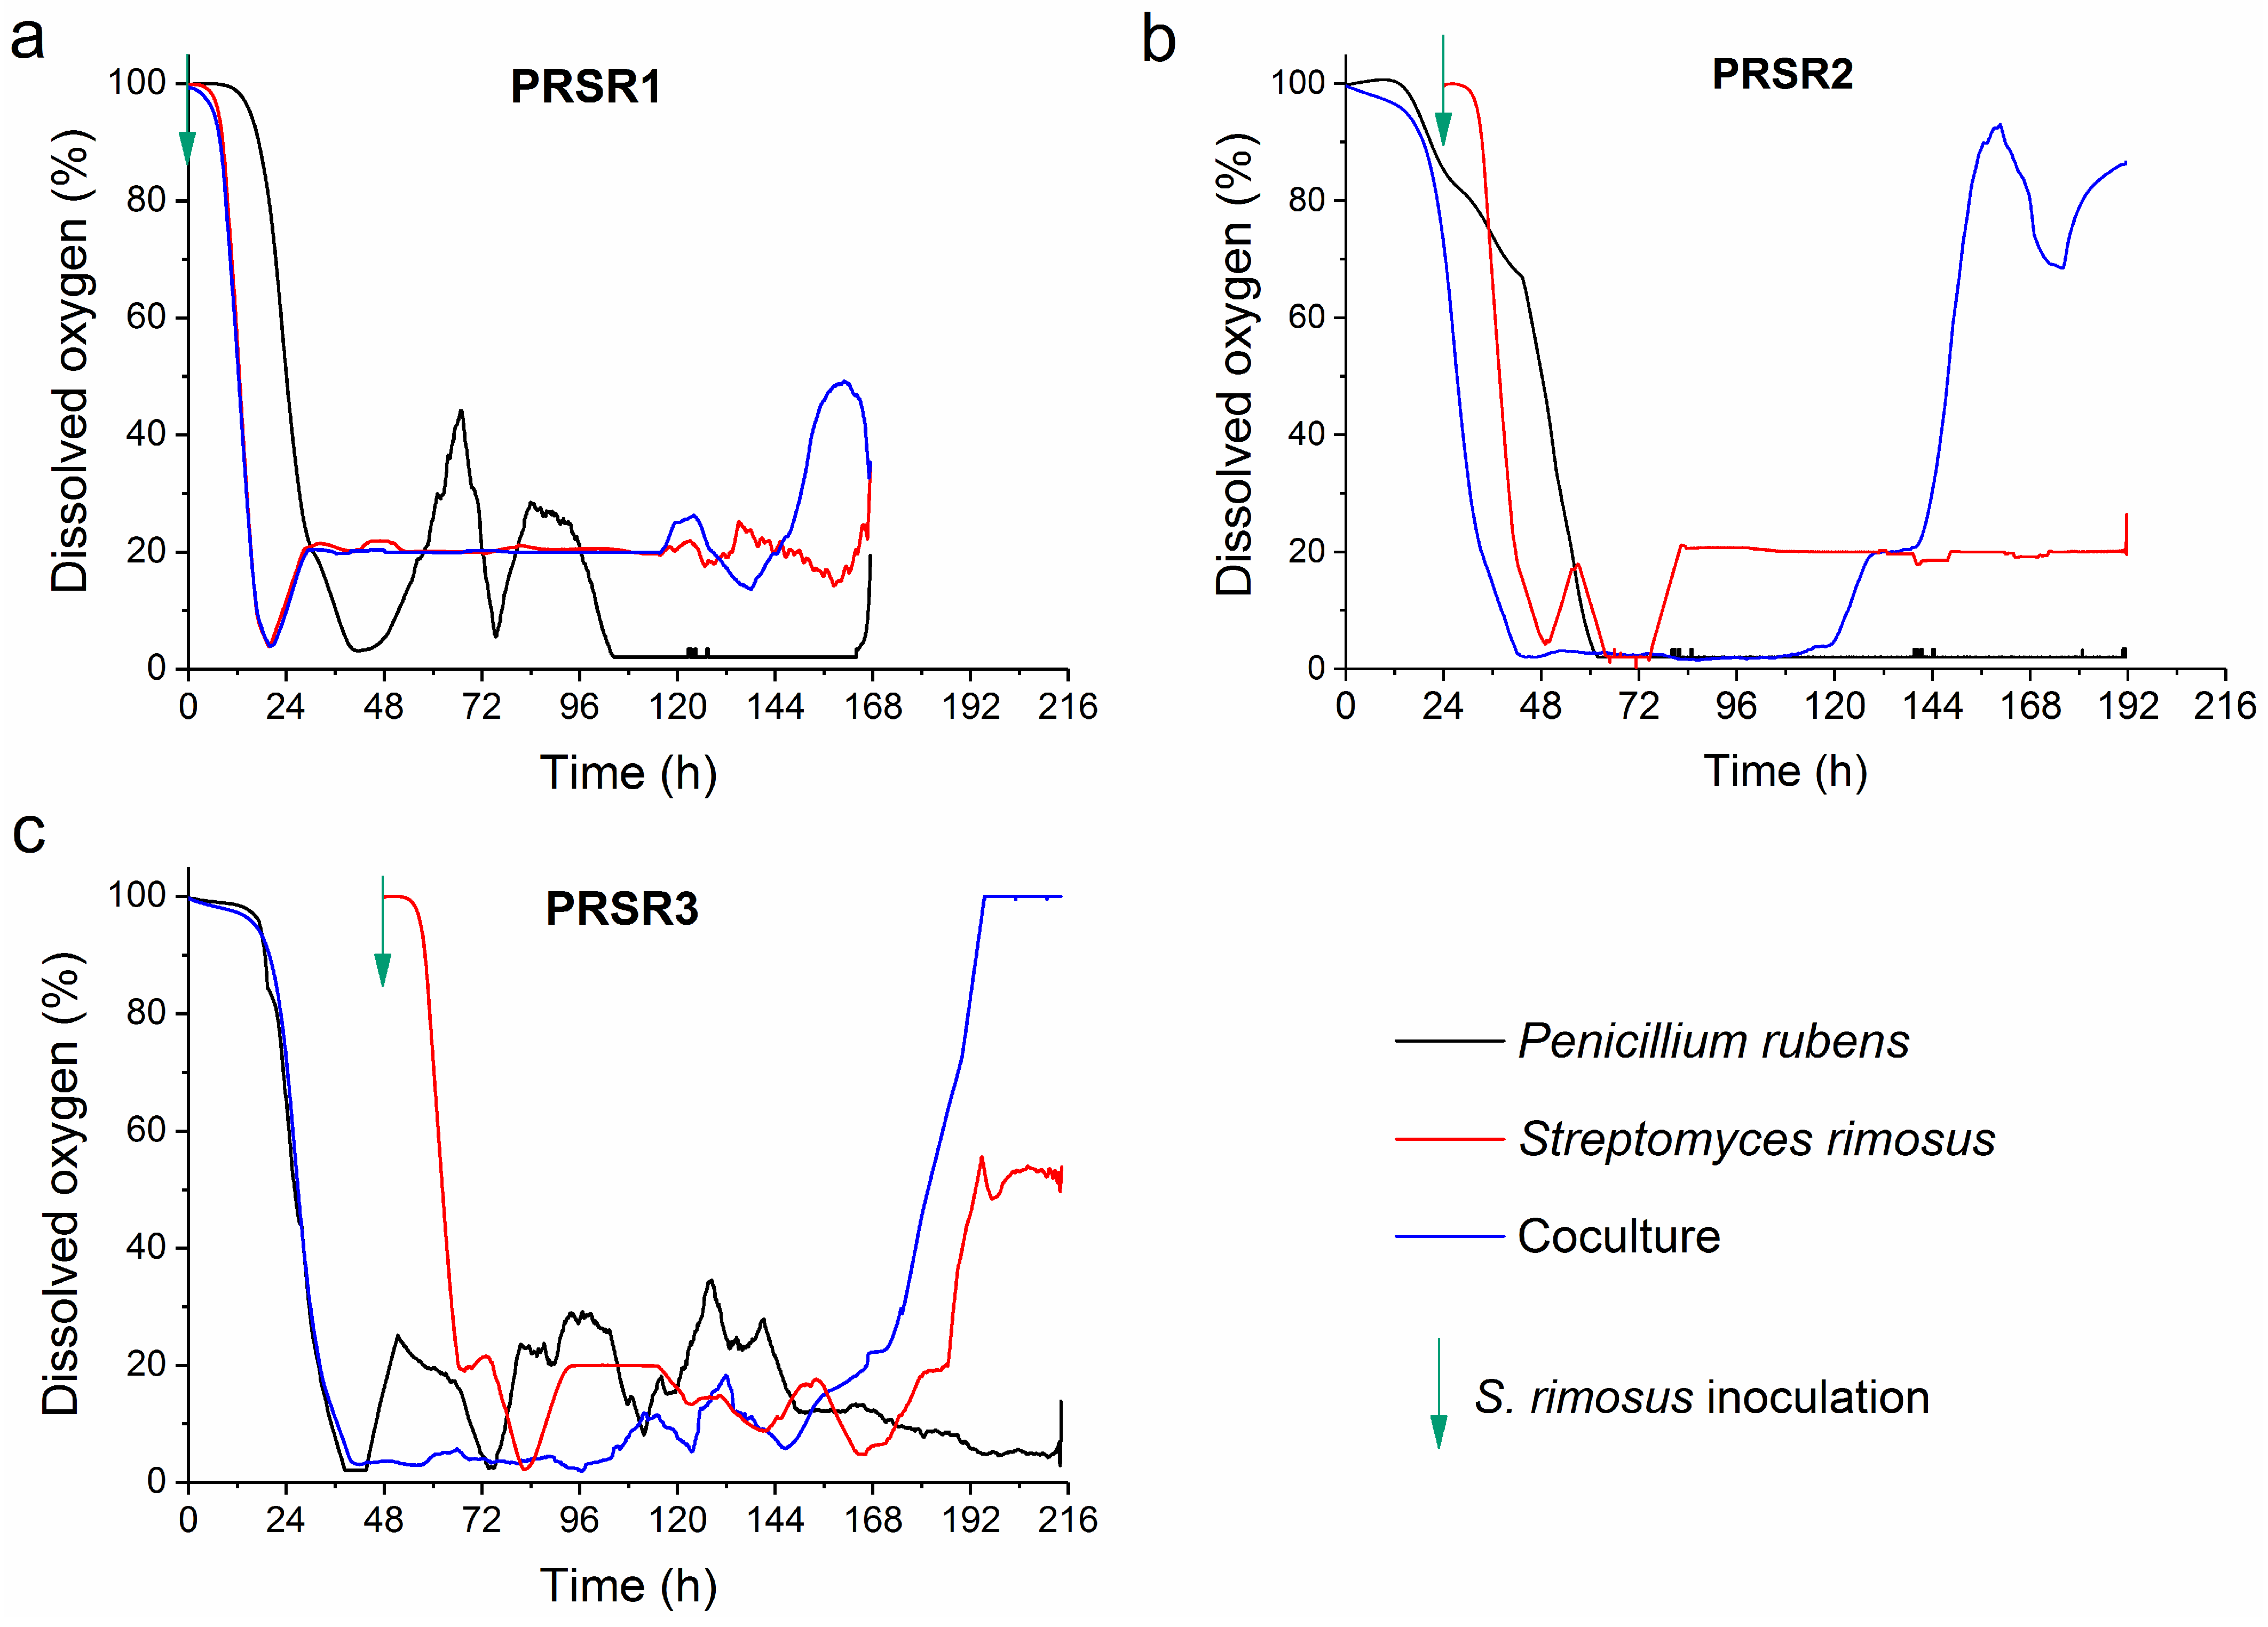
2.4. Dissolved Oxygen Profiles

In the PRSR1 experiment, in which the coculture was simultaneously inoculated with the spores of both species (at time t = 0 h, Figure 3a), it was evident that during the whole duration of the process (i.e., except the period from 144 to 168 h), the DO curve of the coculture overlapped with that observed for the S. rimosus monoculture. In other words, from 0 to 144 h of the run, the DO profile of the PRSR1 coculture behaved as if P. rubens was absent from the broth (Figure 3a). The situation was markedly different in the PRSR2 process (Figure 3b), where the spores of S. rimosus were introduced at t = 24 h into the bioreactor with growing P. rubens to initiate the cocultivation. At the same moment (i.e., at 24 h), the monoculture of S. rimosus was started (Figure 3b).
The first observation was that the PRSR2 monoculture of P. rubens required as much as 60 h to display a DO level of 0%, whereas the corresponding coculture needed only 42 h to reach this state (Figure 3b). Thus, it was evident that S. rimosus contributed to oxygen utilization in the coculture. Another observation was made regarding the DO profiles after they dropped to the 0% level. In the case of the P. rubens monoculture, the DO curve remained at the 0% plateau, while in the S. rimosus monoculture and the coculture, an abrupt increase in DO occurred (Figure 3b), albeit at different time points (at t = 72 h and t = 120 h for the S. rimosus monoculture and coculture, respectively). A unique factor in the PRSR2 coculture profile compared with the corresponding S. rimosus and P. rubens monoculture variants is the behavior exhibited after 140 h of the run (Figure 3b). During this final period of the PRSR2 run, the DO in the coculture showed continuous changes and temporarily reached levels as high as 90%, whereas, in the P. rubens and S. rimosus monocultures, the DO curves remained at 0 and 20%, respectively, for the remainder of the experiment (Figure 3b). In the third investigated bioprocess, namely, PRSR3, the coculture was initiated by inoculating the S. rimosus spores into the 48-h culture of P. rubens (Figure 3c). Within almost the whole period between 48 and 150 h, the DO levels in the P. rubens monoculture were higher than those in the coculture. Then, behavior similar to what was seen in the PRSR2 coculture was recorded, i.e., the DO levels increased abruptly in the coculture and S. rimosus monoculture, while the DO levels in the P. rubens monoculture showed an opposite trend and kept decreasing toward the end of the run (Figure 3c). In the period between 172 and 216 h, the DO profile in the P. rubens monoculture was evidently below the curves corresponding to the coculture and S. rimosus monoculture. It should also be mentioned that, unlike the PRSR2 counterpart, the DO profile in the PRSR3 coculture reached 100% and remained at this level until the end of the experiment (Figure 3c).

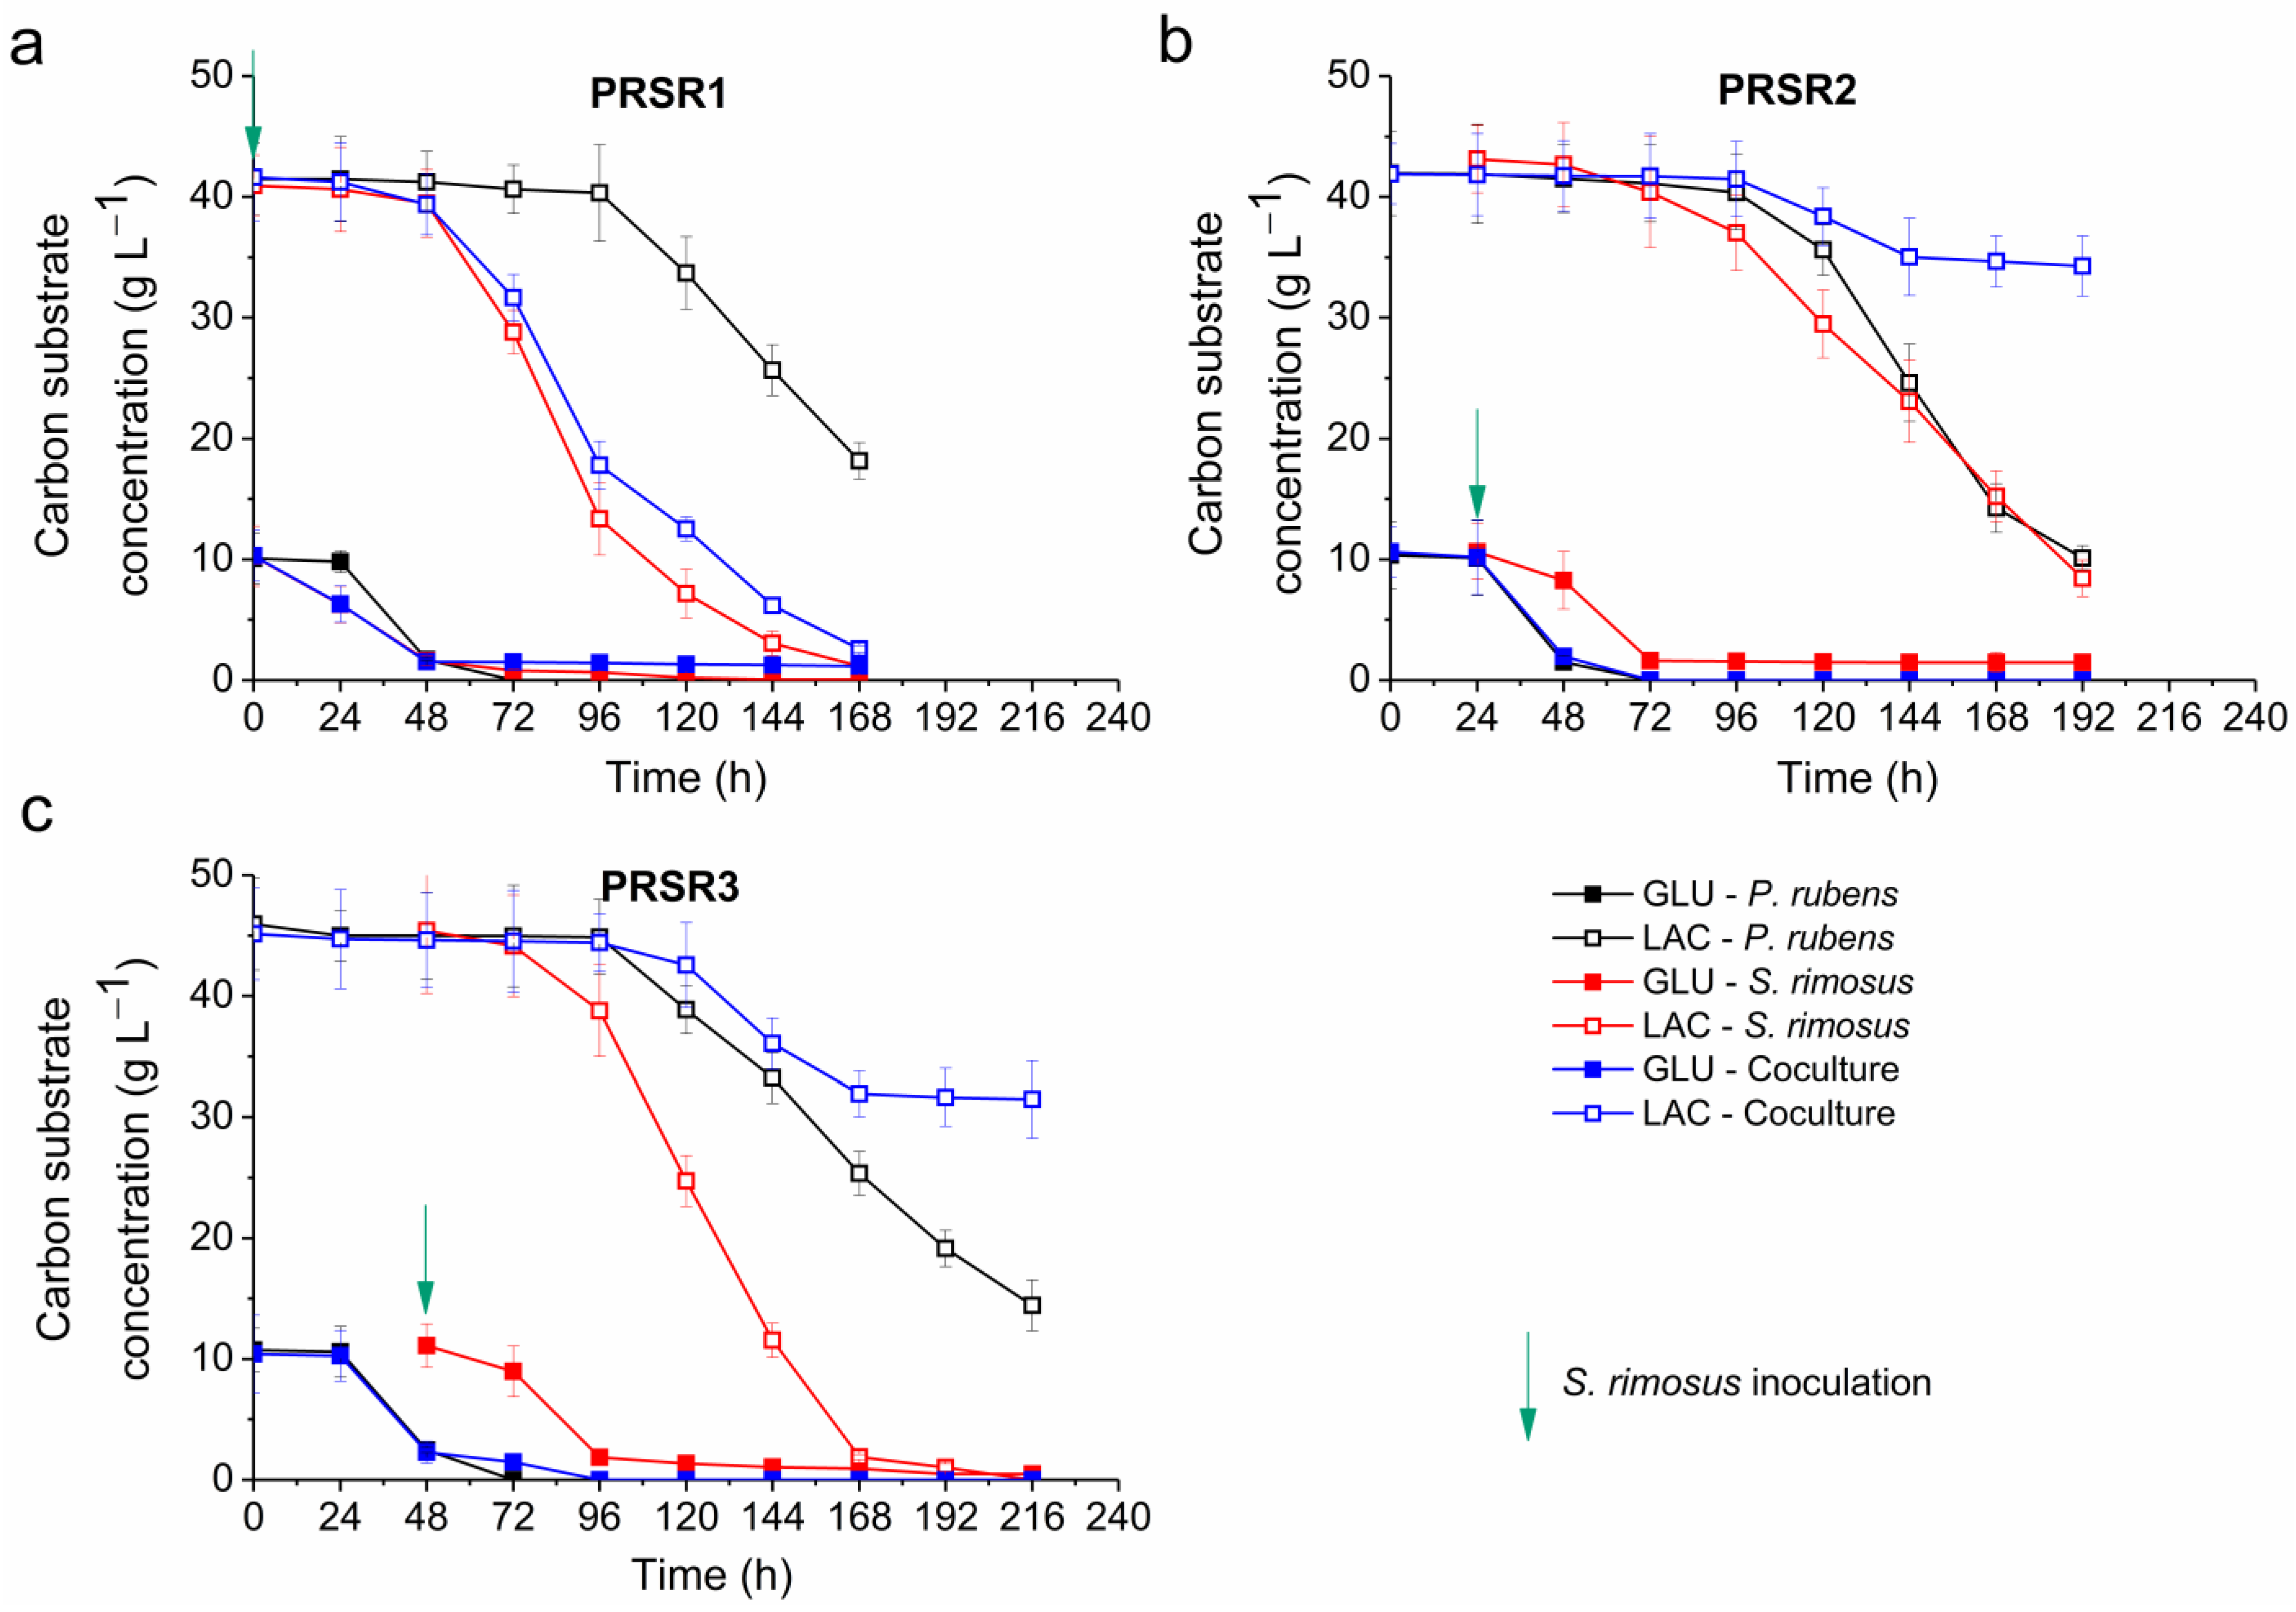
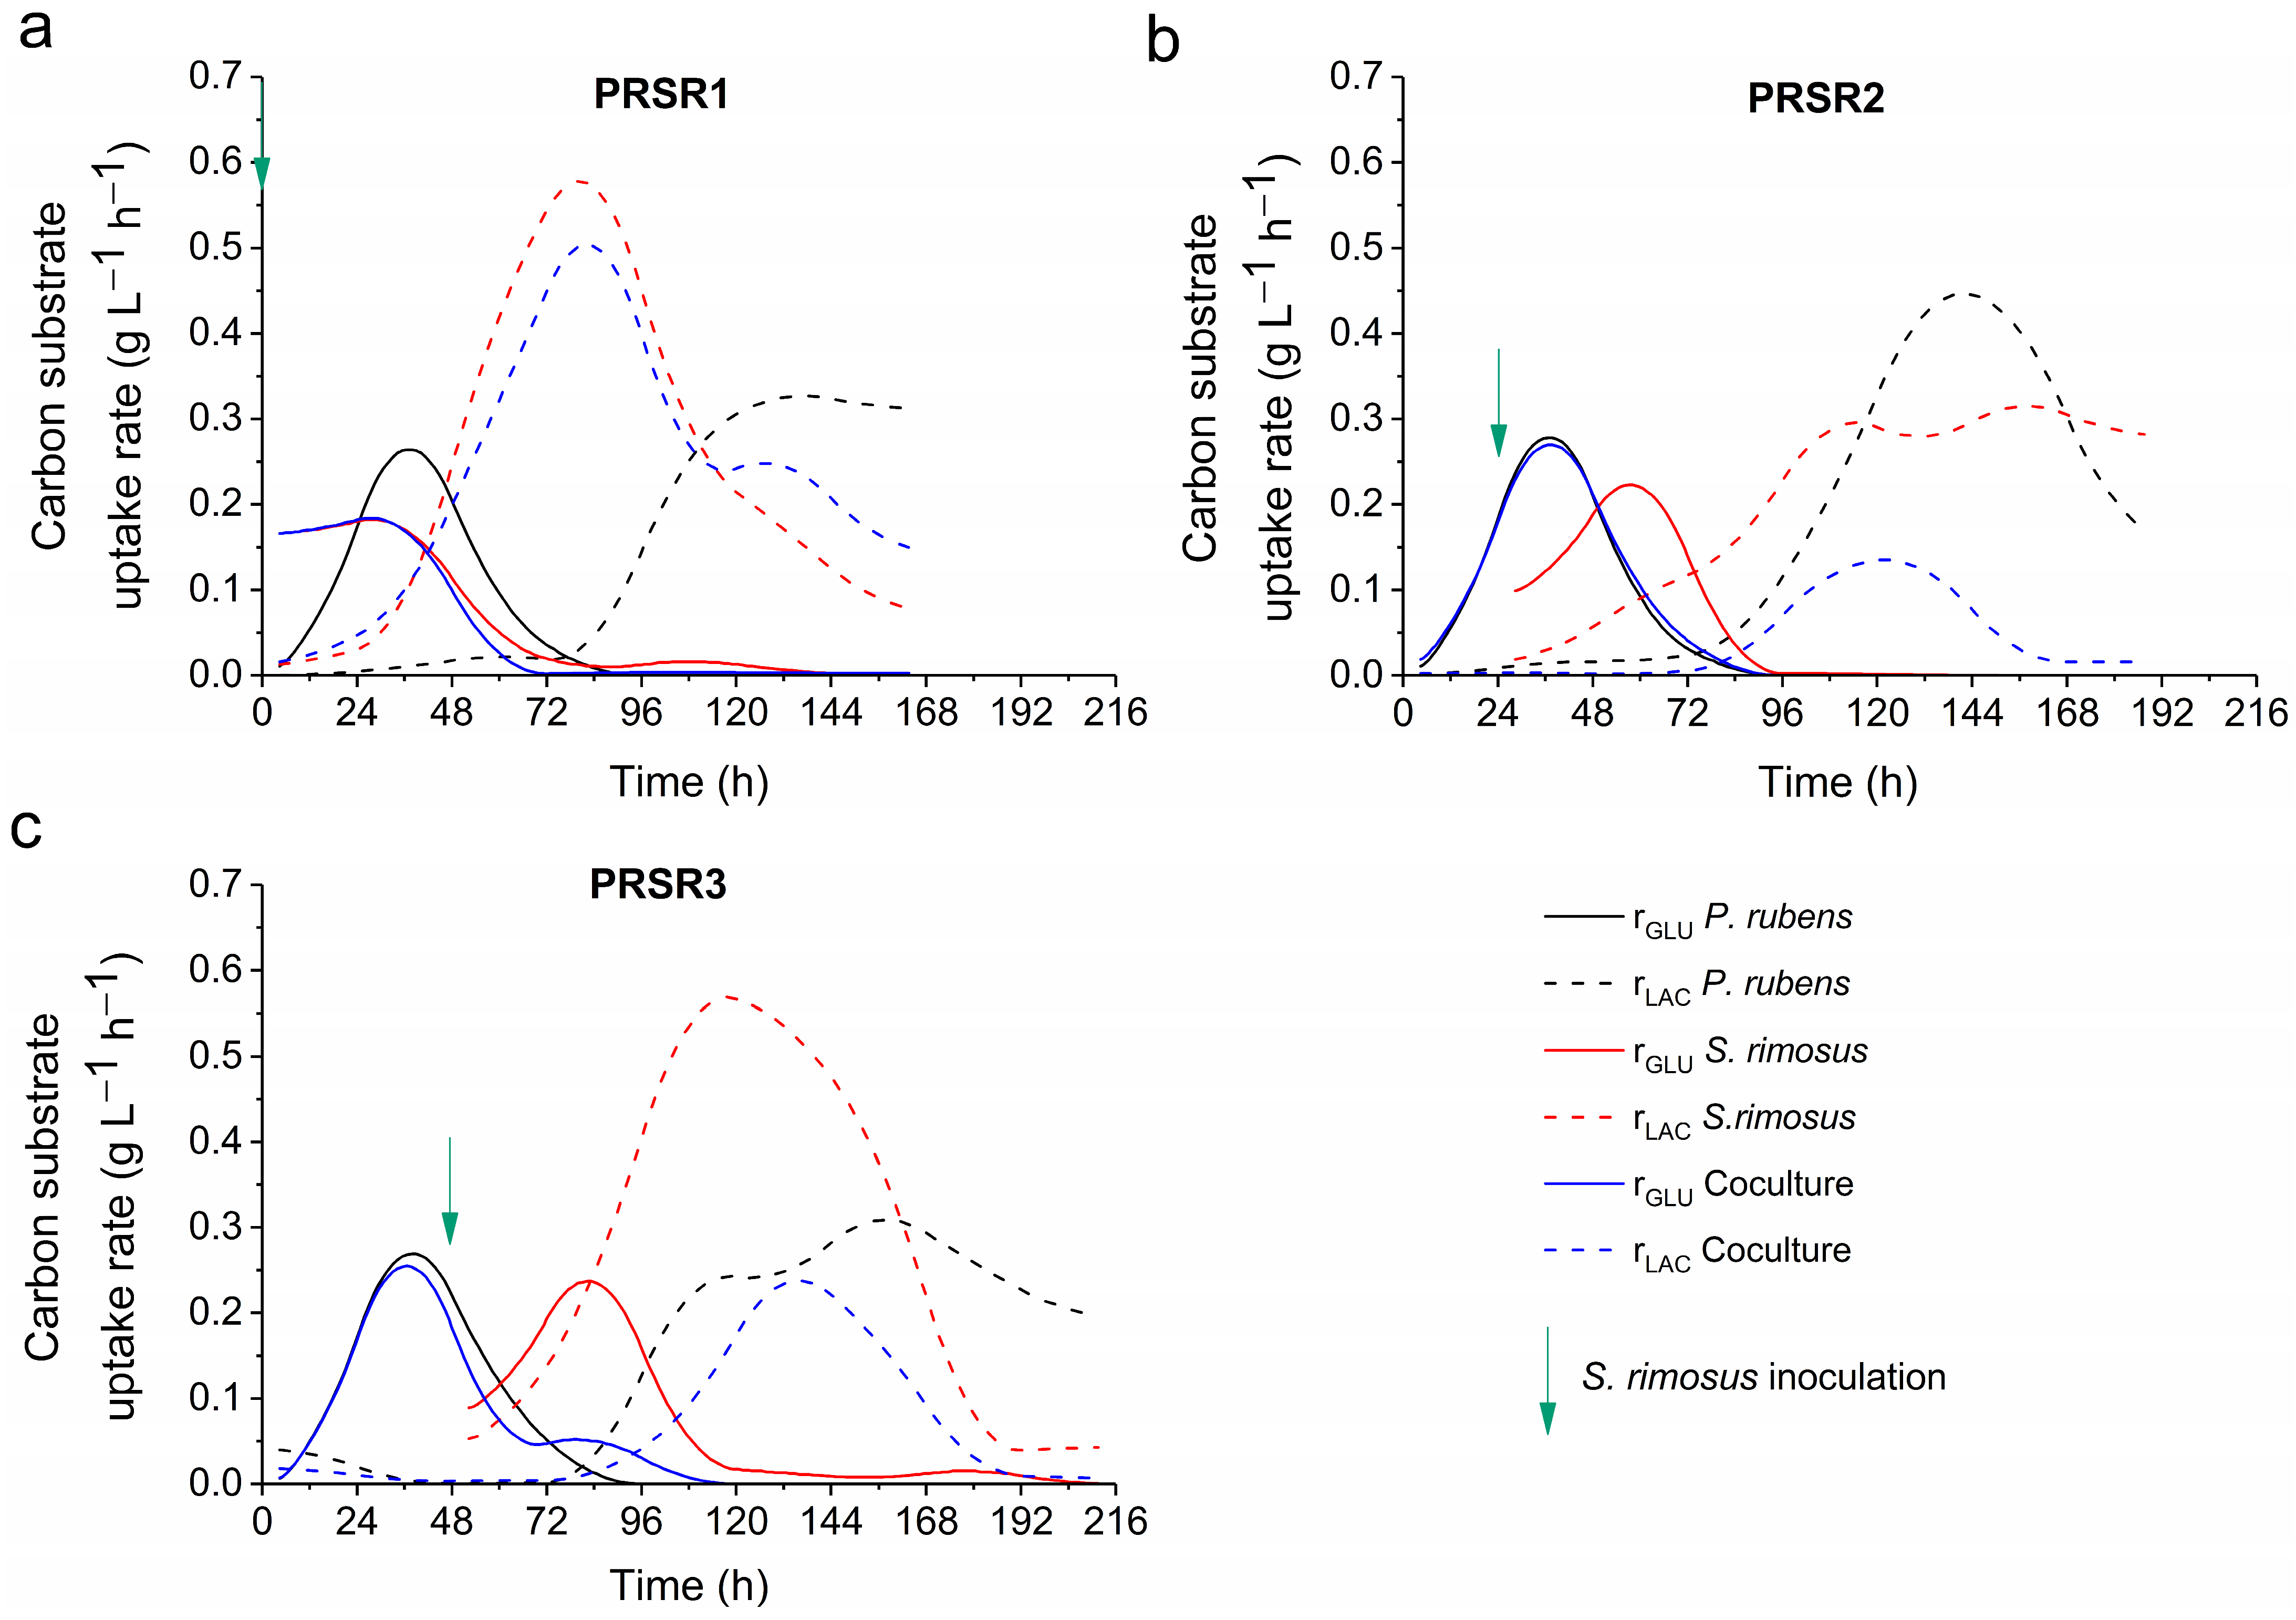
2.5. Kinetics of Substrate Utilization

In the PRSR1 experiment, the glucose and lactose concentration profiles of the coculture resembled those recorded for the S. rimosus monoculture; however, they were not identical, i.e., the sugar concentration values in the coculture were slightly higher than those in the S. rimosus monoculture (Figure 4a). The monoculture of P. rubens started to assimilate glucose and lactose relatively late compared to the two other variants. It was evident that the utilization of lactose by P. rubens was not at comparable levels to that observed in the coculture and S. rimosus monoculture (Figure 4a).
The situation looked markedly different in the PRSR2 run (Figure 4b), in which the spores S. rimosus were introduced with a 24-h delay. Here, the glucose concentration profiles of the P. rubens monoculture, and the coculture overlapped throughout the cultivation despite the addition of S. rimosus spores (Figure 4b). In the case of lactose, the concentration profile in the coculture followed that in the P. rubens monoculture but only until 96 h. Afterward, the lactose concentration curves in the P. rubens monoculture, and coculture fell apart, and lactose was hardly utilized in the coculture after 144 h of the run, remaining at the level of approximately 37 g L−1. In the P. rubens monoculture, the lactose concentration decreased by more than 30 g L−1 from 96 to 192 h (Figure 4b). A similar decrease in lactose levels was noted for the S. rimosus monoculture (Figure 4b). It should be mentioned that in the PRSR2 run, the lactose profiles corresponding to the coculture and S. rimosus monoculture differed markedly (Figure 4b). In the PRSR3 experiment, in which S. rimosus was inoculated with a 48-h delay (Figure 4c), the glucose concentration profiles of the coculture and P. rubens monoculture were practically identical only until 48 h. Then, the level of glucose dropped to zero at 72 h in the P. rubens monoculture, while the coculture required 96 h to completely utilize this sugar (Figure 4c). The lactose profiles for the coculture and P. rubens monoculture overlapped until 96 h. Then, the levels of lactose recorded in the coculture were clearly above those observed in the monoculture of P. rubens. In the coculture, the lactose concentration remained at 33 g L−1 from 168 to 261 h, while in the P. rubens monoculture, it decreased to approximately 15 g L−1 at 216 h (Figure 4c). At the same time, the consumption of lactose in the S. rimosus monoculture was greater than those in the other two variants and dropped to zero at 216 h (Figure 4c).
Analysis of the glucose and lactose uptake rates (Figure 5) confirmed the aforementioned observations. In the PRSR1 experiment, the monoculture of P. rubens exhibited a unique pattern of uptake rates compared with the coculture and S. rimosus monoculture. At the same time, the profiles of the coculture and S. rimosus monoculture were highly similar, albeit not identical (Figure 5a). The maximum lactose uptake rate rLAC for the P. rubens monoculture was equal to 0.27 g LAC L−1 h−1 at t = 36 h, while those for the S. rimosus monoculture and coculture exceeded 0.5 g LAC L−1 h−1 at approximately 72 h of the PRSR1 process (Figure 5a).
The PRSR2 and PRSR3 experiments were similar to each other with regard to the glucose uptake rates rGLU in the period between 0 and 72 h, with the maximum values reaching almost 0.3 g GLU L−1 h−1 at 36 h (Figure 5b,c). Regarding the lactose uptake rates rLAC, their values in the coculture were lower than those recorded in the S. rimosus and P. rubens monocultures (Figure 5b,c).

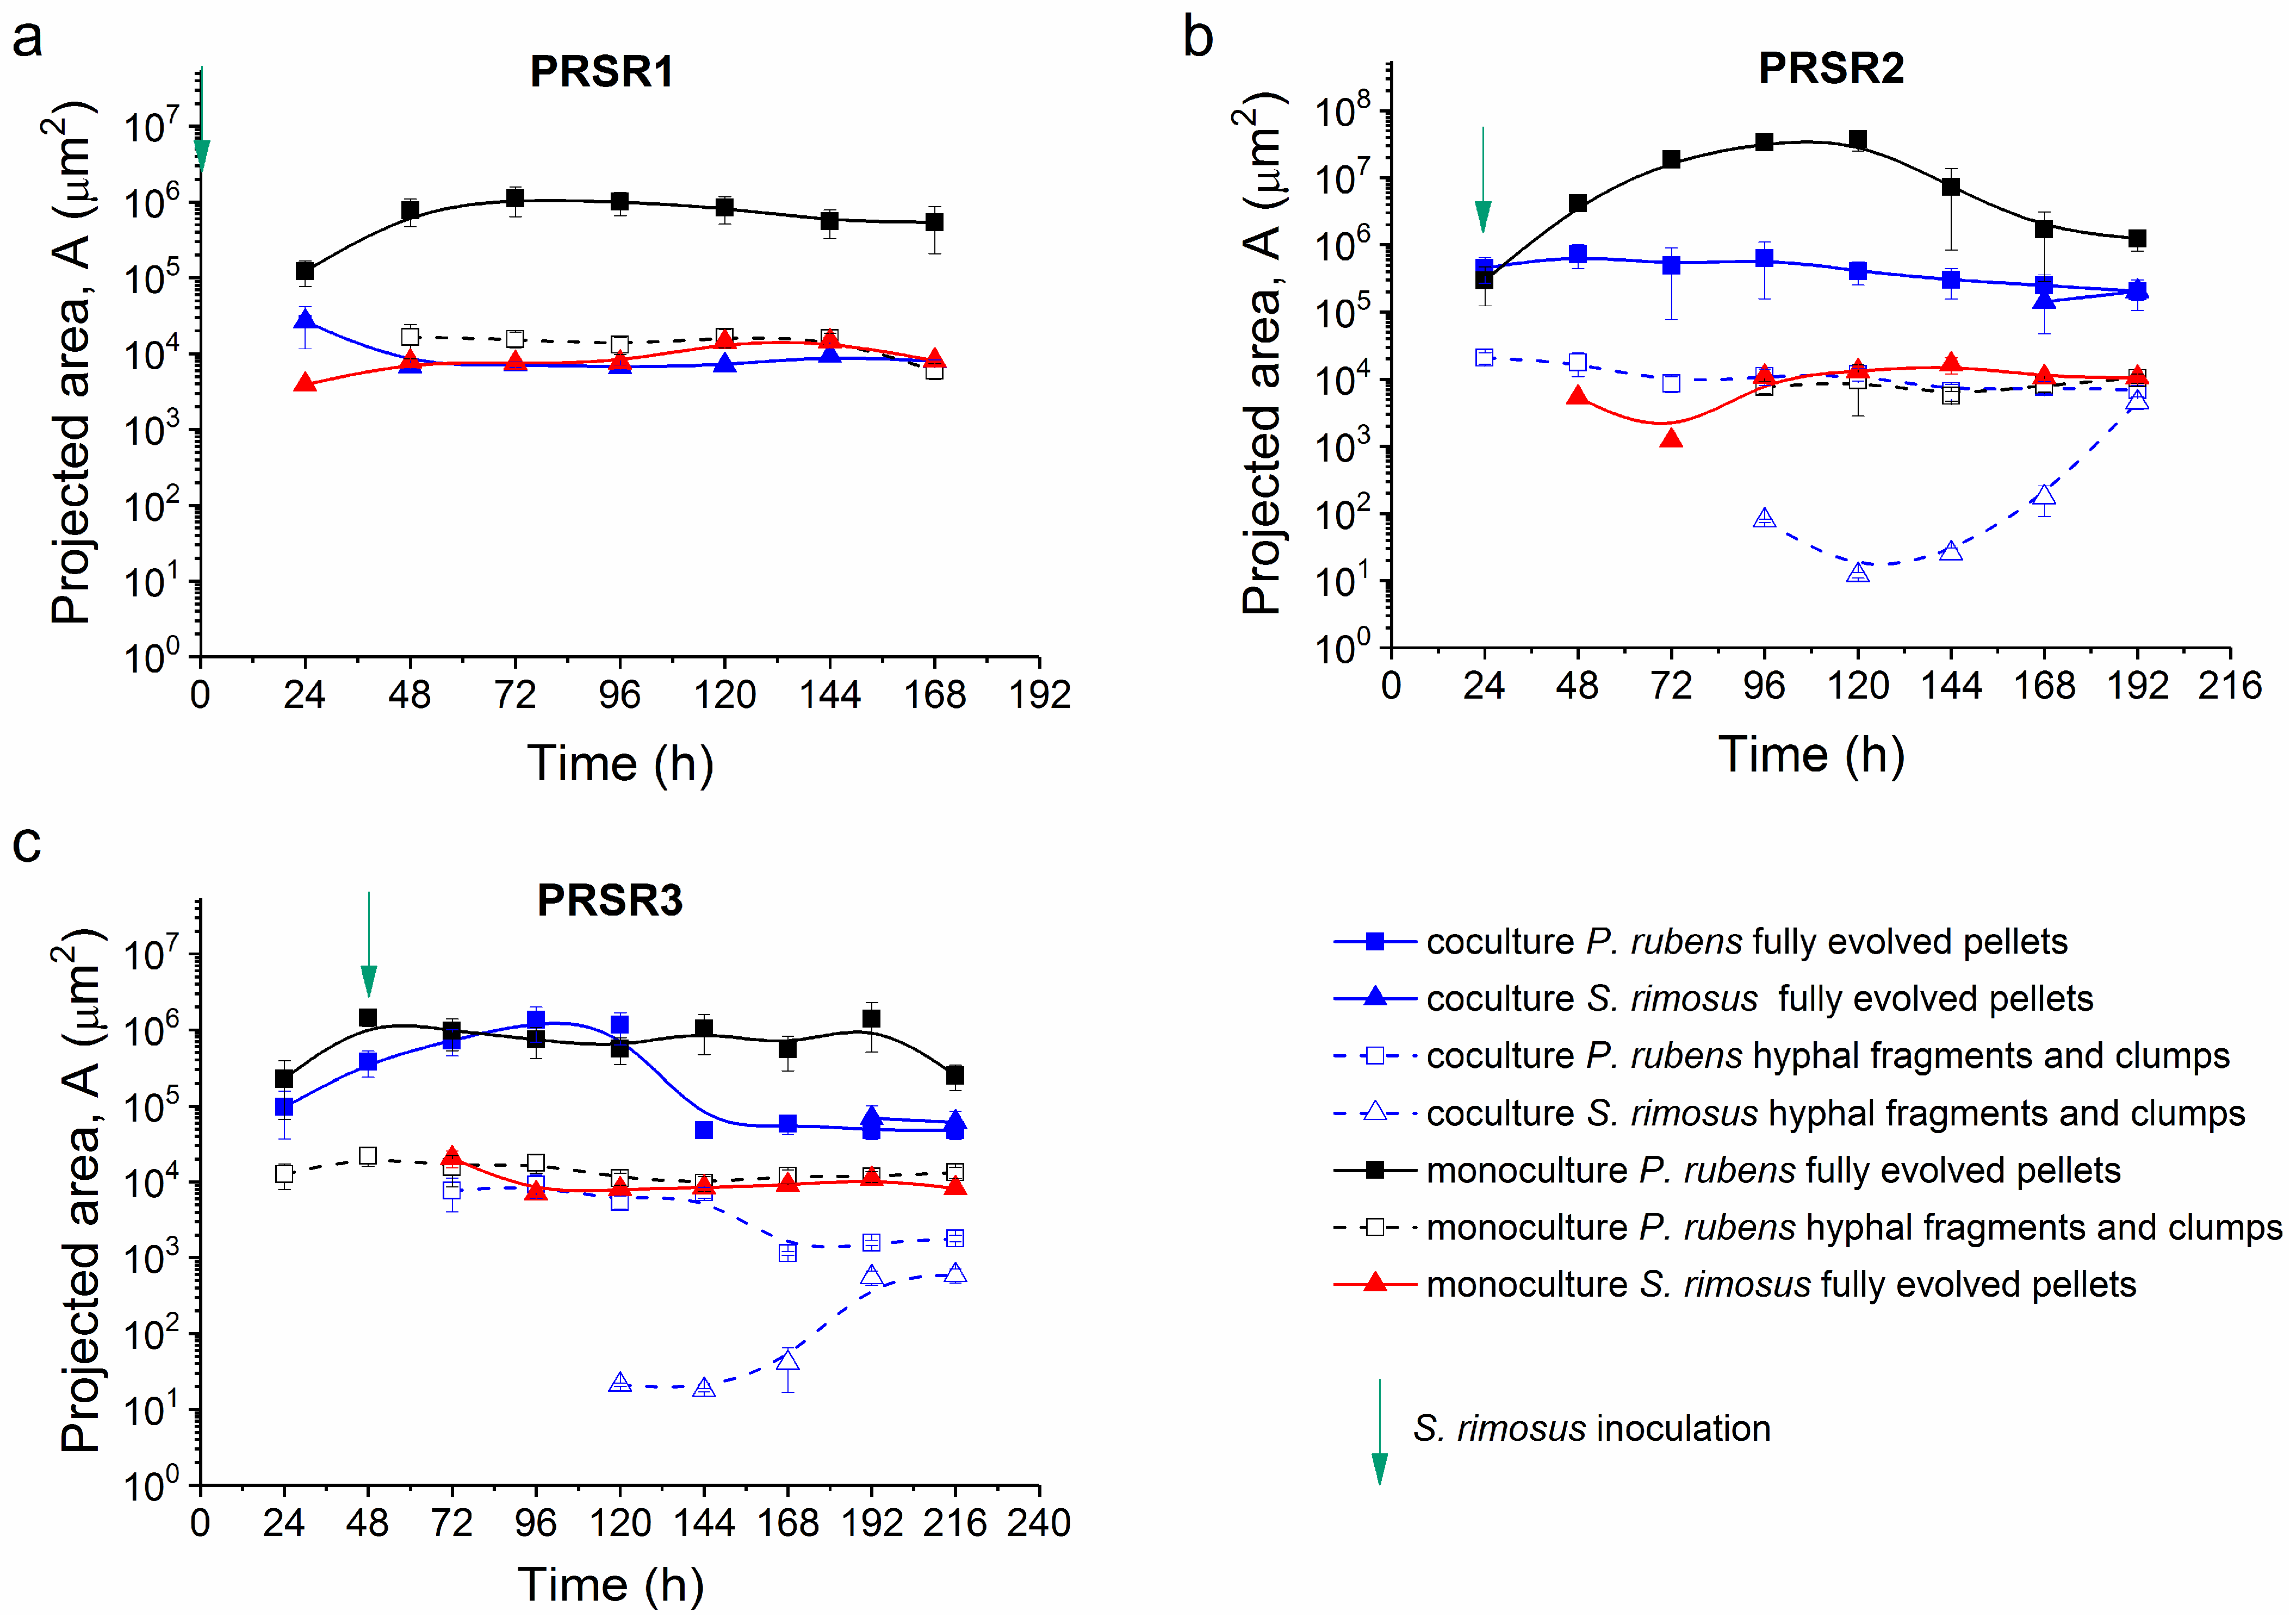
2.6. Morphological Analysis

The morphological analysis (Figure 6, Figures S38 and S39) involved three parameters [41] calculated on the basis of microscopic images (Figure S40): projected area (A), which refers to the object size (number of pixels in an object multiplied by squared unit of calibration); elongation (E), which describes the shape (squared quotient of transversal and longitudinal deviation of pixels in an object along the line of regression); and morphology number (Mo) introduced by Wucherpfennig et al. [42], which combines the influence of size and shape within a single parameter value (it is proportional to the square root of projected area and roughness, and inversely proportional to elongation and maximum object diameter).
In the case of filamentous microorganisms such as P. rubens and S. rimosus, their primary morphological forms are always developed during the first 24–48 h of their growth. This process was clearly seen in experiment PRSR1. The projected area values of the spores introduced to the bioreactors at t = 0 h were equal to 8 µm2 for P. rubens and 0.38 µm2 for S. rimosus. During the first 24 h of PRSR1, the microorganisms grew rapidly and formed pellets, i.e., spherical morphological forms with areas of 1.2 × 105 µm2 for P. rubens in the monoculture and 3.9 × 103 µm2 for S. rimosus in the monoculture (Figure 6a). P. rubens pellets in the PRSR1 coculture were present only at 24 h of the process. Within the next hours of cultivation, they vanished completely due to the presence of S. rimosus in the coculture (Figure 6a and Figure S40). At 48 h of the PRSR1 experiment, S. rimosus pellets in the monoculture and the coculture became more homogeneous. The projected area of the S. rimosus monoculture increased to 7.8 × 103 µm2, and that of the coculture decreased to 6.8 × 103 µm2 (Figure 6a). The p-values lower than 0.01 calculated for these two projected area values indicate significant differences. However, in the next hours of cultivation, the S. rimosus pellet sizes in the monoculture and coculture were almost identical. Their projected area values were 7.5 × 103 µm2 (monoculture) and 7.2 × 103 µm2 (coculture). A p-value higher than 0.05 confirmed the lack of significant differences. Similar sizes of S. rimosus objects in the mono- and cocultures at this time suggest that the presence of P. rubens in the coculture had no significant effect on S. rimosus growth. Thus, P. rubens pellets did not survive the PRSR1 cocultivation, whereas, in the monoculture, they were present until the end of the experiment. The other morphological forms witnessed in PRSR1, namely, hyphae and clumps, were exclusively formed in the P. rubens monoculture (Figure 6a).
In the PRSR2 experiment, fungal and actinomycete pellets appeared after 24 h of growth. At this time of the process, hyphae and clumps were present only in the P. rubens monoculture (Figure 6b). In the PRSR2 coculture, the pellets of P. rubens were observed until the end of the experiment. Their sizes in the cocultivation bioreactor before S. rimosus inoculation were similar to those from the P. rubens monoculture. At 24 h of PRSR2, the area of P. rubens pellets were 4.5 × 105 µm2 in the coculture and 2.9 × 105 µm2 in the monoculture (p > 0.05). Then, the size of the P. rubens pellets in the coculture showed a decreasing trend (Figure 6b). Hyphae and clumps of S. rimosus were formed at 96 h of the PRSR2 coculture, while the pellets appeared at 168 h. At 192 h, the mean projected area of S. rimosus pellets was the same as the value recorded for the pellets of P. rubens (Figure 6b).
Compared with PRSR2, the pellets of P. rubens in the PRSR3 run showed a prolonged period of growth, as illustrated by the values of the projected area (Figure 6c). The peak value of the projected area (A = 1.3 × 106 µm2) of P. rubens pellets was reached at 96 h in the PRSR3 process. Within the next hours of cocultivation, the projected area of P. rubens exhibited a decreasing trend (at 144 h, a projected area of 4.8 × 104 µm2 was recorded). Importantly, the decrease in the P. rubens pellet size in the PRSR3 coculture was accompanied by the visible emergence of S. rimosus hyphal fragments and clumps (Figure 6c).
The shapes of the pellets observed during the experiments were irregular, as indicated by the morphology number at the level of Mo = 0.4 or even lower (Figure S38). The value of Mo = 0.9, which corresponds to the circular objects, was recorded only in the PRSR2 monoculture of P. rubens. Moreover, the morphology number obtained for hyphal fragments and clumps (within the range of 0.1–0.35) was always lower than the corresponding value for pellets, which confirms the correct separation of morphological objects into these two fractions. The values of elongation presented in Figure S39 were also in agreement with the theoretical considerations, i.e., the less elongated pellets displayed elongation values not higher than E = 2, whereas hyphae and clumps reached levels as high as E = 3.6 (see the P. rubens monoculture in the PRSR2 run at 120 h, Figure S39).

3. Discussion

In a previous study focused on the bioreactor cocultivation of filamentous microorganisms [20], it was demonstrated that the simultaneous inoculation of S. rimosus with the filamentous fungus A. terreus led to a state characterized by the inhibited growth of A. terreus and blocked production of fungal secondary metabolites. Giving A. terreus a 24-h growth advantage led to the opposite outcome, i.e., the fungus prevented S. rimosus from developing and producing its metabolites. In the present work, initiating the coculture by the simultaneous inoculation of S. rimosus and P. rubens resulted in P. rubens being outperformed by S. rimosus. Considering the results obtained for the cocultivation of A. terreus and S. rimosus [20], it was expected that providing an additional 24-h growth period for P. rubens would lead to a reversed outcome, i.e., the actinomycete being outperformed by the fungus. However, these predictions turned out to be incorrect. Although the presence of P. rubens biomass caused a delay in S. rimosus biomass development in the PRSR2 coculture, the actinomycete exhibited visible growth and biosynthetic activity, as illustrated by the morphological events that were monitored microscopically, and the chemical profiles reflected by the TICs. The propagation of S. rimosus was “awakened” in the mature stage of the PRSR2 coculture, and this event was accompanied by the triggered production of secondary metabolites, e.g., oxytetracycline, rimocidin, rimocidin B, rimosamide A, and turgichelin. This is a clear indication that the performance of P. rubens against S. rimosus was not comparable with the outcomes of the “A. terreus vs. S. rimosus” coculture. While the already-developed filamentous biomass of A. terreus greatly restricted the proliferation of S. rimosus and disabled its expansion [20], P. rubens was found to be far less effective in this respect. At this point, the question remained as to what would happen if P. rubens had even more time to establish its monoculture and generate higher cell densities before being confronted by S. rimosus. In response to this question, the study was further continued to include the PRSR3 process, in which the actinomycete was inoculated with a longer (i.e., 48-h) delay. We are not aware of any previous reports on the submerged cocultivation of filamentous species that addressed the impact of different inoculation delay times. The PRSR3 experiment clearly demonstrated that even after the prolonged period of undisturbed growth under monoculture conditions, P. rubens was as vulnerable to the proliferation of S. rimosus as it was in the PRSR2 run. Nevertheless, in the context of secondary metabolite production, changing the S. rimosus inoculation delay period from 24 h (in PRSR2) to 48 h (in PRSR3) was not without consequences. Two notable effects were the evident increase and decrease of rimocidin B and chrysogine levels, respectively. In the case of chrysogine, the metabolite of P. rubens was intriguing since applying the 48-h delay prevented the stimulatory effects that were witnessed when the 24-h delay was used. In other words, even though P. rubens had more time to develop before confronting S. rimosus in the PRSR3 coculture than in the PRSR2 coculture; the biosynthesis of chrysogine in the former process was definitely less efficient than that in the latter process. This shows that a given inoculation scheme leads to a unique set of cocultivation outcomes, which may be counterintuitive at times and always require experimental verification.
The “S. rimosus vs. P. rubens” cocultures were subjected to a multilevel analysis. The results describing the production metabolites, the utilization of sugars, and DO correlate well with the microscopic images, and the morphological analysis, including the microscopic analysis in the study, allowed for obtaining a broader perspective on the events taking place in the coculture. It was clear that S. rimosus managed to develop its biomass despite being inoculated into a 24-h or 48-h culture of P. rubens. However, it did not mean that the growth of S. rimosus influenced the coculture to such an extent that the coculture followed the bioprocess kinetics exhibited by the S. rimosus monoculture. This issue is perfectly illustrated by the time courses of lactose utilization. As opposed to the corresponding monoculture variants, the PRSR2 and PRSR3 cocultures did not show lactose consumption during the final two days of the run. This was also the time when the DO levels of the PRSR2 and PRSR3 cocultures were evidently higher than the values recorded in the monocultures. This demonstrates that the PRSR2 and PRSR3 cocultures had unique kinetic characteristics after the growth of S. rimosus and the production of its secondary metabolites had become visible. It also showed that sugar and oxygen utilization in cocultures cannot be predicted based on the values recorded for the monocultures.
A common observation regarding the DO profiles in the PRSR1, PRSR2, and PRSR3 cocultures was that during the final day of the process, the highest oxygen levels were always seen in the coculture, followed by the results recorded for the monoculture of S. rimosus and, finally, by the visibly lower (i.e., close to zero) values exhibited by the P. rubens monoculture. It is possible that the relatively high DO concentration during the final 2 days of the PRSR2 and PRSR3 cocultures contributed to the exceptionally high levels of rimocidin B and the “unnamed angucycline metabolite previously isolated from Streptomyces sp. QL37”. Even in the PRSR1 cocultivation, which resembled the monocultivation of S. rimosus in terms of the exhibited secondary metabolic repertoire and growth morphology, the DO level in the period from 144 to 168 h was clearly higher than that in the corresponding S. rimosus monoculture. Considering the fact that the production of two secondary metabolites of S. rimosus, namely, 2-acetyl-2-decarboxamido-oxytetracycline and the “unnamed angucycline metabolite previously isolated from Streptomyces sp. QL37”, was enhanced in the PRSR1 coculture relative to the S. rimosus monoculture, it was clear that P. rubens exerted observable effects on S. rimosus during cocultivation despite being outperformed and greatly inhibited. This observation is in agreement with our previous studies on S. rimosus. Briefly, it was demonstrated that if A. terreus [20] or S. noursei [19] were inoculated simultaneously with S. rimosus to initiate submerged coculture, their development was greatly inhibited by S. rimosus. At the same time, the outperformed microorganisms, i.e., A. terreus and S. noursei, influenced the growth and biosynthetic performance of S. rimosus during cocultivation, e.g., by affecting its ability to produce secondary metabolites [19,20]. The molecular details of such interactions, however, remain to be elucidated.
The investigation of coculture systems requires the viability and detectable activity of all involved species. In the studies centered on the production of secondary metabolites, one challenging aspect of such efforts is the adjustment of the inoculation scheme and/or process conditions to avoid the situation in which one of the microbial species is practically eliminated, and its biosynthetic repertoire cannot be explored. In this context, the control of population dynamics in submerged cocultures is highly desired [43,44,45]. The common difficulty associated with designing a bioreactor coculture is achieving a system that supports the growth and secondary metabolite production of all cocultivated microorganisms. In the “A. terreus vs. S. rimosus” coculture study [20], one of the microorganisms was always outperformed by its partner, so the spectrum of secondary metabolites in each bioprocess was limited. In other words, the species that was given a 24-h time advantage, either S. rimosus or A. terreus, did not allow for the accompanying microbe to reveal its true potential. In a different study [46], the simultaneous inoculation of A. terreus with the nystatin-producing actinomycete S. noursei allowed for, quite by chance, achieving a coculture that displays the secondary metabolic production of both involved species. However, this was not observed in the present work on P. rubens and S. rimosus. Introducing the spores of these species into the bioreactor at t = 0 h resulted in a coculture that practically displayed no production of fungal secondary metabolites. What happened to be an effective strategy, in this case, was to grant a less “aggressive” species, i.e., P. rubens, 24 or 48 h before inoculating the more “aggressive” microorganisms into the bioreactor. Here, the term “aggressiveness” can be understood as the ability of a given species to inhibit the development of the accompanying microbe in the coculture. It is associated with the biomass-specific growth rate, as well as with the bioactivity and quantity of secreted metabolites and enzymes. In contrast to what happened in the “A. terreus vs. S. rimosus” study, S. rimosus was able to adapt to the pressures exerted by P. rubens and entered the phases of submerged development in the PRSR2 and PRSR3 cocultures. The first success of the delayed inoculation approach was that the PRSR2 and PRSR3 broths contained the metabolites of both cocultivated species. Moreover, the production of several molecules was stimulated in the coculture relative to the monoculture, e.g., rimocidin B, 2-methylthio-cis-zeatin, and chrysogine. It should also be mentioned that some metabolites were found in the monocultures but were absent from the PRSR2 and PRSR3 cocultures, e.g., lucensomycin, spinoxazine, and cyclopiamide D. From a more general perspective, the results of the study indicate that inoculation delay may, in principle, be an effective strategy to enhance the production of target metabolites and, at the same time, inhibit the formation of unwanted molecules in submerged cocultures. However, if the goal is to observe the biosynthetic spectra of both cocultivated species, it is a prerequisite to have a sufficient difference between the two microbes in terms of their relative “aggressiveness”. For example, P. rubens did not manage to outperform S. rimosus inoculated after 24 or 48 h, but A. terreus was found to be able to do so [20]. Hence, inoculation delay can be a very effective method of coculture initiation, provided the delayed species is able to survive in the coculture, as was observed in the current work. This requires experiments to determine whether a given microbial pair behaves like the “A. terreus vs. S. rimosus” system or rather resembles the “P. rubens vs. S. rimosus” case.
Although S. rimosus eventually gained momentum in terms of growth and metabolite production in the PRSR2 and PRSR3 cocultures, it did not reveal the complete catalog of its metabolites that is normally found in monocultures. Specifically, the biosynthesis of lucensomycin and spinoxazine remained blocked throughout the cocultivation. This behavior can be explained by considering the levels of nutrients available to S. rimosus during cocultivation. Microbial secondary metabolism is known to respond to even the slightest changes in environmental conditions, including the availability of substrates [47]. Since P. rubens had a time advantage over S. rimosus in the PRSR2 and PRSR3 coculture runs, the consumption of substrates by the fungal mycelia could exert effects on the production of secondary metabolites by S. rimosus, i.e., the shutdown of lucensomycin and spinoxazine biosynthesis. Another possibility is that the inhibition of the metabolic activity of S. rimosus could be due to the chemical and physical interactions between the cocultivated species, e.g., through bioactive metabolites or cell-to-cell contact that triggered an intracellular regulatory response [48]. It is worth mentioning that the production of rimocidin B was enhanced due to cocultivation, as opposed to the case of the biosynthetically related molecule rimocidin. This demonstrates the fact that the response of a given biosynthetic pathway to cocultivation is not necessarily uniform. Hence, the coculture can be used to deregulate the pathways and stimulate the formation of metabolites that are normally generated at low yields. An interesting observation was made with regard to the formation of 2-methylthio-cis-zeatin. Its production was strongly enhanced in the PRSR2 coculture. In addition, it was the only metabolite biosynthesized by S. rimosus in the early phase of PRSR2 cocultivation, when P. rubens was still a dominant species. The results indicate that 2-methylthio-cis-zeatin was efficiently produced when S. rimosus was developing from its spores but not in the late phases of cultivation. According to Čihák et al. [49], who studied the formation of secondary metabolites by S. coelicolor during the germination phase, such “early growth stage” products may play a role in coordinating developmental events and repressing the competitive microbiota in the environmental niche.
It is important to note that the moment when S. rimosus growth became visible in the PRSR2 and PRSR3 cocultures was reflected by the time profiles of metabolite levels, i.e., the secondary metabolites of S. rimosus were practically not recorded before this characteristic time point. In the PRSR2 coculture, this behavior was observed at approximately 144 h, when considerable amounts of oxytetracycline, rimocidin, rimocidin B, and turgichelin were detected in the broth. If the same set of metabolites is considered to define this characteristic moment in the PRSR3 experiment, the onset of production corresponded to a time of approximately 168 h. This was expected, as the inoculation time of PRSR2 and PRSR3 with S. rimosus differed by 24 h. One may argue that the production of rimosamide A in PRSR2 and PRSR3 was visible one day before the time points given above; however, this was an exceptional case. Notably, the moment when S. rimosus growth became visible corresponded with the time when the levels of benzylpenicilloic acid, adenophostin B, and preaustinoid D, i.e., the metabolites originating from P. rubens, started to decline. The final confirmation of the characteristic time points was provided by the DO profiles. At approximately 144 and 168 h, the DO profiles of the PRSR2 and PRSR3 cocultures, respectively, started to exhibit their unique character and moved away from the curves recorded in the monocultures, especially the P. rubens variant. Notably, assigning a characteristic time point to the moment when S. rimosus propagation became visible should be regarded as a simplification used to describe and understand the events taking place in the coculture. Furthermore, it should be seen as the culmination of an ongoing process rather than a sudden event. The presence of 2-methylthio-cis-zeatin early in the PRSR2 coculture indicates that S. rimosus germinated long before 144 h, i.e., soon after its inoculation at 24 h. Its viability was also manifested by its influence on the levels of P. rubens metabolites over the course of the PRSR2 and PRSR3 cocultures. On the other hand, the proliferation of S. rimosus at the early phase of coculture was not sufficient to support the detectable production of oxytetracycline, rimocidin, and the remaining secondary metabolites of the biosynthetic landscape of this actinomycete.
For the PRSR2 coculture, the level of DO was close to zero from 48 to 120 h. Similar behavior was recorded for the PRSR3 coculture, where the DO was close to zero from 48 to 96 h. Then, the DO increased abruptly in PRSR2 and PRSR3 cocultures. This behavior was probably associated with the changing composition of microbial populations in the bioreactor. The period of very low DO levels corresponded to the time of intensive oxygen consumption by the biomass of P. rubens. When the development of S. rimosus biomass started to exert inhibitory effects on P. rubens, the DO levels in PRSR2 and PRSR3 cocultures started to increase as well. In other words, the consumption of oxygen by fungal biomass was weakened due to the increasing activity of S. rimosus in the coculture. At the same time, the development of S. rimosus in the late phase of PRSR2 and PRSR3 cocultures was not associated with intensive oxygen consumption since the DO levels gradually increased towards the end of the cocultivation. It should be pointed out that the conditions were not favorable for S. rimosus to proliferate, i.e., the fungal biomass and secondary metabolites were present in the bioreactor, and the levels of nutrients were not as high as in the fresh medium. It could be the reason why the development of S. rimosus in the late phase of PRSR2 and PRSR3 cocultures was accompanied by the increase in the DO levels. Finally, it should be noted that the current efforts were focused on monitoring the measurable effects of cocultivation, with a focus on secondary metabolite production, but the molecular details of microbial interactions and the mathematical consideration of population dynamics were beyond the scope of the study and need to be addressed in future experimental work.
The analysis of morphological parameters provided a quantitative description of the developmental events taking place in the cocultures. The comparison of projected area values was highly illustrative with regard to the fate of P. rubens pellets in the PRSR1, PRSR2, and PRSR3 runs. In the PRSR1 coculture, fungal pellets were noticed solely at 24 h of the process. After this time, the presence of P. rubens pellets was not recorded in the PRSR1 coculture. In the case of PRSR2, the emergence of S. rimosus biomass (hyphal fragments, clumps, and pellets) reflected the visible development of S. rimosus in the coculture. The pellets of P. rubens were detected throughout the PRSR2 coculture run; however, their projected area values were (with the exception of the data gathered at 24 h) clearly below those observed in the P. rubens monoculture. In contrast, the pellets of P. rubens that evolved in the PRSR3 coculture were comparable with the P. rubens monoculture values in terms of the projected area until 120 h of the run. Then, the coculture curve of the projected area values was clearly situated below the corresponding P. rubens monoculture curve. The time of S. rimosus inoculation delay affected the size of P. rubens pellets relative to the monoculture. In a more general context, this demonstrates that the change in secondary metabolite production due to the inoculation delay was accompanied by measurable morphological changes. To the best of our knowledge, this study was the second morphological analysis on filamentous cocultures in bioreactors. Previously, Ścigaczewska et al. [50] presented a similar characterization with regard to the “A. terreus vs. S. rimosus” cocultivation. Both studies demonstrate that the results of the quantitative morphological analysis are in agreement with the events related to the production of secondary metabolites and can be used to monitor and comparatively analyze the course of cocultivations in stirred tank bioreactors.
Performing microbial cocultivations aimed at secondary metabolite production is not a trivial task. This approach is associated with many bioprocess-related challenges and difficulties [45,51,52,53,54,55,56,57]. Most importantly, the differences in terms of growth rate often lead to a scenario in which a faster-growing species outcompetes its microbial partner, and, as a result, the metabolites of only one microorganism are produced in the system [51]. Inoculating the slower-growing species before a faster-growing species, as was done in the present study, is a way to prevent the elimination of the slower-growing microorganism in the coculture. The microbial population dynamics during cocultivation can also be influenced by the changes in medium osmolality, agitation conditions, or inoculum ratios [45]. Another important aspect of cocultivation is related to time. It was shown in the previously published studies [51,52,53,54] and in the present work as well that the levels of secondary metabolites depend on the time of growth of the cocultivated species. Analyzing time-series data is thus crucial to monitor the productivity of cocultures in terms of secondary metabolite levels. In the current work, it was exemplified by the fact that in the PRSR2 and PRSR3 experiments, the products of S. rimosus were typically found in the late phase of cocultivation. In a different study on fungal secondary metabolism, Bertrand et al. [51] reported that even though the levels of most investigated products increased over the course of the coculture, some of the compounds were detected solely at certain time points in time. In another work, Azzollini et al. [54] analyzed the dynamics of volatile and non-volatile secondary metabolite induction in fungal cocultures based on time-series data and described the characteristic induction patterns exhibited in fungal-fungal cocultivation systems. In metabolomic studies, the dynamics of metabolite production in the cocultures can be investigated with the aid of chemometric tools and computational approaches, such as ANOVA-PCA (Analysis of Variance—Principal Component Analysis) combined with POCHEMON (Projected Ortogonalized CHemical Encounter MONitoring) [53].
To conclude, the simultaneous inoculation of growth medium with the spores of S. rimosus and P. rubens results in a coculture dominated by the former species, i.e., the production of fungal secondary metabolites is practically nonexistent. In contrast, delaying the S. rimosus inoculation by 24 or 48 h relative to the inoculation of P. rubens leads to the active biosynthesis of secondary metabolites of both cocultivated species. This approach greatly affects the biosynthetic outcomes of the coculture, as illustrated by the increased levels of the metabolites tentatively identified as rimocidin B, 2-methylthio-cis-zeatin, chrysogine, benzylpenicilloic acid and preaustinoid D relative to the values recorded for the monocultures. The delayed inoculation of S. rimosus into the P. rubens culture did not prevent S. rimosus from developing and displaying its biosynthetic repertoire. The viability of S. rimosus, in this case, is reflected by the metabolic repertoire, morphological characteristics, and bioprocess kinetic data collected during the cocultivation. The results demonstrate that the delayed inoculation method is a highly promising approach for coculture initiation; however, its effectiveness is greatly dependent on the level of mutual “aggressiveness” displayed by the cocultured microorganisms.

4. Materials and Methods

4.1. Strains

Penicillium rubens ATCC 28089, and Streptomyces rimosus ATCC 10970 strains were purchased from the American Type Culture Collection (ATCC) and used throughout the study. P. rubens was stored on slants made from potato broth (300 g of potatoes boiled in 500 mL of water), glucose (20 g L−1), and agar (20 g L−1). S. rimosus was stored on agar slants according to the ATCC instructions.

4.2. Bioreactor Cultivation Runs

Three bioreactor experiments, referred to as PRSR1, PRSR2, and PRSR3, were carried out in the study. In each of them, three stirred tank BIOSTAT® B bioreactors (Sartorius, Germany) were used simultaneously. The inocula for the three bioreactors were as follows: 150 mL of P. rubens spore suspension (P. rubens monoculture bioreactor), 150 mL of S. rimosus spore suspension (S. rimosus monoculture bioreactor), and the combined spore suspensions (150 + 150 = 300 mL) of P. rubens and S. rimosus (coculture bioreactor). The working volume of each bioreactor was 5.5 L. The dissolved oxygen level was maintained at 20% and controlled in cascade by the airflow rate and stirring speed values. The minimum and maximum airflow rates were 1.5 L min−1 and 5.5 L min−1, respectively, while the minimum and maximum stirring speeds were 220 and 330 min−1, respectively. The experiments were performed in three replicates.

4.3. Coculture Initiation

P. rubens and S. rimosus were introduced into the bioreactors as spore suspensions that constituted the inocula. The concentration of spores in each inoculum was carefully controlled with the use of a Thoma chamber to reach the final concentration of spores in the bioreactor within the range from 9 × 10⁸ to 2 × 10⁹ spores per liter. The coculture initiation time depended on the experiment. In PRSR1, P. rubens and S. rimosus spores were introduced simultaneously. In PRSR2, the inoculation time of S. rimosus was delayed by 24 h relative to the inoculation of P. rubens. In PRSR3, the inoculation time of S. rimosus was delayed by 48 h relative to the inoculation of P. rubens. In each of the experiments, the inoculation of S. rimosus to initiate both its monoculture and coculture was carried out at the same moment.

4.4. Medium Composition

The initial composition of the medium in the three PRSR experiments was the same for each bioreactor (monocultures and cocultures). Glucose (10 g L−1) and lactose (40 g L−1) served as carbon sources. Yeast extract (10 g L−1) was used as a nitrogen source. Phenylacetic acid at 0.25 g L−1 was added to the medium as the precursor for penicillin G biosynthesis. The other ingredients in the medium were KH2PO4 1.51 g L−1, NaCl 0.4 g L−1, MgSO4·7H2O 0.5 g L−1, ZnSO4·7H2O 1 g L−1, Fe(NO3)3·9H2O 2 g L−1, and biotin 0.04 mg L−1. The trace element solution was added at a concentration of 1 mL L−1 and contained 50 mg L−1 MnSO4, 100 mg L−1 Na2B4O7·10H2O, 250 mg L−1 CuSO4·5H2O, and 50 mg L−1 Na2MoO4·H2O. The initial C/N ratio of the cultivation medium was equal to 21.8. The medium was sterilized at 121 °C.

4.5. Analytical Methods

Samples of the cultivation broth were drawn every 24 h during the experiment. The samples were filtered with Munktell filter discs (grade 389.84 g m−2, diameter 150 mm) and stored at −20 °C. The filter discs were dried at 110 °C and weighed on a laboratory balance before and after filtration. The weights were recorded to calculate the biomass concentration on a dry mass basis. Filtrate analysis was conducted by using ultrahigh-performance liquid chromatography (AQUITY-UPLC®) with the use of a BEH Shield RP18 column in reversed-phase (2.1 mm × 100 mm × 1.7 μm) paired with high-resolution mass spectrometry (ACQUITY–SYNAPT G2, Waters, Milford, MA, USA). The eluent flow rate was 0.2 mL min−1, and the column temperature was kept at 40 °C. The acetonitrile:water gradient (both acidified with formic acid 0.1% v/v) was as follows: 0.0–2.5 min, 0:100 (v/v); 2.5–3.5 min, 20:80 (v/v); 3.5–4.5 min, 30:70 (v/v); 4.5–6.8 min, 40:60 (v/v); 6.8–14.0 min, 60:40 (v/v).
The direct injection of the filtered supernatant was performed. Before injection, the samples were filtered with a 0.2 μm syringe filter. The monoisotopic masses of ions were investigated with mass spectrometry. Two ionization modes were used: positive (ESI+) and negative (ESI). The parameters of analysis were as follows: temperature of source of ions: 120 °C, desolvation temperature for ESI+: 200 °C, desolvation temperature for ESI: 400 °C, desolvation gas flow rate (nitrogen) for ESI+: 500 L h−1, desolvation gas flow rate (nitrogen) for ESI: 1000 L h−1, voltage on the capillary: 3 kV, sampling cone voltage: 40 V, extraction cone voltage: 4 V.
Identification was based on the monoisotopic value of m/z. The absolute error Δ(m/z) was determined by subtracting the theoretical m/z value from the experimental m/z value. It was assumed that the absolute error had to be lower than |±0.009|. The identification of metabolites was performed at four levels of confidence. The first level, applied in the cases of oxytetracycline and penicillin G, was the confirmation of identity with the use of purchased standards. The second level, applied in the cases of rimocidin, CE-108, rimocidin B, 2-acetyl-2-decarboxamido-oxytetracycline, rimosamide A, chrysogine and benzylpenicilloic acid, was based on the agreement of experimental m/z values with the ones exhibited by the secondary metabolites previously found in the same species (i.e., S. rimosus or P. rubens). The Natural Product Atlas [58] served as a reference database during the identification process. The third level encompassed the identifications based on the agreement of m/z values with the ones exhibited by the secondary metabolites previously found in the same genus (i.e., Streptomyces in the case of S. rimosus metabolites or Penicillium in the case of P. rubens metabolites). The fourth level, displaying the lowest level of confidence in the study, was applied only in the case of 2-methylthio-cis-zeatin, which was previously found in a microorganism belonging to the same class as Streptomyces, namely in Actinomycetia. In addition, the standard identification levels were reported according to the recommendations of the Metabolomics Standards Initiative [59]: Level 1 (“identified compounds”) was assigned for penicillin G and oxytetracycline (based on retention times, accurate m/z values and fragmentation patterns) and level 2 (“putatively annotated compounds”) was assigned for the remaining secondary metabolites.
Metabolites were investigated semiquantitatively by considering their peak areas of [M − H] and [M + H]+ ions. The results of the semiquantitative analysis, i.e., peak area values, were reported in “auxiliary units” (AU) and represented the absolute amounts of metabolites in the broth. The analysis was conducted with the use of TargetLynx (Waters, Version VMassLynx SCN781, Milford, MA, USA) software. For penicillin G and oxytetracycline, quantitative analysis was performed, and the concentration values were reported in “mg L−1” units. Standards of penicillin G (as potassium salt) and oxytetracycline (as hydrochloride) were purchased from Sigma-Aldrich (Burlington, MA, USA).
The glucose and lactose concentrations in the filtrates were investigated simultaneously with the use of ultrahigh-performance liquid chromatography (AQUITY-UPLC®) by applying a BEH Amide column in the normal phase (2.1 mm × 150 mm × 1.7 μm) paired with an Evaporative Light Scattering Detector (Waters, Waters, Milford, MA, USA). Carbohydrates were eluted with 75% acetonitrile dissolved in deionized water enriched with 0.2% triethylamine. The parameters of the analysis were as follows: eluent flow rate of 0.29 mL min−1, column temperature of 35 °C. The accuracy of carbohydrate analysis was ±0.85 g L−1. The sensitivity of the semiquantitative analysis was 10 auxiliary units (AU). This level allowed us to confirm the presence of a given secondary metabolite in the cultivation broth. PTC Mathcad 15 software was employed to calculate the volumetric uptake rates of glucose and lactose, rGLU, and rLAC, respectively, according to the following procedure. The concentration data were approximated with the use of the cubic b-spline function, and the smooth curves were then differentiated in time to determine the temporal changes in rGLU and rLAC.

4.6. Morphological Analysis

Microscopic observations and morphological analyses were carried out using an OLYMPUS BX53 microscope (Olympus Corporation, Tokyo, Japan) coupled with OLYMPUS cellSens Dimension Desktop 1.16 image analysis software (Olympus Corporation, Version 1.16, Tokyo, Japan). The values of the projected area (A), elongation (E), and morphology number (Mo) were obtained as previously described [41]. The mean values of morphological parameters and the corresponding confidence bands were calculated on the basis of at least 30 hyphal objects. Student’s t-distribution (significance level α = 0.05) was employed to determine the confidence bands.

4.7. Statistical Analysis

The data confidence function in OriginPro 2017 software (OriginLab, Version b9.4.1.354 SR1, Northampton, MA, USA) was employed to evaluate the replicability of the experimental results. This function provides the confidence interval for the mean value. A significance level of α = 0.05 was applied in the statistical calculations. The analysis of replicability was carried out by considering the levels of secondary metabolites produced by S. rimosus (Figure S1), the levels of P. rubens secondary metabolites (Figure S2), and the sugar concentration values (Figure S3) recorded in the bioreactor monocultures.

Supplementary Materials

The following supporting information can be downloaded at: https://www.mdpi.com/article/10.3390/molecules28166044/s1, Figures S1–S3: replicability analysis; Figures S4–S30: alignments of total ion chromatograms; Figures S31–S37: production profiles of secondary metabolites; Figures S38 and S39: time courses of morphological parameter values; Figure S40: selected microscopic images.

Author Contributions

T.B.: Conceptualization, Data curation, Formal analysis, Investigation, Methodology, Validation, Visualization, Writing—original draft. A.Ś.: Investigation, Methodology, Validation, Visualization. A.R.: Investigation, Validation. M.B.: Investigation, Methodology, Validation, Visualization, Writing—review and editing, Supervision. All authors have read and agreed to the published version of the manuscript.

Funding

The project was funded by the National Science Centre of the Republic of Poland, grant number 2017/27/B/NZ9/00534.

Institutional Review Board Statement

Not applicable.

Informed Consent Statement

Not applicable.

Data Availability Statement

The data used to support the findings of this study are available from the corresponding author upon request.

Conflicts of Interest

The authors declare no conflict of interest.

Sample Availability

Samples of the compounds and strains are available from the authors.

References

  1. Del Carratore, F.; Hanko, E.K.; Breitling, R.; Takano, E. Biotechnological application of Streptomyces for the production of clinical drugs and other bioactive molecules. Curr. Opin. Biotechnol. 2022, 77, 102762. [Google Scholar] [CrossRef]
  2. Seca, A.M.L.; Pinto, D.C.G.A. Biological Potential and Medical Use of Secondary Metabolites. Medicines 2019, 6, 66. [Google Scholar] [CrossRef] [PubMed] [Green Version]
  3. McClure, R.; Farris, Y.; Danczak, R.; Nelson, W.; Song, H.-S.; Kessell, A.; Lee, J.-Y.; Couvillion, S.; Henry, C.; Jansson, J.K.; et al. Interaction Networks Are Driven by Community-Responsive Phenotypes in a Chitin-Degrading Consortium of Soil Microbes. Msystems 2022, 7, e0037222. [Google Scholar] [CrossRef] [PubMed]
  4. Collinge, D.B.; Jensen, B.; Jørgensen, H.J. Fungal endophytes in plants and their relationship to plant disease. Curr. Opin. Microbiol. 2022, 69, 102177. [Google Scholar] [CrossRef]
  5. Beinart, R.A. The Significance of Microbial Symbionts in Ecosystem Processes. Msystems 2019, 4, e00127-19. [Google Scholar] [CrossRef] [PubMed] [Green Version]
  6. Demain, A.L.; Fang, A. The natural functions of secondary metabolites. Adv. Biochem. Eng. Biotechnol. 2000, 69, 1–39. [Google Scholar] [CrossRef]
  7. Bode, H.B.; Bethe, B.; Höfs, R.; Zeeck, A. Big effects from small changes: Possible ways to explore nature’s chemical diversity. ChemBioChem 2002, 3, 619–627. [Google Scholar] [CrossRef]
  8. Kim, J.H.; Lee, N.; Hwang, S.; Kim, W.; Lee, Y.; Cho, S.; Palsson, B.O.; Cho, B.K. Discovery of novel secondary metabolites encoded in actinomycete genomes through coculture. J. Ind. Microbiol. Biotechnol. 2021, 48, 1. [Google Scholar] [CrossRef]
  9. Wang, G.; Ran, H.; Fan, J.; Keller, N.P.; Liu, Z.; Wu, F.; Yin, W.B. Fungal-fungal cocultivation leads to widespread secondary metabolite alteration requiring the partial loss-of-function VeA1 protein. Sci. Adv. 2022, 8, 6094. [Google Scholar] [CrossRef]
  10. Arora, D.; Gupta, P.; Jaglan, S.; Roullier, C.; Grovel, O.; Bertrand, S. Expanding the chemical diversity through microorganisms co-culture: Current status and outlook. Biotechnol. Adv. 2020, 40, 107521. [Google Scholar] [CrossRef]
  11. Peng, X.Y.; Wu, J.T.; Shao, C.L.; Li, Z.Y.; Chen, M.; Wang, C.Y. Co-culture: Stimulate the metabolic potential and explore the molecular diversity of natural products from microorganisms. Mar. Life Sci. Technol. 2021, 3, 363–374. [Google Scholar] [CrossRef] [PubMed]
  12. Sonnenbichler, J.; Bliestle, I.M.; Peipp, H.; Holdenrieder, O. Secondary fungal metabolites and their biological activities, i. isolation of antibiotic compounds from cultures of Heterobasidion annosum synthesized in the presence of antagonistic fungi or host plant cells. Biol. Chem. Hoppe Seyler 1989, 370, 1295–1304. [Google Scholar] [CrossRef]
  13. Jomori, T.; Hara, Y.; Sasaoka, M.; Harada, K.; Setiawan, A.; Hirata, K.; Kimishima, A.; Arai, M. Mycobacterium smegmatis alters the production of secondary metabolites by marine-derived Aspergillus niger. J. Nat. Med. 2020, 74, 76–82. [Google Scholar] [CrossRef] [PubMed]
  14. Luti, K.J.K.; Mavituna, F. Elicitation of Streptomyces coelicolor with E. coli in a bioreactor enhances undecylprodigiosin production. Biochem. Eng. J. 2011, 53, 281–285. [Google Scholar] [CrossRef]
  15. Fierro, F.; Vaca, I.; Castillo, N.I.; García-Rico, R.O.; Chávez, R. Penicillium chrysogenum, a Vintage Model with a Cutting-Edge Profile in Biotechnology. Microorganisms 2022, 10, 573. [Google Scholar] [CrossRef] [PubMed]
  16. Boruta, T.; Milczarek, I.; Bizukojc, M. Evaluating the outcomes of submerged co-cultivation: Production of lovastatin and other secondary metabolites by Aspergillus terreus in fungal co-cultures. Appl. Microbiol. Biotechnol. 2019, 103, 5593–5605. [Google Scholar] [CrossRef] [PubMed] [Green Version]
  17. Boruta, T.; Marczyk, A.; Rychta, K.; Przydacz, K.; Bizukojc, M. Confrontation between Penicillium rubens and Aspergillus terreus: Investigating the production of fungal secondary metabolites in submerged co-cultures. J. Biosci. Bioeng. 2020, 130, 503–513. [Google Scholar] [CrossRef]
  18. Petkovic, H.; Lukežic, T.; Šuškovic, J. Biosynthesis of oxytetracycline by Streptomyces rimosus: Past, present and future directions in the development of tetracycline antibiotics. Food Technol. Biotechnol. 2017, 55, 3–13. [Google Scholar] [CrossRef]
  19. Boruta, T.; Ścigaczewska, A. Enhanced oxytetracycline production by Streptomyces rimosus in submerged co-cultures with Streptomyces noursei. Molecules 2021, 26, 6036. [Google Scholar] [CrossRef]
  20. Boruta, T.; Ścigaczewska, A.; Bizukojć, M. “Microbial Wars” in a Stirred Tank Bioreactor: Investigating the Co-Cultures of Streptomyces rimosus and Aspergillus terreus, Filamentous Microorganisms Equipped With a Rich Arsenal of Secondary Metabolites. Front. Bioeng. Biotechnol. 2021, 9, 713639. [Google Scholar] [CrossRef]
  21. Zygmunt, W.A. Oxytetracycline Formation by Streptomyces rimosus in Chemically Defined Media. Appl. Microbiol. 1961, 9, 502–507. [Google Scholar] [CrossRef] [PubMed]
  22. Zhao, Y.; Song, Z.; Ma, Z.; Bechthold, A.; Yu, X. Sequential improvement of rimocidin production in Streptomyces rimosus M527 by introduction of cumulative drug-resistance mutations. J. Ind. Microbiol. Biotechnol. 2019, 46, 697–708. [Google Scholar] [CrossRef]
  23. Seco, E.M.; Pérez-Zúñiga, F.J.; Rolón, M.S.; Malpartida, F. Starter unit choice determines the production of two tetraene macrolides, rimocidin and CE-108, in Streptomyces diastaticus var. 108. Chem. Biol. 2004, 11, 357–366. [Google Scholar] [CrossRef] [PubMed] [Green Version]
  24. Seco, E.M.; Cuesta, T.; Fotso, S.; Laatsch, H.; Malpartida, F. Two polyene amides produced by genetically modified Streptomyces diastaticus var. 108. Chem. Biol. 2005, 12, 535–543. [Google Scholar] [CrossRef] [PubMed] [Green Version]
  25. Takiguchi, Y.; Terao, M.; Mishima, H.; Okuda, M.; Aoki, A.; Fukuda, R. Milbemycins, a new family of macrolide antibiotics: Fermentation, isolation and physico-chemical properties. J. Antibiot. 1980, 33, 1120–1127. [Google Scholar] [CrossRef] [Green Version]
  26. Kodani, S.; Bicz, J.; Song, L.; Deeth, R.J.; Ohnishi-Kameyama, M.; Yoshida, M.; Ochi, K.; Challis, G.L. Structure and biosynthesis of scabichelin, a novel tris-hydroxamate siderophore produced by the plant pathogen Streptomyces scabies 87.22. Org. Biomol. Chem. 2013, 11, 4686–4694. [Google Scholar] [CrossRef] [Green Version]
  27. Armstrong, D.J.; Scarbrough, E.; Skoog, F.; Cole, D.L.; Leonard, N.J. Cytokinins in Corynebacterium fascians Cultures. Plant Physiol. 1976, 58, 749–752. [Google Scholar] [CrossRef] [Green Version]
  28. McClure, R.A.; Goering, A.W.; Ju, K.S.; Baccile, J.A.; Schroeder, F.C.; Metcalf, W.W.; Thomson, R.J.; Kelleher, N.L. Elucidating the Rimosamide-Detoxin Natural Product Families and Their Biosynthesis Using Metabolite/Gene Cluster Correlations. ACS Chem. Biol. 2016, 11, 11–3452. [Google Scholar] [CrossRef] [PubMed] [Green Version]
  29. Manwaring, D.G.; Rickards, R.W.; Gaudiano, G.; Nicolella, V. The biosynthesis of the macrolide antibiotic lucensomycin. J. Antibiot. 1969, 22, 545–550. [Google Scholar] [CrossRef] [PubMed] [Green Version]
  30. Fu, P.; La, S.; MacMillan, J.B. 1,3-Oxazin-6-one Derivatives and Bohemamine-Type Pyrrolizidine Alkaloids from a Marine-Derived Streptomyces spinoverrucosus. J. Nat. Prod. 2016, 79, 455–462. [Google Scholar] [CrossRef]
  31. Wu, C.; van der Heul, H.U.; Melnik, A.V.; Lübben, J.; Dorrestein, P.C.; Minnaard, A.J.; Choi, Y.H.; van Wezel, G.P. Lugdunomycin, an Angucycline-Derived Molecule with Unprecedented Chemical Architecture. Angew. Chemie Int. Ed. 2019, 58, 2809–2814. [Google Scholar] [CrossRef] [PubMed] [Green Version]
  32. Hochstein, F.A.; von Wittenau, M.S.; Tanner, F.W.; Murai, K. 2-Acetyl-2-decarboxamidoöxytetracycline. J. Am. Chem. Soc. 1960, 82, 5934–5937. [Google Scholar] [CrossRef]
  33. Shang, N.N.; Zhang, Z.; Huang, J.P.; Wang, L.; Luo, J.; Yang, J.; Peng, T.; Yan, Y.; Ma, Y.T.; Huang, S.X. Glycosylated piericidins from an endophytic Streptomyces with cytotoxicity and antimicrobial activity. J. Antibiot. 2018, 71, 672–676. [Google Scholar] [CrossRef]
  34. Houbraken, J.; Frisvad, J.C.; Samson, R.A. Fleming’s penicillin producing strain is not Penicillium chrysogenum but P. rubens. IMA Fungus. 2011, 2, 87–95. [Google Scholar] [CrossRef] [Green Version]
  35. Seifar, R.M.; Zhao, Z.; van Dam, J.; van Winden, W.; van Gulik, W.; Heijnen, J.J. Quantitative analysis of metabolites in complex biological samples using ion-pair reversed-phase liquid chromatography-isotope dilution tandem mass spectrometry. J. Chromatogr. A 2008, 1187, 103–110. [Google Scholar] [CrossRef] [PubMed]
  36. Viggiano, A.; Salo, O.; Ali, H.; Szymanski, W.; Lankhorst, P.P.; Nygård, Y.; Bovenberg, R.A.L.; Driessen, A.J.M. Pathway for the biosynthesis of the pigment chrysogine by Penicillium chrysogenum. Appl. Environ. Microbiol. 2018, 84, e02246-17. [Google Scholar] [CrossRef] [Green Version]
  37. Masaaki, T.; Takeshi, K.; Tsuyoshi, H.; Shuji, T. Adenophostins A And B: Potent Agonists of Inositol- 1,4,5-Trisphosphate Receptor Producedby Penicillium brevicompactum Taxonomy, Fermentation, Isolation, Physico-Chemical and Biological Properties. J. Antibiot. 1993, 46, 1643–1647. [Google Scholar] [CrossRef] [Green Version]
  38. Xu, X.; Zhang, X.; Nong, X.; Wei, X.; Qi, S. Oxindole alkaloids from the fungus Penicillium commune DFFSCS026 isolated from deep-sea-derived sediments. Tetrahedron 2015, 71, 610–615. [Google Scholar] [CrossRef]
  39. Duan, R.; Zhou, H.; Yang, Y.; Li, H.; Dong, J.; Li, X.; Chen, G.; Zhao, L.; Ding, Z. Antimicrobial meroterpenoids from the endophytic fungus Penicillium sp. T2-8 associated with Gastrodia elata. Phytochem. Lett. 2016, 18, 197–201. [Google Scholar] [CrossRef]
  40. Li, Y.; Lee, S.R.; Han, E.J.; Seyedsayamdost, M.R. Momomycin, an Antiproliferative Cryptic Metabolite from the Oxytetracycline Producer Streptomyces rimosus. Angew. Chem. Int. Ed. Engl. 2022, 61, e202208573. [Google Scholar] [CrossRef]
  41. Kowalska, A.; Boruta, T.; Bizukojć, M. Morphological evolution of various fungal species in the presence and absence of aluminum oxide microparticles: Comparative and quantitative insights into microparticle-enhanced cultivation (MPEC). Microbiologyopen 2018, 7, e00603. [Google Scholar] [CrossRef]
  42. Wucherpfennig, T.; Hestler, T.; Krull, R. Morphology engineering—Osmolality and its effect on Aspergillus niger morphology and productivity. Microb. Cell Fact. 2011, 10, 58. [Google Scholar] [CrossRef] [PubMed] [Green Version]
  43. Palacio-Barrera, A.M.; Schlembach, I.; Finger, M.; Büchs, J.; Rosenbaum, M.A. Reliable online measurement of population dynamics for filamentous co-cultures. Microb. Biotechnol. 2022, 15, 2773–2785. [Google Scholar] [CrossRef] [PubMed]
  44. Schlembach, I.; Grünberger, A.; Rosenbaum, M.A.; Regestein, L. Measurement Techniques to Resolve and Control Population Dynamics of Mixed-Culture Processes. Trends Biotechnol. 2021, 39, 1093–1109. [Google Scholar] [CrossRef] [PubMed]
  45. Finger, M.; Palacio-Barrera, A.M.; Richter, P.; Schlembach, I.; Rosenbaum, M.A. Tunable population dynamics in a synthetic filamentous co-culture. Microbiologyopen 2022, 11, e1324. [Google Scholar] [CrossRef]
  46. Boruta, T.; Ścigaczewska, A.; Bizukojć, M. Production of secondary metabolites in stirred tank bioreactor co-cultures of Streptomyces noursei and Aspergillus terreus. Front. Bioeng. Biotechnol. 2022, 10, 1011220. [Google Scholar] [CrossRef]
  47. Brakhage, A.A. Regulation of fungal secondary metabolism. Nat. Rev. Microbiol. 2013, 11, 21–32. [Google Scholar] [CrossRef]
  48. Liu, C.; Kakeya, H. Cryptic Chemical Communication: Secondary Metabolic Responses Revealed by Microbial Co-culture. Chem. Asian J. 2020, 15, 327–337. [Google Scholar] [CrossRef]
  49. Čihák, M.; Kameník, Z.; Šmídová, K.; Bergman, N.; Benada, O.; Kofronová, O.; Petrícková, K.; Bobek, J. Secondary metabolites produced during the germination of Streptomyces coelicolor. Front. Microbiol. 2017, 8, 2495. [Google Scholar] [CrossRef] [Green Version]
  50. Ścigaczewska, A.; Boruta, T.; Bizukojć, M. Quantitative Morphological Analysis of Filamentous Microorganisms in Cocultures and Monocultures: Aspergillus terreus and Streptomyces rimosus Warfare in Bioreactors. Biomolecules 2021, 11, 1740. [Google Scholar] [CrossRef]
  51. Bertrand, S.; Azzollini, A.; Schumpp, O.; Bohni, N.; Schrenzel, J.; Monod, M.; Gindro, K.; Wolfender, J.L. Multi-well fungal co-culture for de novo metabolite-induction in time-series studies based on untargeted metabolomics. Mol. Biosyst. 2014, 10, 2289–2298. [Google Scholar] [CrossRef]
  52. Choi, J.N.; Kim, J.; Lee, M.Y.; Park, D.K.; Hong, Y.S.; Lee, C.H. Metabolomics revealed novel isoflavones and optimal cultivation time of Cordyceps militaris fermentation. J. Agric. Food Chem. 2010, 58, 4258–4267. [Google Scholar] [CrossRef] [PubMed]
  53. Geurts, B.P.; Neerincx, A.H.; Bertrand, S.; Leemans, M.A.A.P.; Postma, G.J.; Wolfender, J.L.; Cristescu, S.M.; Buydens, L.M.C.; Jansen, J.J. Combining ANOVA-PCA with POCHEMON to analyse micro-organism development in a polymicrobial environment. Anal. Chim. Acta 2017, 963, 1–16. [Google Scholar] [CrossRef] [PubMed]
  54. Azzollini, A.; Boggia, L.; Boccard, J.; Sgorbini, B.; Lecoultre, N.; Allard, P.M.; Rubiolo, P.; Rudaz, S.; Gindro, K.; Bicchi, C.; et al. Dynamics of metabolite induction in fungal co-cultures by metabolomics at both volatile and non-volatile levels. Front. Microbiol. 2018, 9, 326597. [Google Scholar] [CrossRef] [Green Version]
  55. Fajardo-Hernández, C.A.; Khan, F.S.T.; Flores-Bocanegra, L.; Prieto-Davó, A.; Wan, B.; Ma, R.; Qader, M.; Villanueva-Silva, R.; Martínez-Cárdenas, A.; López-Lobato, M.A.; et al. Insights into the Chemical Diversity of Selected Fungi from the Tza Itzá Cenote of the Yucatan Peninsula. ACS Omega 2022, 7, 12171–12185. [Google Scholar] [CrossRef]
  56. Berry, O.; Briand, E.; Bagot, A.; Chaigné, M.; Meslet-Cladière, L.; Wang, J.; Grovel, O.; Jansen, J.J.; Ruiz, N.; Pont, T.R.D.; et al. Deciphering interactions between the marine dinoflagellate Prorocentrum lima and the fungus Aspergillus pseudoglaucus. Environ. Microbiol. 2023, 25, 250–267. [Google Scholar] [CrossRef]
  57. da Costa Stuart, A.K.; Furuie, J.L.; Cataldi, T.R.; Stuart, R.M.; Zawadneak, M.A.C.; Labate, C.A.; Pimentel, I.C. Fungal consortium of two Beauveria bassiana strains increases their virulence, growth, and resistance to stress: A metabolomic approach. PLoS ONE 2022, 17, e0271460. [Google Scholar] [CrossRef]
  58. Van Santen, J.A.; Poynton, E.F.; Iskakova, D.; Mcmann, E.; Alsup, T.A.; Clark, T.N.; Fergusson, C.H.; Fewer, D.P.; Hughes, A.H.; Mccadden, C.A.; et al. The Natural Products Atlas 2.0: A database of microbially-derived natural products. Nucleic Acids Res. 2022, 50, D1317–D1323. [Google Scholar] [CrossRef] [PubMed]
  59. Sumner, L.W.; Amberg, A.; Barrett, D.; Beale, M.H.; Beger, R.; Daykin, C.A.; Fan, T.W.M.; Fiehn, O.; Goodacre, R.; Griffin, J.L.; et al. Proposed minimum reporting standards for chemical analysis: Chemical Analysis Working Group (CAWG) Metabolomics Standards Initiative (MSI). Metabolomics 2007, 3, 211–221. [Google Scholar] [CrossRef] [Green Version]
Figure 1. Production profiles of secondary metabolites biosynthesized by S. rimosus in mono- and cocultures over the course of the PRSR1, PRSR2, and PRSR3 experiments, namely, oxytetracycline (a) and the metabolites tentatively identified as rimocidin (b), rimocidin B (c), unnamed angucycline from Streptomyces sp. QL37 (d), turgichelin (e), 2-methylthio-cis-zeatin (f), rimosamide A (g), lucensomycin (h), and spinoxazine A (i). The mean values from three replicates are shown with error bars representing ± standard deviation. AU-auxiliary units.
Molecules 28 06044 g001
Figure 2. Production profiles of secondary metabolites biosynthesized by P. rubens in mono- and cocultures over the course of the PRSR1, PRSR2, and PRSR3 experiments, namely, penicillin G (a) and the metabolites tentatively identified as chrysogine (b), benzylpenicilloic acid (c), adenophostin B (d), cyclopiamide D (e), and preaustinoid D (f). The mean values from three replicates are shown with error bars representing ±standard deviation. AU-auxiliary units.
Molecules 28 06044 g002
Figure 3. Dissolved oxygen (DO) levels in the monocultures and cocultures of S. rimosus and P. rubens over the course of the PRSR1 (a), PRSR2 (b), and PRSR3 (c) experiments. The time of S. rimosus inoculation is depicted by an arrow.
Molecules 28 06044 g003
Figure 4. Levels of carbon substrates (glucose and lactose) in the monocultures and cocultures of S. rimosus and P. rubens over the course of the PRSR1 (a), PRSR2 (b), and PRSR3 (c) experiments. The time of S. rimosus inoculation is depicted by an arrow. The mean values from three replicates are shown with error bars representing ± standard deviation. GLU—glucose; LAC—lactose.
Molecules 28 06044 g004
Figure 5. Volumetric uptake rates of glucose rGLU and lactose rLAC in the monocultures and cocultures of S. rimosus and P. rubens over the course of the PRSR1 (a), PRSR2 (b), and PRSR3 (c) experiments. The time of S. rimosus inoculation is depicted by an arrow. GLU—glucose; LAC—lactose.
Molecules 28 06044 g005
Figure 6. Projected area (A) of fully evolved pellets and hyphal fragments and clumps in the monocultures and cocultures of S. rimosus and P. rubens over the course of the PRSR1 (a), PRSR2 (b), and PRSR3 (c) experiments. The time of S. rimosus inoculation is depicted by an arrow. The mean values calculated for at least 30 morphological objects and the confidence bands (significance level α = 0.05) are depicted.
Molecules 28 06044 g006
Table 1. Secondary metabolites of S. rimosus and P. rubens identified or putatively annotated in the study.
Ionization(m/z)experimentalRetention Time (min)Suggested Secondary
Metabolite
Formula of Suggested Metabolite (Ionized)(m/z)theoreticalAbsolute
Error Δ(m/z)
Microbial SourceLevel of
Metabolite Identification
ESI459.14274.33Oxytetracycline [21]C22H23N2O9459.1404+0.0023S. rimosusidentified
ESI766.39905.91Rimocidin [22]C39H60NO14766.4014−0.0024S. rimosusputatively annotated
ESI738.36355.46CE-108 [23]C37H56NO14738.3701−0.0066S. rimosusputatively annotated
ESI765.41895.78Rimocidin B [24]C39H61N2O13765.4174+0.0015S. rimosusputatively annotated
ESI752.38795.68Rimocidin (27-ethyl) [20]C38H58NO14752.3857+0.0022S. rimosusputatively annotated
ESI527.29935.70Milbemycin A3 [25]C31H43O7527.3009−0.0016S. rimosusputatively annotated
ESI591.28236.15Milbemycin A3 + [4O] [20]C31H43O11591.2805+0.0018S. rimosusputatively annotated
ESI593.30386.67Milbemycin β11 + [4O] [20]C31H45O11593.2962+0.0076S. rimosusputatively annotated
ESI619.31036.91Turgichelin [26]C24H43N8O11619.3051−0.0052S. rimosusputatively annotated
ESI264.08594.952-Methylthio-cis-zeatin [27]C11H14N5OS264.0919−0.0060S. rimosusputatively annotated
ESI603.30225.29Rimosamide A [28]C30H43N4O9603.3030−0.0008S. rimosusputatively annotated
ESI+708.36665.23Lucensomycin [29]C36H54NO13708.3595+0.0071S. rimosusputatively annotated
ESI263.10644.68Spinoxazine A [30]C13H15N2O4263.1032+0.0032S. rimosusputatively annotated
ESI384.11614.95Unnamed angucycline metabolite previously isolated from Streptomyces sp. QL37 [31]C20H18O7N384.1083+0.0078S. rimosusputatively annotated
ESI458.14094.682-Acetyl-2-decarboxamido-oxytetracycline (ADOTC) [32]C23H24NO9458.1451−0.0042S. rimosusputatively annotated
ESI724.35255.247-Demethyl-glucopiericidin A [33]C36H54NO14724.3544-0.0019S. rimosusputatively annotated
ESI333.09286.47Penicillin G [34]C16H17N2O4S333.0909+0.0019P. rubensidentified
ESI351.09895.72Benzylpenicilloic acid [35]C16H19N2O5S351.1015-0.0026P. rubensputatively annotated
ESI189.07564.72Chrysogine [36]C10H9N2O2189.0665+0.0091P. rubensputatively annotated
ESI710.04644.86Adenophostin B [37]C18H27N5O19P3710.0513−0.0049P. rubensputatively annotated
ESI335.10426.48Cyclopiamide D [38]C19H15N2O4335.1031+0.0011P. rubensputatively annotated
ESI491.26448.30Preaustinoid D [39]C27H39O8491.2645−0.0001P. rubensputatively annotated
Disclaimer/Publisher’s Note: The statements, opinions and data contained in all publications are solely those of the individual author(s) and contributor(s) and not of MDPI and/or the editor(s). MDPI and/or the editor(s) disclaim responsibility for any injury to people or property resulting from any ideas, methods, instructions or products referred to in the content.

