
A New Method for Determining the Embedding Dimension of Financial Time Series Based on Manhattan Distance and Recurrence Quantification Analysis
Abstract
:1. Introduction
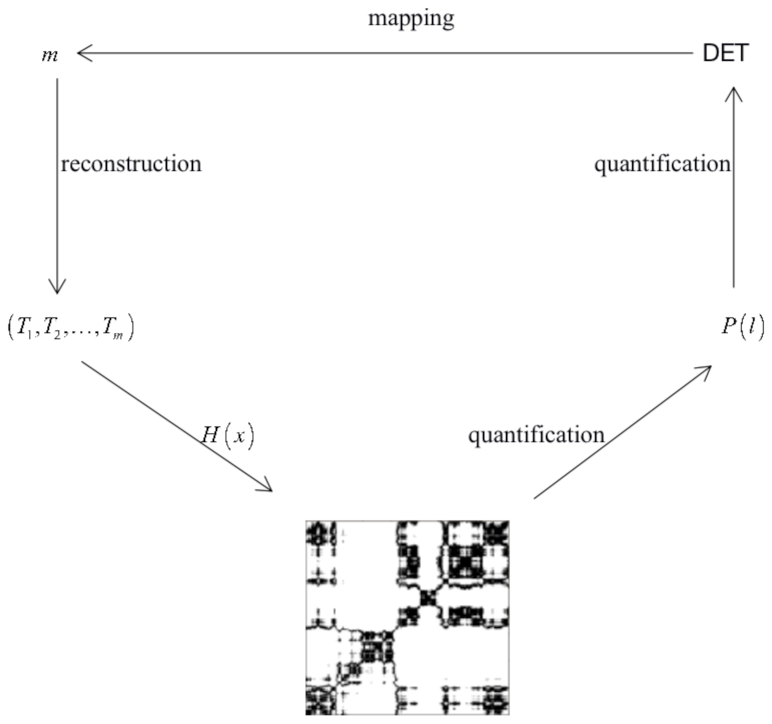
2. Methodology
2.1. Indicator 1
2.2. Indicator 2
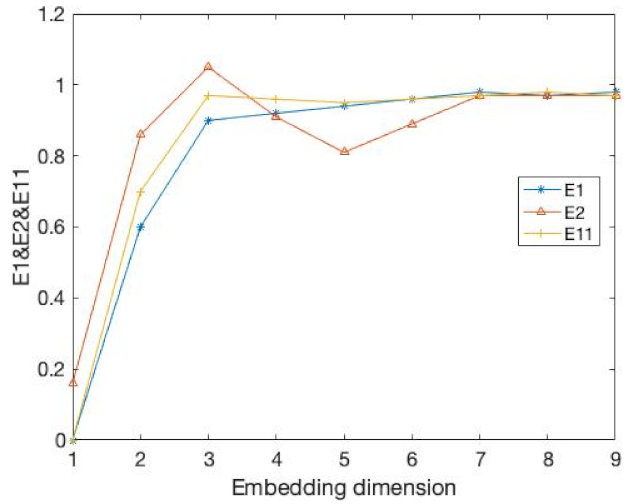
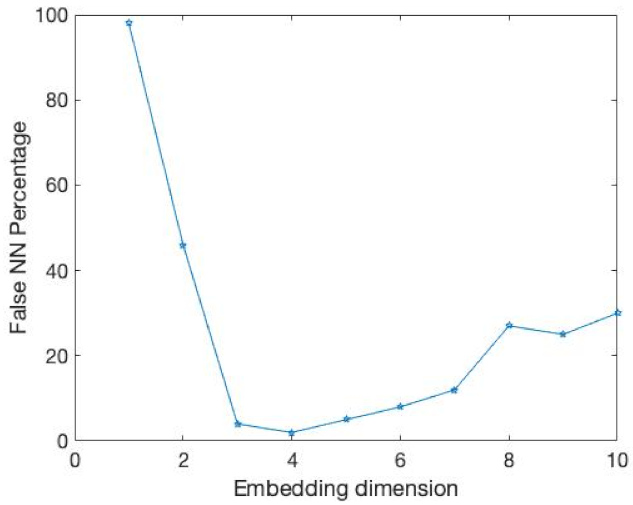
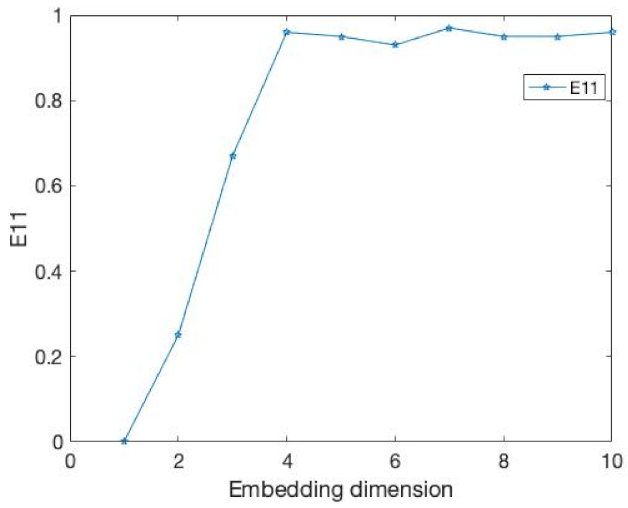
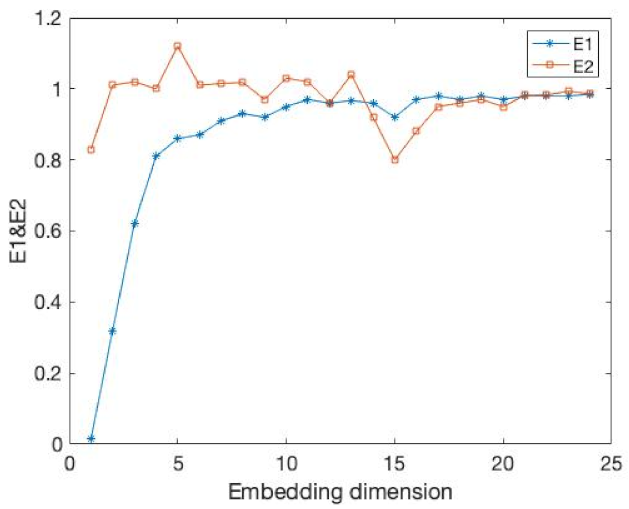
3. Experiment of Normal Examples
4. Conclusions
Author Contributions
Funding
Conflicts of Interest
References
- Takens, F. Detecting strange attractors in turbulence. LNM 1981, 898, 366–381. [Google Scholar]
- Sun, B.J.; Li, M.; Zhang, F.F. The characteristics and self-time-delay synchronization of two-time-delay complex Lorenz system. J. Franklin Inst. 2019, 356, 334–350. [Google Scholar] [CrossRef]
- Bhavsar, R.; Davey, N.; Helian, N. Time Series Analysis using Embedding Dimension on Heart Rate Variability. Procedia Comput. Sci. 2018, 145, 89–96. [Google Scholar] [CrossRef]
- Jazayeri, M.; Ostojic, S. Interpreting neural computations by examining intrinsic and embedding dimensionality of neural activity. Curr. Opin. Neurobiol. 2021, 70, 113–120. [Google Scholar] [CrossRef] [PubMed]
- Li, D.Y.; Cao, M.S. A novel embedding method for characterization of low-dimensional nonlinear dynamical systems. Nonlinear Dyn. 2021, 104, 125–148. [Google Scholar] [CrossRef]
- Sugihara, G.; May, R.M. Applications of Fractals in Ecology. TREE 1990, 5, 79–86. [Google Scholar] [CrossRef]
- Machado, J.A.T. Relativistic time effects in financial dynamics. Nonlinear Dyn. 2014, 75, 735–744. [Google Scholar] [CrossRef]
- Machado, J.A.T.; Duarte, F.B.; Duarte, G.M. Analysis of financial data series using fractional Fourier transform and multidimensional scaling. Nonlinear Dyn. 2011, 65, 235–245. [Google Scholar] [CrossRef]
- Zhou, Q.; Zhu, Z.; Xian, G. A novel regression method for harmonic analysis of time series. ISPRS J. Photogramm. Remote Sens. 2022, 185, 48–61. [Google Scholar] [CrossRef]
- Karlaftis, M.G.; Vlahogianni, E.I. Memory properties and fractional integration in transportation time-series. TR_C 2009, 17, 444–453. [Google Scholar] [CrossRef]
- Zolotova, N.V.; Ponyavin, D.L. Phase asynchrony of the north-south sunspot activity. Astron. Astrophys. 2006, 449, L1–L4. [Google Scholar] [CrossRef] [Green Version]
- Liu, W.; Wang, D.Z.; Chen, Z.H. Recurrence plot-based dynamic analysis on electrochemical noise of the evolutive corrosion process. Corros. Sci. 2017, 124, 93–102. [Google Scholar] [CrossRef]
- King, G.P.; Stewart, L. Phase space reconstruction for symmetric dynamical systems. Physica D 1992, 58, 216–228. [Google Scholar] [CrossRef]
- Atay, F.M.; Yurtsever, E. Phase-space reconstruction in Hamiltonian systems through multiple time series. Chem. Phys. Lett. 1997, 276, 282–288. [Google Scholar] [CrossRef]
- Wallot, S.; Monster, D. Calculation of average mutual information (AMI) and false-nearest neighbors (FNN) for the estimation of embedding parameters of multidimensional time series in matlab. Front. Psychol. 2018, 9, 1–10. [Google Scholar]
- Kennel, M.B.; Brown, R.; Abarbanel, H.D.I. Determine embedding dimension for phase-space reconstruction using a geometrical construction. Phys. Rev. A 1992, 45, 3403–3411. [Google Scholar] [CrossRef] [PubMed]
- Cao, L.Y. Practical method for determining the minimum embedding dimension of a scalar time series. Physica D 1997, 110, 43–50. [Google Scholar] [CrossRef]
- Eckmann, J.P.; Kamphorst, S.O.; Ruelle, D. Recurrence plots of dynamical systems. Europhys. Lett. 1987, 4, 973–977. [Google Scholar] [CrossRef]
- Meng, X.J.; Qiu, S.; Wan, S.H. A motor imagery EEG signal classification algorithm based on recurrence plot convolution neural network. Pattern Recognit. Lett. 2021, 146, 134–141. [Google Scholar] [CrossRef]
- Kok, T.L.; Aldrich, C. Analysis of Electrochemical Noise for Corrosion Type Identification by Use of Global Recurrence Plots and Texture Analysis. IFAC-Pap. OnLine 2019, 52, 36–41. [Google Scholar] [CrossRef]
- Webber, C.L., Jr.; Marwan, N. Recurrence Quantification Analysis-Theory and Best Practices; Springer: Berlin/Heidelberg, Germany, 2015. [Google Scholar]
- Wallot, S. Multidimensional cross-recurrence quantification analysis (MDCRQA)—A method for quantifying correlation between multivariate time-series. Multivar. Behav. Res. 2019, 54, 173–191. [Google Scholar] [CrossRef] [PubMed]
- Xu, M.; Shang, P.J.; Lin, A.J. Multiscale recurrence quantification analysis of order recurrence plot. Physica A 2017, 469, 381–389. [Google Scholar] [CrossRef]
- Marwan, N.; Wessel, M.; Kurths, J. Recurrence Plot Based Measures of Complexity and its Application to Heart Rate Variability Data. Phys. Rev. E 2002, 66, 381–389. [Google Scholar] [CrossRef] [PubMed]
- Belaire, J.; Contreras, D.; Tordera, L. Assessing nonlinear structures in real exchange rates using recurrence plot strategies. Physica D 2002, 171, 249–264. [Google Scholar] [CrossRef]
- Yao, C.Z.; Lin, Q.W. Recurrecnce plots analysis of the CNY exchange markets based on phase space reconstruction. N. Am. J. Econ. Financ. 2017, 42, 584–596. [Google Scholar] [CrossRef]
- Yin, Y.; Shang, P.J. Multiscale recurrence plot and recurrence quantification analysis for financial time series. Nonlinear Dyn. 2016, 85, 2309–2352. [Google Scholar] [CrossRef]
- Afonso, L.C.S.; Rosa, G.H.; Pereira, C.R.; Weber, S.A.T.; Hook, C.; Albuquerque, V.H.C.; Papa, J.P. A recurrence plot-based approach for Parkinson’s disease identification. Future Gener. Comput. Syst. 2019, 94, 282–292. [Google Scholar] [CrossRef]
- Zbilut, J.P.; Webber, C.L. Embeddings and delays as derived from quantification of recurrence plots. Phys. Lett. A 1992, 171, 199–203. [Google Scholar] [CrossRef]
- Tielen, G.J.; Luek, T.; Kuzma, M. The role of Manhattan distance in antiferromagnetic ordering. Physica A 1997, 246, 199–220. [Google Scholar] [CrossRef]
- Gueye, S.; Michelon, P. A linear formulation withvarianles for quadratic assignment problems with Manhattan distance matrices. EURO J. Comput. 2015, 3, 79–110. [Google Scholar] [CrossRef]
- Blackburn, S.R.; Homberger, C.; Winkler, P. The minimum Manhattan distance and minimum jump of permutations. J. Comb. Theory Ser. A 2019, 161, 364–386. [Google Scholar] [CrossRef]
- Neyman, S.N.; Sitohang, B.; Sutiusna, S. Reversible Fragile Watermarking based on Difference Expansion Using Manhattan Distances for 2D Vector Map. Procedia Technol. 2013, 11, 614–620. [Google Scholar] [CrossRef] [Green Version]


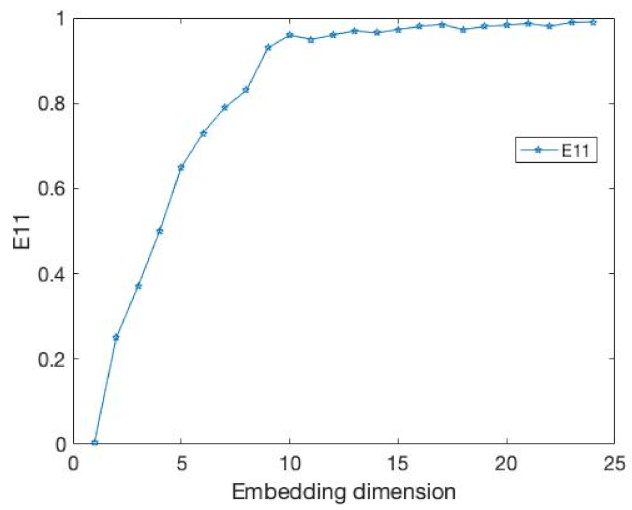
| 1 | 0.48 |
| 2 | 0.79 |
| 3 | 0.93 |
| 4 | 0.92 |
| 5 | 0.95 |
| 6 | 0.92 |
| 7 | 0.94 |
| 8 | 0.93 |
| 9 | 0.92 |
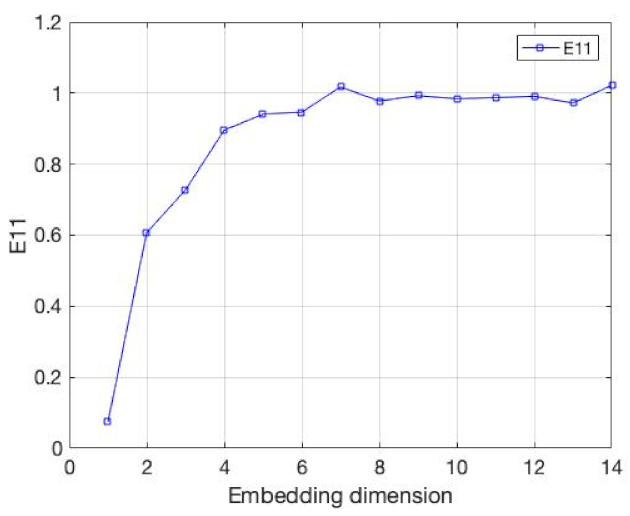
| 1 | 0.37 |
| 2 | 0.67 |
| 3 | 0.78 |
| 4 | 0.95 |
| 5 | 0.955 |
| 6 | 0.963 |
| 7 | 0.95 |
| 8 | 0.97 |
| 9 | 0.96 |
| 10 | 0.975 |
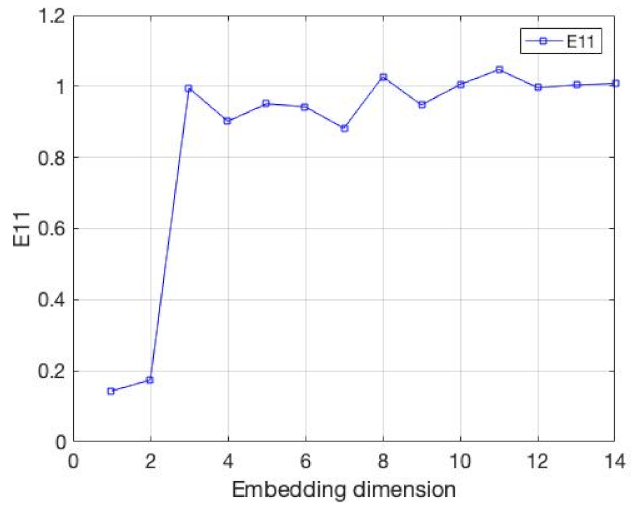
| 1 | 0.48 | 11 | 0.94 |
| 2 | 0.59 | 12 | 0.95 |
| 3 | 0.63 | 13 | 0.93 |
| 4 | 0.72 | 14 | 0.96 |
| 5 | 0.78 | 15 | 0.94 |
| 6 | 0.82 | 16 | 0.943 |
| 7 | 0.84 | 17 | 0.945 |
| 8 | 0.85 | 18 | 0.943 |
| 9 | 0.87 | 19 | 0.953 |
| 10 | 0.95 | 20 | 0.97 |
| 1 | 0.57 |
| 2 | 0.83 |
| 3 | 0.89 |
| 4 | 0.96 |
| 5 | 0.954 |
| 6 | 0.965 |
| 7 | 0.95 |
| 8 | 0.97 |
| 9 | 0.963 |
Publisher’s Note: MDPI stays neutral with regard to jurisdictional claims in published maps and institutional affiliations. |
© 2022 by the authors. Licensee MDPI, Basel, Switzerland. This article is an open access article distributed under the terms and conditions of the Creative Commons Attribution (CC BY) license (https://creativecommons.org/licenses/by/4.0/).
Share and Cite
Zhu, H.; Huang, J. A New Method for Determining the Embedding Dimension of Financial Time Series Based on Manhattan Distance and Recurrence Quantification Analysis. Entropy 2022, 24, 1298. https://doi.org/10.3390/e24091298
Zhu H, Huang J. A New Method for Determining the Embedding Dimension of Financial Time Series Based on Manhattan Distance and Recurrence Quantification Analysis. Entropy. 2022; 24(9):1298. https://doi.org/10.3390/e24091298
Chicago/Turabian StyleZhu, Hanhuai, and Jingjing Huang. 2022. "A New Method for Determining the Embedding Dimension of Financial Time Series Based on Manhattan Distance and Recurrence Quantification Analysis" Entropy 24, no. 9: 1298. https://doi.org/10.3390/e24091298