
Study of Dependence of Kinetic Freezeout Temperature on the Production Cross-Section of Particles in Various Centrality Intervals in Au–Au and Pb–Pb Collisions at High Energies


Abstract
:1. Introduction
2. Method and Formalism
3. Results and Discussion
4. Conclusions
- (a)
- The transverse momentum spectra of different particle species are analyzed by the blast wave model with Boltzmann Gibbs statistics, and the bulk properties in terms of the kinetic freezeout temperature, transverse flow velocity and freezeout volume are extracted in different centrality classes in nucleus–nuclues collisions at center of mass energy.
- (b)
- It is observed that is dependent on the cross-section of the interacting particle; i.e., a larger production cross-section of the interacting particle corresponds to a smaller .
- (c)
- A double kinetic freezeout scenario is observed due to the separate decoupling of non-strange and strange (multi-strange) particles.
- (d)
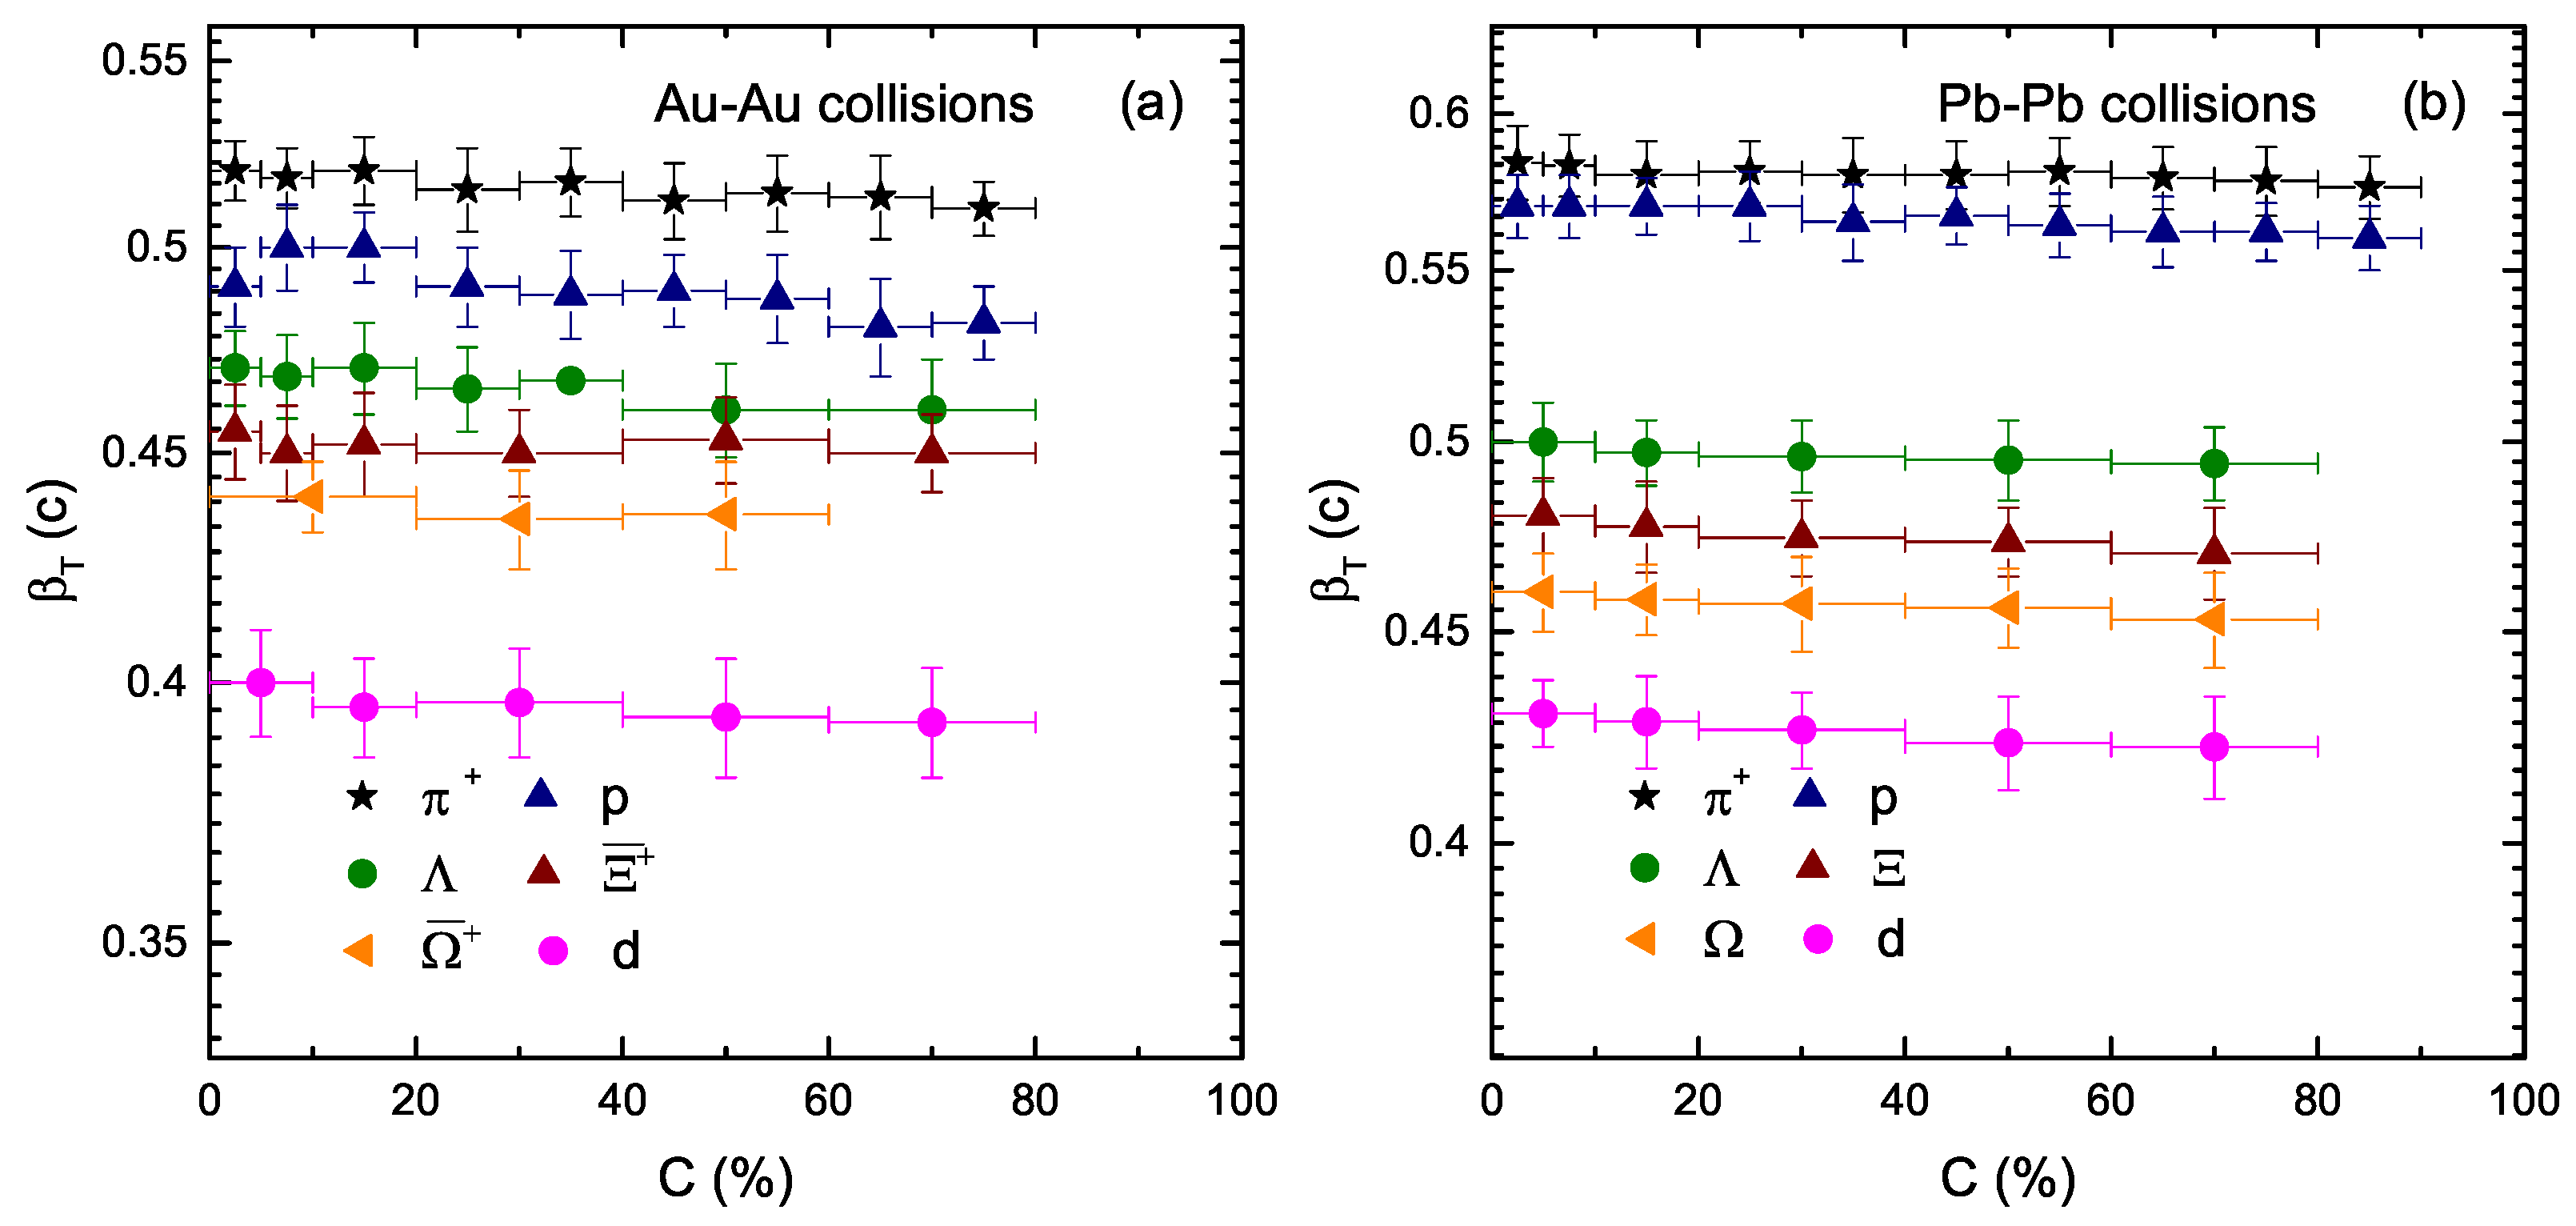
- The transverse flow velocity () and kinetic freezeout volume (V) are observed to depend on the mass of the particles; i.e., the larger the mass of the particle, the smaller the and V.
- (e)
- The kinetic freezeout temperature () and freezeout volume (V) decrease from central peripheral collisions due to the decrease of the degree of excitation of the interacting system and the decrease of the number of binary collisions due to the re-scattering of partons from central to peripheral collisions, respectively. At the same time, is observed to be independent of centrality and remains almost unchanged from central to peripheral collisions because the collective behavior at the stage of the kinetic freezeout in the interacting system does not change with event centrality.
- (f)
- , and V are observed to be larger for collisions at the LHC that at the RHIC.
- (g)
- The obtained results can be changed by changing the model, by using the same model with a different method or by changing the parameters used in the model.
Author Contributions
Funding
Institutional Review Board Statement
Informed Consent Statement
Data Availability Statement
Acknowledgments
Conflicts of Interest
References
- Cleymans, J.; Oeschler, H.; Redlich, K.; Wheaton, S. Comparison of chemical freeze-out criteria in heavy-ion collisions. Phys. Rev. C 2006, 73, 034905. [Google Scholar] [CrossRef]
- Andronic, A.; Braun-Munzinger, P.; Stachel, J. Hadron production in central nucleus-nucleus collisions at chemical freeze-out. Nuclear Phys. A 2006, 772, 167–199. [Google Scholar] [CrossRef] [Green Version]
- Andronic, A.; Braun-Munzinger, P.; Stachel, J. The Horn, the hadron mass spectrum and the QCD phase diagram: The Statistical model of hadron production in central nucleus-nucleus collisions. Nuclear Phys. A 2010, 834, 237C–240C. [Google Scholar] [CrossRef] [Green Version]
- Andronic, A.; Braun-Munzinger, P.; Stachel, J. Thermal hadron production in relativistic nuclear collisions. Acta Phys. Pol. B 2009, 40, 1005–1012. [Google Scholar]
- Waqas, M.; Liu, F.-H.; Fakhraddin, S.; Rahim, M.A. Possible scenarios for single, double, or multiple kinetic freeze-out in high energy collisions. Indian J. Phys. 2019, 93, 1329–1343. [Google Scholar] [CrossRef] [Green Version]
- Waqas, M.; Li, B.C. Kinetic freeze-out temperature and transverse flow velocity in Au-Au collisions at RHIC-BES energies. Adv. High Energy Phys. 2020, 2020, 1787183. [Google Scholar] [CrossRef] [Green Version]
- Khuntia, A.; Sharma, H.; Tiwari, S.K.; Sahoo, R.; Cleymans, J. Radial flow and differential freeze-out in proton-proton collisions at = 7 TeV at the LHC. Eur. Phys. J. A 2019, 55, 3. [Google Scholar] [CrossRef]
- Thakur, D.; Tripathy, S.; Garg, P.; Sahoo, R.; Cleymans, J. Indication of differential kinetic freeze-out at RHIC and LHC energies. Acta Phys. Pol. Supp. 2016, 9, 329. [Google Scholar] [CrossRef] [Green Version]
- Shao, M.; Yi, L.; Tang, Z.; Chen, H.; Li, C.; Xu, Z. Examination of the species and beam energy dependence of particle spectra using Tsallis statistics. J. Phys. G 2010, 37, 085104. [Google Scholar] [CrossRef]
- Waqas, M.; Peng, G.X.; Liu, F.-H. An Evidence of Triple Kinetic Freezeout Scenario Observed in All Centrality Intervals in Cu-Cu, Au-Au and Pb-Pb Collisions at High Energies; IOP Publishing Ltd.: Bristol, UK, 2020. [Google Scholar] [CrossRef]
- Abelev, B.; Adam, J.; Adamova, D.; Adare, A.M.; Aggarwal, M.M.; Rinella, G.A.; Agocs, A.G.; Agostinelli, A.; Salazar, S.A.; Ahammed, Z.; et al. Pion, Kaon, and Proton Production in Central Pb–Pb Collisions at = 2.76 TeV. Phys. Rev. Lett. 2012, 109, 252301. [Google Scholar] [CrossRef] [Green Version]
- Andronic, A. An overview of the experimental study of quark-gluon matter in high-energy nucleus-nucleus collisions. Int. J. Mod. Phys. A 2014, 29, 1430047. [Google Scholar] [CrossRef] [Green Version]
- Zhang, S.; Ma, Y.G.; Chen, J.H.; Zhong, C. Production of Kaon and Λ in Nucleus-Nucleus Collisions at Ultrarelativistic Energy from a Blast-Wave Model. Adv. High Energy Phys. 2015, 2015, 460590. [Google Scholar] [CrossRef]
- Zhang, S.; Ma, Y.G.; Chen, J.H.; Zhong, C. Beam energy dependence of Hanbury-Brown-Twiss radii from a blast-wave model. Adv. High Energy Phys. 2016, 2016, 9414239. [Google Scholar] [CrossRef]
- Waqas, M.; Liu, F.-H.; Li, L.L.; Alfanda, H.M. Effective (kinetic freeze-out) temperature, transverse flow velocity and kinetic freeze-out volume in high energy collisions. Nuclear Sci. Tech. 2010, 31, 109. [Google Scholar] [CrossRef]
- Waqas, M.; Liu, F.-H.; Wazir, Z. Dependence of temperatures and kinetic freeze-out volume on centrality in Au-Au and Pb-Pb collisions at high energy. Adv. High Energy Phys. 2020, 2020, 8198126. [Google Scholar] [CrossRef]
- Waqas, M.; Liu, F.-H. Centrality Dependence of Kinetic Freeze-Out Temperature and Transverse Flow Velocity in High Energy Nuclear Collisions; Springer: Berlin/Heidelberg, Germany, 2021. [Google Scholar]
- Wang, Q.; Liu, F.-H. Initial and final state temperatures of antiproton emission sources in high energy collisions. Int. J. Theor. Phys. 2019, 58, 4119–4138. [Google Scholar] [CrossRef] [Green Version]
- Schnedermann, E.; Sollfrank, J.; Heinz, U.W. Thermal phenomenology of hadrons from 200-A/GeV S+S collisions. Phys. Rev. C 1993, 48, 2462–2475. [Google Scholar] [CrossRef] [Green Version]
- Abelev, B.I.; Aggarwal, M.M.; Ahammed, Z.; Alakhverdyants, A.V.; Anderson, B.D.; Arkhipkin, D.; Averichev, G.S.; Balewski, J.; Barannikova, O.; Barnby, L.S.; et al. Identified particle production, azimuthal anisotropy, and interferometry measurements in Au+Au collisions at s(NN)**(1/2) = 9.2-GeV. Phys. Rev. C 2010, 81, 024911. [Google Scholar] [CrossRef]
- Abelev, B.I.; Aggarwal, M.M.; Ahammed, Z.; Anderson, B.D.; Arkhipkin, D.; Averichev, G.S.; Bai, Y.; Balewski, J.; Barannikova, O.; Barnby, L.S.; et al. Systematic Measurements of Identified Particle Spectra in pp,d+ Au and Au+Au Collisions from STAR. Phys. Rev. C 2009, 79, 034909. [Google Scholar] [CrossRef]
- Tang, Z.; Yi, L.; Ruan, L.; Shao, M.; Chen, H.; Li, C.; Mohanty, B.; Sorensen, P.; Tang, A.; Xu, Z. The statistical origin of constituent-quark scaling in QGP hadronization. Chin. Phys. Lett. 2013, 30, 031201. [Google Scholar] [CrossRef] [Green Version]
- Jiang, K.; Zhu, Y.; Liu, W.; Chen, H.; Li, C.; Ruan, L.; Tang, Z.; Xu, Z. Onset of radial flow in p+ p collisions. Phys. Rev. C 2015, 91, 024910. [Google Scholar] [CrossRef] [Green Version]
- Tang, Z.; Xu, Y.; Ruan, L.; van Buren, G.; Wang, F.; Xu, Z. Spectra and radial flow in relativistic heavy ion collisions with Tsallis statistics in a blast-wave description. Phys. Rev. C 2009, 79, 051901. [Google Scholar] [CrossRef] [Green Version]
- Wei, H.R.; Liu, F.-H.; Lacey, R.A. Kinetic freeze-out temperature and flow velocity extracted from transverse momentum spectra of final-state light flavor particles produced in collisions at RHIC and LHC. Eur. Phys. J. A 2016, 52, 102. [Google Scholar] [CrossRef] [Green Version]
- Wei, H.R.; Liu, F.-H.; Lacey, R.A. Disentangling random thermal motion of particles and collective expansion of source from transverse momentum spectra in high energy collisions. J. Phys. G 2016, 43, 125102. [Google Scholar] [CrossRef] [Green Version]
- Lao, H.-L.; Wei, H.R.; Liu, F.-H.; Lacey, R.A. An evidence of mass-dependent differential kinetic freeze-out scenario observed in Pb-Pb collisions at 2.76 TeV. Eur. Phys. J. A 2016, 52, 203. [Google Scholar] [CrossRef] [Green Version]
- Lao, H.-L.; Liu, F.-H.; Li, B.C.; Duan, M.Y.; Lacey, R.A. Examining the model dependence of the determination of kinetic freeze-out temperature and transverse flow velocity in small collision system. Nuclear Sci. Tech. 2018, 29, 164. [Google Scholar] [CrossRef] [Green Version]
- Lao, H.-L.; Liu, F.-H.; Li, B.C.; Duan, M.Y. Kinetic freeze-out temperatures in central and peripheral collisions: Which one is larger? Nuclear Sci. Tech. 2018, 29, 82. [Google Scholar] [CrossRef] [Green Version]
- Zheng, H.; Zhu, L. Comparing the Tsallis distribution with and without thermodynamical description in p + p collisions. Adv. High Energy Phys. 2016, 2016, 9632126. [Google Scholar] [CrossRef] [Green Version]
- Cleymans, J.; Worku, D. Relativistic Thermodynamics: Transverse Momentum Distributions in High-Energy Physics. Eur. Phys. J. A 2012, 48, 160. [Google Scholar] [CrossRef]
- Takeuchi, S.; Murase, K.; Hirano, T.; Huovinen, P.; Nara, Y. Effects of hadronic rescattering on multistrange hadrons in high-energy nuclear collisions. Phys. Rev. C 2015, 92, 044907. [Google Scholar] [CrossRef] [Green Version]
- Heinz, U.W. Hydrodynamics at RHIC: How well does it work, where and how does it break down? J. Phys. Nuclear Part. Phys. 2005, 31, S717. [Google Scholar] [CrossRef]
- Heiselberg, H.; Levy, A.-M. Elliptic flow and HanburyBrown CTwiss correlations in noncentral nuclear collisions. Phys. Rev. C 1999, 59, C2716–C2727. [Google Scholar] [CrossRef] [Green Version]
- Russo, R. Measurement of D+ meson production in p-Pb collisions with the ALICE detector. arXiv 2015, arXiv:1511.04380. [Google Scholar]
- Bíró, G.; Barnaföldi, G.G.; Biró, T.S.; Ürmössy, K.; Takács, Á. Systematic analysis of the non-extensive statistical approach in high energy particle collisions—Experiment vs. theory. Entropy 2017, 19, 88. [Google Scholar] [CrossRef]
- Sadhu, S.; Ghosh, P. Anomalous features of particle production in high-multiplicity events of p p collisions at the LHC energies. Phys. Rev. D 2019, 99, 034020. [Google Scholar] [CrossRef] [Green Version]
- Chatrchyan, S.; Apresyan, A.; Bornheim, A.; Bunn, J. Study of high-pT charged particle suppression in PbPb compared to pp collisions at = 2.76 TeV. Eur. Phys. J. C 2012, 72, 1945. [Google Scholar] [CrossRef] [Green Version]
- Tsallis, C. Possible Generalization of Boltzmann-Gibbs Statistics. J. Stat. Phys. 1988, 52, 479–487. [Google Scholar] [CrossRef]
- Abelev, B.I.; Adams, J.; Aggarwal, M.M.; Ahammed, Z.; Amonett, J.; Anderson, B.D.; Anderson, M.; Arkhipkin, D.; Averichev, G.S.; Bai, Y.; et al. Strange particle production in p + p collisions at 200 GeV. Phys. Rev. 2007, 75, 064901. [Google Scholar]
- Petrovici, M.; Andrei, C.; Berceanu, I.; Bercuci, A.; Herghelegiu, A.; Pop, A. Recent results and open questions on collective type phenomena from AA to pp collisions. AIP Conf. Proc. 2015, 1645, 52–60. [Google Scholar] [CrossRef] [Green Version]
- Hagedorn, R. Multiplicities, pT distributions and the expected hadron quark-gluon phase transition. Riv. Del Nuovo C. 1983, 6, 1–50. [Google Scholar] [CrossRef]
- Suleymanov, M. The meaning behind observed p T regions at the LHC energies. Int. J. Mod. Phys. E 2018, 27, 1850008. [Google Scholar] [CrossRef] [Green Version]
- Khachatryan, V.; Sirunyan, A.M.; Tumasyan, A.; Adam, W.; Bergauer, T.; Dragicevic, M.; Erö, J.; Friedl, M.; Fruehwirth, R.; Ghete, V.M.; et al. Production of Σ(1385)± and Ξ(1530)0 in proton-proton collisions at s= 7 TeV. Eur. Phys. J. C 2015, 75. [Google Scholar] [CrossRef] [Green Version]
- Odorico, R. Does a transverse energy trigger actually trigger on large-PT jets? Phys. Lett. B 1982, 118, 151–154. [Google Scholar] [CrossRef]
- Arnison, G.; Astbury, A.; Aubert, B.; Bacci, C.; Bernabei, R.; Bezaguet, A.; Böck, R.; Bowcock, T.J.; Calvetti, M.; Carroll, T.; et al. Transverse momentum spectra for charged particles at the CERN protonantiproton collider. Phys. Lett. B 1982, 118, 167–172. [Google Scholar] [CrossRef] [Green Version]
- Biyajima, M.; Mizoguchi, T.; Suzuki, N. Analyses of whole transverse momentum distributions in pp and pp collisions by using a modified version of Hagedorn’s formula. Int. J. Mod. Phys. A 2017, 32, 1750057. [Google Scholar] [CrossRef] [Green Version]
- Aamodt, K.; Abelev, B.; Quintana, A.A.; Adamova, D.; Adare, A.M.; Aggarwal, M.M.; Rinella, G.A.; Agocs, A.G.; Agostinelli, A.; Salazar, S.A.; et al. Heavy flavour decay muon production at forward rapidity in proton–proton collisions at = 7 TeV. Phys. Lett. B 2012, 708, 265–275. [Google Scholar] [CrossRef]
- Lakomov, I. Event activity dependence of inclusive J/ψ production in p–Pb collisions at = 5.02 TeV with ALICE at the LHC. Nuclear Phys. A 2014, 931, 1179–1183. [Google Scholar] [CrossRef] [Green Version]
- Abelev, B.; Adam, J.; Adamová, D.; Adare, A.M.; Aggarwal, M.M.; Rinella, G.A.; Agocs, A.G.; Agostinelli, A.; Salazar, S.A.; Ahammed, Z.; et al. Inclusive J/ψ production in pp collisions at = 2.76 TeV. Phys. Lett. B 2015, 718, 295–306, Erratum in Phys. Lett. B 2015, 748, 472–473. [Google Scholar] [CrossRef]
- Abelev, B.; Quintana, A.A.; Adamová, D.; Adare, A.M.; Aggarwal, M.M.; Rinella, G.A.; Agocs, A.G.; Agostinelli, A.; Salazar, S.A.; Ahammed, Z.; et al. Light vector meson production in pp collisions at = 7 TeV. Phys. Lett. B 2012, 710, 557–568. [Google Scholar] [CrossRef]
- Abt, I.; Adams, M.; Agari, M.; Albrecht, H.; Aleksandrov, A.; Amaral, V.; Amorim, A.; Aplin, S.J.; Aushev, V.; Bagaturia, Y.; et al. K*(0) and phi meson production in proton-nucleus interactions at root = 41.6 GeV. Eur. Phys. J. C 2007, 50, 315–328. [Google Scholar] [CrossRef]
- De Falco, A. Vector meson production in pp collisions at = 7 TeV, measured with the ALICE detector. J. Phys. G 2011, 38, 124083. [Google Scholar] [CrossRef]
- Aamodt, K.; Abel, N.; Abeysekara, U.; Quintana, A.A.; Abramyan, A.; Adamová, D.; Aggarwal, M.M.; Rinella, G.A.; Agocs, A.G.; Salazar, S.A.; et al. Transverse momentum spectra of charged particles in proton-proton collisions at = 900 GeV with ALICE at the LHC. Phys. Lett. B 2010, 693, 53–68. [Google Scholar] [CrossRef] [Green Version]
- Aggarwal, M.M.; Ahammed, Z.; Alakhverdyants, A.V.; Alekseev, I.; Alford, J.; Anderson, B.D.; Anson, C.D.; Arkhipkin, D.; Averichev, G.S.; Balewski, J.; et al. Strange and multistrange particle production in Au+ Au collisions at = 62.4 GeV. Phys. Rev. C 2011, 83, 024901. [Google Scholar] [CrossRef]
- Adam, J.; Adamczyk, L.; Adams, J.R.; Adkins, J.K.; Agakishiev, G.; Aggarwal, M.M.; Ahammed, Z.; Alekseev, I.; Anderson, D.M.; Aoyama, R.; et al. Beam energy dependence of (anti-) deuteron production in Au+ Au collisions at the BNL Relativistic Heavy Ion Collider. Phys. Rev. C 2019, 99, 064905. [Google Scholar] [CrossRef] [Green Version]
- Abelev, B.; Adam, J.; Adamová, D.; Adare, A.M.; Aggarwal, M.M.; Rinella, G.A.; Agnello, M.; Agocs, A.G.; Agostinelli, A.; Ahammed, Z.; et al. Centrality dependence of π, K, and p production in Pb-Pb collisions at = 2.76 TeV. Phys. Rev. C 2013, 88, 044910. [Google Scholar] [CrossRef] [Green Version]
- Begun, V.; Florkowski, W.; Rybczynski, M. Transverse-momentum spectra of strange particles produced in Pb+ Pb collisions at = 2.76 TeV in the chemical nonequilibrium model. Phys. Rev. C 2014, 90, 054912. [Google Scholar] [CrossRef] [Green Version]
- Adam, J.; Adamová, D.; Aggarwal, M.M.; Rinella, G.A.; Agnello, M.; Agrawal, N.; Ahammed, Z.; Ahmed, I.; Ahn, S.U.; Aimo, I.; et al. Production of light nuclei and anti-nuclei in pp and Pb-Pb collisions at energies available at the CERN Large Hadron Collider. Phys. Rev. C 2016, 93, 024917. [Google Scholar] [CrossRef] [Green Version]
- Waqas, M.; Liu, F.-H. Initial, effective, and kinetic freeze-out temperatures from transverse momentum spectra in high-energy proton (deuteron)–nucleus and nucleus–nucleus collisions. Eur. Phys. J. Plus 2020, 135, 147. [Google Scholar] [CrossRef]
- Che, G.R.; Gu, J.B.; Zhang, W.C.; Zheng, H. Identified particle spectra in Pb-Pb and p-Pb collisions with a modified Tsallis blast-wave model. arXiv 2020, arXiv:2010.14880. [Google Scholar]
- Bashir, I.; Uddin, S. Centrality Dependence of K*(892)0 and ϕ(1020) Production at LHC. Commun. Theor. Phys. 2017, 68, 500. [Google Scholar] [CrossRef]
- Uddin, S.; Bhat, R.A.; Bashir, I.U. Study of Centrality Dependence of Transverse Momentum Spectra of Hadrons and the Freeze-out Parameters at root (sNN) of 62.4 GeV, 130 GeV and 200 GeV. arXiv 2014, arXiv:1412.2663. [Google Scholar]
- Waqas, M.; Peng, G.X. Study of Proton, Deuteron, and Triton at 54.4 GeV. Adv. High Energy Phys. 2021. Available online: https://www.hindawi.com/journals/ahep/2021/6674470/ (accessed on 14 April 2021). [CrossRef]
- Acharya, S.; Adamova, D.; Adhya, S.P.; Adler, A.; Adolfsson, J.; Aggarwal, M.M.; Rinella, G.A.; Agnello, M.; Agrawal, N.; Ahammed, Z.; et al. Production of charged pions, kaons, and (anti-) protons in Pb-Pb and inelastic p p collisions at = 5.02 TeV. Phys. Rev. C 2020, 101, 044907. [Google Scholar] [CrossRef]


| Collisions | Centrality | Particle | (GeV) | (c) | /dof | |||
|---|---|---|---|---|---|---|---|---|
| Figure 1 | 0–5% | 3/5 | ||||||
| Au–Au | 5–10% | – | 7/5 | |||||
| 62.4 GeV | 10–20% | – | 2/5 | |||||
| 20–30% | – | 2/5 | ||||||
| 30–40% | – | 2/5 | ||||||
| 40–50% | – | 5/5 | ||||||
| 50–60% | – | 2 | 7/5 | |||||
| 60–70% | – | 2 | 1/5 | |||||
| 70–80% | – | 2 | 4/5 | |||||
| Figure 1 | 0–5% | p | 33/9 | |||||
| Au–Au | 5–10% | – | 1 | 20/9 | ||||
| 62.4 GeV | 10–20% | – | 5/9 | |||||
| 20–30% | – | 3/9 | ||||||
| 30–40% | – | 7/9 | ||||||
| 40–50% | – | 3/9 | ||||||
| 50–60% | – | 4/9 | ||||||
| 60–70% | – | 4/9 | ||||||
| 70–80% | – | 14/9 | ||||||
| Figure 1 | 0–5% | 1/7 | ||||||
| Au–Au | 5–10% | – | 1/7 | |||||
| 62.4 GeV | 10–20% | – | 1/7 | |||||
| 20–30% | – | 1/7 | ||||||
| 30–40% | – | 1/7 | ||||||
| 40–60% | – | 5/7 | ||||||
| 60–80% | – | 5/7 | ||||||
| Figure 1 | 0–5% | 0.4/5 | ||||||
| Au–Au | 5–10% | – | 1 | 3/6 | ||||
| 62.4 GeV | 10–20% | – | 2/6 | |||||
| 20–40% | – | 3/6 | ||||||
| 40–60% | – | 1/6 | ||||||
| 60–80% | – | 3/4 | ||||||
| Figure 1 | 0–20% | 0.3/0 | ||||||
| Au–Au | 20–40% | – | 1 | 1/0 | ||||
| 62.4 GeV | 40–60% | – | 2/−1 | |||||
| Figure 1 | 0–10% | d | 3/7 | |||||
| Au–Au | 10–20% | – | 2/7 | |||||
| 62.4 GeV | 20–40% | – | 1/7 | |||||
| 40–60% | – | 1/7 | ||||||
| 60–80% | – | 22/6 | ||||||
| Figure 2 | 0–5% | 89/36 | ||||||
| Pb–Pb | 5–10% | – | 158/36 | |||||
| 2.76 TeV | 10–20% | – | 93/36 | |||||
| 20–30% | – | 58/36 | ||||||
| 30–40% | – | 1 | 54/36 | |||||
| 40–50% | – | 1 | 92/36 | |||||
| 50–60% | – | 1 | 100/36 | |||||
| 60–70% | – | 197/36 | ||||||
| 70–80% | – | 151/36 | ||||||
| 80–90% | – | 221/36 | ||||||
| Figure 2 | 0–5% | p | 1 | 58/30 | ||||
| Pb–Pb | 5–10% | – | 125/37 | |||||
| 2.76 TeV | 10–20% | – | 37/33 | |||||
| 20–30% | – | 34/31 | ||||||
| 30–40% | – | 17/31 | ||||||
| 40–50% | – | 108/33 | ||||||
| 50–60% | – | 1 | 62/31 | |||||
| 60–70% | – | 1 | 140/34 | |||||
| 70–80% | – | 214/36 | ||||||
| 80–90% | – | 207/37 | ||||||
| Figure 2 | 0–10% | 28/14 | ||||||
| Pb–Pb | 10–20% | – | 27/14 | |||||
| 2.76 TeV | 20–40% | – | 35/14 | |||||
| 40–60% | – | 124/14 | ||||||
| 60–80% | – | 17/14 | ||||||
| Figure 2 | 0–10% | 1 | 16/7 | |||||
| Pb–Pb | 10–20% | – | 1 | 37/7 | ||||
| 2.76 TeV | 20–40% | – | 63/7 | |||||
| 40–60% | – | 82/7 | ||||||
| 60–80% | – | 107/7 | ||||||
| Figure 2 | 0–10% | 12/2 | ||||||
| Pb–Pb | 10–20% | – | 1/2 | |||||
| 2.76 TeV | 20–40% | – | 3/2 | |||||
| 40–60% | – | 6/2 | ||||||
| 60–80% | – | 5/1 | ||||||
| Figure 2 | 0–10% | d | 6/16 | |||||
| Pb–Pb | 10–20% | – | 6/16 | |||||
| 2.76 TeV | 20–40% | – | 4/16 | |||||
| 40–60% | – | 15/10 | ||||||
| 60–80% | – | 10/10 |
Publisher’s Note: MDPI stays neutral with regard to jurisdictional claims in published maps and institutional affiliations. |
© 2021 by the authors. Licensee MDPI, Basel, Switzerland. This article is an open access article distributed under the terms and conditions of the Creative Commons Attribution (CC BY) license (https://creativecommons.org/licenses/by/4.0/).
Share and Cite
Waqas, M.; Peng, G.-X. Study of Dependence of Kinetic Freezeout Temperature on the Production Cross-Section of Particles in Various Centrality Intervals in Au–Au and Pb–Pb Collisions at High Energies. Entropy 2021, 23, 488. https://doi.org/10.3390/e23040488
Waqas M, Peng G-X. Study of Dependence of Kinetic Freezeout Temperature on the Production Cross-Section of Particles in Various Centrality Intervals in Au–Au and Pb–Pb Collisions at High Energies. Entropy. 2021; 23(4):488. https://doi.org/10.3390/e23040488
Chicago/Turabian StyleWaqas, Muhammad, and Guang-Xiong Peng. 2021. "Study of Dependence of Kinetic Freezeout Temperature on the Production Cross-Section of Particles in Various Centrality Intervals in Au–Au and Pb–Pb Collisions at High Energies" Entropy 23, no. 4: 488. https://doi.org/10.3390/e23040488