


Sensors 2023, 23(12), 5443; https://doi.org/10.3390/s23125443 - 08 Jun 2023
Cited by 1 | Viewed by 1047
Abstract
►
Show Figures
Spectral Filter Array cameras provide a fast and portable solution for spectral imaging. Texture classification from images captured with such a camera usually happens after a demosaicing process, which makes the classification performance rely on the quality of the demosaicing. This work investigates
[...] Read more.
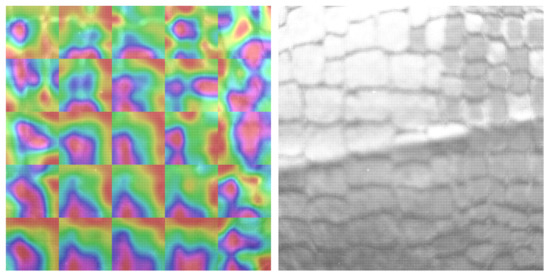
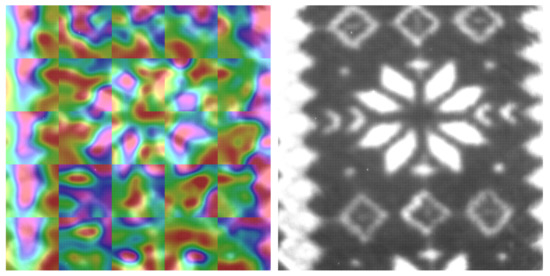
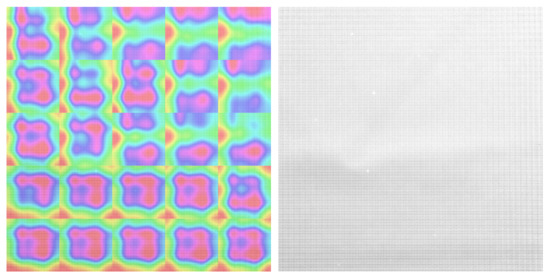
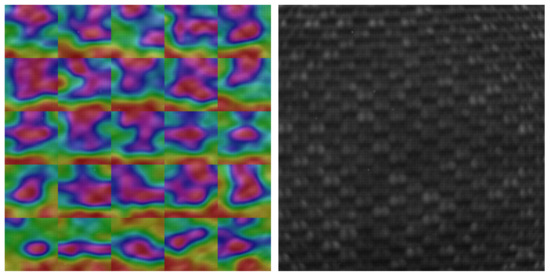
Spectral Filter Array cameras provide a fast and portable solution for spectral imaging. Texture classification from images captured with such a camera usually happens after a demosaicing process, which makes the classification performance rely on the quality of the demosaicing. This work investigates texture classification methods applied directly to the raw image. We trained a Convolutional Neural Network and compared its classification performance to the Local Binary Pattern method. The experiment is based on real SFA images of the objects of the HyTexiLa database and not on simulated data as are often used. We also investigate the role of integration time and illumination on the performance of the classification methods. The Convolutional Neural Network outperforms other texture classification methods even with a small amount of training data. Additionally, we demonstrated the model’s ability to adapt and scale for different environmental conditions such as illumination and exposure compared to other methods. In order to explain these results, we analyze the extracted features of our method and show the ability of the model to recognize different shapes, patterns, and marks in different textures.
Full article
Figure 1

