
Using Spectral Indices Derived from Remote Sensing Imagery to Represent Arthropod Biodiversity Gradients in a European Sphagnum Peat Bog


Abstract
:1. Introduction
2. Materials and Methods
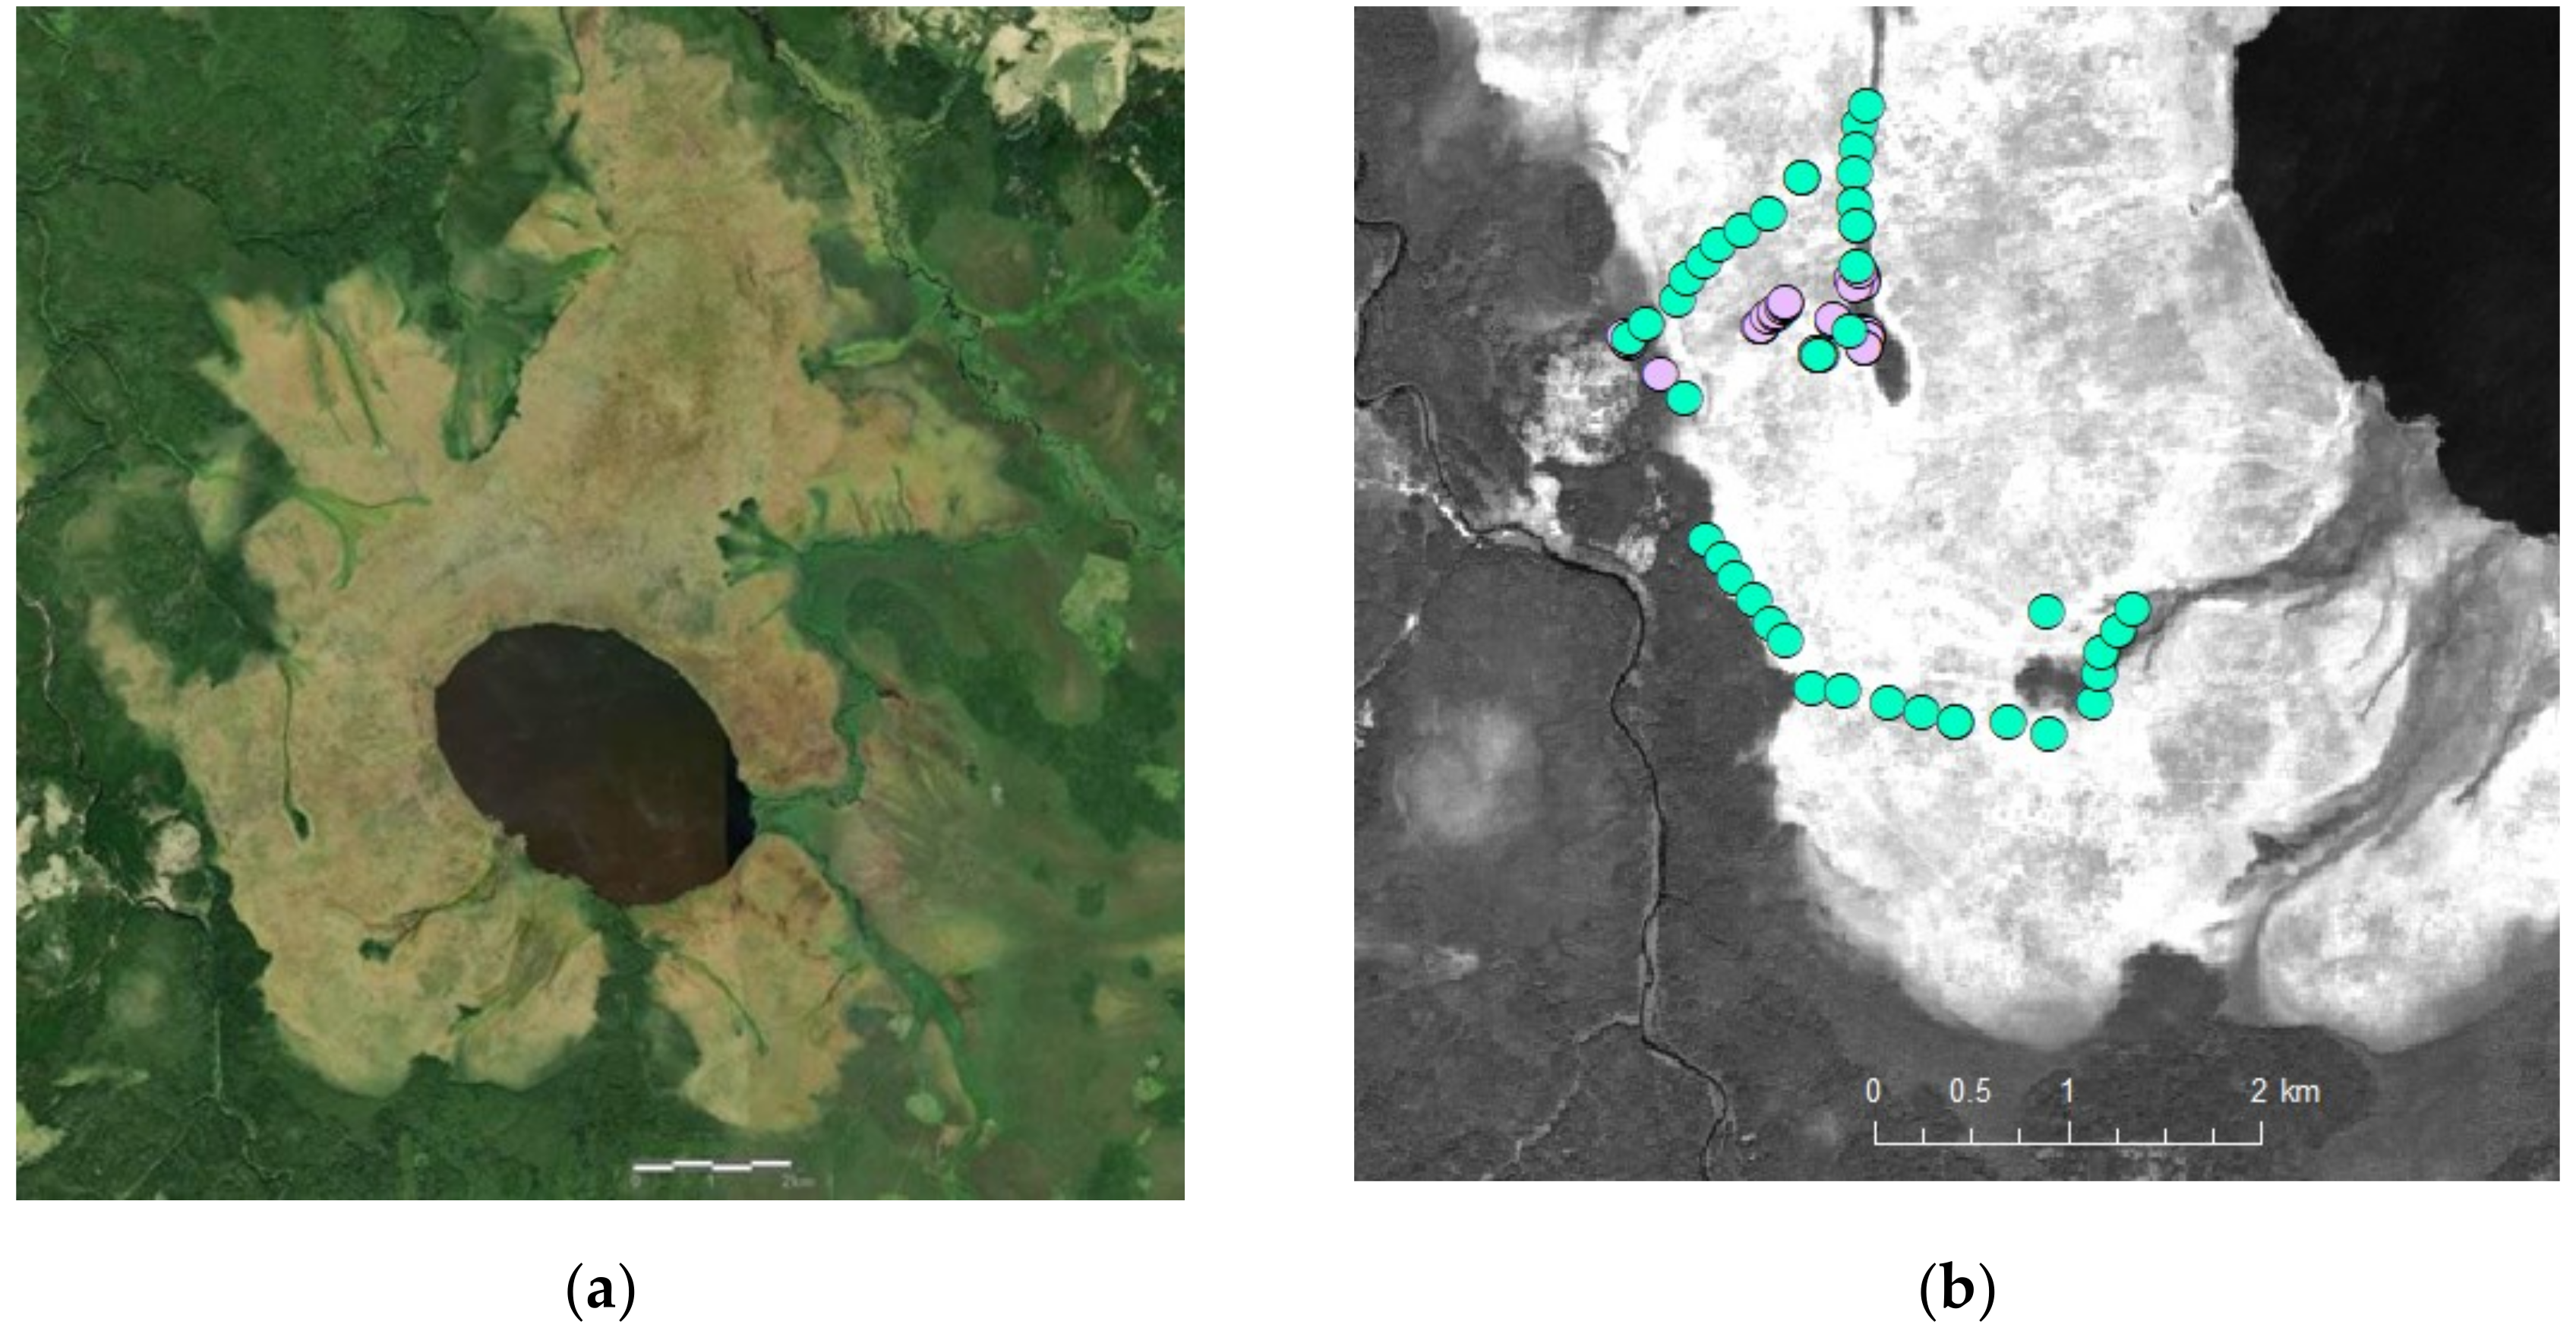
2.1. Study Site
2.2. Sampling on the Ground
2.3. Remote Sensing Data
- (i)
- Normalized Difference Vegetation Index (NDVI), computed using band 4 (red) and band 5 (NIR) reflectances as (r5 − r4)/(r5 + r4). NDVI is an indicator of the amount of vegetation; it approaches 1.0 if a pixel contains vegetation; 0 if a pixel contains soil; and −1.0 if a pixel contains water. NDVI is commonly used in remote sensing as a proxy for productivity [36];
- (ii)
- Excess Green (ExG), calculated as 2r3 − r4 − r2;
- (iii)
- (iv)
- Normalized Difference Moisture Index (NDMI), computed using band 5 (NIR) and band 6 (SWIR1) reflectances as (r5 − r6)/(r5 + r6) [47]. NDMI is used to determine vegetation water content; it is sensitive to changes in liquid water content and in spongy mesophyll of vegetation canopies [47,48], otherwise known as NDWI (normalized difference water index);
- (v)
- Moisture Stress Index (SWIR1/NIR), computed as r6/r5; this index is negatively correlated with surface water content and has been suggested as a broad-band index of surface moisture (reflective of water table position) in peatlands [32,49]. Moisture Stress Index is used for canopy stress analysis, productivity prediction and biophysical modeling [50].
2.4. Data Analysis
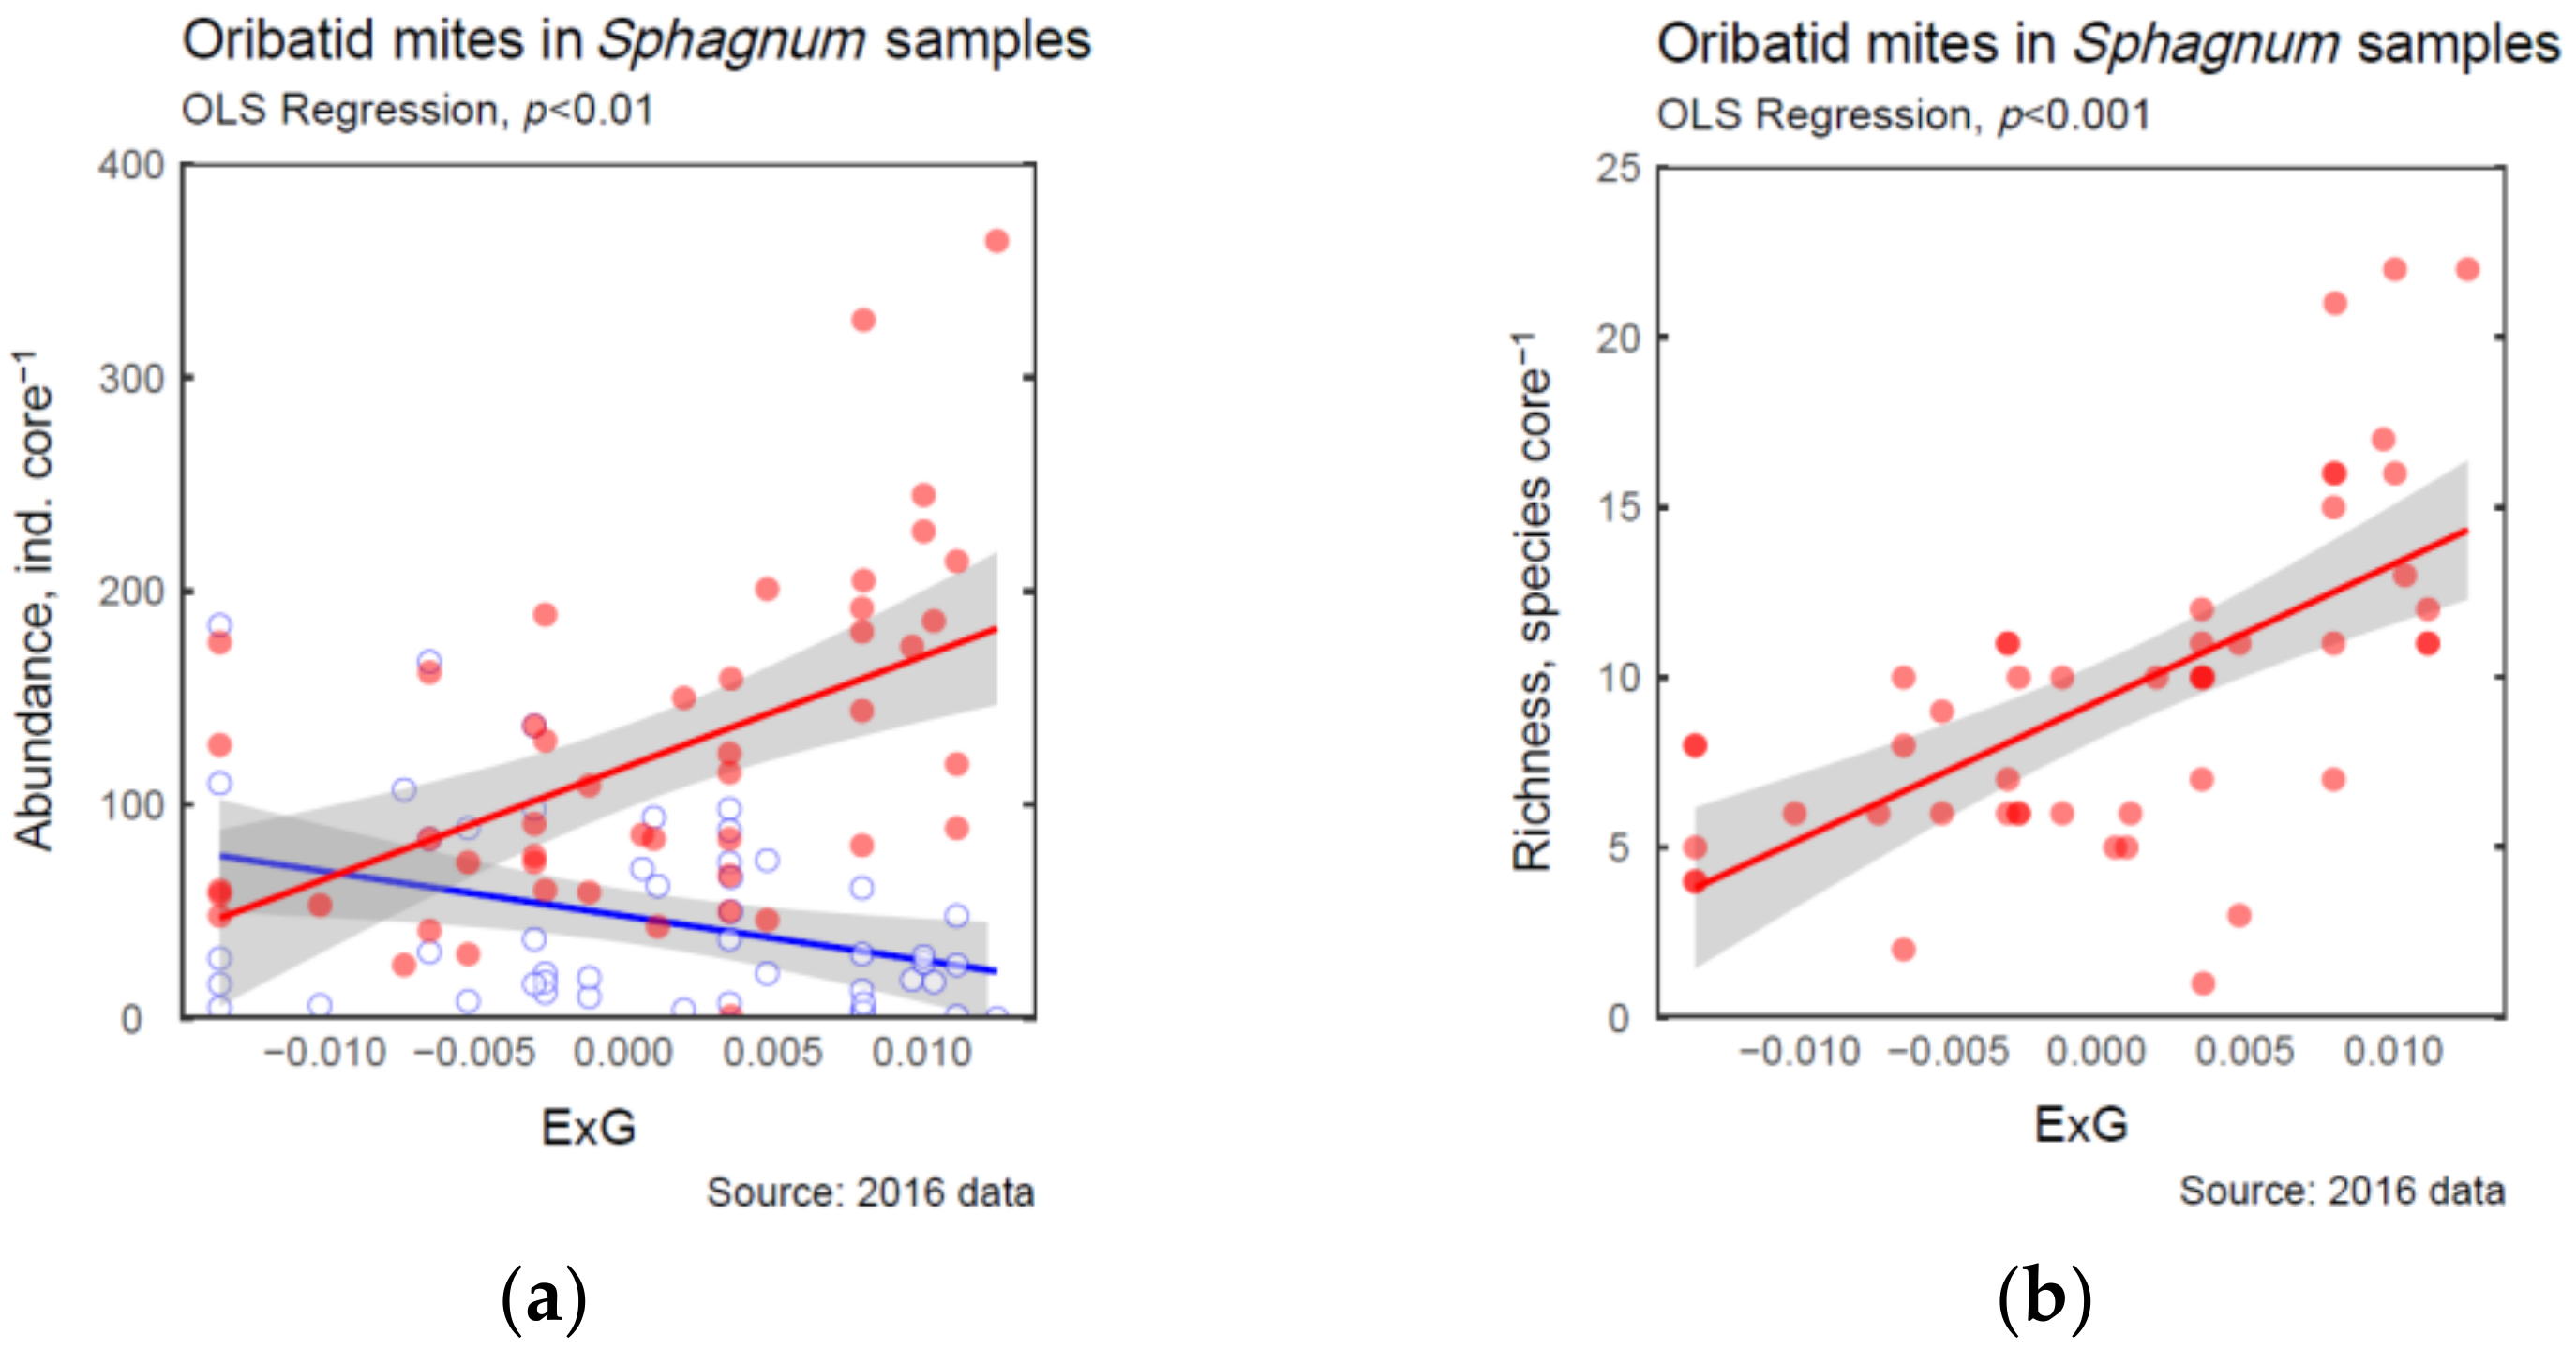
3. Results
4. Discussion
5. Conclusions
Supplementary Materials
Author Contributions
Funding
Data Availability Statement
Acknowledgments
Conflicts of Interest
Appendix A

| Species 1 | Jul 2016, n = 48 | Aug 2019, n = 53 | Species | Jul 2016, n = 48 | Aug 2019, n = 53 |
|---|---|---|---|---|---|
| Achipteria coleoptrata (L., 1758) | 2 | 22 | Limnozetes palmerae Behan-Pelletier, 1989 | 642 | 474 |
| Acrotritia ardua (Koch, 1841) | 63 | 16 | Limnozetes rugosus (Sellnick, 1923) | 333 | 46 |
| Adoristes ovatus (Koch, 1839) | 12 | 18 | Liochthonius alpestris (Forsslund, 1958) | 94 | 334 |
| Atropacarus striculus (Koch, 1835) | 273 | 87 | Malaconothrus foveolatus (Willmann, 1931) | – | 688 |
| Autogneta traegardhi Forsslund, 1947 | 1 | – | Malaconothrus monodactylus (Michael, 1888) | 259 | 333 |
| Banksinoma lanceolata (Michael, 1885) | – | 4 | Malaconothrus vietsi (Willmann, 1925) | 27 | – |
| Camisia solhoeyi Colloff, 1993 | 3 | – | Microppia minus (Paoli, 1908) | – | 1 |
| Carabodes labyrinthicus (Michael, 1879) | 57 | – | Nanhermannia comitalis Berlese, 1916 | 74 | – |
| Carabodes rugosior Berlese, 1916 | 11 | – | Nanhermannia coronata Berlese, 1913 | 421 | 182 |
| Cepheus cepheiformis (Nicolet, 1855) | 15 | – | Nothrus pratensis Sellnick, 1928 | 222 | 236 |
| Ceratoppia bipilis (Hermann, 1804) | 1 | – | Oppiella nova (Oudemans, 1902) | 1446 | 436 |
| Ceratoppia quadridentata (Haller, 1882) | 2 | – | Oribatula tibialis (Nicolet, 1855) | 2 | – |
| Ceratozetes sellnicki Rajski, 1958 | – | 1 | Parachipteria punctata (Nicolet, 1855) | 43 | – |
| Chamobates cuspidatus (Michael, 1884) | 24 | – | Pergalumna emarginata (Banks, 1895) | 12 | 22 |
| Diapterobates humeralis (Hermann, 1804) | 22 | 9 | Phthiracarus boresetosus Jacot, 1930 | 184 | 14 |
| Epidamaeus kamaensis (Sellnick, 1926) | 1 | – | Phthiracarus laevigatus (Koch, 1841) | 4 | – |
| Eupelops occultus (Koch, 1835) | 24 | – | Pilogalumna tenuiclava (Berlese, 1908) | 48 | 32 |
| Eupelops strenzkei (Knülle, 1954) | 16 | 13 | Punctoribates sellnicki Willmann, 1928 | – | 13 |
| Fuscozetes fuscipes (Koch, 1844) | 5 | – | Quadroppia quadricarinata (Michael, 1885) | 4 | – |
| Fuscozetes setosus (Koch, 1839) | – | 5 | Rhinoppia hygrophila (Mahunka, 1987) | – | 29 |
| Galumna lanceata (Oudemans, 1900) | 20 | – | Scheloribates circumcarinatus Weigmann & Miko, 1998 | 61 | 9 |
| Galumna obvia (Berlese, 1914) | 17 | – | Scheloribates labyrinthicus Jeleva, 1962 | – | 11 |
| Heminothrus longisetosus (Willmann, 1925) | 3 | – | Scheloribates laevigatus (C.L. Koch, 1835) | 176 | 3 |
| Heminothrus peltifer (Koch, 1839) | 43 | 1 | Suctobelbella palustris (Forsslund, 1953) | 141 | 17 |
| Heminothrus thori (Berlese, 1904) | 1 | – | Tectocepheus velatus (Michael, 1880) | 560 | 44 |
| Hoplophthiracarus illinoisensis (Ewing, 1909) | 796 | 949 | Trhypochthoniellus longisetus (Berlese, 1904) | 217 | 7 |
| Hydrozetes lacustris (Michael, 1882) | 38 | 15 | Trhypochthonius tectorum (Berlese, 1896) | 24 | 6 |
| Hypochthonius rufulus Koch, 1835 | 90 | 1 | Trimalaconothrus foveolatus Willmann, 1931 | 352 | – |
| Liebstadia similis (Michael, 1888) | 3 | 3 | Tyrphonothrus angulatus (Willmann, 1931) | 5 | 47 |
| Limnozetes ciliatus (Schrank, 1803) | 354 | 851 | Tyrphonothrus maior (Berlese, 1910) | 800 | 82 |
| Oribatida total | 8048 | 5083 |
| Species 1 | August 2019 |
|---|---|
| Lysigamasus lapponicus (Trägårdh, 1910) | 21 |
| Veigaia transisale (Oudemans, 1902) | 25 |
| Veigaia nemorensis (C.L.Koch, 1839) | 11 |
| Cheiroseius bryophilus Karg, 1969 | 13 |
| Cheiroseius mutilus (Berlese, 1916) | 9 |
| Cheiroseius serratus (Halbert, 1915) | 2 |
| Cheiroseius laelaptoides (Berlese, 1887) | 5 |
| Platyseius italicus (Berlese, 1905) | 8 |
| Ololaelaps venetus (Berlese 1903) | 12 |
| Gaeolaelaps nolli (Karg, 1962) | 4 |
| Parazecon radiatus (Berlese, 1910) | 54 |
| Zercon zelawaiensis Sellnick, 1944 | 32 |
| Prozecon kochi Sellnick, 1943 | 77 |
| Epicrius bureschi Balogh, 1958 | 2 |
| Acugamasus montanus (Willmann, 1936) | 7 |
| Mesostigmata total | 282 |
References
- Rydin, H.; Jeglum, J.K. The Biology of Peatlands, 2nd ed.; Oxford University Press: Oxford, UK, 2013. [Google Scholar]
- Gorham, E. Northern peatlands: Role in the carbon cycle and probable responses to climate warming. Ecol. Appl. 1991, 1, 182–195. [Google Scholar] [CrossRef] [PubMed]
- Limpens, J.; Berendse, F.; Blodau, C.; Canadell, J.G.; Freeman, C.; Holden, J.; Roulet, N.; Rydin, H.; Schaepman-Strub, G. Peatlands and the carbon cycle: From local processes to global implications—A synthesis. Biogeosciences 2008, 5, 1475–1491. [Google Scholar] [CrossRef] [Green Version]
- Kimmel, K.; Mander, Ü. Ecosystem services of peatlands: Implications for restoration. Prog. Phys. Geogr. 2010, 34, 491–514. [Google Scholar] [CrossRef]
- Waddington, J.M.; Griffis, T.J.; Rouse, W.R. Northern Canadian wetlands: Net ecosystem CO2 exchange and climate change. Clim. Change 1998, 40, 267–275. [Google Scholar] [CrossRef]
- Bubier, J.L.; Moore, T.R.; Bledzki, L.A. Effects of nutrient addition on vegetation and carbon cycling in an ombrotrophic bog. Glob. Change Biol. 2007, 13, 1168–1186. [Google Scholar] [CrossRef] [Green Version]
- Strack, M.; Waddington, J.M. Response of peatland carbon dioxide and methane fluxes to a water table drawdown experiment. Global Biogeochem. Cycles 2007, 21, GB1007. [Google Scholar] [CrossRef]
- Camill, P.; Barry, A.; Williams, E.; Andreassi, C.; Limmer, J.; Solick, D. Climate-vegetation-fire interactions and their impact on long-term carbon dynamics in a boreal peatland landscape in northern Manitoba, Canada. J. Geophys. Res. Biogeosci. 2009, 114, G04017. [Google Scholar] [CrossRef]
- Harris, A.; Charnock, R.; Lucas, R.M. Hyperspectral remote sensing of peatland floristic gradients. Remote Sens. Environ. 2015, 162, 99–111. [Google Scholar] [CrossRef] [Green Version]
- McPartland, M.Y.; Kane, E.S.; Falkowski, M.J.; Kolka, R.; Turetsky, M.R.; Palik, B.; Montgomery, R.A. The response of boreal peatland community composition and NDVI to hydrologic change, warming, and elevated carbon dioxide. Glob. Change Biol. 2019, 25, 93–107. [Google Scholar] [CrossRef] [Green Version]
- Tian, J.; Branfireun, B.A.; Lindo, Z. Global change alters peatland carbon cycling through plant biomass allocation. Plant Soil 2020, 455, 53–64. [Google Scholar] [CrossRef]
- Tahvanainen, T. Water chemistry of mires in relation to the poor-rich vegetation gradient and contrasting geochemical zones of the north-eastern fennoscandian Shield. Folia Geobot. 2004, 39, 353–369. [Google Scholar] [CrossRef]
- Wheeler, B.D.; Proctor, M.C.F. Ecological gradients, subdivisions and terminology of north-west European mires. J. Ecol. 2000, 88, 187–203. [Google Scholar] [CrossRef]
- Bragazza, L.; Gerdol, R. Are nutrient availability and acidity-alkalinity gradients related in Sphagnum-dominated peatlands? J. Veg. Sci. 2002, 13, 473–482. [Google Scholar] [CrossRef]
- Ruuhijärvi, R.; Lindholm, T. Ecological gradients as the basis of Finnish mire site type system. In Finland—Land of Mires; Lindholm, T., Heikkilä, R., Eds.; The Finnish Environment 23/2006; Finnish Environment Institute: Helsinki, Finland, 2006; pp. 119–126. [Google Scholar]
- Hajkova, P.; Hajek, M. Sphagnum distribution patterns along environmental gradients in Bulgaria. J. Bryol. 2007, 29, 18–26. [Google Scholar] [CrossRef]
- Markkula, I. Comparison of the communities of oribatids (Acari: Cryptostigmata) of virgin and forest ameliorated pine bogs. Ann. Zool. Fenn. 1986, 23, 33–38. [Google Scholar]
- Borcard, D.; Von Ballmoos, V.C. Oribatid mites (Acari, Oribatida) of a primary peat bog pasture transition in the Swiss Jura Mountains. Ecoscience 1997, 4, 470–479. [Google Scholar] [CrossRef]
- Starý, J. Contribution to the knowledge of the oribatid mite fauna (Acari, Oribatida) of peat bogs in Bohemian Forest. Silva Gabreta 2006, 12, 35–47. [Google Scholar]
- Gergócs, V.; Hufnagel, L. Application of oribatid mites as indicators (review). AEER 2009, 7, 79–98. [Google Scholar] [CrossRef]
- Gulvik, M.E. Mites (Acari) as indicators of soil biodiversity and land use monitoring: A review. Pol. J. Ecol. 2007, 55, 415–440. [Google Scholar]
- Seniczak, A. Oribatid mites (Acari, Oribatida) and their seasonal dynamics in a floating bog mat in Jeziorka Kozie Reserve, Tuchola Forest (Poland). Biol. Lett. 2011, 48, 3–11. [Google Scholar] [CrossRef] [Green Version]
- Lehmitz, R. The oribatid mite community of a German peatland in 1987 and 2012—Effects of anthropogenic desiccation and afforestation. Soil Org. 2014, 86, 131–145. [Google Scholar]
- Minor, M.A.; Ermilov, S.G.; Philippov, D.A.; Prokin, A.A. Relative importance of local habitat complexity and regional factors for assemblages of oribatid mites (Acari: Oribatida) in Sphagnum peat bogs. Exp. Appl. Acarol. 2016, 70, 275–286. [Google Scholar] [CrossRef] [PubMed]
- Minor, M.A.; Ermilov, S.G.; Philippov, D.A. Hydrology-driven environmental variability determines abiotic characteristics and Oribatida diversity patterns in a Sphagnum peatland system. Exp. Appl. Acarol. 2019, 77, 43–58. [Google Scholar] [CrossRef] [PubMed]
- Donaldson, G.M. Oribatida (Acari) associated with three species of Sphagnum at Spruce Hole Bog, New Hampshire, US. Can. J. Zool. 1996, 74, 1713–1720. [Google Scholar] [CrossRef]
- Kreyling, J.; Tanneberger, F.; Jansen, F.; van der Linden, S.; Aggenbach, C.; Blüml, V.; Jurasinski, G. Rewetting does not return drained fen peatlands to their old selves. Nat. Comm. 2021, 12, 5693. [Google Scholar] [CrossRef]
- Crichton, K.A.; Anderson, K.; Bennie, J.J.; Milton, E.J. Characterizing peatland carbon balance estimates using freely available Landsat ETM+ data. Ecohydrology 2015, 8, 493–503. [Google Scholar] [CrossRef]
- Harris, A.; Bryant, R.G. A multi-scale remote sensing approach for monitoring northern peatland hydrology: Present possibilities and future challenges. J. Environ. Manag. 2009, 90, 2178–2188. [Google Scholar] [CrossRef]
- Dissanska, M.; Bernier, M.; Payette, S. Object-based classification of very high resolution panchromatic images for evaluating recent change in the structure of patterned peatlands. Can. J. Remote Sens. 2009, 35, 189–215. [Google Scholar] [CrossRef]
- Anderson, K.; Bennie, J.J.; Milton, E.J.; Hughes, P.D.M.; Lindsay, R.; Meade, R. Combining LiDAR and IKONOS data for eco-hydrological classification of an ombrotrophic bog. J. Environ. Qual. 2010, 39, 260–273. [Google Scholar] [CrossRef]
- Meingast, K.M.; Falkowski, M.J.; Kane, E.S.; Potvin, L.R.; Benscoter, B.W.; Smith, A.M.S.; Bourgeau-Chavez, L.L.; Miller, M.E. Spectral detection of near-surface moisture content and water-table position in northern peatland ecosystems. Remote Sens. Environ. 2014, 152, 536–546. [Google Scholar] [CrossRef]
- Middleton, M.; Närhi, P.; Arkimaa, H.; Hyvönen, E.; Kuosmanen, V.; Treitz, P.; Sutinen, R. Ordination and hyperspectral remote sensing approach to classify peatland biotopes along soil moisture and fertility gradients. Remote Sens. Environ. 2012, 124, 596–609. [Google Scholar] [CrossRef]
- Linkosalmi, M.; Tuovinen, J.P.; Nevalainen, O.; Peltoniemi, M.; Taniş, C.M.; Arslan, A.N.; Aurela, M. Tracking vegetation phenology of pristine northern boreal peatlands by combining digital photography with CO2 flux and remote sensing data. Biogeosciences 2022, 19, 4747–4765. [Google Scholar] [CrossRef]
- Pettorelli, N.; Vik, J.O.; Mysterud, A.; Gaillard, J.M.; Tucker, C.J.; Stenseth, N.C. Using the satellite-derived NDVI to assess ecological responses to environmental change. Trends Ecol. Evol. 2005, 20, 503–510. [Google Scholar] [CrossRef]
- Boelman, N.T.; Stieglitz, M.; Rueth, H.M.; Sommerkorn, M.; Griffin, K.L.; Shaver, G.R.; Gamon, J.A. Response of NDVI, biomass, and ecosystem gas exchange to long-term warming and fertilization in wet sedge tundra. Oecologia 2003, 135, 414–421. [Google Scholar] [CrossRef]
- Sonnentag, O.; Chen, J.M.; Roberts, D.A.; Talbot, J.; Halligan, K.; Govind, A. Mapping tree and shrub leaf area indices in an ombrotrophic peatland through multiple end member spectral unmixing. Int. J. Remote Sens. 2007, 109, 342–360. [Google Scholar]
- Dube, T.; Pandit, S.; Shoko, C.; Ramoelo, A.; Mazvimavi, D.; Dalu, T. Numerical assessments of leaf area index in tropical savanna rangelands, South Africa using Landsat 8 OLI derived metrics and in-situ measurements. Remote Sens. 2019, 11, 829. [Google Scholar] [CrossRef] [Green Version]
- Räsänen, A.; Juutinen, S.; Kalacska, M.; Aurela, M.; Heikkinen, P.; Mäenpää, K.; Virtanen, T. Peatland leaf-area index and biomass estimation with ultra-high resolution remote sensing. GIScience Remote Sens. 2020, 57, 943–964. [Google Scholar] [CrossRef]
- Philippov, D.A.; Ermilov, S.G.; Zaytseva, V.L.; Pestov, S.V.; Kuzmin, E.A.; Shabalina, J.N.; Sazhnev, A.S.; Ivicheva, K.N.; Sterlyagova, I.N.; Leonov, M.M.; et al. Biodiversity of a boreal mire, including its hydrographic network (Shichengskoe mire, north-western Russia). Biodivers. Data J. 2021, 9, e77615. [Google Scholar] [CrossRef]
- Rydin, H.; Sjörs, H.; Löfroth, M. Mires. Acta Phytogeogr. Suec. 1999, 84, 91–112. [Google Scholar]
- Eurola, S.; Huttunen, A. Mire plant species and their ecology in Finland. In Finland—Land of Mires; Lindholm, T., Heikkilä, R., Eds.; The Finnish Environment 23/2006; Finnish Environment Institute: Helsinki, Finland, 2006; pp. 127–144. [Google Scholar]
- Weigmann, G.; Deichsel, R. Acari: Limnic Oribatida. In Chelicerata: Araneae, Acari I. Susswasserfauna von Mitteleuropa; Gerecke, R., Ed.; Elsevier Spektrum Akademischer Verlag: München, Germany, 2006; Volume 7. [Google Scholar]
- Landsat 8 (L8) Data Users Handbook. Version 5.0, U.S. Geological Survey. 2019. Available online: https://www.usgs.gov/landsat-missions/landsat-8-data-users-handbook (accessed on 20 May 2022).
- Meyer, G.E.; Neto, J.C. Verification of color vegetation indices for automated crop imaging applications. Comput. Electron. Agric. 2008, 63, 282–293. [Google Scholar] [CrossRef]
- Liu, Z.; Hu, H.; Yu, H.; Yang, X.; Yang, H.; Ruan, C.; Wang, Y.; Tang, J. Relationship between leaf physiologic traits and canopy color indices during the leaf expansion period in an oak forest. Ecosphere 2015, 6, 259. [Google Scholar] [CrossRef]
- Gao, B.-C. NDWI—A normalized difference water index for remote sensing of vegetation liquid water from space. Remote Sens. Environ. 1996, 58, 257–266. [Google Scholar] [CrossRef]
- Ceccato, P.; Flasse, S.; Tarantola, S.; Jacquemoud, S.; Grégoire, J.M. Detecting vegetation leaf water content using reflectance in the optical domain. Remote Sens. Environ. 2001, 77, 22–33. [Google Scholar] [CrossRef]
- Rock, B.N.; Vogelmann, J.E.; Williams, D.L.; Vogelmann, A.F.; Hoshizaki, T. Remote detection of forest damage. Bioscience 1986, 36, 439–445. [Google Scholar] [CrossRef]
- Welikhe, P.; Quansah, J.E.; Fall, S.; Elhenney, W.M. Estimation of soil moisture percentage using LANDSAT-based Moisture Stress Index. J. Remote Sens. GIS 2017, 6, 200. [Google Scholar] [CrossRef]
- Genuer, R.; Poggi, J.-M.; Tuleau-Malot, C. Variable selection using Random Forests. Pattern Recognit. Lett. 2010, 31, 2225–2236. [Google Scholar] [CrossRef]
- Murphy, M.A.; Evans, J.S.; Storfer, A.S. Quantifying Bufo boreas connectivity in Yellowstone National Park with landscape genetics. Ecology 2010, 91, 252–261. [Google Scholar] [CrossRef] [Green Version]
- Chust, G.; Lek, S.; Deharveng, L.; Ventura, D.; Ducrot, D.; Pretus, J. The effects of the landscape pattern on arthropod assemblages: An analysis of scale-dependence using satellite data. Belg. J. Entomol. 2000, 2, 99–110. [Google Scholar]
- Hamilton, S.K.; Kellndorfer, J.; Lehner, B.; Tobler, M. Remote sensing of floodplain geomorphology as a surrogate for biodiversity in a tropical river system (Madre de Dios, Peru). Geomorphology 2007, 89, 23–38. [Google Scholar] [CrossRef]
- Madonsela, S.; Cho, M.A.; Ramoelo, A.; Mutanga, O. Remote sensing of species diversity using Landsat 8 spectral variables. ISPRS J. Photogramm. Remote Sens. 2017, 133, 116–127. [Google Scholar] [CrossRef] [Green Version]
- Rocchini, D.; Boyd, D.S.; Féret, J.B.; Foody, G.M.; He, K.S.; Lausch, A.; Pettorelli, N. Satellite remote sensing to monitor species diversity: Potential and pitfalls. Remote Sens. Ecol. Conserv. 2016, 2, 25–36. [Google Scholar] [CrossRef]
- Chust, G.; Pretus, J.L.; Ducrot, D.; Bedos, A.; Deharveng, L. Response of soil fauna to landscape heterogeneity: Determining optimal scales for biodiversity modeling. Conserv. Biol. 2003, 17, 1712–1723. [Google Scholar] [CrossRef]
- Fleri, J.R.; Arcese, P. Predictive mapping to identify refuges for plant communities threatened by earthworm invasion. Ecol. Solut. Evid. 2021, 2, e12064. [Google Scholar] [CrossRef]
- Skidmore, A.K.; Siegenthaler, A.; Wang, T.; Darvishzadeh, R.; Zhu, X.; Chariton, A.; De Groot, G.A. Mapping the relative abundance of soil microbiome biodiversity from eDNA and remote sensing. Sci. Remote Sens. 2022, 6, 100065. [Google Scholar] [CrossRef]
- Bubier, J.L.; Rock, B.N.; Crill, P.M. Spectral reflectance measurements of boreal wetland and forest mosses. J. Geophys. Res. Atmos. 1997, 102, 29483–29494. [Google Scholar] [CrossRef]
- Whiting, G.J. CO2 exchange in the Hudson-Bay lowlands—Community characteristics and multispectral reflectance properties. J. Geophys. Res. Atmos. 1994, 99, 1519–1528. [Google Scholar] [CrossRef]
- Zhang, W.; Lu, Q.; Song, K.; Qin, G.; Wang, Y.; Wang, X.; Li, H.; Li, J.; Liu, G.; Li, H. Remotely Sensing the Ecological Influences of Ditches in Zoige Peatland, Eastern Tibetan Plateau. Int. J. Remote Sens. 2014, 35, 5186–5197. [Google Scholar] [CrossRef]
- Hasan, A.; Pilesjö, P.; Persson, A. On generating digital elevation models from liDAR data–resolution versus accuracy and topographic wetness index indices in northern peatlands. Geod. Cartogr. 2012, 38, 57–69. [Google Scholar] [CrossRef] [Green Version]
- Carless, D.; Luscombe, D.J.; Gatis, N.; Anderson, K.; Brazier, R.E. Mapping landscape-scale peatland degradation using airborne lidar and multispectral data. Landsc. Ecol. 2019, 34, 1329–1345. [Google Scholar] [CrossRef] [Green Version]
- Lees, K.J.; Artz, R.R.E.; Chandler, D.; Aspinall, T.; Boulton, C.A.; Buxton, J.; Cowie, N.R.; Lenton, T.M. Using remote sensing to assess peatland resilience by estimating soil surface moisture and drought recovery. Sci. Total Environ. 2021, 761, 143312. [Google Scholar] [CrossRef]
- Weigmann, G. Hornmilben (Oribatida); Die Tierwelt Deutschlands Bd. 76, Goecke and Evers: Keltern, Germany, 2006; p. 520. [Google Scholar]
- Balogh, J.; Balogh, P. Identification Keys to the Oribatid Mites of the Extra-Holarctic Regions; Well-Press Publ Limited: Miskolc, Hungary, 2002; Volume 1, p. 453. [Google Scholar]
- Norton, R.A.; Behan-Pelletier, V.M. Chapter 15. Oribatida. In A Manual of Acarology; Krantz, G.W., Walter, D.E., Eds.; Texas Tech Univ Press: Lubbock, TX, USA, 2009; pp. 430–564. [Google Scholar]
- Karg, W. Acari (Acarina), Milben. Parasitiformes (Anactinochaeta). Cohors Gamasina Leach: Raubmilben, 2nd ed.; VEB Gustav Fischer Verlag: Jena, Germany, 1993; p. 523. [Google Scholar]
- Gilyarov, M.S.; Bregetova, N.G. Key to the Soil Inhabiting Mites, Mesostigmata; Nauka: Leningrad, Russia, 1977; p. 717. (In Russian) [Google Scholar]
- Evans, G.O.; Hyatt, K.H. A revision of the Platyseiinae (Mesostigmata: Aceosejidae) based on material in the collections of the British Museum (Natural History). Bull. Brit. Mus. Nat. Hist. Zool. 1960, 6, 27–101. [Google Scholar]
- Evans, G.O.; Till, W.M. Studies on the British Dermanyssidae (Acari: Mesostigmata). Part II. Classification. Bull. Brit. Mus. Nat. Hist. Zool. 1966, 14, 107–370. [Google Scholar]
- Mašán, P.; Fend’a, P. Zerconid mites of Slovakia (Acari, Mesostigmata, Zerconidae); Institute of Zoology, Slovak Academy of Sciences: Bratislava, Slovakia, 2004; p. 238. [Google Scholar]


| Band 2 | Band 3 | Band 4 | Band 5 | Band 6 | Band 7 | |
|---|---|---|---|---|---|---|
| pH | −0.17 | −0.06 | −0.15 | 0.09 | −0.22 | −0.45 ** |
| Trophic class | −0.32 * | −0.13 | −0.38 ** | −0.11 | −0.22 | −0.46 ** |
| Water table depth | 0.30 * | 0.26 | 0.35 * | 0.38 ** | 0.19 | 0.09 |
| Mesostigmata Diversity | Oribatida Diversity | |||||
|---|---|---|---|---|---|---|
| Abundance | Richness | Abundance, Aquatic | Abundance, Terrestrial | Richness, Terrestrial | ||
| 2019 | Trophic class | −0.07 | 0.03 | 0.26 + | −0.09 | −0.04 |
| pH | −0.10 | −0.04 | 0.17 | −0.08 | −0.08 | |
| Water table depth | −0.54 *** | −0.45 ** | 0.28 + | −0.21 | −0.33 * | |
| 2016 | Trophic class | na | na | −0.24 | 0.46 *** | 0.63 *** |
| pH | na | na | 0.12 | 0.06 | 0.19 | |
| Water table depth | na | na | 0.66 *** | −0.44 ** | −0.41 ** | |
| Index | Trophic Class | pH | Water Table Depth | Nutrients in Sphagnum Tissues | Oribatida Diversity | ||||
|---|---|---|---|---|---|---|---|---|---|
| C:N | P | K | Abundance, Aquatic | Abundance, Terrestrial | Richness, Terrestrial | ||||
| NDVI | 0.55 *** | 0.47 ** | 0.13 | −0.19 | −0.31 * | 0.21 | −0.18 | 0.38 ** | 0.45 *** |
| ExG | 0.63 *** | 0.25 + | −0.19 | −0.24 + | −0.28 + | 0.37 ** | −0.35 ** | 0.52 *** | 0.63 *** |
| ExG−ExR | −0.54 *** | −0.21 | 0.39 ** | 0.34 ** | −0.43 ** | −0.36 ** | 0.26 + | −0.41 ** | −0.50 *** |
| NDMI | 0.08 | 0.27 + | 0.35 ** | 0.09 | −0.60 *** | −0.05 | 0.06 | 0.00 | 0.02 |
| SWIR1/NIR | −0.11 | −0.27 + | −0.33 ** | −0.08 | 0.61 *** | 0.03 | −0.04 | −0.03 | −0.06 |
| Index | Trophic Class | pH | Water Table Depth | Mesostigmata Diversity | Oribatida Diversity | |||
|---|---|---|---|---|---|---|---|---|
| Abundance | Richness | Abundance, Aquatic | Abundance, Terrestrial | Richness, Terrestrial | ||||
| NDVI | 0.35 * | 0.21 | −0.15 | 0.26 + | 0.19 | 0.20 | 0.01 | −0.03 |
| ExG | 0.14 | 0.23 | 0.16 | −0.09 | 0.11 | −0.11 | −0.02 | −0.05 |
| ExG−ExR | −0.44 ** | −0.22 | 0.13 | −0.25 | −0.20 | −0.20 | −0.01 | 0.01 |
| NDMI | −0.15 | 0.01 | 0.42 ** | −0.30 + | −0.26 + | −0.12 | −0.11 | −0.12 |
| SWIR1/NIR | 0.15 | 0.00 | −0.42 ** | 0.30 * | 0.25 | 0.13 | 0.10 | 0.11 |
| Model Information | Variable Selection | %IncMSE |
|---|---|---|
| No. of trees: 300 No. of variables tried at each split: 3 Mean of squared residuals: 0.234 No. of permutations: 999 Model significant at p = 0.001 Model R-square: 0.528 | ExG | 0.375 |
| ExG−ExR | 0.124 | |
| NDVI | 0.047 | |
| SWIR1/NIR | 0.027 | |
| NDMI | 0.023 |
Disclaimer/Publisher’s Note: The statements, opinions and data contained in all publications are solely those of the individual author(s) and contributor(s) and not of MDPI and/or the editor(s). MDPI and/or the editor(s) disclaim responsibility for any injury to people or property resulting from any ideas, methods, instructions or products referred to in the content. |
© 2022 by the authors. Licensee MDPI, Basel, Switzerland. This article is an open access article distributed under the terms and conditions of the Creative Commons Attribution (CC BY) license (https://creativecommons.org/licenses/by/4.0/).
Share and Cite
Minor, M.A.; Ermilov, S.G.; Joharchi, O.; Philippov, D.A. Using Spectral Indices Derived from Remote Sensing Imagery to Represent Arthropod Biodiversity Gradients in a European Sphagnum Peat Bog. Arthropoda 2023, 1, 35-46. https://doi.org/10.3390/arthropoda1010006
Minor MA, Ermilov SG, Joharchi O, Philippov DA. Using Spectral Indices Derived from Remote Sensing Imagery to Represent Arthropod Biodiversity Gradients in a European Sphagnum Peat Bog. Arthropoda. 2023; 1(1):35-46. https://doi.org/10.3390/arthropoda1010006
Chicago/Turabian StyleMinor, Maria A., Sergey G. Ermilov, Omid Joharchi, and Dmitriy A. Philippov. 2023. "Using Spectral Indices Derived from Remote Sensing Imagery to Represent Arthropod Biodiversity Gradients in a European Sphagnum Peat Bog" Arthropoda 1, no. 1: 35-46. https://doi.org/10.3390/arthropoda1010006