Article

Estrogen Receptor β Isoforms Regulate Chemotherapy Resistance and the Cancer Stem Cell Population in Prostate Cancer Cells

1
Center for Nuclear Receptors and Cell Signaling, Science & Engineering Research Center, Department of Biology and Biochemistry, University of Houston, Houston, TX 77204, USA
2
Department of BioSciences and Nutrition, Karolinska Institutet, 171 77 Huddinge, Sweden
*
Authors to whom correspondence should be addressed.
Receptors 2023, 2(3), 176-190; https://doi.org/10.3390/receptors2030012
Submission received: 7 May 2023 / Revised: 11 June 2023 / Accepted: 30 June 2023 / Published: 1 August 2023

Abstract

:
Estrogen receptor beta 1 (ERβ1) is a ligand-activated nuclear receptor, which has been shown to maintain tissue differentiation in the normal prostate, and regulate androgen response and increase expression of tumor suppressors in prostate cancer cell lines. There are three shorter isoforms of ERβ expressed in the human prostate, ERβ2, ERβ4, and ERβ5, which have already been implicated in chemotherapy resistance and disease progression, suggesting a possible oncogenic role. Their ligand-binding domain (LBD) is truncated, so they are unable to activate canonical ERβ1 signaling pathways; however, they were shown to participate in hypoxic signaling and to induce a gene expression signature associated with stemness and hypoxia. To elucidate the role of the truncated ERβ isoforms in prostate cancer, we created a knockout of all isoforms, as well as a truncation of the LBD, to remove the function of ERβ1. We showed that the removal of all isoforms leads to a decrease in the expression of cancer stem cell (CSC)-associated genes, decreased chemotherapy resistance, and a decrease in the CSC population, based on sphere formation ability and SORE6 (CSC reporter) activity, while removing the LBD function only had the opposite effect. Our results suggest a more aggressive phenotype in prostate cancer cell lines expressing ERβ variants.

1. Introduction

Estrogen receptor β (ERβ) was discovered 25 years ago [1], which was followed by the discovery of additional isoforms shortly thereafter [2,3]. Four isoforms are expressed in the human prostate: ERβ1, which is the ligand-binding full-length form, and the shorter isoforms ERβ2, ERβ4, and ERβ5. In humans, the isoforms ERβ2 and ERβ4 are generated by alternative splicing after exon 7 with the addition of a short exon [3], whereas ERβ5 is a read-through of exon 7 into the next intron until a stop codon is reached. The truncation leaves these isoforms unable to bind ligands and successively form homodimers and bind to the estrogen response elements. However, they have been shown to form heterodimers with ERβ1 in vitro [3], which would allow them to function similarly to ERβ1, with the ability to recruit a different pool of co-regulators.
The function of the isoforms has yet to be fully elucidated, but the variants ERβ2 and ERβ5 have been shown to be more highly expressed in prostate cancer (PCa) and are associated with poor survival and postoperative metastasis, while ERβ1 expression, which has been shown to exhibit tumor-suppressive action, declines during disease progression [3,4,5].
Prostate cancer is commonly treated through androgen deprivation therapy (ADT) and chemotherapy or radiotherapy, but up to 40% of patients with a more advanced form of the disease suffer from relapse, caused by a combination of acquired androgen independence and resistance to the common chemo- and radiotherapy [6,7,8]. In the normal prostate, the androgen receptor (AR) suppresses cancer stem cell proliferation and propagation [9]. In PCa, AR supports cell proliferation of the cancer cells. Androgen deprivation therapy (ADT) induces cellular apoptosis, leading to regression of bulk cell growth at first, but does not eliminate the androgen-independent cancer stem cells, and later on, PCa progresses to castration resistance, where AR signaling is upheld by numerous mechanisms, allowing the cancer to expand. Furthermore, during the progression of the disease, developmental signaling pathways are reactivated, leading to the expression of a wide range of genes associated with promoting pluripotency, further driving the disease [10,11,12].
ERβ1 has been shown to both regulate androgen response and prevent hyperplasia and proliferation, and is ubiquitously expressed in the prostate. Furthermore, ADT leads to the loss of 3β-Adiol, the natural ligand of ERβ1 in the prostate, ablating the previously described positive effects. This, together with the seemingly opposite effect of the truncated isoforms, makes it important to fully understand the role of all ERβ isoforms in PCa progression [13,14,15].
In PC3 cells, the truncated isoforms activate hypoxic signaling by interacting with HIF-1α and are recruited to HIF response elements in the Twist1 and VEGF promoters [16]. The analysis of ERβ2 and ERβ5 overexpression in PC3 cells further showed they increase the expression of genes associated with hypoxic signaling and pluripotency while increasing the resistance to chemotherapy through the heightened expression of the drug transporters MDR-1 and ABCG2 [17]. MDR-1 is a known cause of chemotherapy resistance in prostate cancer [18], and has been proven to also be regulated by hypoxia [19], as well as the CSC factor Nanog [20]. The stabilization of hypoxic signaling can subsequently drive the progression of prostate cancer by promoting pluripotency, metastasis, and resistance to chemotherapy [16,21,22,23,24,25,26,27].
The tumor-suppressive ERβ1, in contrast to the exon 7 truncated isoforms, has been shown to also promote differentiation and inhibit HIF-1α signaling by increasing degradation of HIF-1α protein and causing a shift toward mesenchymal–epithelial transition (MET) in prostate cancer cell lines [4,28,29,30].
The aim of this study was to elucidate how the ERβ truncated variants increase therapy resistance and whether they, in conjunction with hypoxic signaling, contribute to an increase in the CSC population. In addition, we wanted to further explore the opposite role of ERβ1. The understanding of the consequences of increased expression of the ERβ isoforms in PCa and their mechanism of action can make them valuable prognostic markers and can provide future points of clinical intervention. We were able to show a connection between ERβ isoform expression and an increase in hypoxic signaling and expansion of the cancer stem cell population in AR-independent PCa cell lines.

2. Materials and Methods

2.1. Reagents and Cell Culture

The LNCaP, DU145, and PC3 cell lines were obtained from the American Type Culture Collection (ATCC). LNCaP, DU145, and PC3 cells were maintained in RPMI-1640 (Invitrogen Inc., Carlsbad, CA, USA) medium supplemented with 10% fetal bovine serum (FBS) (PEAK, Wellington, CO, USA), and anti-anti (Invitrogen Inc., Carlsbad, CA, USA). All experiments used cells below passage 30. ERβ antagonist PHTPP was obtained from Tocris (Minneapolis, MN, USA).

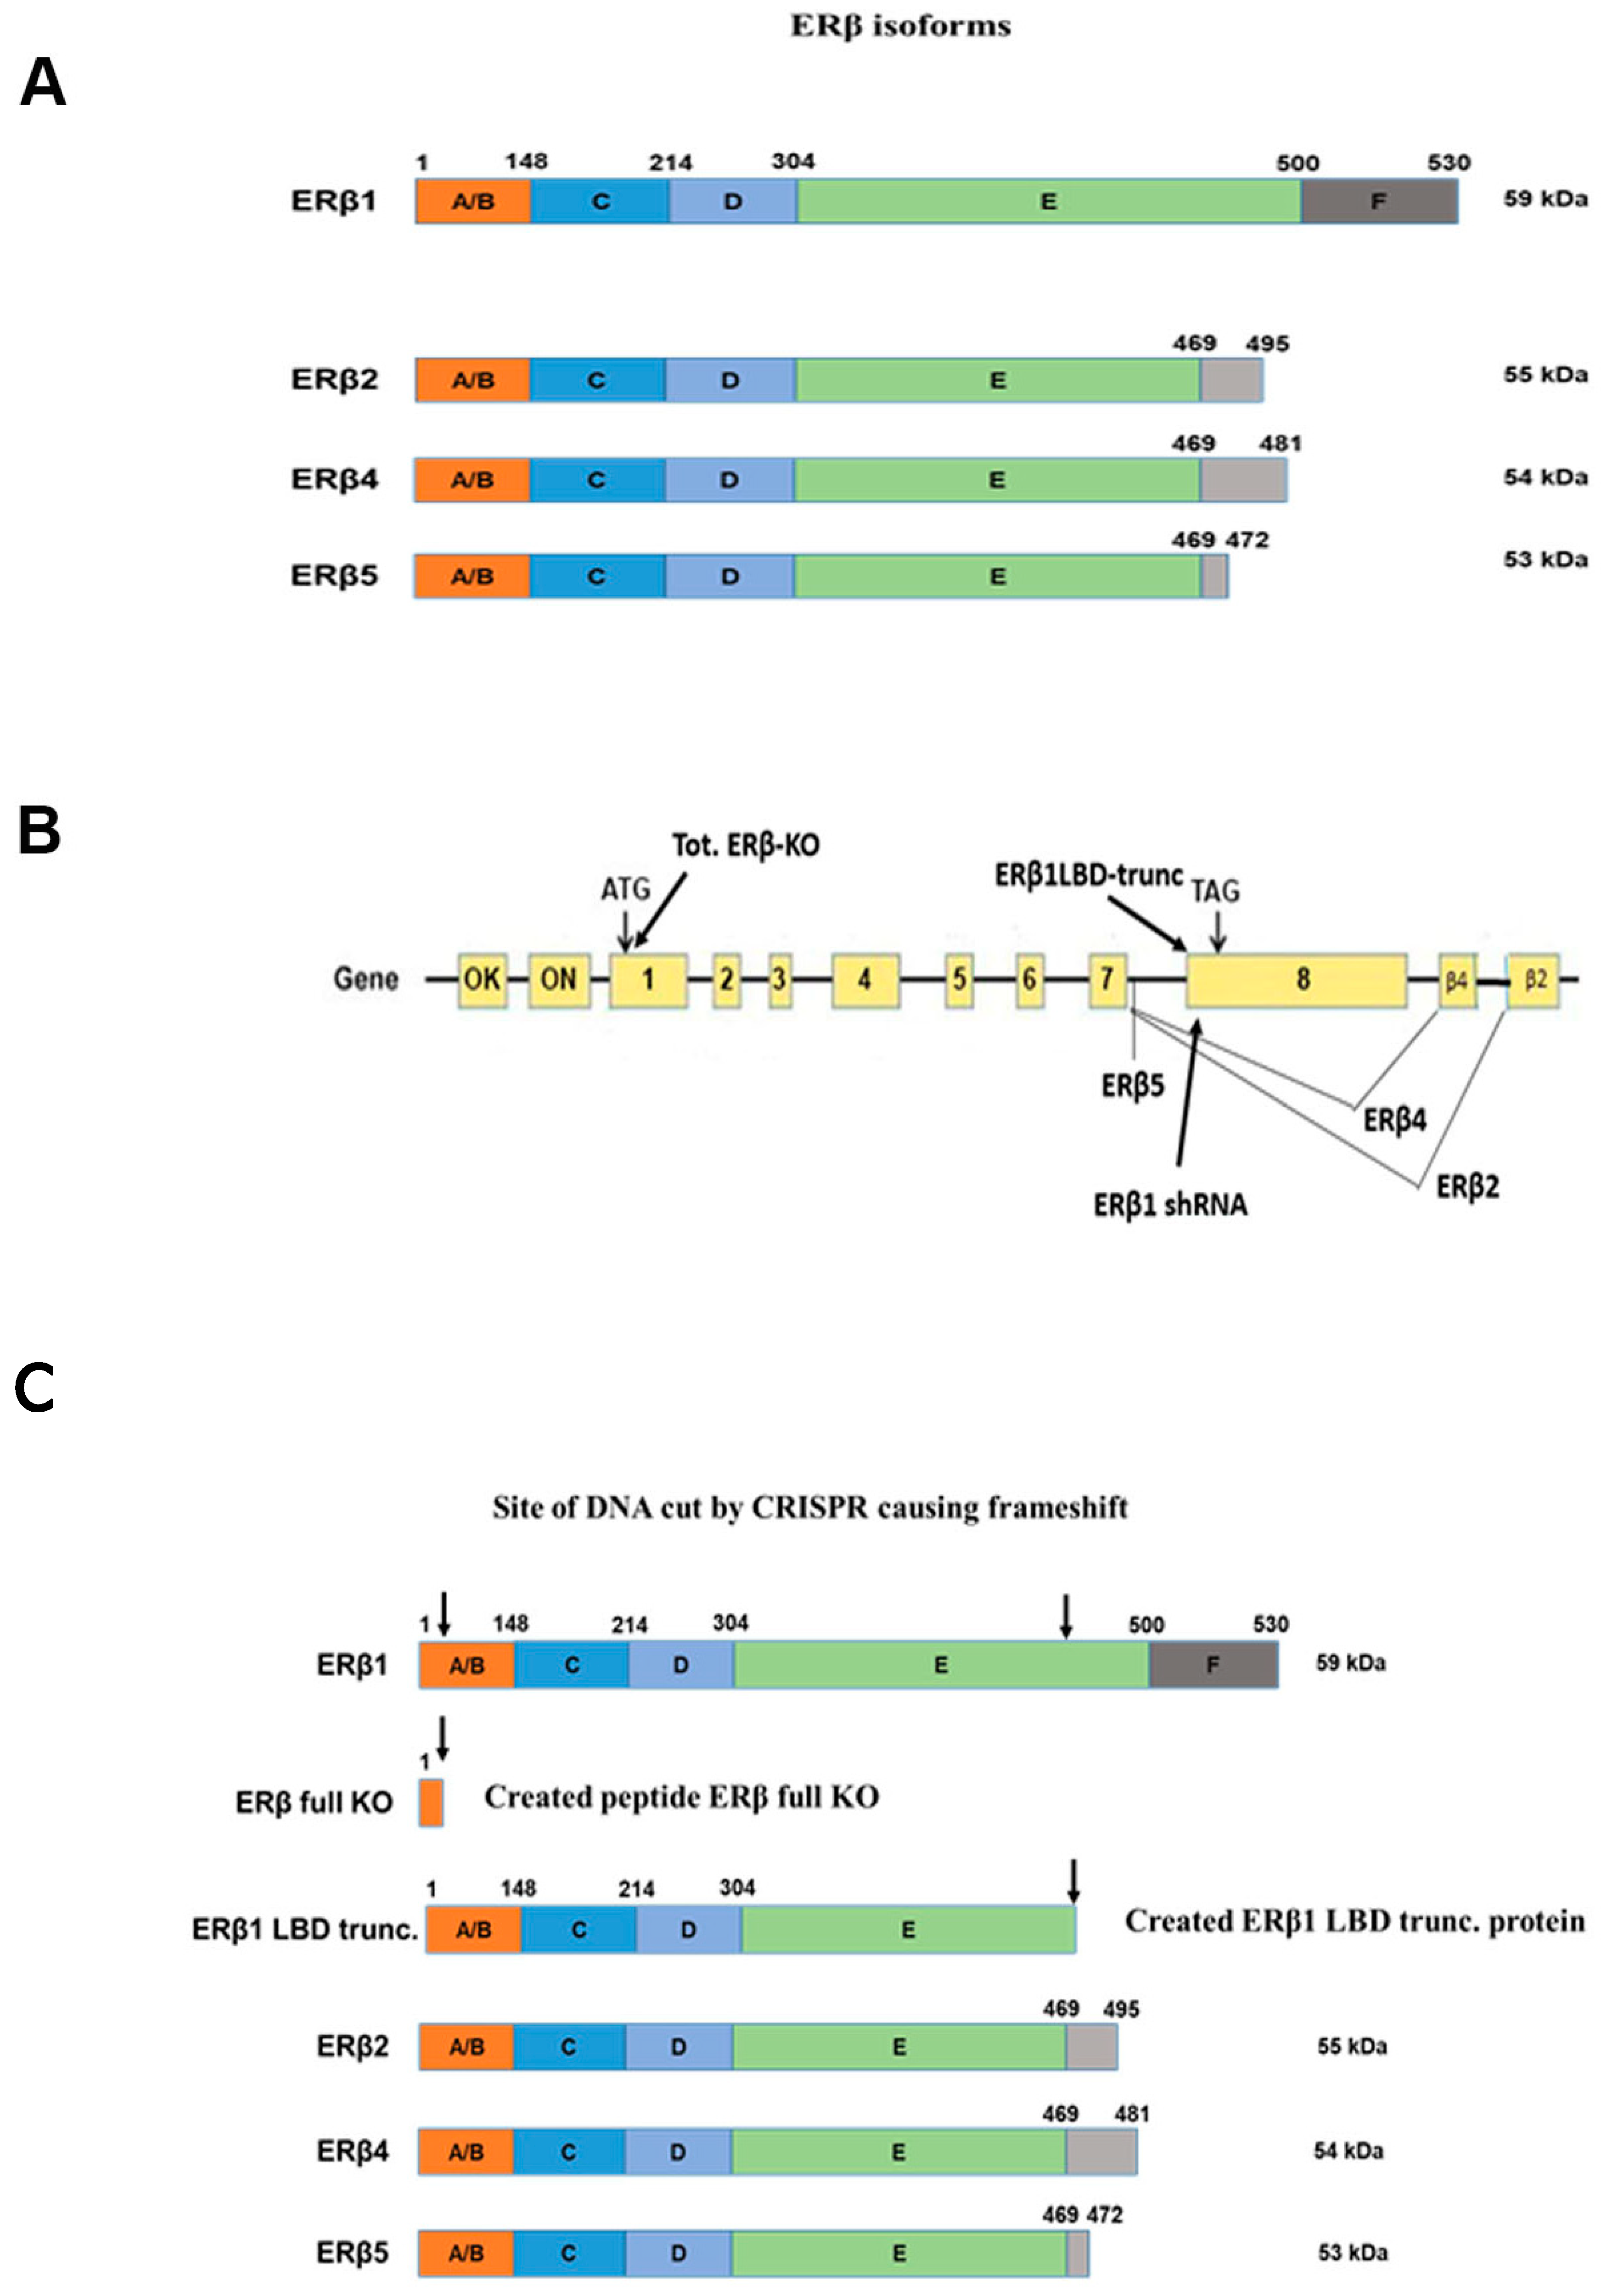
2.2. DU145, PC3, and LNCaP Cell Lines Manipulated Using CRISPR/Cas9 to Cause Either Full ERβ Knockout or LBD Truncation of Endogenous ERβ1

DU145, PC3, and LNCaP cells were infected with the lentivirus Lenti CRISPR-V2-Puro, non-target or containing guide RNA specific for human ERβ1 LBD at 2 MOI (multiples of infection). The control in all experiments were cells infected with a non-targeting CRISPR virus vector. PC3 ERβ full KO, PC3 ERβ1LBD trunc, DU145 ERβ full KO, DU145 ERβ1trunc, and LNCaP ERβ full KO or LNCaP ERβ1LBD trunc are cells infected with ERβ1 LBD targeting the CRISPR/Cas9 virus. The guide RNA sequence used for ERβ Full KO has been successfully used in two previous reports [31,32].

2.3. Chemotherapy Treatment

A total of 5000 cells/well were seeded in a final volume of 100 µL into a 96-well plate in RPMI medium with 10% FBS and left to attach overnight. On day 2, the media was replaced in all wells, and the cells were treated with docetaxel at a range of 5–125 nM. The positive control was left untreated to determine absorption for 100% viability. The cells were incubated for 72 h. On day 4, 10 µL MTS reagent (BioVision) was added to each well and the cells were incubated. The absorption was measured at 490 nm after 90 min.

2.4. Protein Extract Preparation

To prepare whole-cell extracts, cells were washed twice with PBS, lysed in 10 times packed cell volume of lysis buffer (0.1% Nonidet P-40, 250 mM KCl, 5 mM HEPES, pH 7.9, 10% (vol/vol) glycerol, 4 mM NaF, 4 mM sodium orthovanadate, 0.2 mM EDTA, 0.2 mM EGTA, 1 mM dithiothreitol, and 1 mM phenylmethylsulfonyl fluoride, protease inhibitor cocktail, PhosStop (Roche, Indianapolis, IN, USA)) for 15 min on ice and then centrifuged at 14,000× g for 10 min.

2.5. Western Blotting

Fifty micrograms of protein were loaded on an SDS-PAGE 10% Bis-Tris gel with Tris running buffer and transferred to a nitrocellulose membrane after electrophoretic separation. Membranes were blocked with 5% non-fat powdered milk in 0.1% TBST buffer and probed with anti-MDR-1 (13978) (Cell Signaling Technology, Danvers, MA, USA), β-Actin (A1978) (Sigma Millipore Sigma, St. Louis, MO, USA), anti-ALDH1A1 (54135) (Cell Signaling Technology, Danvers, MA, USA), anti-HIF-1α (14179S) (Cell Signaling Technology, Danvers, MA, USA), and anti-Nanog (3580) (Cell Signaling Technology, Danvers, MA, USA). Primary antibodies were used at 1:100–1000 dilutions, and the secondary antibodies were used at 1:5000–10,000.

2.6. Immunocytochemistry

Cells were seeded on chamber slides and grown to 70% confluency, then fixed in 4% paraformaldehyde, permeabilized with 0.1% Triton-X100, and blocked with 5% BSA in PBSt buffer, and probed with a diluted primary antibody (1:100–1:500) in 1% BSA in PBSt at 4 °C for 12 h on a shaker. After washing, the cells were incubated in the secondary antibody (1:200) diluted in 1% BSA in PBSt in the dark, for 1 h at RT. After washing the cells, the slide was mounted using a mounting medium with DAPI. The slides were imaged using Keyence BZ-X810. The antibodies used were SOX2 (Abcam #181616), HIF1α (Cell Signaling #14179), ERβ PPZ0506 (Invitrogen #417100), and ERβ1 503 (in-house). The secondary antibodies used were AlexaFluor 488 (Life Technologies #A21206), 594 (Invitrogen #A21203), and 555 (Invitrogen #A21437).

2.7. RNA Extraction and Real-Time PCR

RNA extraction was performed with a Qiagen mRNA extraction kit according to the standard protocol. cDNA was synthesized from 1 μg of total RNA with First-Strand System according to the standard protocol (Invitrogen Inc., Grand Island, NY, USA). Real-time PCR was performed with SYBR Green I dye master mix (Applied Biosystems, Foster City, CA, USA). The primers used (Integrated DNA Technologies, Inc., Coralville, IA, USA) are shown in Table 1.
The 7500 Fast Real-Time PCR system (Applied Biosystems) was used under optimized conditions for the SYBRGreen I dye system: 50 °C for 2 min, 95 °C for 10 min, followed by 40–50 cycles at 95 °C for 15 s and 60 °C for 50 s. The optimal primer concentration was determined in preliminary experiments, and amplification specificity was confirmed by a dissociation curve.

2.8. CRISPR Manipulation of Cell Lines

Annealed oligos for guide RNA specific for N-terminal ERβ, and truncation of ERβ1 LBD were cloned into the Esp3I site of the lentivirus vector pLentiCRISPR-V2 puro. The primers (Integrated DNA Technologies, Inc. Coralville, IA, USA) were as follows:
ERβ full KO F, 5′-CACCGGATTGACTGCAGTTGTAGG-3′,
R, 5′-AAACCCTACAACTGCAGTCAATCC-3′;
ERβ LBD trunc. F, 5′-CACCGCAACATGAAGTGCAAAAATG-3′
R, 5′-AAACCATTTTTGCACTTCATGTTGC-3′.
Lentivirus preparation and transduction were performed according to the standard protocol.

2.9. Tumorosphere Assay

Cells were scraped from cell culture bottles washed in PBS and resuspended in serum-free DMEM/FK-12 medium with 2% B27, 10 ng/mL bFGF, and 20 ng/mL EGF. The cells were seeded in ultra-low attachment 6-well plates (PC3: 2000 cells/well; DU145: 5000 cells/well). Images were taken after 10 days.

2.10. Statistics

The values are expressed as means with 95% confidence intervals. An unpaired two-tailed t-test was used to compare the differences between the two groups. Statistical significance is presented as * p < 0.05, ** p < 0.005, and *** p < 0.001, and non-significant differences are presented as NS.

3. Results

3.1. Prostate Cancer Cell Lines Express All ERβ Isoforms

The expression of ERβ isoforms in the prostate cancer cell lines PC3 and DU145 has been shown previously [3]. Figure 1A shows an overview of all ERβ isoforms that are expressed at a low but detectable level. To study the endogenous function of ERβ isoforms in prostate cancer cell lines we used Cas9/CRISPR technology. Lentivirus containing specific guide RNA [31,32] in combination with Cas9 was delivered into DU145 and PC3 cells. To knock out all isoforms we used an N-terminal guide RNA common for all ERβ isoforms to cause a reading frame shift in all isoforms (see Figure 1B). Figure 1C shows the resulting expressed proteins after CRISPR manipulations, where the full knockout only produces a short peptide, while the ERβ1 ligand-binding domain (LBD) truncation is expressed as a truncated receptor resembling the structure of the variants but lacking the unique 3′ peptide present in the variants. The Full ER βKO was confirmed by qPCR with a primer targeted at the frameshift site (OUTCRE7, see Figure S1A). Since the ERβ1 LBD truncation still produces a protein that will be recognized by the available anti-ERβ antibodies, as well as the ERβ1-targeted qPCR primers, we validated the loss of ERβ1 function instead, by confirming a decrease in pS2 mRNA, which is a confirmed ERβ1 target gene [33] (Figure S1B). As an additional validation of the change in gene expression observed with the CRISPR LBD truncation and to confirm that the LBD-truncated ERβ1 did not produce a gain of function protein, we also used doxycycline-inducible shRNA directed at the ERβ1 unique LBD domain. The functionality of the shRNA was confirmed by a reduced ERβ1 mRNA level, as well as reduced pS2 mRNA (see Figure S2), similar to what was observed for the CRISPR LBD truncation. The localization of the shRNA is shown in Figure 1B.

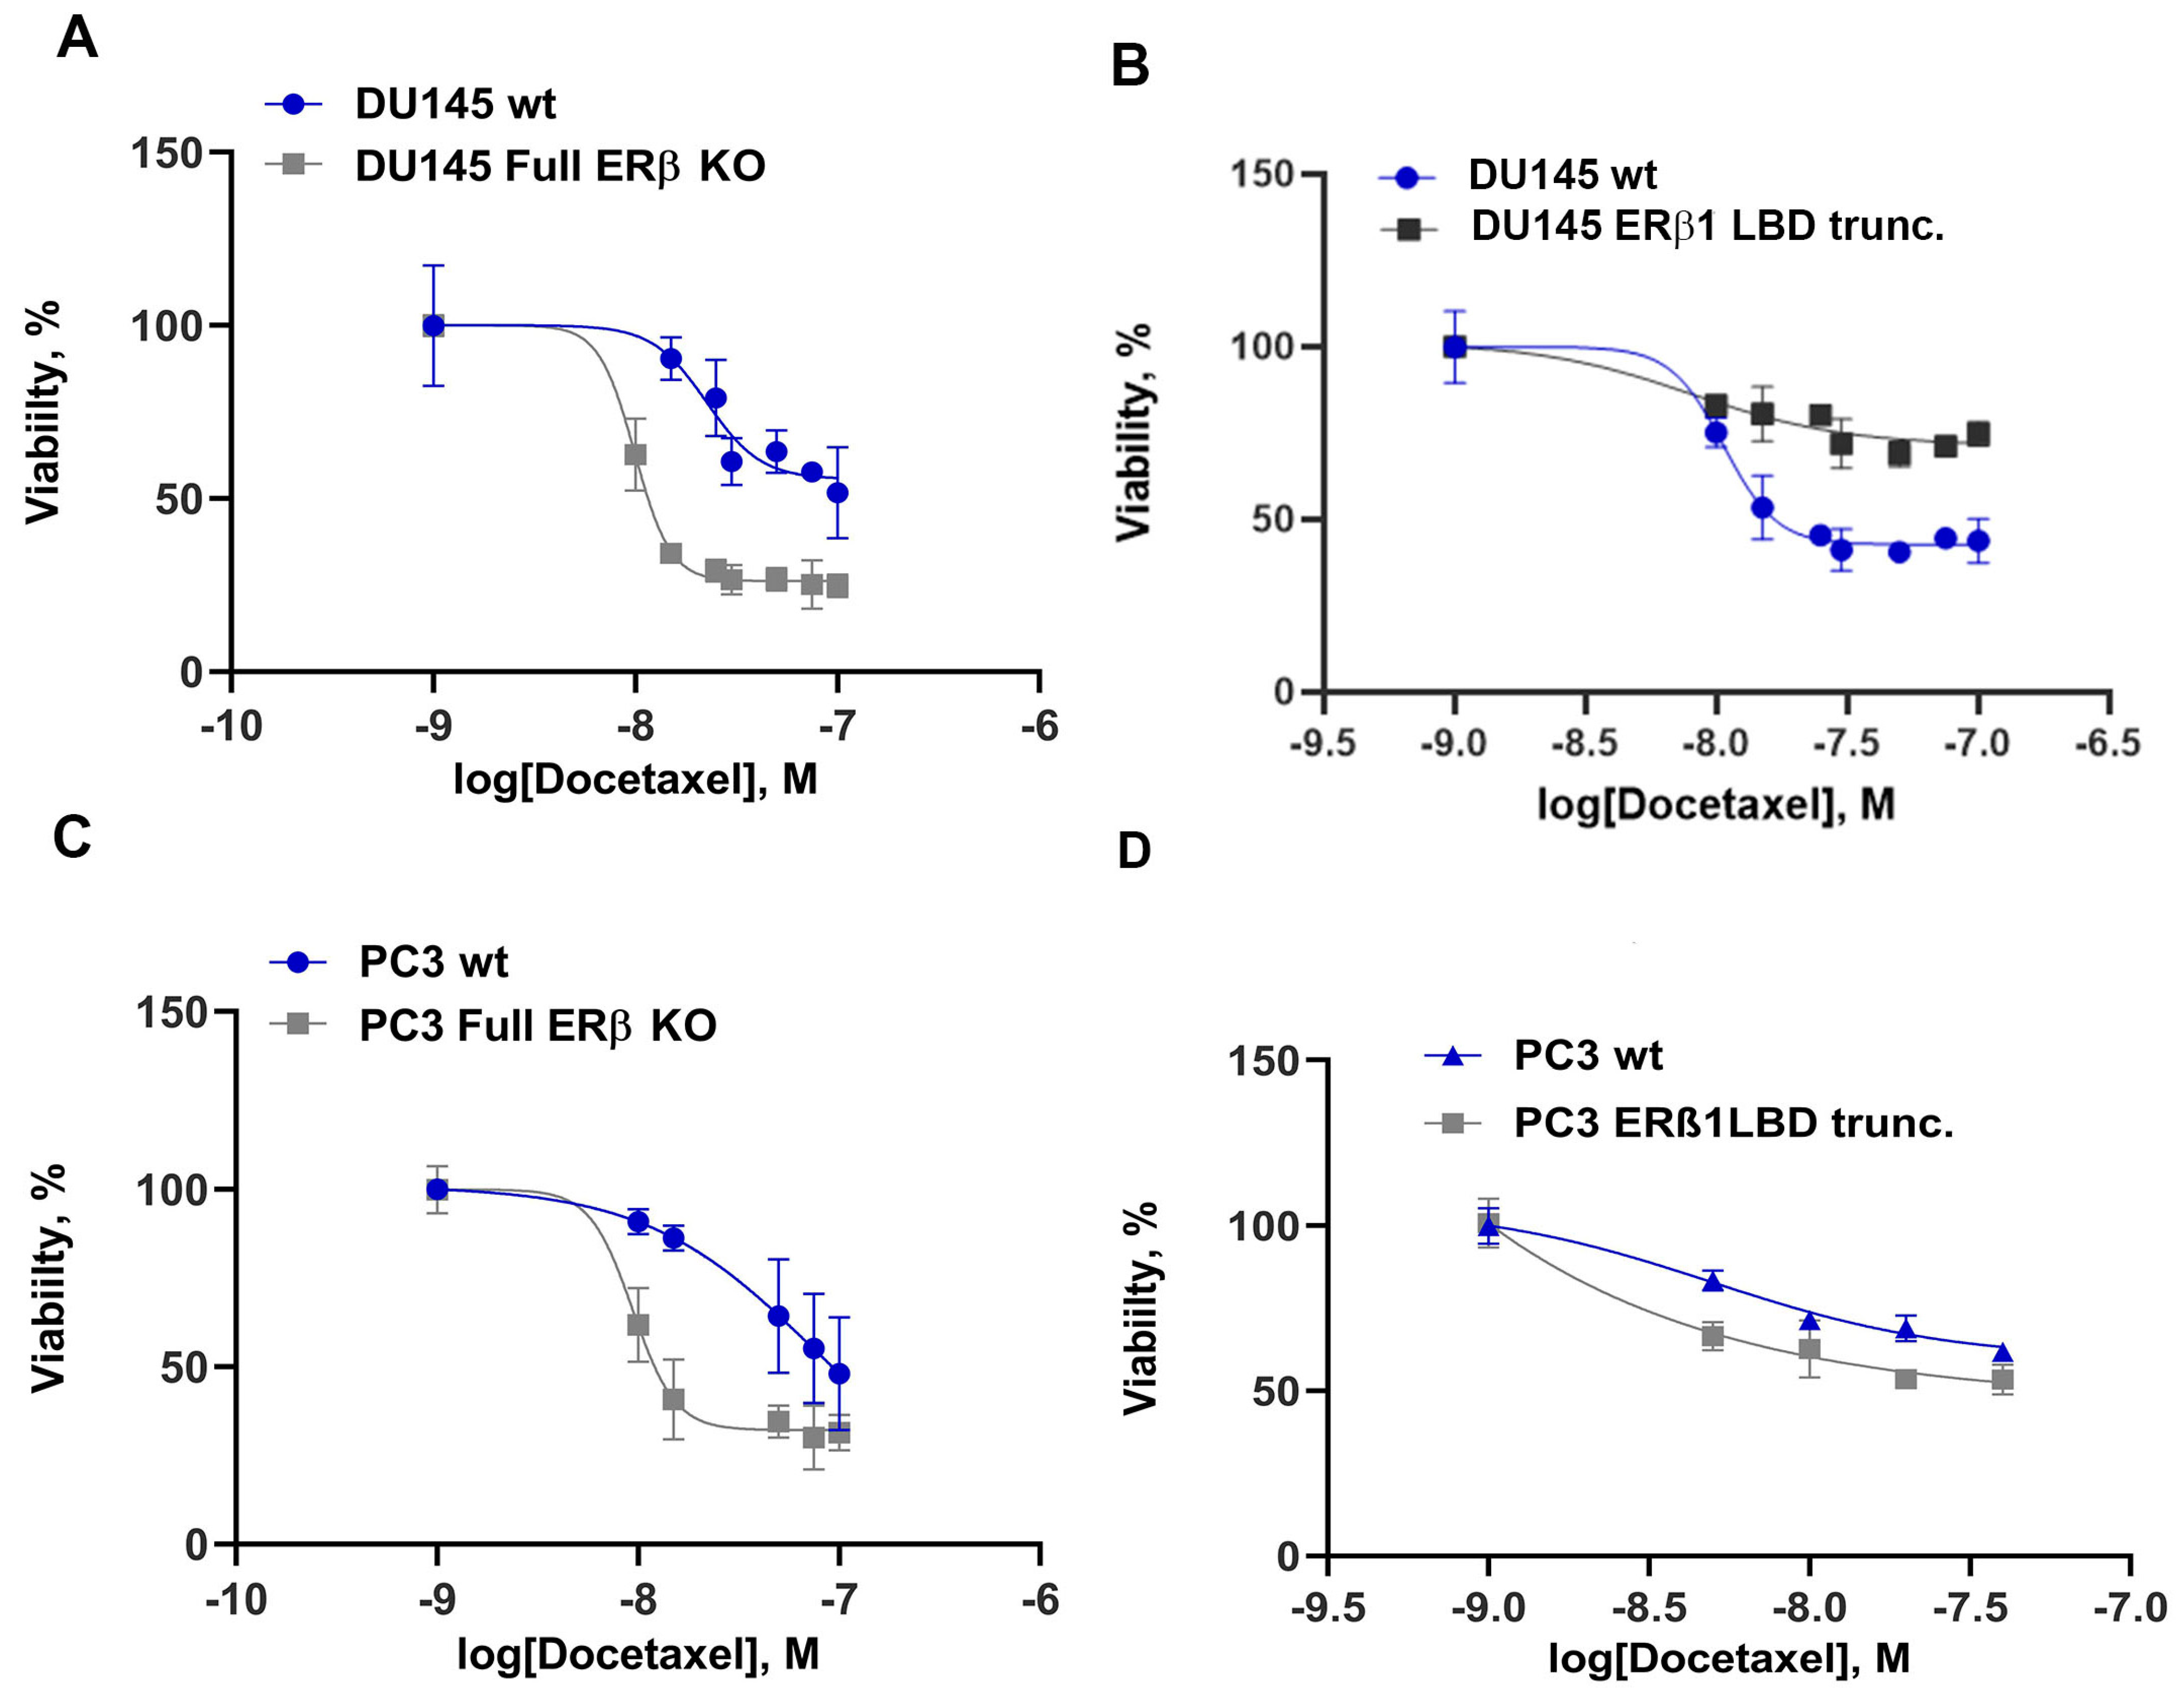
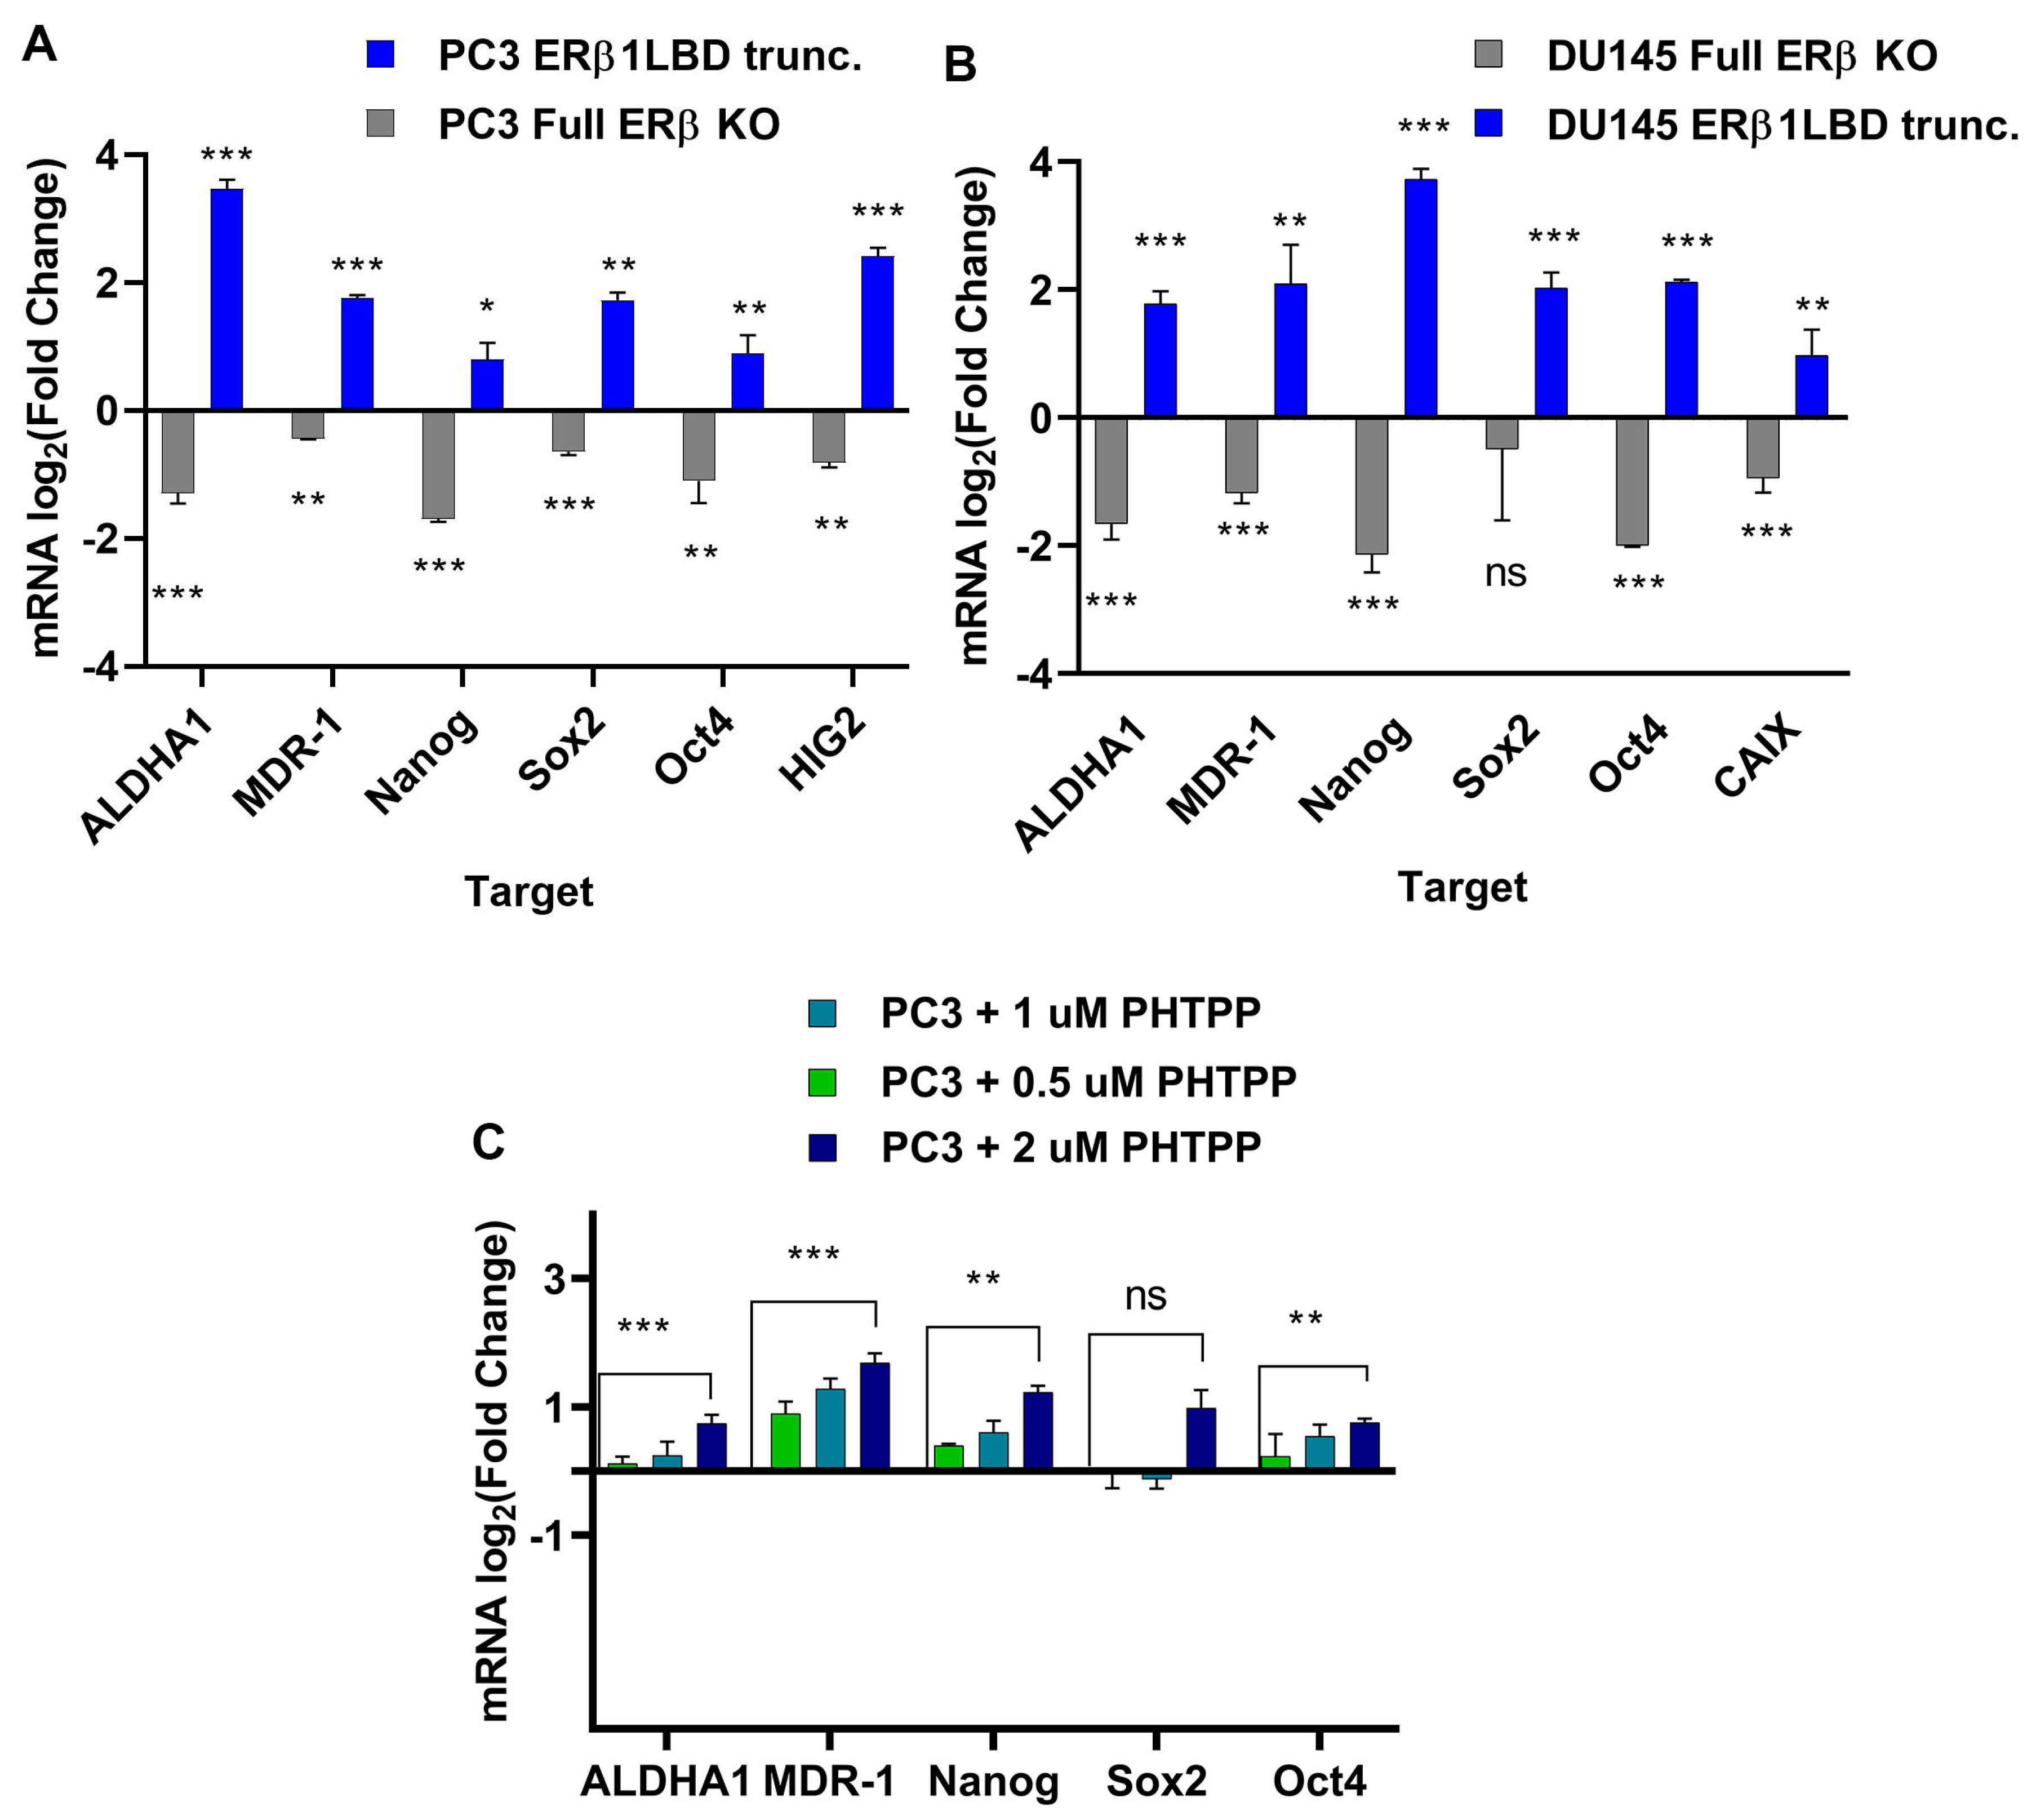
3.2. Endogenously Expressed ERβ Isoforms in Prostate Cancer Cell Lines Affect Chemotherapy Resistance and Stem Cell Factor Expression

After knocking down all isoforms, we observed increased sensitivity to treatment with docetaxel in both DU145 and PC3 cells (Figure 2A,C). Earlier data had suggested that ERβ1 is a tumor suppressor in the prostate, so we wanted to know if truncating the ERβ1 LBD inactivates its agonist binding function and therefore would increase the aggressiveness of the PCa cells. To achieve this, we designed a guide RNA specific for only ERβ1 LBD [34], creating a C-terminal truncated ERβ1 without affecting the other isoforms. Expressing this guide RNA in combination with Cas9 in PCa cells caused the DU145 to be more resistant to chemotherapy (Figure 2B), while there was no significant change in resistance detected in PC3 (Figure 2D, statistics Figure S3). Since chemotherapy resistance has previously been linked to the expression MDR-1 in prostate cancer, we analyzed the protein expression of MDR-1 and found that the transporter expression was modestly increased by the full ERβ knockout but strongly increased by the ERβ1 LBD truncation (see Figure S4).
Increased expression of CSC factors, as well as hypoxic signaling, have previously been linked to chemotherapy resistance [35] and both have been linked to overexpression of the isoforms ERβ2 and ERβ5 [17]. We analyzed the mRNA in both DU145 and the PC3 cell lines with full knock-out of ERβ and the cell lines with C-terminally truncated ERβ1 for expression of stem cell markers ALDH1A1, SOX2, Oct4, and Nanog, as well as the expression of the transporter MDR-1 and hypoxia markers HIG2 and CAIX (Figure 3A,B) for primers see Table 1. To validate the ERβ1 truncation, we used the ERβ1 antagonist PHTPP at increasing doses to treat PC3 cells and verified the mRNA expression of stem cell markers in addition to the transporter MDR-1 (Figure 3C). We also included LNCaP cells to study the effect of the ERβ1 LBD truncation and the full knockout in a PCa cell line expressing AR. In this case, we did not observe an increased expression of stem cell markers in response to the ERβ1 LBD truncation; however, a tendency to reduce the expression of stem cell markers was observed for the full ERβ KO (Figure S5).

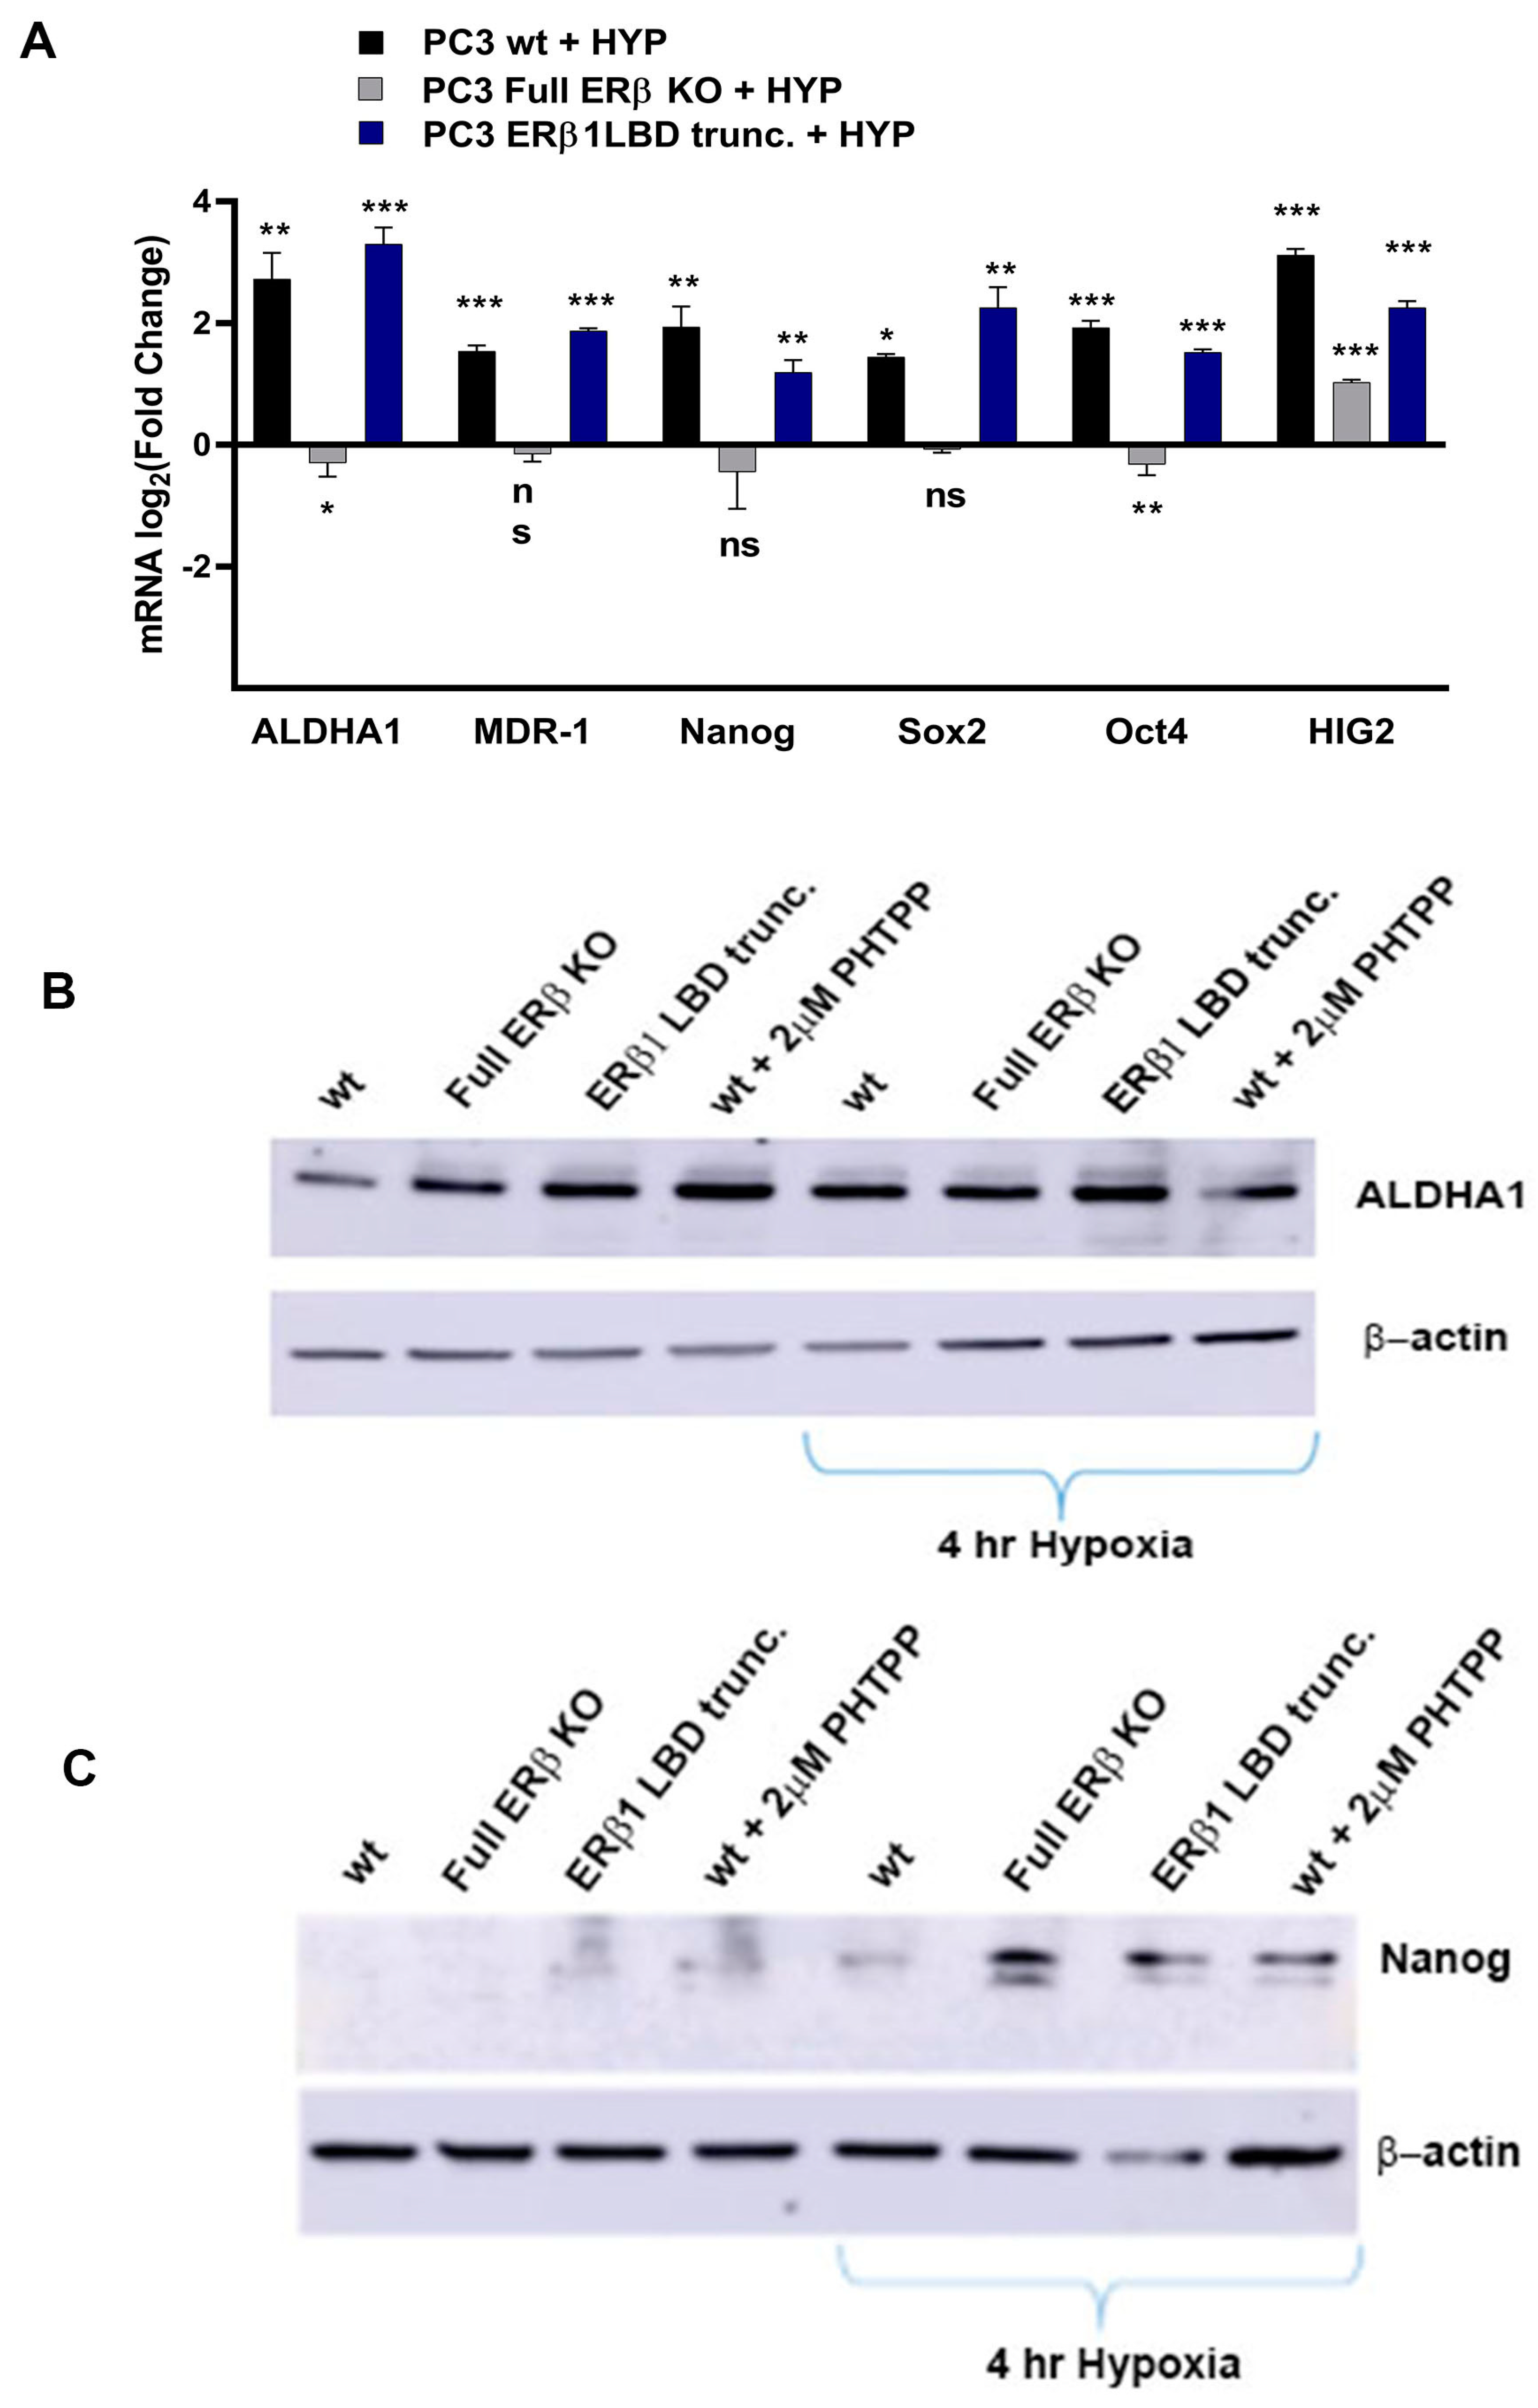
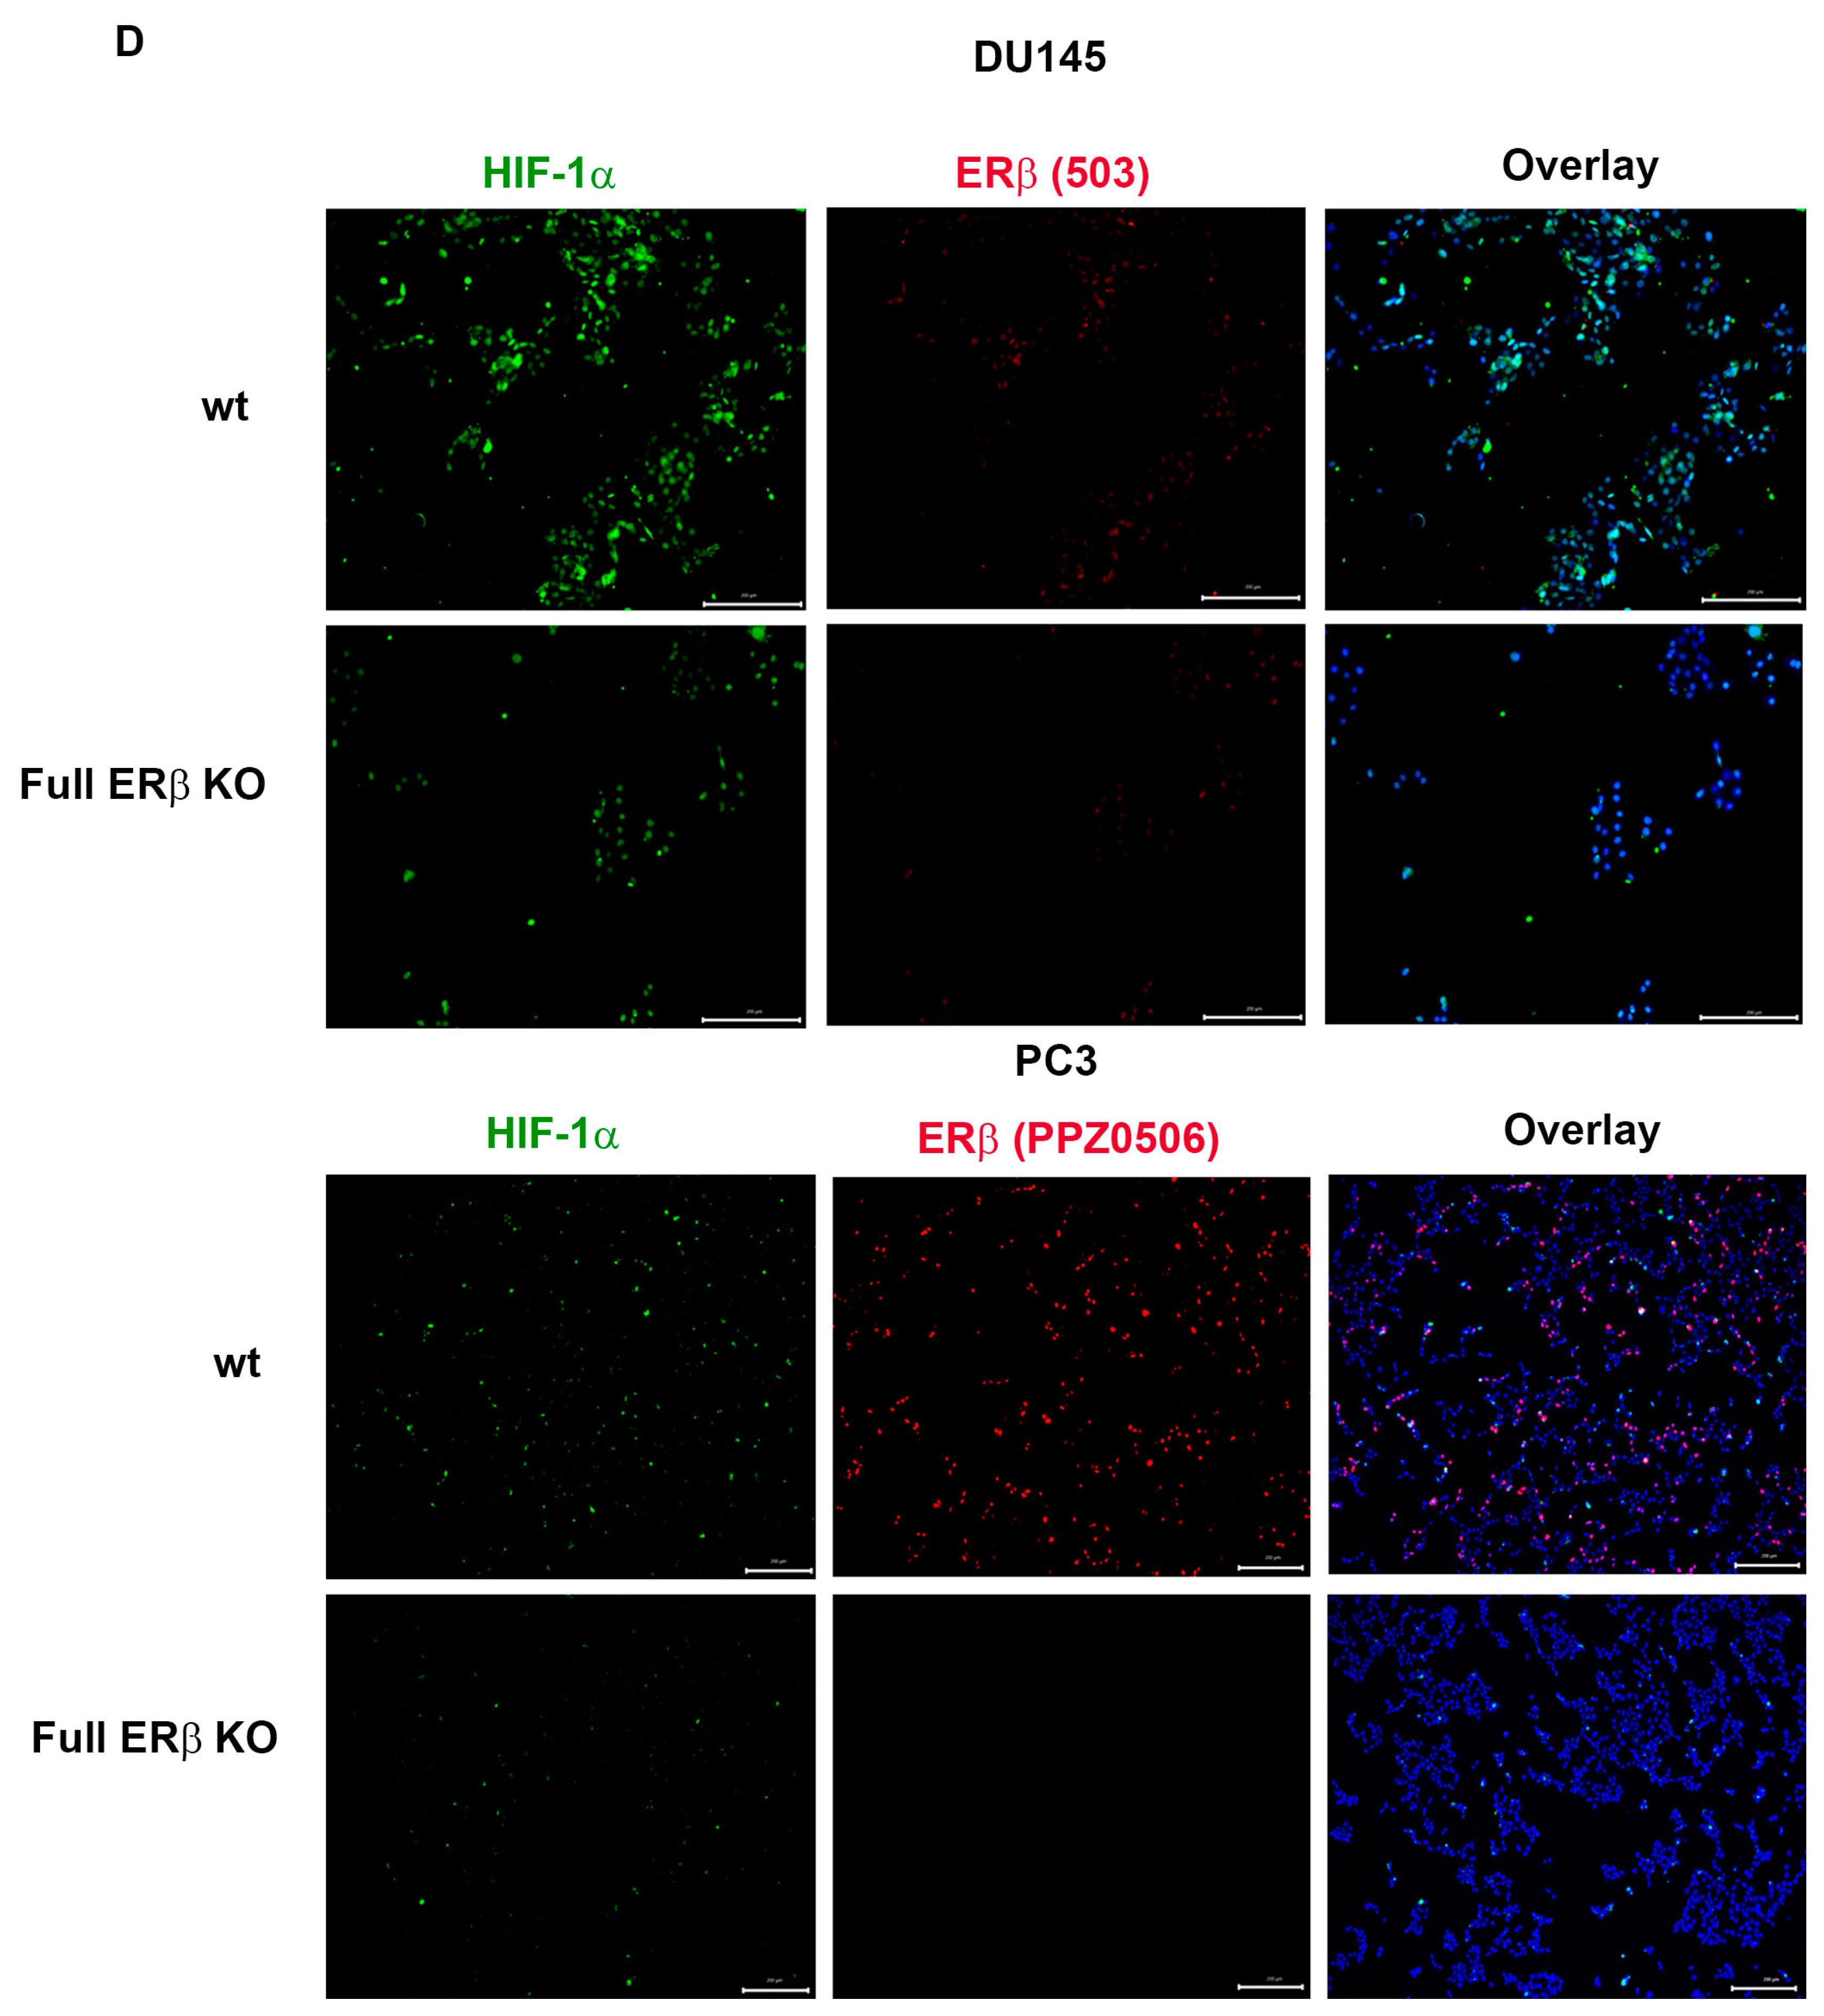
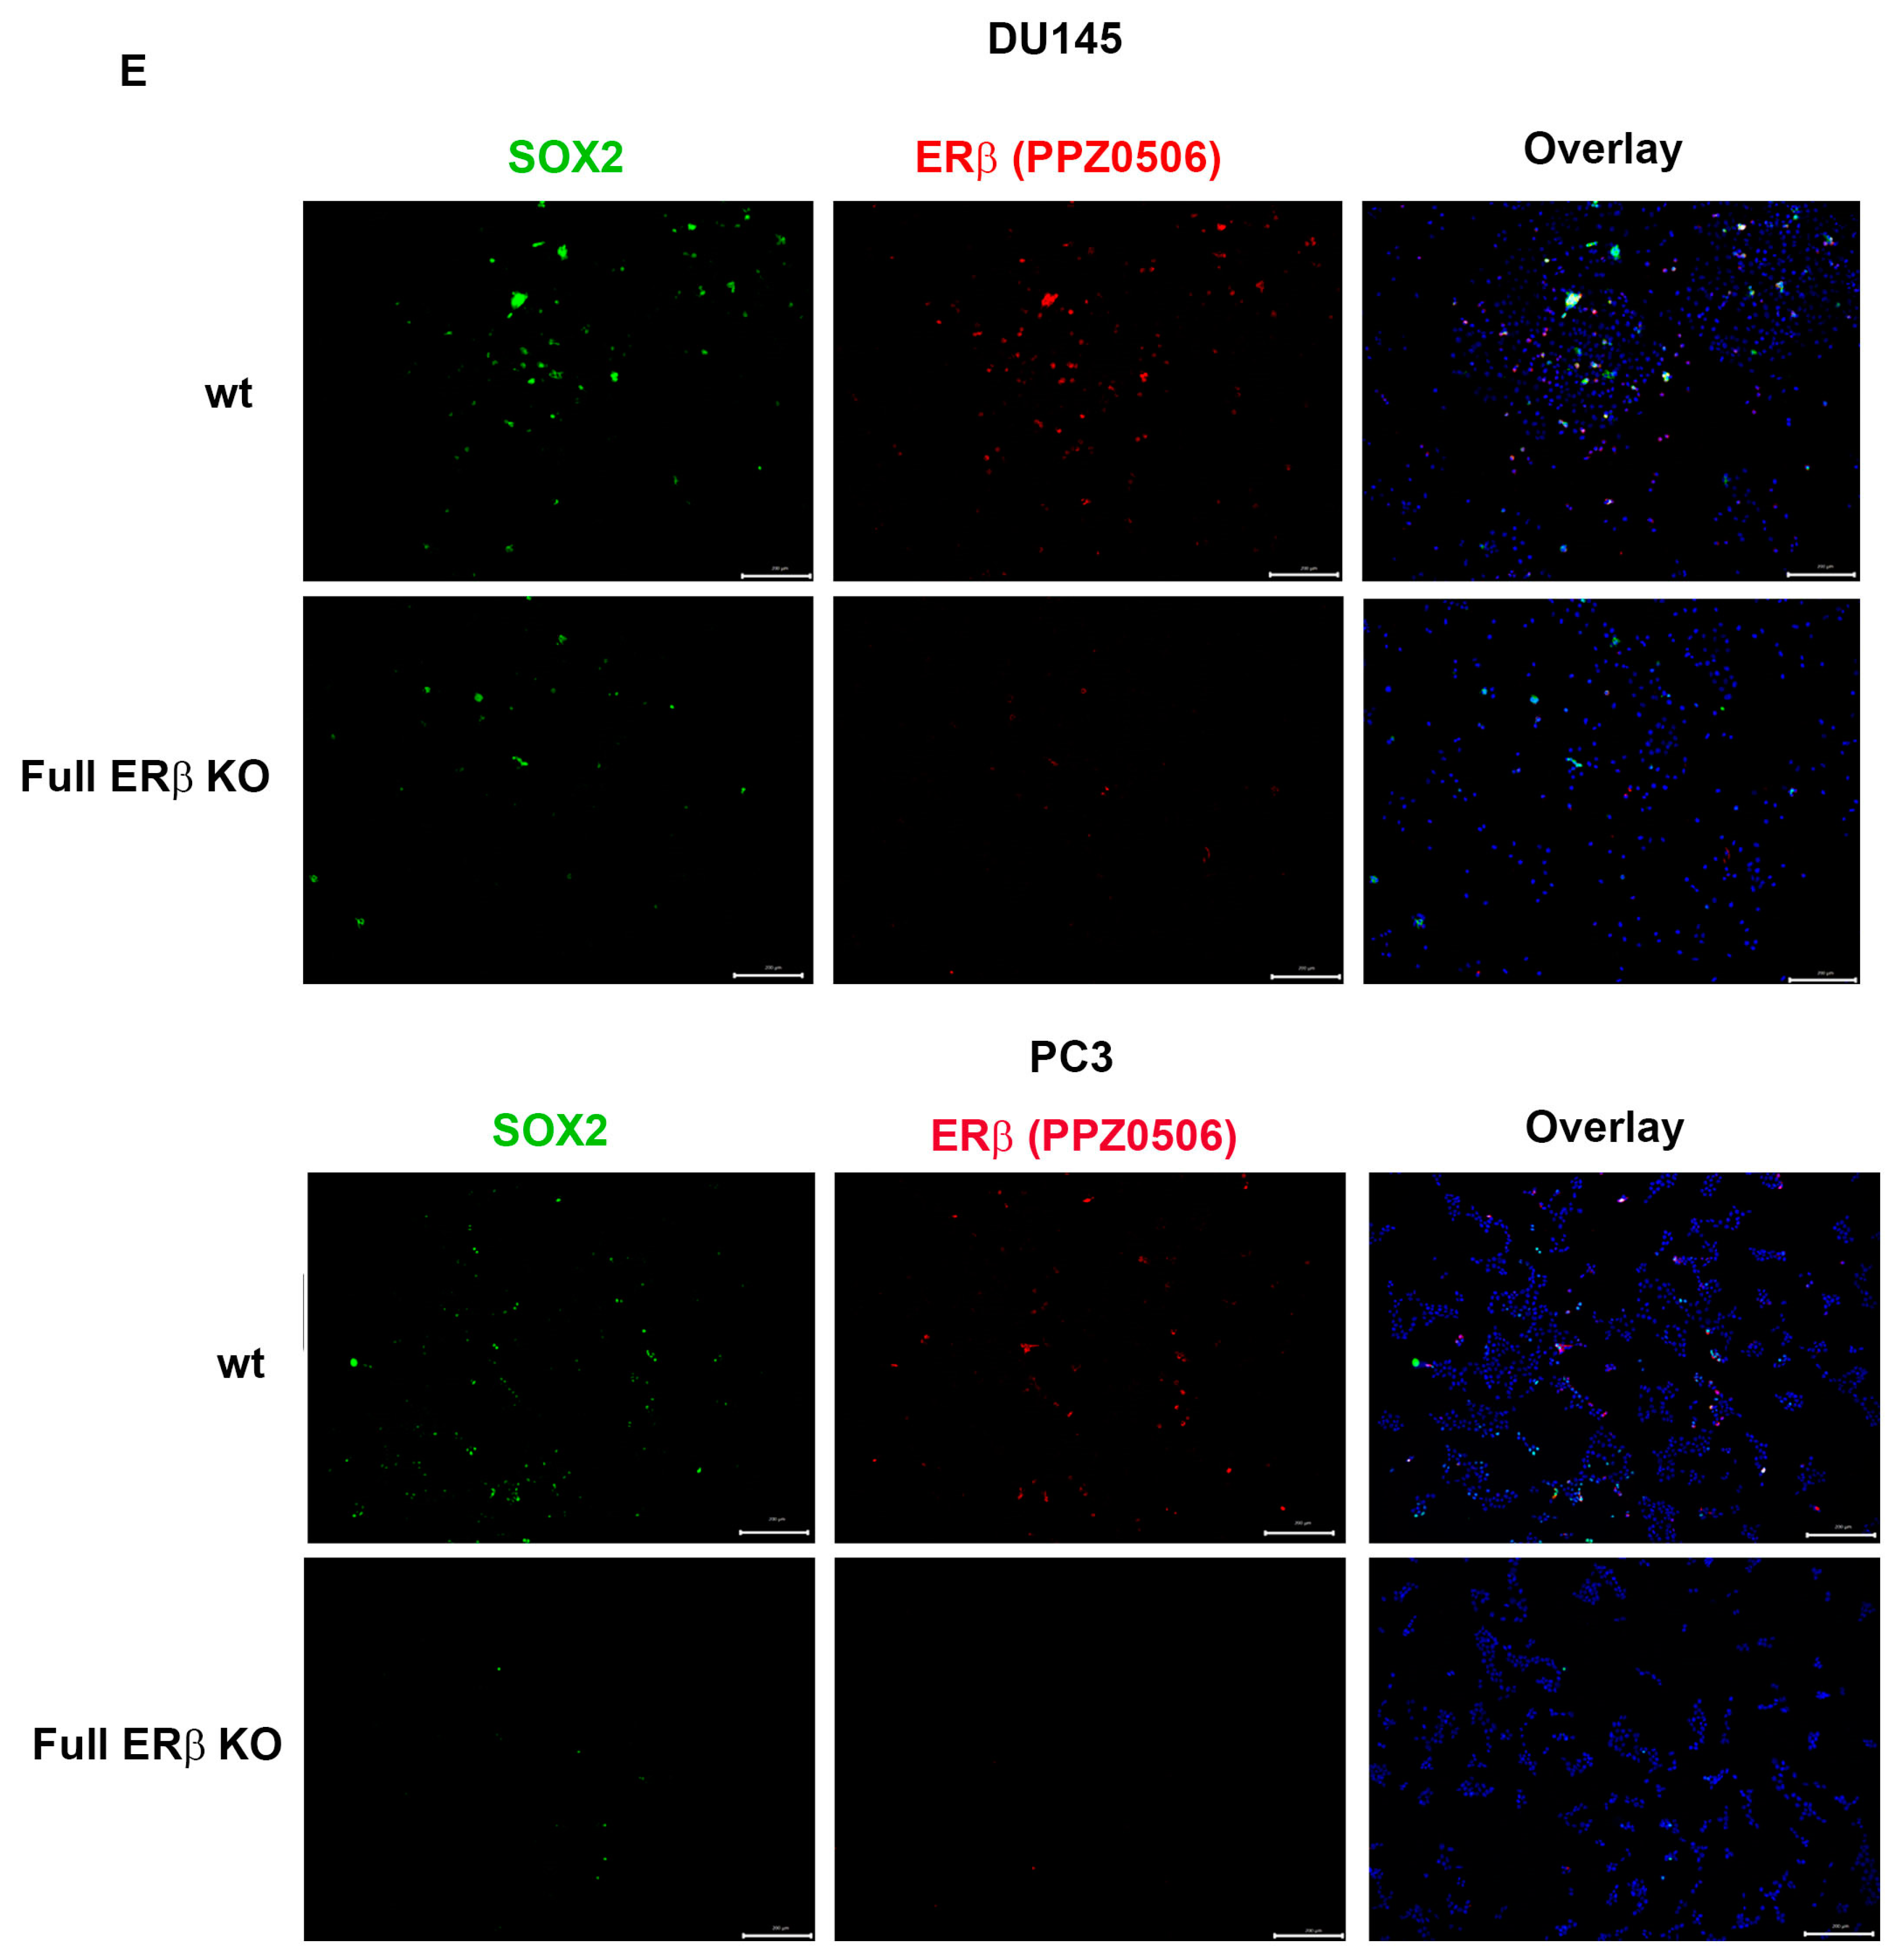
3.3. PC3 Cells Exposed to Hypoxia Show a Similar Gene Expression Profile to PC3 Cells with CRISPR/Cas9. Truncated ERβ1 LBD and the Full ERβ KO Attenuates the Increased Expression of CSC Markers in Hypoxia

To further investigate the link between the change in expression of the CSC markers and hypoxia, which has been suggested in previous publications, the WT and CRISPR-modulated cells were exposed to hypoxia. The regulation of the selected genes in the WT under hypoxia is similar to the regulation seen by truncating endogenous ERβ1 in the LBD. In addition, exposing these cells to hypoxia did not increase the expression, indicating that truncating ERβ1 LBD already induces the maximum response. On the other hand, when we exposed the full ERβ KO to hypoxia, the expression was attenuated in comparison to the WT (Figure 4A). We analyzed the protein expression of ALDHA1 and Nanog in PC3 cells in response to Full ERβ knockout, ERβ1 LBD truncation, and treatment with 2 μM PHTPP in normoxic and hypoxic conditions using Western blot (Figure 4B,C). The regulation observed on the protein level does not fully reflect what was observed for the mRNA expression in PC3 cells. ALDHA1 protein was increased for both the full KO as well as the LBD truncation and antagonist treatment (Figure 4B), while Nanog protein was increased in both the LBD truncation and antagonist treatment in normoxic conditions, while it was increased for those, as well as the full KO under hypoxia (Figure 4C). Next, we used immuno-cytochemistry (ICC) to correlate endogenous ERβ isoform expression to the expression of HIF-1α. The DU145 WT cells show expression of ERβ1, detected by the ERβ1-specific ERβ-503 antibody. The DU145 WT also shows an abundant expression of HIF-1α. However, the DU145 full ERβ KO shows a reduced detection of ERβ1 and in addition, a reduced expression of HIF-1α (Figure 4D). The same ICC experiment was repeated for the PC3 cells; however, in this case we used the N-terminal ERβ antibody PPZ0506, which detects all isoforms of ERβ (Figure 4D). To investigate whether ERβ isoform and SOX2 expression correlate, we performed ICC on both DU145 and PC3 cells using the N-terminal ERβ antibody PPZ0506 and a SOX2 antibody, and observed a decrease in SOX2 in the full ERβ KO in both cell lines (Figure 4E). Using spheroid formation assay we found that the full ERβ KO in PC3 cells showed less tumor spheres as well as decreased expression of the stem cell reporter SORE6 (see Figure 5).

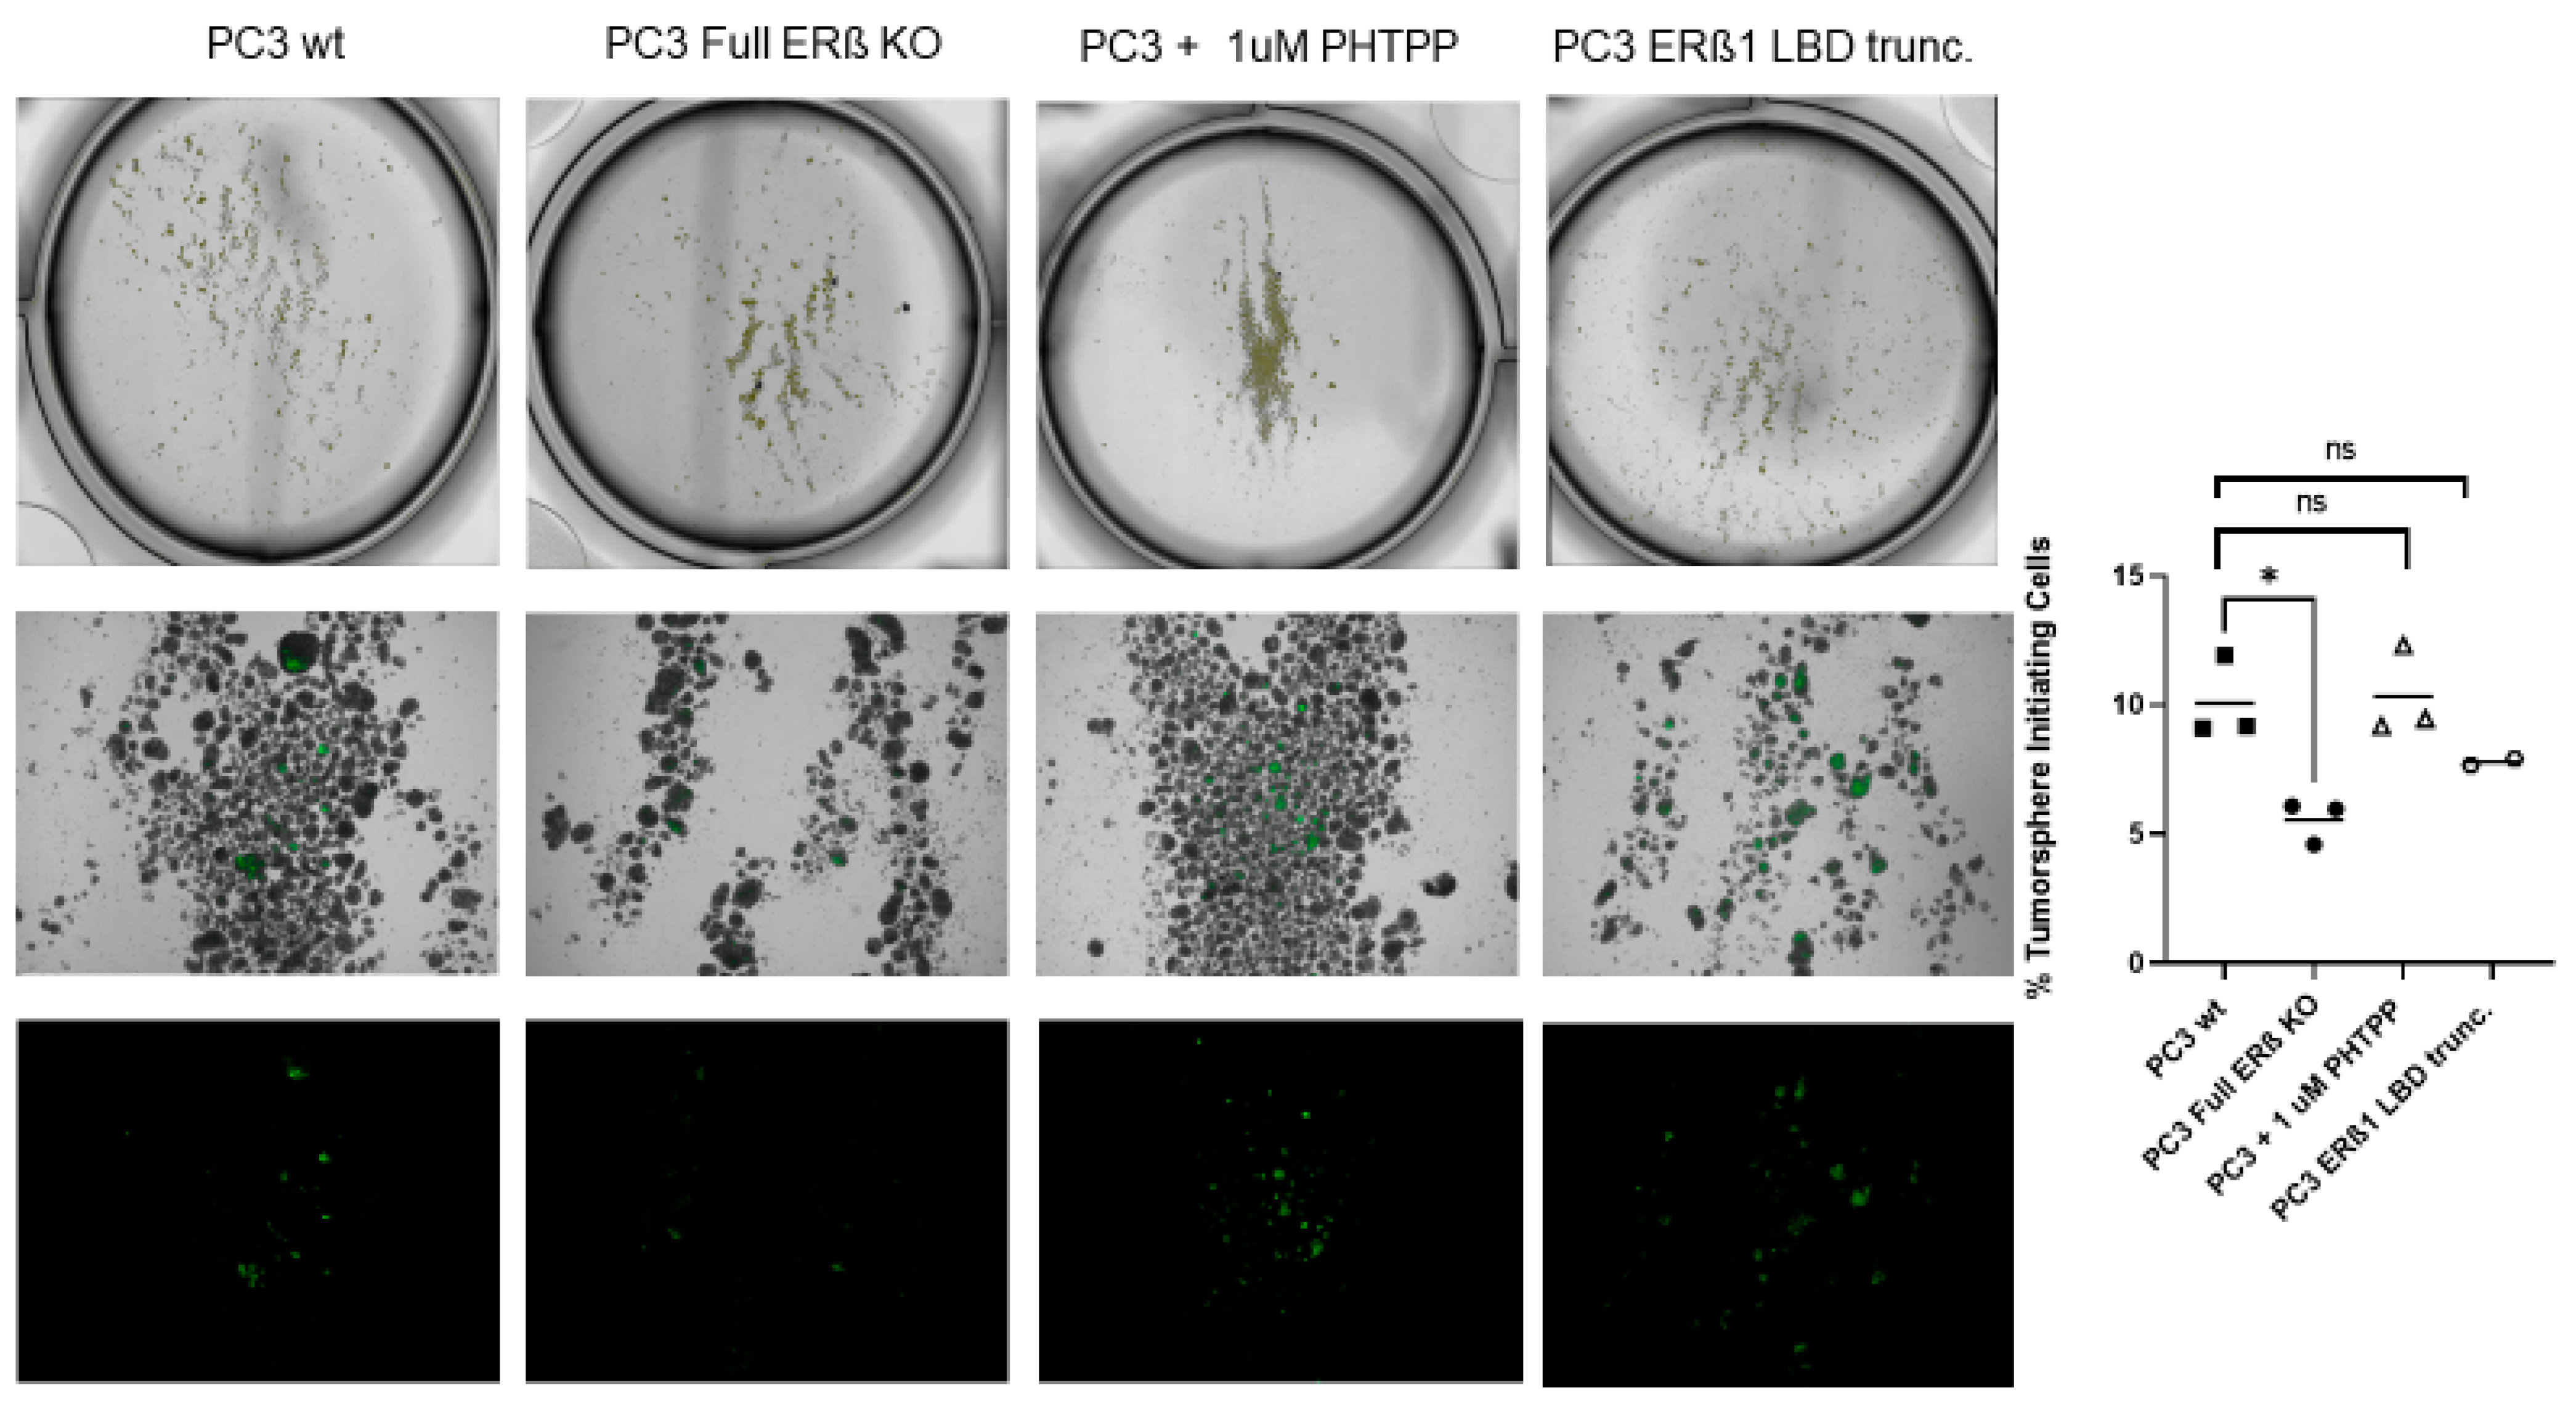
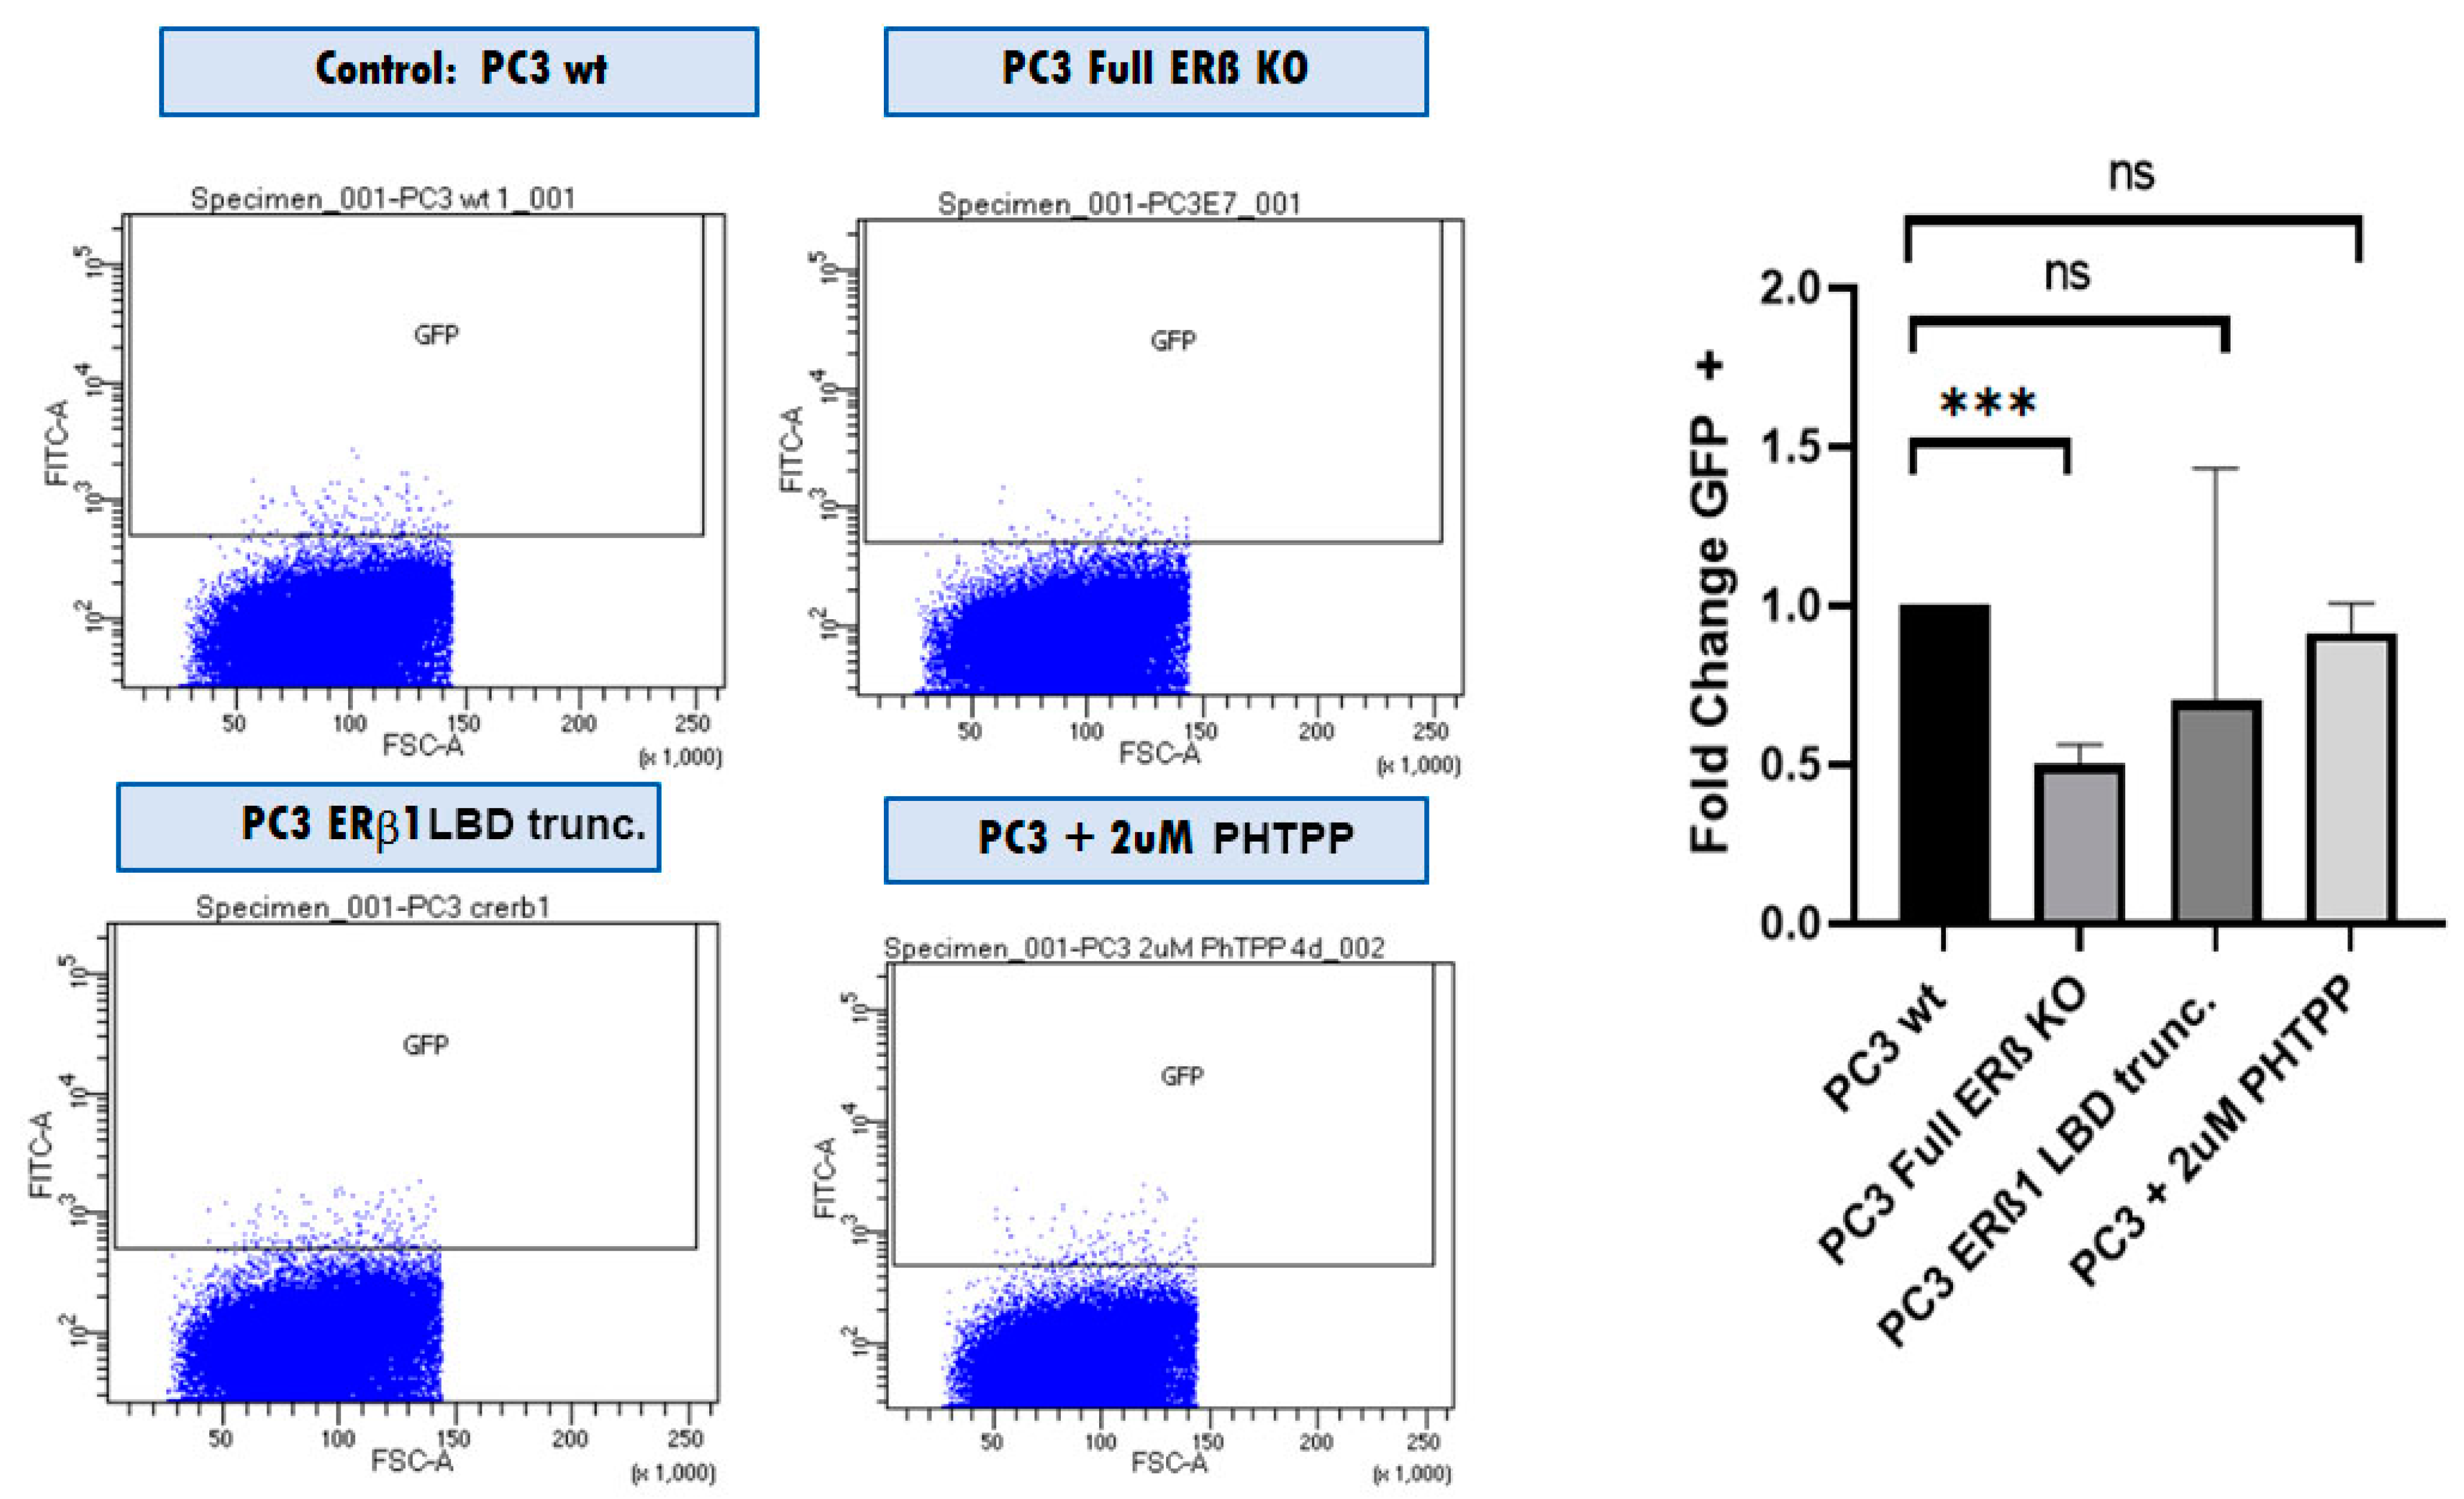
3.4. The Full ERβ Knockout Reduces the CSC Population

To investigate the effect of removing all endogenously expressed ERβ isoforms from PC3 cells, we used the CRISPR/Cas9 system together with an N-terminal guide RNA [31,32]. We also included the SORE6 CSC reporter system, which allowed us to monitor the Nanog-expressing cells based on GFP expression [32].
We then used the cells in tumorsphere assays to analyze the change in the number of tumorsphere-initiating cells, which have been shown to have CSC properties. The number of sphere-initiating cells was reduced by half in the full ERβ KO compared to the WT, while there was no significant change observed for the LBD truncation or the antagonist treatment.
In addition, we used FACS analysis to detect changes in cancer stem cell numbers based on the stem cell reporter SORE6 driving GFP expression, where we also observed that the SORE6+ population was reduced by half (Figure 6).

4. Discussion

The passing of 25 years since the discovery of the second estrogen receptor (ERβ) has established this receptor as a tumor suppressor in several tissues and cell lines [33]. Although the proximal promoter of ERβ is methylated and its expression reduced after Gleason grade 3 in prostate cancer [34], a low level of expression remains and can even be increased at later Gleason stages [34]. This low level of ERβ1 is expressed from the distal promoter together with the isoforms ERβ2 and ERβ5 [35]. A difference in expressed ERβ isoforms between the mouse and human cell lines as well as low expression levels, have made studies very difficult. Human prostate cancer cell lines are a valuable tool for understanding the individual functions of the ERβ isoforms because the truncated isoforms are not expressed in mice [3]. The expression of ERβ in cell lines is low but detectable with qPCR, but to detect protein levels using Western blot, immunoprecipitation must be performed in most cases. However, the validated ERβ antibodies used have been successful in detecting endogenous ERβ in ICC. ERβ1 is an agonist-activated nuclear receptor and as such, it needs the ligand-binding domain to exert its tumor-suppressive effect. Our strategy was to inactivate the function of ERβ1 irrespective of how small the amount present in cell lines was by using CRISPR/Cas9 to introduce a frameshift in the C-terminal LBD to prevent agonist activation. The guide RNA is localized to only affect ERβ1 and not the other isoforms, ERβ2, ERβ4, or ERβ5, meaning that only ERβ1 will be inactivated and not the other isoforms. The truncated ERβ1 will be expressed without its ligand-binding function similar to the isoforms ERβ2, ERβ4, and ERβ5 [16]. To validate the function of the ERβ1 LBD truncation, we additionally used the established ERβ1 antagonist PHTPP. The regulation of stem cell factors observed with the antagonist is in agreement with the regulation observed after LBD truncation and thus, the similarity between both methods underlines the presence of ERβ1 as a tumor suppressor in prostate cancer cell lines.
The fact that ERβ1 is present at a much lower level than the other isoforms, ERβ2, ERβ4, and ERβ5, and able to counteract the isoforms, indicates that hetero-dimerization between ERβ1 and the other isoforms is unlikely to be involved in the mechanism. From our previous studies, we know that the isoforms ERβ2 and ERβ5 stabilize HIF-1α and HIF-2α leading to increased HIF signaling during normoxia [16], while ERβ4 was shown to increase chemotherapy resistance and the CSC population in triple-negative breast cancer [34]. Mak et al. have shown that ERβ1 inhibits HIF signaling on the protein level [29], which can also explain our contradicting data observed on the protein level in the full KO, compared to the regulation of the mRNA we observed. Since the Full KO also removes ERβ1 from the cells, they are lacking the activation of proteasomal degradation of the HIF proteins. Our findings suggest that ERβ1 and its truncated isoforms show opposite regulation of the expression of CSC factors and hypoxic signaling in prostate cancer cells. ERβ1 reduces HIF signaling, while the variants support HIF signaling, likely on a transcriptional level. When we use Cas9/CRISPR to truncate the endogenous ERβ1 in PC3 cells, we see some of the same genes regulated, such as markers of pluripotency and MDR-1 [17], as we reported in previous publications, where ERβ2 or ERβ5 were ectopically expressed in PC3 cells. Hypoxic signaling has already been shown to increase the expression of pluripotent stem cell factors as well as the resistance to chemotherapeutics [27]. In this study, we show that ERβ isoforms are involved in both regulating hypoxic signaling and invoking changes in the expression of stem cell factors, as well as the size of the cancer stem cell population in the cell lines analyzed. In conclusion, ERβ1 is still functional as a tumor suppressor, although at a low expression level, indicated by mRNA and protein data. The data collected on the removal of all ERβ isoforms, together with the opposite regulation observed in the ERβ1 LBD truncation, suggest that the truncated isoforms support the progression of the cancer cells by increasing the CSC population and resistance to chemotherapy.

Supplementary Materials

The following supporting information can be downloaded at: https://www.mdpi.com/article/10.3390/receptors2030012/s1, Figure S1: RT-qPCR verification of CISPR/Cas9; Figure S2: Inducible shRNA specific for ERβ1; Figure S3: Student’s t-test of MTS assay (Figure 2 in the manuscript); Figure S4: ERβ regulation of the transporter MDR-1; Figure S5: ERβ regulation of stem cell factors in LNCaP cells.

Author Contributions

Conceptualization, J.H.S., A.M.S. and J.-Å.G.; methodology, J.H.S., A.B., L.B. and A.M.S.; software, A.B. and J.H.S.; validation, J.H.S., A.M.S., A.B. and J.-Å.G.; formal analysis, J.H.S. and A.B.; investigation, J.H.S., A.B. and A.M.S.; resources, A.M.S. and J.-Å.G.; data curation, J.H.S. and A.M.S.; writing—original draft preparation, J.H.S. and A.M.S.; writing—review and editing, J.H.S. and A.M.S.; visualization, A.M.S. and J.H.S.; supervision, A.M.S. and J.-Å.G.; project administration, A.M.S. and J.-Å.G.; funding acquisition, J.-Å.G. All authors have read and agreed to the published version of the manuscript.

Funding

This work was supported by the Brockman Foundation (G0500851), the Swedish Cancer Society, and the Robert A. Welch Foundation (E-0004).

Institutional Review Board Statement

Not applicable.

Informed Consent Statement

Not Applicable.

Data Availability Statement

The data presented in this study are available in this article and supplementary material.

Conflicts of Interest

The authors declare no conflict of interest.

References

  1. Kuiper, G.G.; Enmark, E.; Pelto-Huikko, M.; Nilsson, S.; Gustafsson, J.A. Cloning of a novel receptor expressed in rat prostate and ovary. Proc. Natl. Acad. Sci. USA 1996, 93, 5925–5930. [Google Scholar] [CrossRef] [PubMed]
  2. Fujimura, T.; Takahashi, S.; Urano, T.; Ogawa, S.; Ouchi, Y.; Kitamura, T.; Muramatsu, M.; Inoue, S. Differential expression of estrogen receptor beta (ERbeta) and its C-terminal truncated splice variant ERbetacx as prognostic predictors in human prostatic cancer. Biochem. Biophys. Res. Commun. 2001, 289, 692–699. [Google Scholar] [CrossRef] [PubMed]
  3. Leung, Y.K.; Mak, P.; Hassan, S.; Ho, S.M. Estrogen receptor (ER)-beta isoforms: A key to understanding ER-beta signaling. Proc. Natl. Acad. Sci. USA 2006, 103, 13162–13167. [Google Scholar] [CrossRef]
  4. Dey, P.; Jonsson, P.; Hartman, J.; Williams, C.; Strom, A.; Gustafsson, J.A. Estrogen receptors beta1 and beta2 have opposing roles in regulating proliferation and bone metastasis genes in the prostate cancer cell line PC3. Mol. Endocrinol. 2012, 26, 1991–2003. [Google Scholar] [CrossRef]
  5. Leung, Y.K.; Lam, H.M.; Wu, S.; Song, D.; Levin, L.; Cheng, L.; Wu, C.L.; Ho, S.M. Estrogen receptor beta2 and beta5 are associated with poor prognosis in prostate cancer, and promote cancer cell migration and invasion. Endocr. Relat. Cancer 2010, 17, 675–689. [Google Scholar] [CrossRef]
  6. Macedo-Silva, C.; Benedetti, R.; Ciardiello, F.; Cappabianca, S.; Jeronimo, C.; Altucci, L. Epigenetic mechanisms underlying prostate cancer radioresistance. Clin. Epigenetics 2021, 13, 125. [Google Scholar] [CrossRef] [PubMed]
  7. Sharifi, N.; Dahut, W.L.; Steinberg, S.M.; Figg, W.D.; Tarassoff, C.; Arlen, P.; Gulley, J.L. A retrospective study of the time to clinical endpoints for advanced prostate cancer. BJU Int. 2005, 96, 985–989. [Google Scholar] [CrossRef]
  8. Siegel, R.L.; Miller, K.D.; Fuchs, H.E.; Jemal, A. Cancer Statistics, 2021. CA Cancer J. Clin. 2021, 71, 7–33. [Google Scholar] [CrossRef]
  9. Davies, A.H.; Zoubeidi, A. The Androgen Receptor Bridges Stem Cell-Associated Signaling Nodes in Prostate Stem Cells. Stem Cells Int. 2016, 2016, 4829602. [Google Scholar] [CrossRef] [Green Version]
  10. Jeter, C.R.; Liu, B.; Liu, X.; Chen, X.; Liu, C.; Calhoun-Davis, T.; Repass, J.; Zaehres, H.; Shen, J.J.; Tang, D.G. NANOG promotes cancer stem cell characteristics and prostate cancer resistance to androgen deprivation. Oncogene 2011, 30, 3833–3845. [Google Scholar] [CrossRef] [Green Version]
  11. Sanchez, B.G.; Bort, A.; Vara-Ciruelos, D.; Diaz-Laviada, I. Androgen Deprivation Induces Reprogramming of Prostate Cancer Cells to Stem-Like Cells. Cells 2020, 9, 1441. [Google Scholar] [CrossRef]
  12. Shen, M.M.; Abate-Shen, C. Molecular genetics of prostate cancer: New prospects for old challenges. Genes Dev. 2010, 24, 1967–2000. [Google Scholar] [CrossRef] [PubMed] [Green Version]
  13. Chaurasiya, S.; Widmann, S.; Botero, C.; Lin, C.Y.; Gustafsson, J.A.; Strom, A.M. Estrogen receptor beta exerts tumor suppressive effects in prostate cancer through repression of androgen receptor activity. PLoS ONE 2020, 15, e0226057. [Google Scholar] [CrossRef]
  14. Wu, W.F.; Maneix, L.; Insunza, J.; Nalvarte, I.; Antonson, P.; Kere, J.; Yu, N.Y.; Tohonen, V.; Katayama, S.; Einarsdottir, E.; et al. Estrogen receptor beta, a regulator of androgen receptor signaling in the mouse ventral prostate. Proc. Natl. Acad. Sci. USA 2017, 114, E3816–E3822. [Google Scholar] [CrossRef] [PubMed]
  15. Wu, W.F.; Wang, L.; Spetsieris, N.; Boukovala, M.; Efstathiou, E.; Brossner, C.; Warner, M.; Gustafsson, J.A. Estrogen receptor beta and treatment with a phytoestrogen are associated with inhibition of nuclear translocation of EGFR in the prostate. Proc. Natl. Acad. Sci. USA 2021, 118, e2011269118. [Google Scholar] [CrossRef]
  16. Dey, P.; Velazquez-Villegas, L.A.; Faria, M.; Turner, A.; Jonsson, P.; Webb, P.; Williams, C.; Gustafsson, J.A.; Strom, A.M. Estrogen Receptor beta2 Induces Hypoxia Signature of Gene Expression by Stabilizing HIF-1alpha in Prostate Cancer. PLoS ONE 2015, 10, e0128239. [Google Scholar] [CrossRef]
  17. Faria, M.; Shepherd, P.; Pan, Y.; Chatterjee, S.S.; Navone, N.; Gustafsson, J.A.; Strom, A. The estrogen receptor variants beta2 and beta5 induce stem cell characteristics and chemotherapy resistance in prostate cancer through activation of hypoxic signaling. Oncotarget 2018, 9, 36273–36288. [Google Scholar] [CrossRef] [Green Version]
  18. Wang, Y.; Huang, Z.; Chen, C.Z.; Liu, C.; Evans, C.P.; Gao, A.C.; Zhou, F.; Chen, H.W. Therapeutic Targeting of MDR1 Expression by RORgamma Antagonists Resensitizes Cross-Resistant CRPC to Taxane via Coordinated Induction of Cell Death Programs. Mol. Cancer Ther. 2020, 19, 364–374. [Google Scholar] [CrossRef]
  19. Comerford, K.M.; Wallace, T.J.; Karhausen, J.; Louis, N.A.; Montalto, M.C.; Colgan, S.P. Hypoxia-inducible factor-1-dependent regulation of the multidrug resistance (MDR1) gene. Cancer Res. 2002, 62, 3387–3394. [Google Scholar] [PubMed]
  20. Zhou, J.J.; Deng, X.G.; He, X.Y.; Zhou, Y.; Yu, M.; Gao, W.C.; Zeng, B.; Zhou, Q.B.; Li, Z.H.; Chen, R.F. Knockdown of NANOG enhances chemosensitivity of liver cancer cells to doxorubicin by reducing MDR1 expression. Int. J. Oncol. 2014, 44, 2034–2040. [Google Scholar] [CrossRef] [PubMed] [Green Version]
  21. Butterworth, K.T.; McCarthy, H.O.; Devlin, A.; Ming, L.; Robson, T.; McKeown, S.R.; Worthington, J. Hypoxia selects for androgen independent LNCaP cells with a more malignant geno- and phenotype. Int. J. Cancer 2008, 123, 760–768. [Google Scholar] [CrossRef] [PubMed]
  22. Choi, Y.; Kim, H.; Pollack, S. ERbeta Isoforms Have Differential Clinical Significance in Breast Cancer Subtypes and Subgroups. Curr. Issues Mol. Biol. 2022, 44, 1564–1586. [Google Scholar] [CrossRef]
  23. Fraga, A.; Ribeiro, R.; Principe, P.; Lopes, C.; Medeiros, R. Hypoxia and Prostate Cancer Aggressiveness: A Tale With Many Endings. Clin. Genitourin. Cancer 2015, 13, 295–301. [Google Scholar] [CrossRef]
  24. Keith, B.; Simon, M.C. Hypoxia-inducible factors, stem cells, and cancer. Cell 2007, 129, 465–472. [Google Scholar] [CrossRef] [PubMed] [Green Version]
  25. Mitani, T.; Yamaji, R.; Higashimura, Y.; Harada, N.; Nakano, Y.; Inui, H. Hypoxia enhances transcriptional activity of androgen receptor through hypoxia-inducible factor-1alpha in a low androgen environment. J. Steroid Biochem. Mol. Biol. 2011, 123, 58–64. [Google Scholar] [CrossRef] [PubMed]
  26. Ragnum, H.B.; Roe, K.; Holm, R.; Vlatkovic, L.; Nesland, J.M.; Aarnes, E.K.; Ree, A.H.; Flatmark, K.; Seierstad, T.; Lilleby, W.; et al. Hypoxia-independent downregulation of hypoxia-inducible factor 1 targets by androgen deprivation therapy in prostate cancer. Int. J. Radiat. Oncol. Biol. Phys. 2013, 87, 753–760. [Google Scholar] [CrossRef] [Green Version]
  27. Yoshida, Y.; Takahashi, K.; Okita, K.; Ichisaka, T.; Yamanaka, S. Hypoxia enhances the generation of induced pluripotent stem cells. Cell Stem Cell 2009, 5, 237–241. [Google Scholar] [CrossRef] [Green Version]
  28. Christoforou, P.; Christopoulos, P.F.; Koutsilieris, M. The role of estrogen receptor beta in prostate cancer. Mol. Med. 2014, 20, 427–434. [Google Scholar] [CrossRef]
  29. Mak, P.; Chang, C.; Pursell, B.; Mercurio, A.M. Estrogen receptor beta sustains epithelial differentiation by regulating prolyl hydroxylase 2 transcription. Proc. Natl. Acad. Sci. USA 2013, 110, 4708–4713. [Google Scholar] [CrossRef]
  30. Mak, P.; Leav, I.; Pursell, B.; Bae, D.; Yang, X.; Taglienti, C.A.; Gouvin, L.M.; Sharma, V.M.; Mercurio, A.M. ERbeta impedes prostate cancer EMT by destabilizing HIF-1alpha and inhibiting VEGF-mediated snail nuclear localization: Implications for Gleason grading. Cancer Cell 2010, 17, 319–332. [Google Scholar] [CrossRef] [Green Version]
  31. Thomas, C.; Karagounis, I.V.; Srivastava, R.K.; Vrettos, N.; Nikolos, F.; Francois, N.; Huang, M.; Gong, S.; Long, Q.; Kumar, S.; et al. Estrogen Receptor beta-Mediated Inhibition of Actin-Based Cell Migration Suppresses Metastasis of Inflammatory Breast Cancer. Cancer Res. 2021, 81, 2399–2414. [Google Scholar] [CrossRef] [PubMed]
  32. Yuan, B.; Cheng, L.; Gupta, K.; Chiang, H.C.; Gupta, H.B.; Sareddy, G.R.; Wang, D.; Lathrop, K.; Elledge, R.; Wang, P.; et al. Tyrosine phosphorylation regulates ERbeta ubiquitination, protein turnover, and inhibition of breast cancer. Oncotarget 2016, 7, 42585–42597. [Google Scholar] [CrossRef] [PubMed] [Green Version]
  33. Stossi, F.; Barnett, D.H.; Frasor, J.; Komm, B.; Lyttle, C.R.; Katzenellenbogen, B.S. Transcriptional profiling of estrogen-regulated gene expression via estrogen receptor (ER) alpha or ERbeta in human osteosarcoma cells: Distinct and common target genes for these receptors. Endocrinology 2004, 145, 3473–3486. [Google Scholar] [CrossRef] [PubMed] [Green Version]
  34. Bano, A.; Stevens, J.H.; Modi, P.S.; Gustafsson, J.A.; Strom, A.M. Estrogen Receptor beta4 Regulates Chemotherapy Resistance and Induces Cancer Stem Cells in Triple Negative Breast Cancer. Int. J. Mol. Sci. 2023, 24, 5867. [Google Scholar] [CrossRef]
  35. Li, Y.; Wang, Z.; Ajani, J.A.; Song, S. Drug resistance and Cancer stem cells. Cell Commun. Signal. 2021, 19, 19. [Google Scholar] [CrossRef]
Figure 1. (A). Schematic overview of ERβ isoforms. (B). Overview of CRISPR guide RNA localization in the ERβ gene. (C). Overview of expressed truncated proteins in the knockouts.
Receptors 02 00012 g001
Figure 2. Chemotherapy resistance to docetaxel for DU145 cells, with 5000 cells/well seeded in a 96-well plate, treated with increasing concentrations of docetaxel for 72 h, and assayed using MTS reagent. (A) DU145 comparison of ERβ full KO to WT. (B) DU145 comparison of WT to ERβ LBD trunc. (C) PC3 comparison of WT with ERβ full KO in response to docetaxel. (D) PC3 comparison of WT to ERβ1 LBD trunc. For statistics see Figure S3.
Receptors 02 00012 g002
Figure 3. (A). RT-qPCR measuring expression of ALDH1, SOX2. Oct4, Nanog, MDR-1, and CAIX in PC3 cells modulated with CRISPR for a full ERβ knockout or LBD-truncated ERβ1 compared to the WT. (B). Expression of ALDH1, SOX2. Oct4, Nanog, MDR-1, and CAIX in DU145 cells modulated with CRISPR for a full ERβ knockout or LBD-truncated ERβ1 compared to the WT. (C). Comparing expression of ALDH1, SOX2. Oct4, Nanog, MDR-1, and HIG2 in PC3 cells treated with increasing concentrations of ERβ1 antagonist PHTPP. The data were analyzed using an unpaired two-tailed Student’s t-test. p- values: * p < 0.05, ** p < 0.01, *** p < 0.001, and ns = non-significant p > 0.05.
Receptors 02 00012 g003
Figure 4. (A) Comparing ALDH1, SOX2. Oct4, Nanog, MDR-1, and HIG2 expression in PC3 cells CRISPR-modulated with total ERβ knockout or LBD-truncated ERβ1 with or without exposure to hypoxia. (B) Comparing protein expression of ALDH1, in PC3 cells CRISPR-modulated with total ERβ knockout, LBD-truncated ERβ1, or treated with 2 μM PHTPP with or without exposure to hypoxia. (C) Comparing protein expression of Nanog, in PC3 cells CRISPR-modulated with total ERβ knockout, LBD-truncated ERβ1, or treated with 2 μM PHTPP with or without exposure to hypoxia. (D) Top two rows analyzing HIF-1α by ICC in WT compared to full ERβ knockout in DU145 cells validating ERβ knockout by using the ERβ (503) antibody. The lower two rows show PC3 cells also analyzing HIF-1α by ICC comparing WT with full ERβ knockout, in this case validating ERβ knockout by using the N-terminal ERβ antibody PPZ0506. (E) Top two rows analyzing SOX2 by ICC in WT compared to full ERβ knockout in DU145 cells validating ERβ knockout by using the N-terminal ERβ antibody PPZ0506. The lower two rows show PC3 cells also analyzing SOX2 by ICC comparing WT with full ERβ knockout and validating ERβ knockout by using the N-terminal ERβ antibody PPZ0506. The data were analyzed using an unpaired two-tailed Student’s t-test. p-values: * p < 0.05, ** p < 0.01, *** p < 0.001, and ns = non-significant p > 0.05. Scale bars represent 200 μm.
Receptors 02 00012 g004aReceptors 02 00012 g004bReceptors 02 00012 g004c
Figure 5. PC3 cells: 5000 cells/well of WT, ERβ KO, ERβ1 LBD trunc, and treatment with 1 μM PHTPP were seeded in ultra-low attachment 6-well tissue culture plates for 14 days. The top panel shows the low magnification of tumorospheres, the middle panels high magnification of tumorospheres, and the lower panels show GFP expression indicating activation of the stem cell reporter SORE6. The graph to the right shows the % of sphere-initiating cells in PC3 WT, PC3 + 1 μM PHTPP, and PC3 with the full knockout of all ERβ isoforms. The data were analyzed using an unpaired two-tailed Student’s t-test. p-values: * p < 0.05, and ns = non-significant p > 0.05.
Receptors 02 00012 g005
Figure 6. FACS analysis comparing the SORE6+ population in PC3 WT cells with PC3 cells with all ERβ isoforms knocked out using CRISPR/Cas9 with guide RNA directed against the N-terminus of ERβ (full ERβ KO), ERβ1 LBD trunc, and treatment with 2 μM PHTPP. The graph shows three biological repeats. The data were analyzed using an unpaired two-tailed Student’s t-test. p-values: *** p < 0.001, and ns = non-significant p > 0.05.
Receptors 02 00012 g006
Table 1. Primers used for qPCR.
GeneFWDREV
GAPDH5′-TGACAACTTTGGTATCGTGGAGG-3′5′-AGGCAGGGATGTTCTGGAGAG-3′
36B45′-GTGTTCGACAATGGCAGCAT-3′5′-GACACCCTCCAGGAAGCGA-3′
ALDHA15′-GCTGGCGACAATGG
AGTCAA-3′
5′-ACGGCCCTGGATCTTGTCAG-3′
OCT45′-GGATGCTGTGA
GCCAAGG-3′
5′-GAACAATGATGAGTGACAGACAG-3′
CAIX5′-AGATGAGAAGGCAGCACAGAA-3′5′-GAAGTGGCATAATGAGCAGGA-3′
SOX25′-TTGCTGCCTCTTTAAGACTAGGA-3′5′-CTGGGGCTCAAAC
TTCTCTC-3′
Nanog5′-ACCCAGCTGTGTGTACTCAA-3′5′-GGAAGAGTAAAGGCTGGGGT-3′
HIG25′-CCGACTTTCCTCCGGACT-3′5′-CCTTCTGAAAGGCC
TCTGG-3′
MDR15′-AGGAAGCCAATGCCTATGACTTTA-3′5′-CAACTGGGCCCCT
CTCTCTC-3′
ERβ isoform specific primers
ERβ15′-GTCAGGCATGCGAGTAACAA-3′5′-GGGAGCCCTCTTTGCTTTTA-3′
ERβ2/45′-ACTTGCTGAACGCCGTGACC-3′
ERβ2 5′-AGAGGCCTTTTCTG
CCCTCGC-3′
ERβ4 5′-TTTTCTCCCCATCTCGCATGC-3′
ERβ55′-GACCACAGGTCCTGTGTATACAAGTAA-3′5′-GGCACTAAGATAACTTCAAATGAATGAATT-3′
Disclaimer/Publisher’s Note: The statements, opinions and data contained in all publications are solely those of the individual author(s) and contributor(s) and not of MDPI and/or the editor(s). MDPI and/or the editor(s) disclaim responsibility for any injury to people or property resulting from any ideas, methods, instructions or products referred to in the content.

