1. Introduction
Thrombosis in intracranial vessels is the most common cause of acute cerebral infarction. Recanalization of the occluded blood vessels within 4.5 or 6 h through early thrombolysis or endovascular thrombectomy can restore brain tissue perfusion to a great extent and save the ischemic penumbra. The most therapeutic strategies for acute ischemic stroke focus on clot retrieval or the resolution of thrombi [
1]. The early identification of the composition of arterial thrombi may have diagnostic, therapeutic, and prognostic implications. According to the literature, red cell-dominant thrombi originated from the cardiac or venous system and contained erythrocytes and fibrin, which respond adequately to thrombolytic therapies [
2,
3]. Fibrin-dominant thrombi consist of varying amounts of cellular debris, fibrin, and platelets, but only a few red blood cells (RBCs) do not respond satisfactorily to thrombolytic therapies [
2]. Over the years, histological analysis aiming to study the composition of thrombi leading to ischemic stroke has proven to be a powerful tool for designing standard prevention and treatment protocols [
2,
4].
The application of susceptibility weighted imaging (SWI) to detect thrombi in acute ischemic stroke is under intense research focus [
5]. SWI shows an intravascular thrombus as a hypointense susceptibility vessel sign (SVS) that is classically manifested as a thickened and dark intravascular susceptibility artifact. SVS indicates the increase of local deoxyhemoglobin in RBCs trapped in the occluded vessel [
6,
7,
8,
9].
Quantitative susceptibility mapping (QSM) is calculated based on the three-dimensional (3D) multi-echo gradient echo sequence and combines phase with magnitude information to quantify susceptibility distribution. The susceptibility values can be used to identify tissue susceptibility in QSM [
10].
Since the levels of paramagnetic tissue(deoxyhemoglobin) in RBC and fibrin-dominant thrombi are different we speculated that the susceptibility values of thrombi in cerebral artery occlusion might be correlated with the pathologic composition of thrombi.
QSM is a potential approach for this evaluation by quantifying the paramagnetic contents in thrombi [
10,
11]. Furthermore, directly identifying a signature of the thrombus composition through the thrombus susceptibility might assist management decisions, as well as the secondary prevention of ischemic stroke in the future [
12]. However, there were few studies comparing thrombus susceptibility with pathological components of thrombus in patients with acute stroke, hence, the main goal of this study was to quantify the susceptibility values of middle cerebral artery (MCA) thrombi in brain MRI with QSM in acute ischemic stroke, compared to the pathological results of these thrombi after thrombectomy, and to assess the influence of QSM in thrombi diagnosis and prognosis.
2. Materials and Methods
2.1. Patients
This retrospective study was approved by the local institutional review board of Shanghai Fourth People’s Hospital Affiliated with Tongji University, School of Medicine, Shanghai, China. Written informed consent was obtained from the patients or their relatives between October 2017 and December 2019 and stored in the hospital database. A total of 26 patients were registered during the study period. Of them, 11 patients were excluded because of severe image artifacts (
n = 7), incomplete clinical data (
n = 1), and pathology data (
n = 3), leaving 15 patients in the current analysis (
Figure 1). Digital subtraction angiography (DSA) was used to confirm the diagnosis of MCA occlusion before thrombectomy. The clinical information on parameters, including age, gender, time from symptom onset to magnetic resonance imaging (MRI) examination, National Institute of Health Stroke Scale (NIHSS) score, 90-day mRS, and clinical history, was obtained from our stroke unit registry and electronic medical records.
2.2. Imaging Parameters Analysis
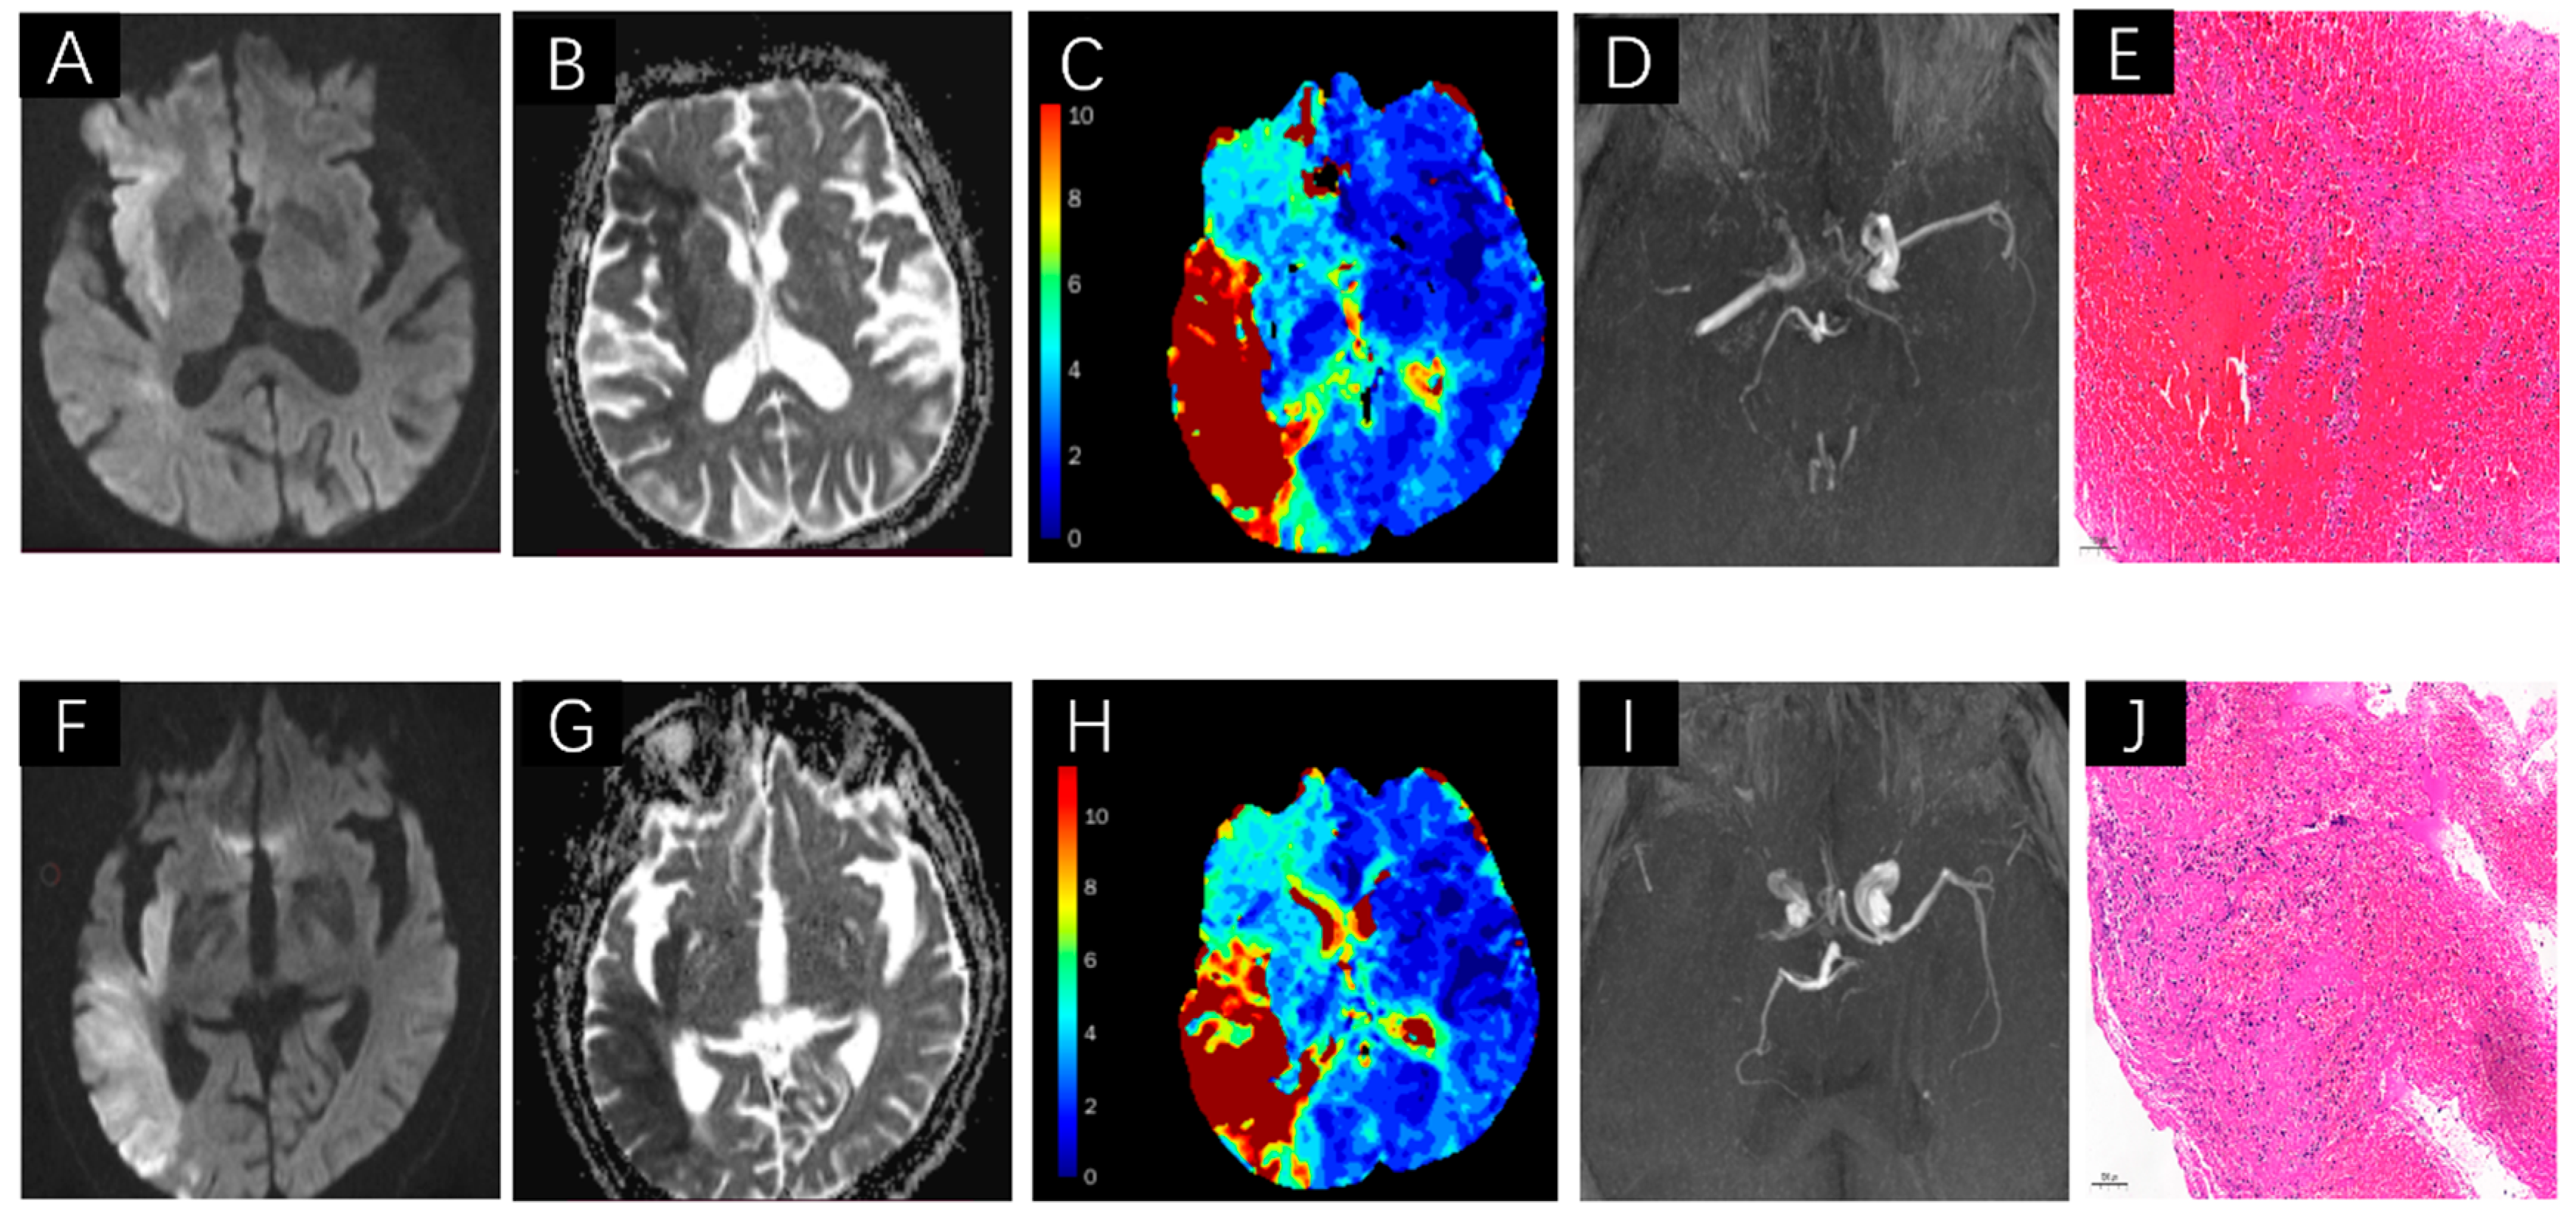
MRI was performed on a Siemens Avanto 1.5 T MR system (Siemens, Erlangen, Germany). All cases were scanned axially in the supine position. Patients were advised to keep their heads motionless during the MRI examination. The scan protocols for each patient included T2-FLAIR, DWI, TOF-MRA, SWI, and DSC-PWI. SWI was used to assess the susceptibility of SVS-positive thrombi. SWI sequences were acquired using the following parameters: repetition time = 49 ms; echo time = 40 ms; slice thickness = 1.6 mm; field of view = 220 mm × 220 mm; matrix size = 256 × 256; and number of excitations = 2. Magnitude, phase, SWI, and maximum intensity projection (MIP) SWI images were constructed automatically by the scanner software. TOF-MRA examined the condition of intracranial arteries, MCA occlusion in TOF-MRA, and SVS on SWI. DWI showed a high intensity, and the corresponding ADC showed low intensity, which was used to assess acute infarcts core volume. DSC-PWI was performed with an intravenous injection of gadopentetate dimeglumine (Gd-DTPA) (Shanghai Pharmaceutical Corporation, Shanghai, China) at a dose of 0.2 mmol/kg body weight at a flow rate of 4 mL/s. A volume of 30 mL saline was flushed at the same flow rate, and Tmax > 6 s volume map was used to assess hypoperfusion volumes.
Original diffusion (b = 0, 1000 s/mm
2) and perfusion images were post-processed using the fully automated Rapid Processing of Perfusion and Diffusion (RAPID) software (iSchemaView, Menlo Park, CA, USA). The RAPID software was used to calculate the volume of the infarct core on the ADC map (ADC < 0.62 × 10
−3 mm
2/s) and the volume of hypoperfusion tissue based on different Tmax map thresholds of >10 s, >8 s, >6 s, and >4 s automatically. The current study used the ADC map and Tmax > 6 s volume to represent the critical hypoperfusion tissue [
13,
14].
DSA was performed via a transfemoral approach using a biplane, high-resolution angiographic system (Axiom Artis zee; Siemens, Erlangen, Germany). The detailed measurements are shown in
Figure 2.
2.3. Thrombus Susceptibilitydata Processing and Analysis
Primary SWI data with complete phase and magnitude images were processed, and the unwanted low signal regions outside the brain were removed using a Brain Extraction Tool (BET) in FMRIB Software Library (FSL) [
15]. The background phase was reduced by a 96 × 96 homodyne high-pass filter, and QSM data were generated by a truncated k-space division with a regularization threshold of 0.1 [
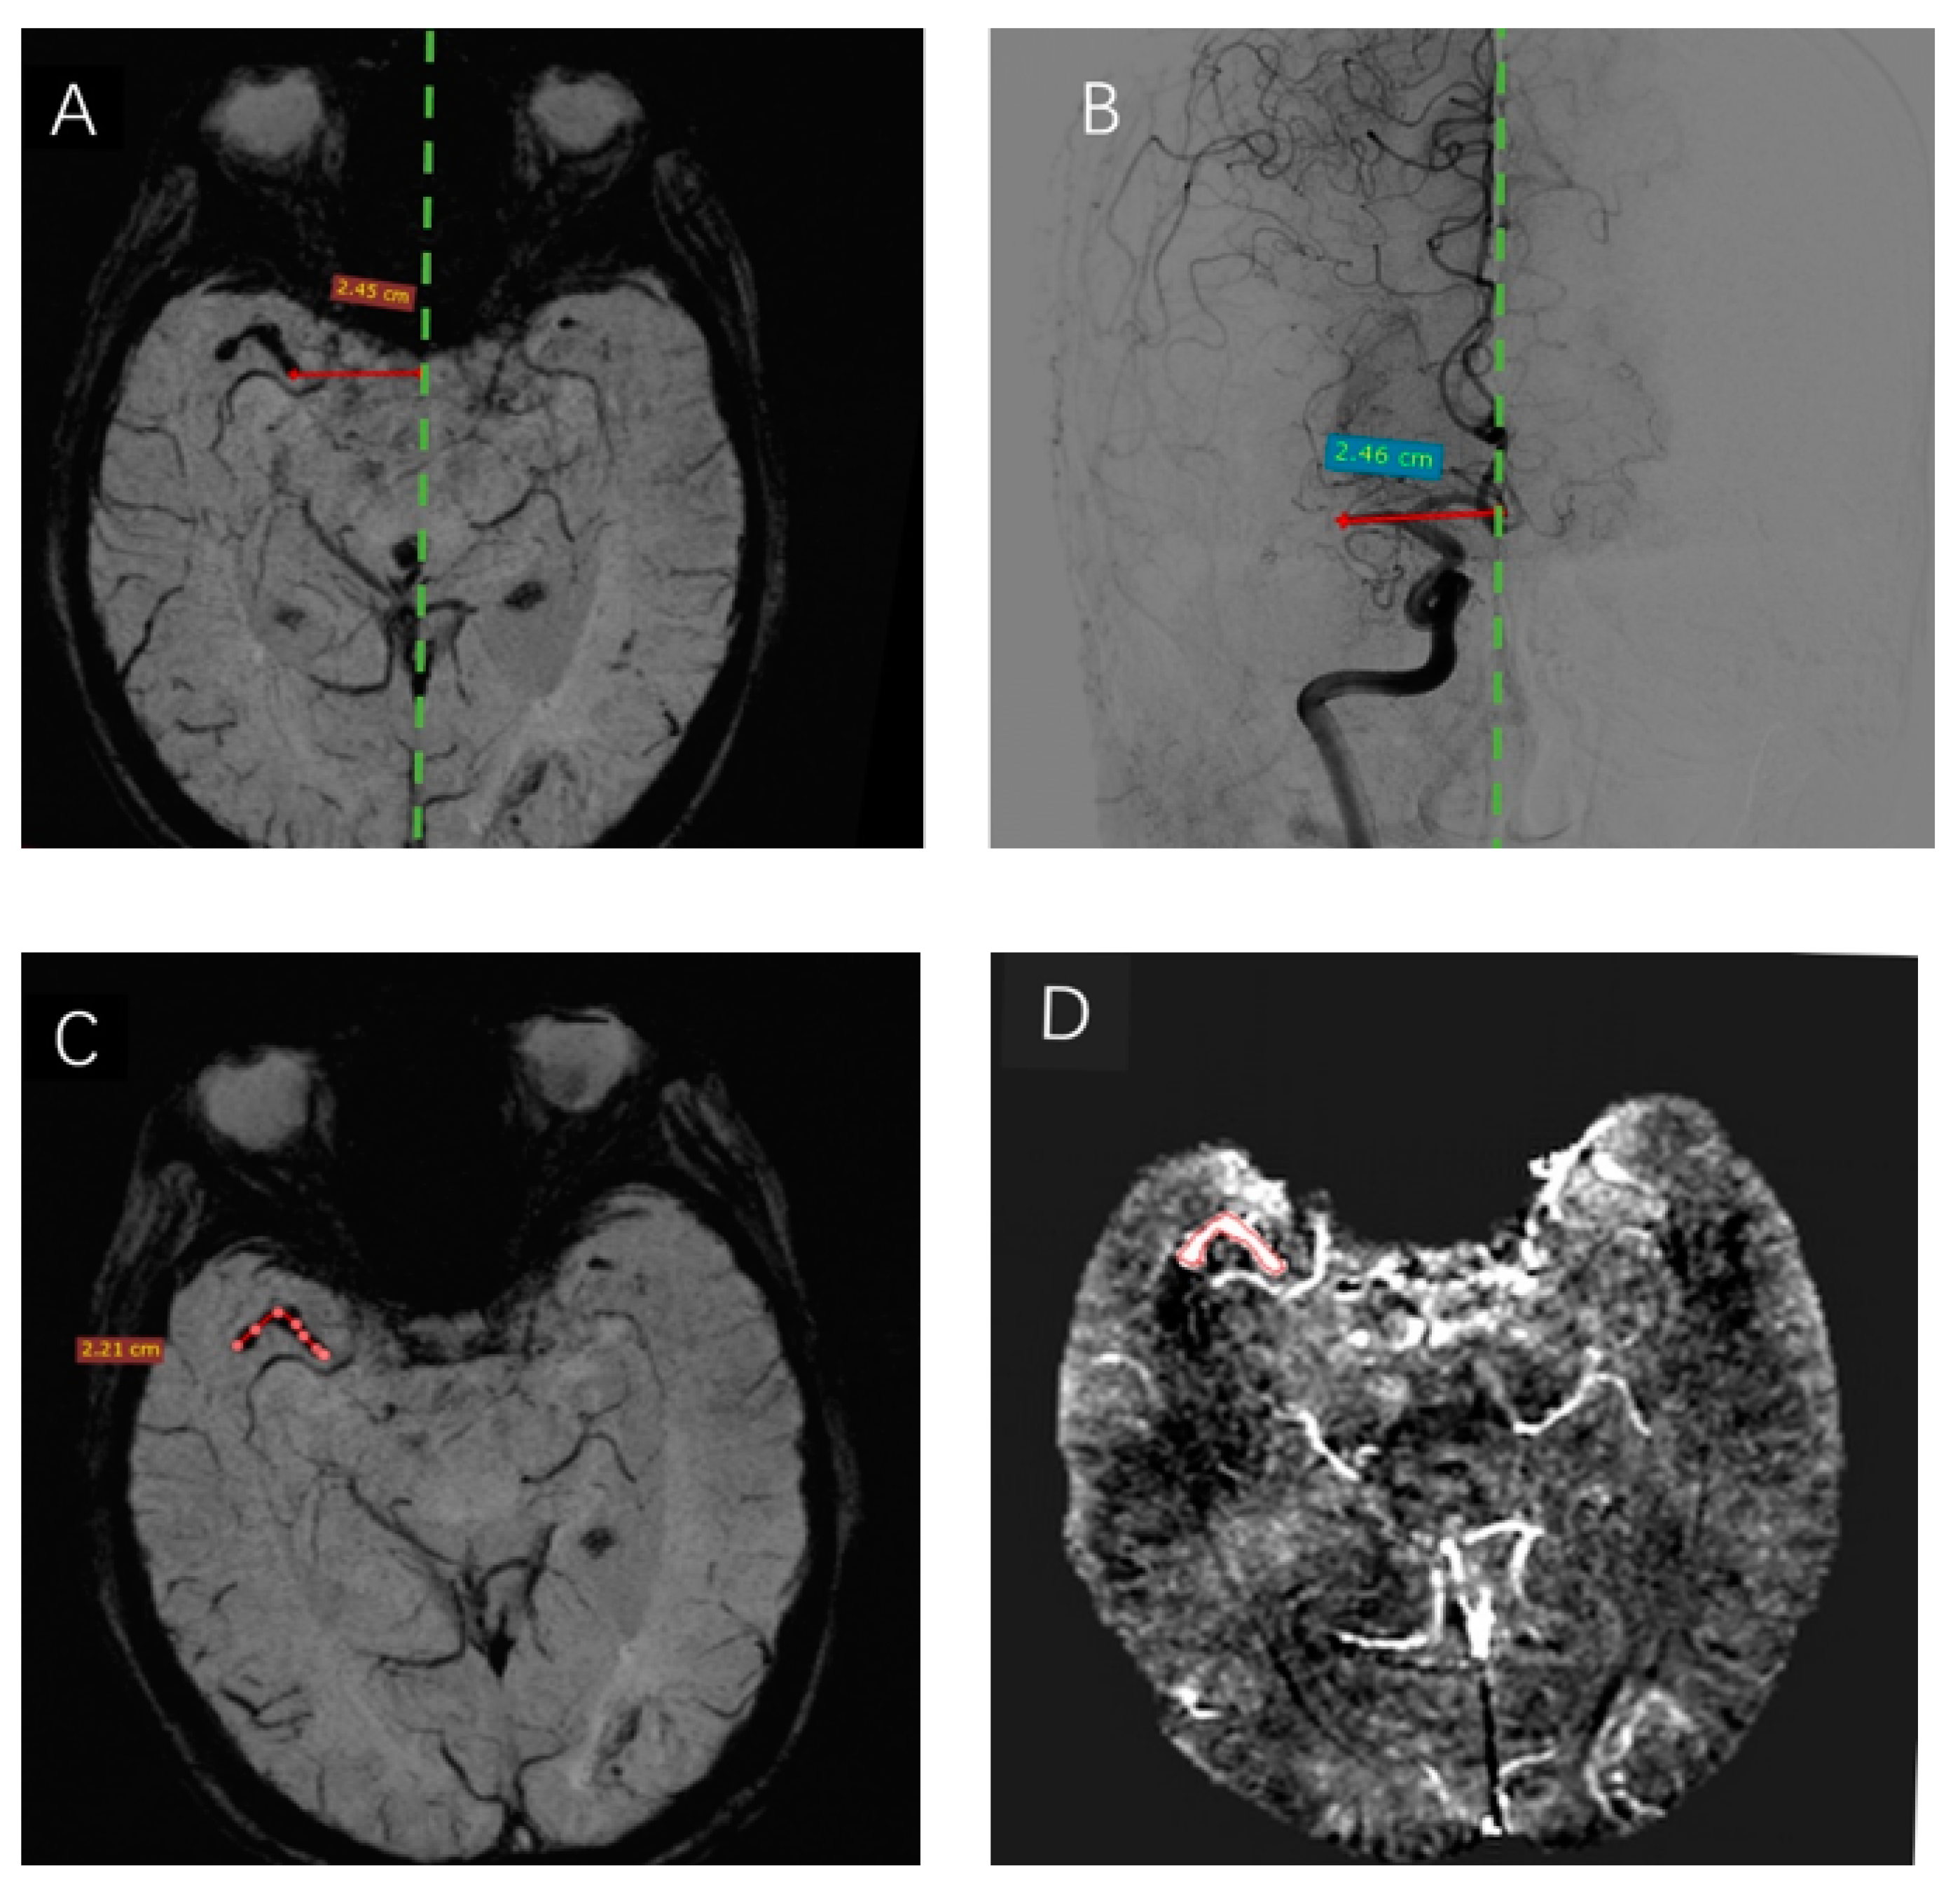
16]. Subsequently, the data were analyzed using signal processing in nuclear magnetic resonance (SPIN) software (SpinTech Inc, Miamisburg, OH, USA). The thrombus susceptibility of the region of interest (ROI) of thrombi in the maximum area plane was measured by two experienced radiologists who specialized in MRI. The detailed measurements are shown in
Figure 3D.
2.4. Pathology Data Processing and Analysis
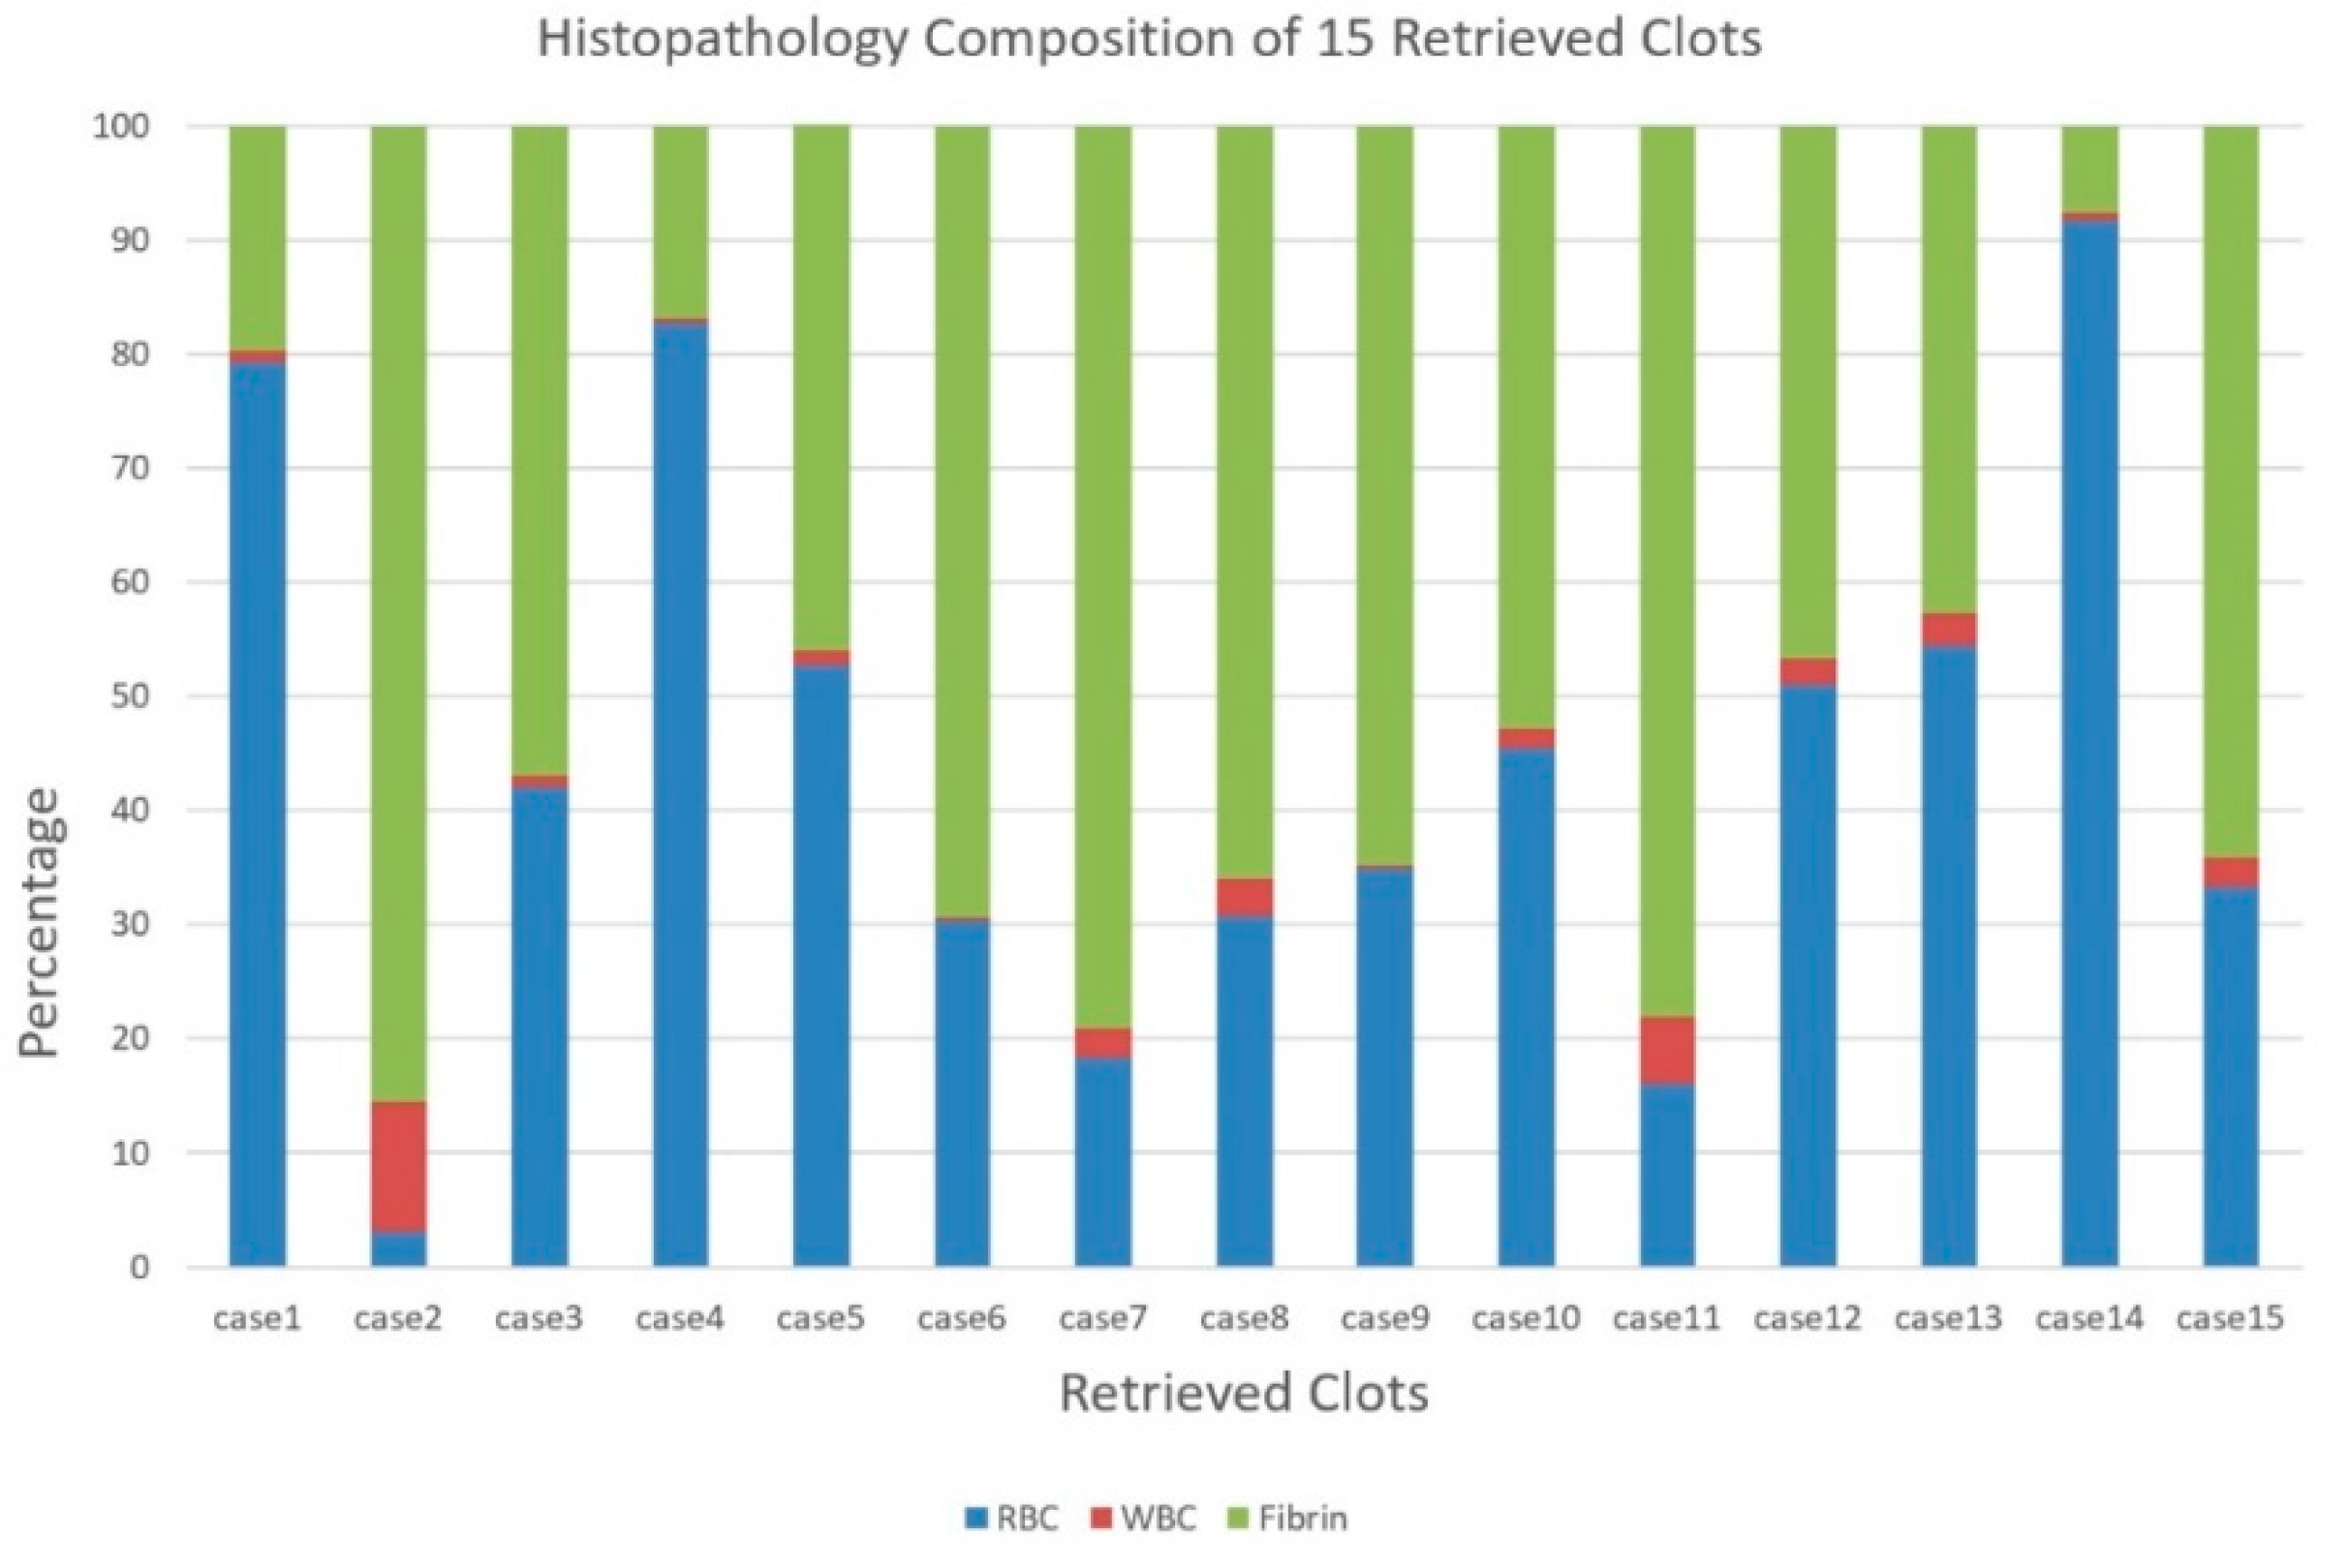
Thrombus retrieval was successively completed for all patients. The retrieved thrombi were then placed on a gauze or surgical dressing and photographed from multiple perspectives before fixing in 10% phosphate-buffered formalin for 24 h. Subsequently, the thrombi were embedded in paraffin, sliced into 5-μm sections, and stained with hematoxylin and eosin. The histological sections were photographed on a digital slide scanner (Pannoramic MIDI, 3D Histech, Budapest, Hungary), and the images were analyzed by a technician of DynaMax Biotech Co., Ltd., who was unaware of the clinical or imaging findings of these patients, based on the feature-detection analysis of the areas occupied by RBCs, white blood cells (WBCs), platelets, and fibrin. Finally, the thrombi were categorized into RBC-dominant and fibrin-dominant based on the microscopic features and the automated quantitative and qualitative rating of the proportion of each blood cell type.
2.5. Measurement of the Length of Thrombi and Analysis
The location of the SVS was used to denote the position of the thrombus in relation to the midline. The midline was defined as a line connecting the occipital part of the superior sagittal sinus with the point midway between the A2 segments of the anterior cerebral arteries, as observed on axial images. The maximum thrombus length was measured on SWI using a previously published method [
17]. The diagnostic series of DSA images were analyzed for the presence and location of the occluding thrombus according to the criteria used for SWI. The detailed measurements are shown in
Figure 3A–C. The measurements were completed by two radiologists unaware of SVS on SWI and the location of the occlusion on SWI and DSA.
2.6. Statistical Analysis
All statistical analyses were carried out using SPSS 26.0 (IBM Corp.,Chicago, IL, USA, 2019) Continuous variables (age, interval between onset and MRI, NIHSS score, and 90-day mRS) were presented as the mean and standard deviation or median (interquartile range).
The difference in the distance of the proximal thrombus end to the midline in SWI and DSA was explored using two independent samples Wilcoxon rank test. The correlation between QSM susceptibility values and the pathologic composition of thrombi was analyzed using two independent Kolmogorov–Smirnov tests. Spearman’s correlation analysis was used to analyze the association of susceptibility values with the ADC < 620 mm2/s volume map, Tmax > 6 s volume map, 90-day mRS, and NIHSS at admission. Before this step, the residual analysis was used to identify any outliers. p < 0.05 was considered statistically significant. The correlation coefficient (r) ranged from −1 to 1. If (r) was <0.3, a poor correlation was concluded. If (r) was >0.3 but <0.5, a weak correlation was concluded. If (r) was >0.5 but <0.8, a moderate correlation was established. If (r) was >0.8, a strong correlation was concluded.
3. Results
A total of 15 patients consisting of 40% males, mean age ot 73.47 ± 10.7 (range 59–88) years, were included in the final analysis. The clinical characteristics of these patients are summarized in
Table 1. Among these patients, 10 had an occlusion of the M1, 3 had M2, and 2 had both the M1 and M2 segments. All patients underwent thrombectomy with successful retrieval of their thrombi. The gold standard DSA showed vessel occlusion in all patients. The average distance of the proximal end of the thrombi to the midline was 24.67 ± 8.43 mm and 24.62 ± 8.44 mm as measured by SWI and DSA, respectively (
Figure 3A,B), there was no difference in the detection of thrombus initiation between the two groups. Also, the SVS of SWI can directly measure the curve of thrombi length of 2.21 cm (
Figure 3C), and the mean thrombus length of 15 cases was 16.57 ± 4.6 mm. The susceptibility of each region of interest (ROI) of the thrombus was measured manually and shown directly by the SPIN software (
Figure 3D). The mean susceptibility values of RBC-dominant thrombi and fibrin-dominant thrombi were 209.88 ± 11.32 ppb and 155.70 ± 28.20 ppb, respectively. The mean thrombus susceptibility of RBC-dominant thrombi was significantly higher than that of fibrin-dominant thrombi (
p = 0.037).
The thrombi were automatically categorized into RBC-dominant and fibrin-dominant thrombi based on the microscopic features. The mean proportions in 15 retrieved thrombi were as follows: fibrin 53.1%, RBCs 44.4%, and WBCs 2.5%. The pathology was broadly distributed across all cases, as shown in
Figure 4.
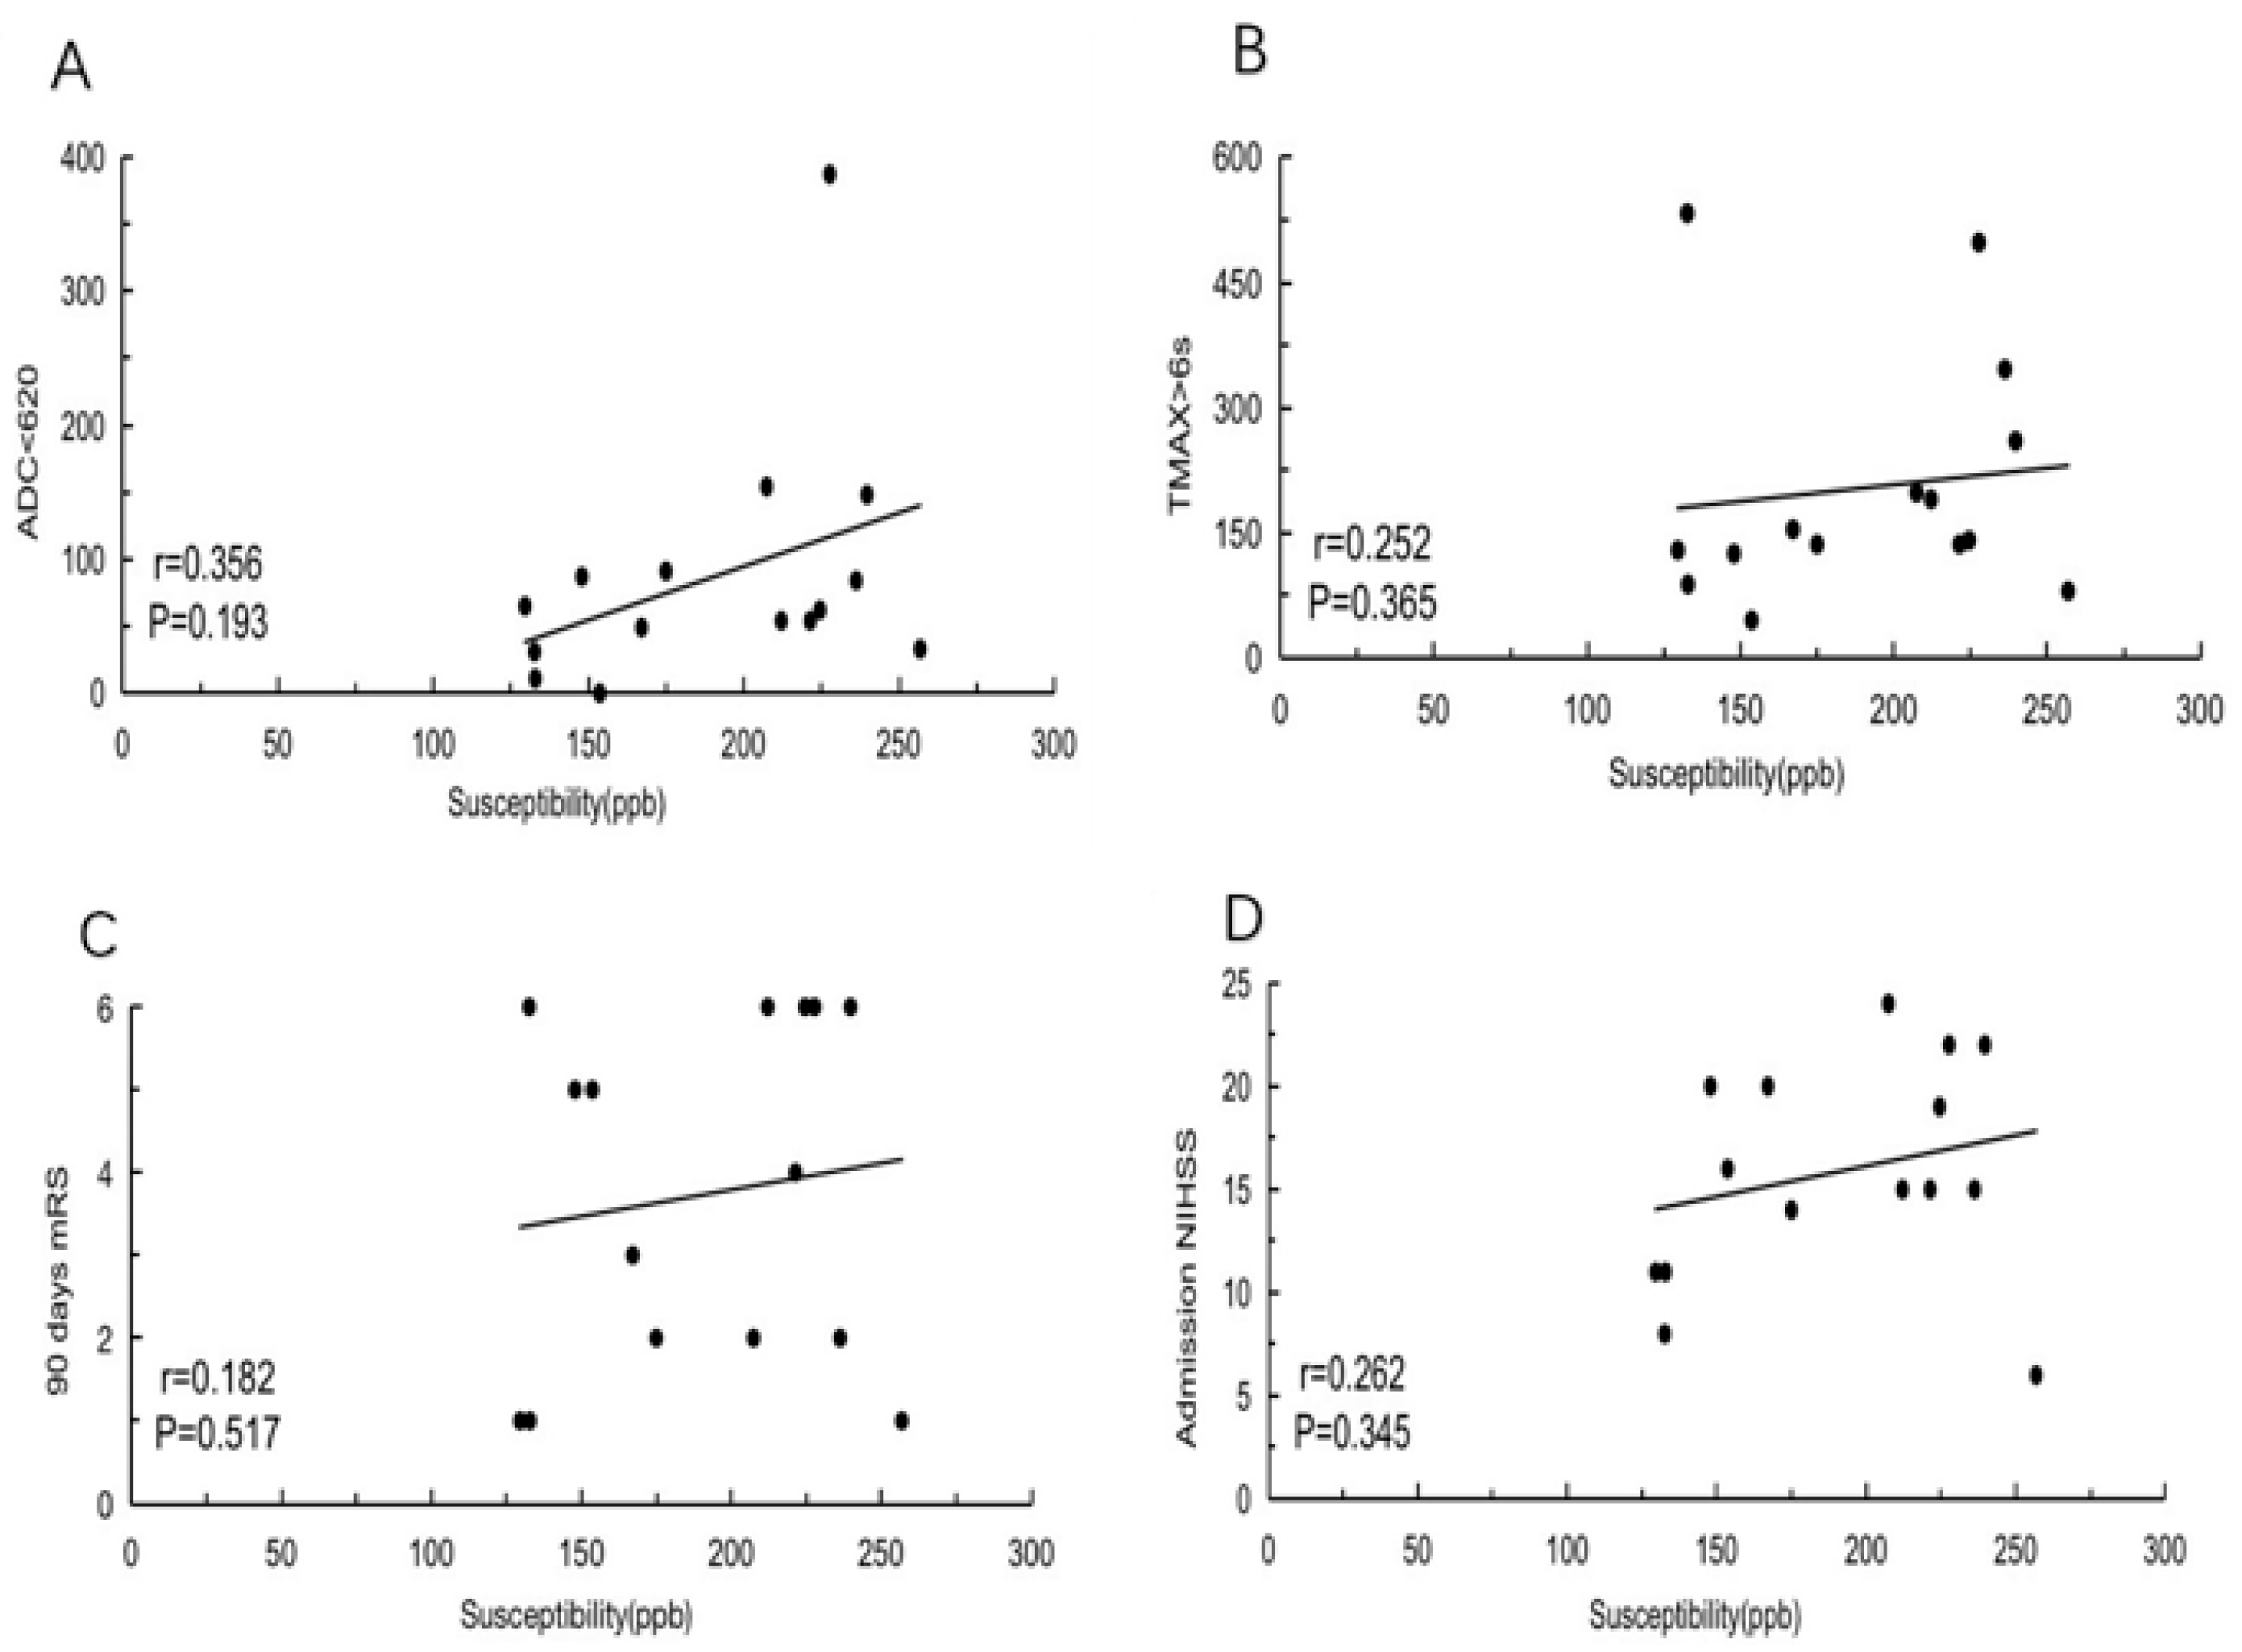
Thrombus susceptibility was weakly negatively correlated with the ADC < 620 mm
2/s volume map (
r = 0.356,
p = 0.193) (
Figure 5A) and poorly correlated with the Tmax > 6 s volume map (
r = 0.252,
p = 0.365) (
Figure 5B), 90-day mRS (
r = 0.182,
p = 0.517), and NIHSS at admission
(r = 0.262,
p = 0.345) (
Figure 5C,D).
4. Discussion
In the current study, SWI takes advantage of the paramagnetic property of deoxyhemoglobin and enhances the visualization of the thrombus with the blooming hypointense signal in the responsible occluded vessels [
11]. QSM has been shown to be a promising method for evaluating the susceptibility of hemoglobin in red blood cells. It can also be used to evaluate the behaviors of other biomarkers, such as iron, calcium, and myelin, and assess the susceptibility of ferritin, calcification, and contrast agents. Chen J et al. said that the susceptibility of the thrombus in the occluded MCA could be quantified by using QSM, and the thrombus susceptibility (≥0.35 ppm) showed a better diagnostic performance than SVS for the discrimination between cardioembolic and other stroke subtypes [
18]. However, there was no pathology from thrombectomy to support the consistent susceptibility with a similar component. In our study, we directly related the susceptibility values to the pathologic composition of thrombi from thrombectomy. Interestingly, the RBC-dominant thrombi have a higher susceptibility than the fibrin-dominant type, and the susceptibility values were 209.88 ± 11.32 ppb and 155.70 ± 28.20 ppb, respectively. Roughly similar to Chen J et al. study, RBC-dominant thrombi have higher susceptibility values than fibrin-dominant types, in our study, RBC-dominant thrombi have lower and more precise susceptibility values than cardioembolic thrombi. The discrepancy in thrombus susceptibility between these two studies could be explained by the different field strengths (1.5 T and 3 T) in obtaining SWI and the varied data processing software. In our study, we directly compared the pathologic data with thrombus susceptibility to diagnosis thrombi types, so it could be more accurate than Cardioembolic stroke thrombi which are easily misdiagnosed in clinical.
Therefore, QSM may have the potential to be used as a biomarker to distinguish between different components of thrombus by quantitative susceptibility values in ischemic stroke.
The present study found that the location and the length of thrombi could be assessed using SVS, and the results were in agreement with DSA findings. SVS is a sensitive and specific marker of acute thrombi, not only in MCA occlusions but also in ICA occlusions or in posterior circulation occlusions, as reported previously [
19]. In our study, strong correlations were established between the location and length of the thrombus on SWI and that on DSA. SWI shows the proximal end of the occluding thrombus, as well as its length and value of susceptibility. Riedel et al. demonstrated that thrombus imaging with SWI guides the selection of the treatment approach in patients with MCA occlusions. The study also mentioned that intravenous thrombolytic agents were preferred for patients with short thrombi (<8 mm in length); the gap could be bridged with endovascular therapy only for patients whose symptoms do not improve [
20]. However, the length of thrombi might not be considered an independent predictor of short-term clinical outcomes of cerebral infarction.
We also found that there was no correlation between thrombus susceptibility and ADC < 620 mm2/s volume map, Tmax > 6 s volume map, 90-day mRS, and NIHSS at admission. This finding indicated that thrombus susceptibility is not related to the severity of cerebral infarction and does not reflect the degree of clinical symptoms. Hence, thrombus susceptibility might not be considered an independent predictor of acute stroke.
Taken together, the susceptibility of the thrombus in the occluded MCA can be quantified using QSM, and to compare thrombus susceptibility and pathology composition of thrombus, the mean thrombus susceptibility of RBC-dominant thrombi were higher than fibrin-dominant thrombi. We also can evaluate the location of the thrombi with QSM and measure the length of the thrombi at the same time. However, the thrombus susceptibility was weakly yet negatively correlated with ADC < 620 mm2/s, Tmax > 6 s, 90-day mRS score, and NIHSS at admission.
Nevertheless, the current study has some limitations. First, it is a single-center pilot investigation with a small sample size, and the conclusion cannot be extrapolated to the general population. Therefore, larger-scale studies are required to confirm these findings. Second, none of the patients in the current study received pre-stroke antithrombotic treatment before undergoing an MRI scan and endovascular thrombectomy; if they had received antithrombotic treatments, the susceptibility of thrombi would have been affected. Only a little information is currently available on these aspects and should be addressed in future studies.


 ,
, 


