1. Introduction
The behavioral modeling of users has been an integral part of search engine development throughout recent decades. Brin and Page in their research work introducing the Google search engine, the most popular general purpose search engine currently in the world [
1], described the PageRank algorithm [
2] as a method of modeling searcher behavior in order to provide more accurate results. The accuracy of results leads to higher user satisfaction, which in turn increases engagement with the Search Engine, creating a positive feedback loop which leads to both the success of the Search Engine and the optimization of the user experience. Hassan et al. further reinforced this notion in their research, which supported that user behavior-based models can be better predictors of a search’s goal success than document relevance itself [
3]. This indicates that providing users with search results which will satisfy them is fundamentally linked with the essential understanding of their behavior.
Aspects of user behavior may vary based on the nature of the content that the users are searching for. Ceccarelli et al. identified a much lower average number of search terms in search queries relating to the fields of Art and Culture than the average of general-purpose search queries [
4]. This was also a preliminary finding in the earlier stages of this article’s research [
5]. Moreover, Smyth et al. discovered a higher query repetition rate for searches looking for images or specialized content, as opposed to general-purpose queries [
6]. These findings are a good indicator that the nature of the content may have a significant effect on user behavior. Based on this information and for the purposes of this research, a proprietary search engine that focused on the fields of Art and Cultural Heritage was developed. This platform, named “Art Boulevard”, used the principles of federated search to collect results from several repositories of artworks, research articles, and books and present them to the users, in response to their textual search queries. After a successful period of testing, coupled with a limited lab study of its usability, based on both quantitative implicit feedback and qualitative explicit feedback [
5], the platform was released to the general public. Using the real-world data collected by the platform in the form of user engagement metrics and behavioral measurements this study proceeded to shed an interesting light onto several aspects of user behavior during the process of searching online for Art and Culture related content. The Art Boulevard platform can be found online on
https://artboulevard.org (accessed on 11 February 2023) as well as on the Google Play and Apple Store mobile application storefronts.
The importance of real-world data was presented effectively by Dumais et al., who argued that the unmonitored and uncensored behavior of searchers using a search engine to serve their personal interests was, to an extent, different than the behavior observed in controlled environments such as lab studies or even field studies [
7]. Moreover, the implicit feedback provided by quantitative metrics of real-world behavior has proven to be useful in providing good predictions on user satisfaction as presented by Fox et al. [
8]. Data collected “in the wild” paint a truer picture of the users’ actions and preferences, since they are representative of their actual situations, including distractions, limited time, or other limiting factors, lack of inhibitions, and lack of commitment to the search tools, or loyalty to the service providers. The data collected by the Art Boulevard platform involved 10,490 search sessions performed by actual unaffiliated human users over a period of six months between the 15th of June 2022 and 15th of January 2023.
The use of Machine Learning (ML) technologies to study user behavior was introduced more than two decades ago. In 2004 Agichtein et al. used a supervised machine learning technique “to learn a ranking function that best predicts relevance judgments” [
9]. In fact, Agichtein et al.’s work with using implicit feedback in the form of user behavior metrics and combining it with ML in order to improve Web search ranking, was a prime example of ML powered data analysis of user behavior in the field of general-purpose search engines. In a similar but distinct fashion, White et al. described the usage of dimentionality reduction techniques to predict search engine usage trends and to study habitual behavior [
10]. Hassan et al. also focused on studying predictability, this time through Gradient boosting decision trees [
3]. In their research, they performed a comparison between using user behavior as a prediction for a successful search as opposed to document relevance [
3].
Beitzel and Lewis [
11], in their research regarding query classification, highlighted the importance of understanding the thematic area that a user query belongs to and proceeded to present a classification method based on a semi-supervised learning technique. The combination of manual matching and supervised learning based on data mined from web query logs displayed an impressive accuracy [
11]. Cao et al. [
12] further advanced automatic query classification by also incorporating in their approach neighboring queries and clicked results as context information. Their experiments on real data from a commercial search engine query log demonstrated their approach’s advantage over non-context-aware or naive context-aware approaches. In a more contemporary study, Caruccio et al. [
13] moved beyond using contextual information from submitted queries or clicked URLs, by incorporating into their model user interactions with the search engine such as mouse clicks, scrolling, cursor movement, and so on. This approach was evaluated in a lab study and yielded very promising results [
13]. Similar interaction metrics are analyzed in this study specifically for users searching for content related to Art and Culture.
Taking a closer look at the applications of ML techniques in the fields of Art and Cultural Heritage provided some interesting resources. Petras et al. described in detail the functionality of the Europeana Cultural Heritage search engine, which makes use of an ML framework to enhance its BM25F ranking algorithm, by weighting the various metadata fields [
14]. Hill et al.’s findings indicated an improvement in relevance through the use of this system that reached 24.1% [
15]. In applications not directly related to the search process, ML methods have been used to tackle classification issues in the effort for cultural preservation [
16] through digitization, to create textual annotations for data enrichment purposes [
17], and even in the field of intangible Cultural Heritage as a means to process human body motion information and qualities, in order to analyze and classify dance movements [
18]. In Art and Culture dissemination efforts, ML can greatly assist with the multiple classification challenges that are prevalent in almost every aspect of the discipline.
Various ML techniques and methods have been used to tackle different issues, both in terms of search user behavior and in the wider field of Arts and Culture. Kathuria et al. used K-means clustering to investigate user intent based on web search queries and to classify them automatically as Informational, Navigational, or Transactional queries [
19]. Castellano and Vessio used a deep learning approach that went beyond K-means clustering, in order to effectively apply clustering to visual works of art and specifically paintings, where traditional approaches were found lacking [
20]. Clustering may find applications in various classification problems where quantitative metrics are used to describe a feature or interaction. In this study, K-means clustering was applied to numerical data describing user interaction sessions with the Art Boulevard platform, in order to gain insight regarding the different types of search approaches.
Gradient boosting has also been used often in research and especially in the development of ranking systems. Zheng et al., with their work on Gradient boosting regression trees, established Gradient boosting as a major learning paradigm for ranking problems [
21], while later Mohan et al.’s study on initiated gradient boosted regression trees further cemented the importance of Gradient boosting in the field [
22]. Gradient boosting approaches have since been used to predict ranking in various search applications. In this study, extreme gradient boosting was used to create a model predicting the successful or unsuccessful result of a search session, using a series of quantitative session-related metrics, and to analyze the importance of these metrics in this prediction.
Topic modeling has been used in Art and Culture often to deal with thematic investigation, based on natural language processing of textual information relating to works of Art or objects of Cultural Heritage. Kouretsis et al. used data collected from Europeana to explore the themes and relations of paintings originating from the Renaissance era [
23]. In the study of search engines, Bukhari et al. used probabilistic topic modeling to propose a Web service search engine [
24]. Both these studies use variations of the latent Dirichlet allocation model to discover abstract topics. In this study, topic modeling through the LDA was used to identify topics within the results clicked by the users of the Art Boulevard platform.
As mentioned above, during the course of six months, detailed quantitative data relating to the usage of the Art Boulevard platform were collected. This information was processed and used in this article in combination with machine learning techniques to answer the following research questions:
RQ1. What are the various types of Art search sessions, what are their main characteristics, and how do they differ from each other?
Search intent is an important aspect of understanding user behavior [
13], and the process of categorizing search sessions based on quantitative metrics allows the creation of archetypes of interaction between the searchers and the search engine. The differences in the mean values of these characteristics, for each identified session archetype, may provide insight regarding what each archetype involves, from a user intent or engagement perspective.
RQ2. What behavioral aspects are more important when trying to predict whether a search session will be successful or not in terms of discovering an interesting result?
Researching the ability to predict search success can help identify key aspects of user interaction that may lead to user satisfaction or dissatisfaction. Additionally, focusing on feature importance may shed light on aspects of user behavior that enhance or detract from the chance of a successful search session.
RQ3. What are the thematic topics that are prevalent in the Art and Culture-related content that the searchers showed interest in?
Topic detection and classification based on the results that attracted user interest allows our understanding of user behavior to move beyond the general approach and into specific topics. By studying specific topics, insight may be gained on the users informational needs and what aspects from the fields of Art and Culture can fulfil their search motivations.
The main goal of this analysis was to gain a better understanding of various aspects of user behavior when searching online for Art and Culture-related content, and through this understanding form a better idea of what the needs and wants of such users are and how an institution or individual providing Art and Culture-related content online may try to meet them. Using the methods and datasets presented in the following sections, this study was able to identify four main archetypes of Art search sessions: direct result sessions, short sessions, substantial sessions, and expert sessions. Additionally, the ability to predict the success of a search session through behavioral metrics was documented. Finally, by analyzing the textual content of user clicked results, it became apparent that traditional visual Arts concepts dominated the interest of searchers.
2. Methodology
2.1. Research Design
This research was carried out in two main stages: the collection of real-world usage information concerning the process of searching online for Art and Culture-related content, and the analysis of the collected information through ML techniques and algorithms.
The first stage involved the development and release of the Art Boulevard platform and the collection of real-world data regarding its usage over a period of six months. Creating a special purpose application in order to monitor user behavior and collect user interaction data has been used before for research purposes. Especially on the mobile apps space, according to Henze et al., such a method allows not only for a diverse user base, but also for numerous degrees of freedom [
25]. In the case of this article, the Art Boulevard platform was released both as a Web application in the form of a website and as a mobile application available in popular application storefronts. The fact that the collected data came from users belonging to the general public and not through a controlled group, as is the case with field or lab studies, allowed us to get a more candid picture of how Art and Culture searchers behave in the wild and collect a variety of implicit behavioral measurements which according to Fox et al. can provide good predictions on various aspects including user satisfaction [
8]. White et al. [
10] emphasized the importance of long-term monitoring of user search behavior and used a six-month period in their study modeling search engine usage. Similarly, the data used for the purposes of this study were collected over a six-month period, thus alleviating the dangers of using severely time-limited information. Overall, the combination of real-world usage with long term data collection created a solid foundation for studying the behavioral aspects that emerged through the collected information.
The second stage of the research involved organizing appropriate data subsets from the whole of the collected information and applying ML techniques and algorithms on these specific subsets, in order to gain insights regarding the various research questions. Numerical data collected for each unique search session were used as the basis to study the main characteristics of search sessions through clustering. This data included not only query and result-related metrics, such as the number of queries performed, keywords used or results clicked, but also user interaction metrics, such as scrolling, cursor movement, session duration, clicks on interface elements, and so on. These metrics will be presented in detail below. The K-means clustering method is a great tool for classifying objects based on specific attributes of features [
26] and is widely used in multiple fields of study. A similar data subset, also derived from measurements concerning search sessions, was used in combination with Extreme Gradient boosting to study the predictability of a search session being successful and the importance of the various metrics in correctly predicting success or failure. Using Gradient boosting to study search engine behavior is not uncommon, not only on the topic of result ranking [
21,
22] but also on the topic of making predictions regarding click-through as demonstrated by Cakmac et al. [
27]. Finally, a subset of data involving the textual elements of search results in which the users showed interest was used in combination with a topic modeling technique to analyze the topics that attracted the interest of the Art searchers. Usage of Topic Modeling in humanities- related fields, where natural language information is prevalent, and specifically in the field of Art and Culture, has been used with success in the recent past in matters involving historical works of Art [
23], modern works of Art [
28] and even Art criticism [
29]. The usage of tried and tested ML techniques with a robust dataset produced very interesting findings regarding user behavior when searching for Art or Culture-related content online.
2.2. The Development of Art Boulevard and the Collection of Real World Data
Art Boulevard is a federated search engine which officially launched and became available to the general public on 15 July 2022, after more than two years in development. The platform’s main functionality involves receiving a textual query consisting of one or multiple search terms from the users and formulating this query into search requests to numerous public Application Programming Interfaces (APIs) provided by digital repositories which contain content related to Art and Cultural Heritage.
Table 1 lists repositories with brief descriptions that offer data to the platform. The platform then aggregates and standardizes this data based on its internal data model, presenting it to the user in a uniform manner while also augmenting it with additional functionality.
These repositories were selected based on the fact that they provided publicly available APIs and clear documentation on how to use them, they included large amounts of content in the English language, and they didn’t impose strict usage limits that would hinder the platform’s performance. Regarding Crossref and The Open Library, where Art and Culture are not the main focus, specific filtering options provided by the APIs’ functionality were used to ensure all content was closely related to the platform’s fields of interest.
Complementing its basic search functionality, the Art Boulevard platform incorporates a voice search feature powered by voice recognition technologies, a text-to-speech system that enhances content accessibility, a reverse image search feature that helps expand the platform’s pool of results, advanced search functionality intended for use by expert searchers, and finally, a limited user system which allows users to log into the platform using their social media accounts to personalize their user experience, to bookmark and save interesting results in their profile, and to share their interests with other users by customizing their profile page and making it publicly available.
In order for the reader to get a better understanding of how the platform operates, its basic functionality will be presented through a series of screenshots of the user interface of its Web version on a desktop or laptop device. The mobile application works in a very similar manner.
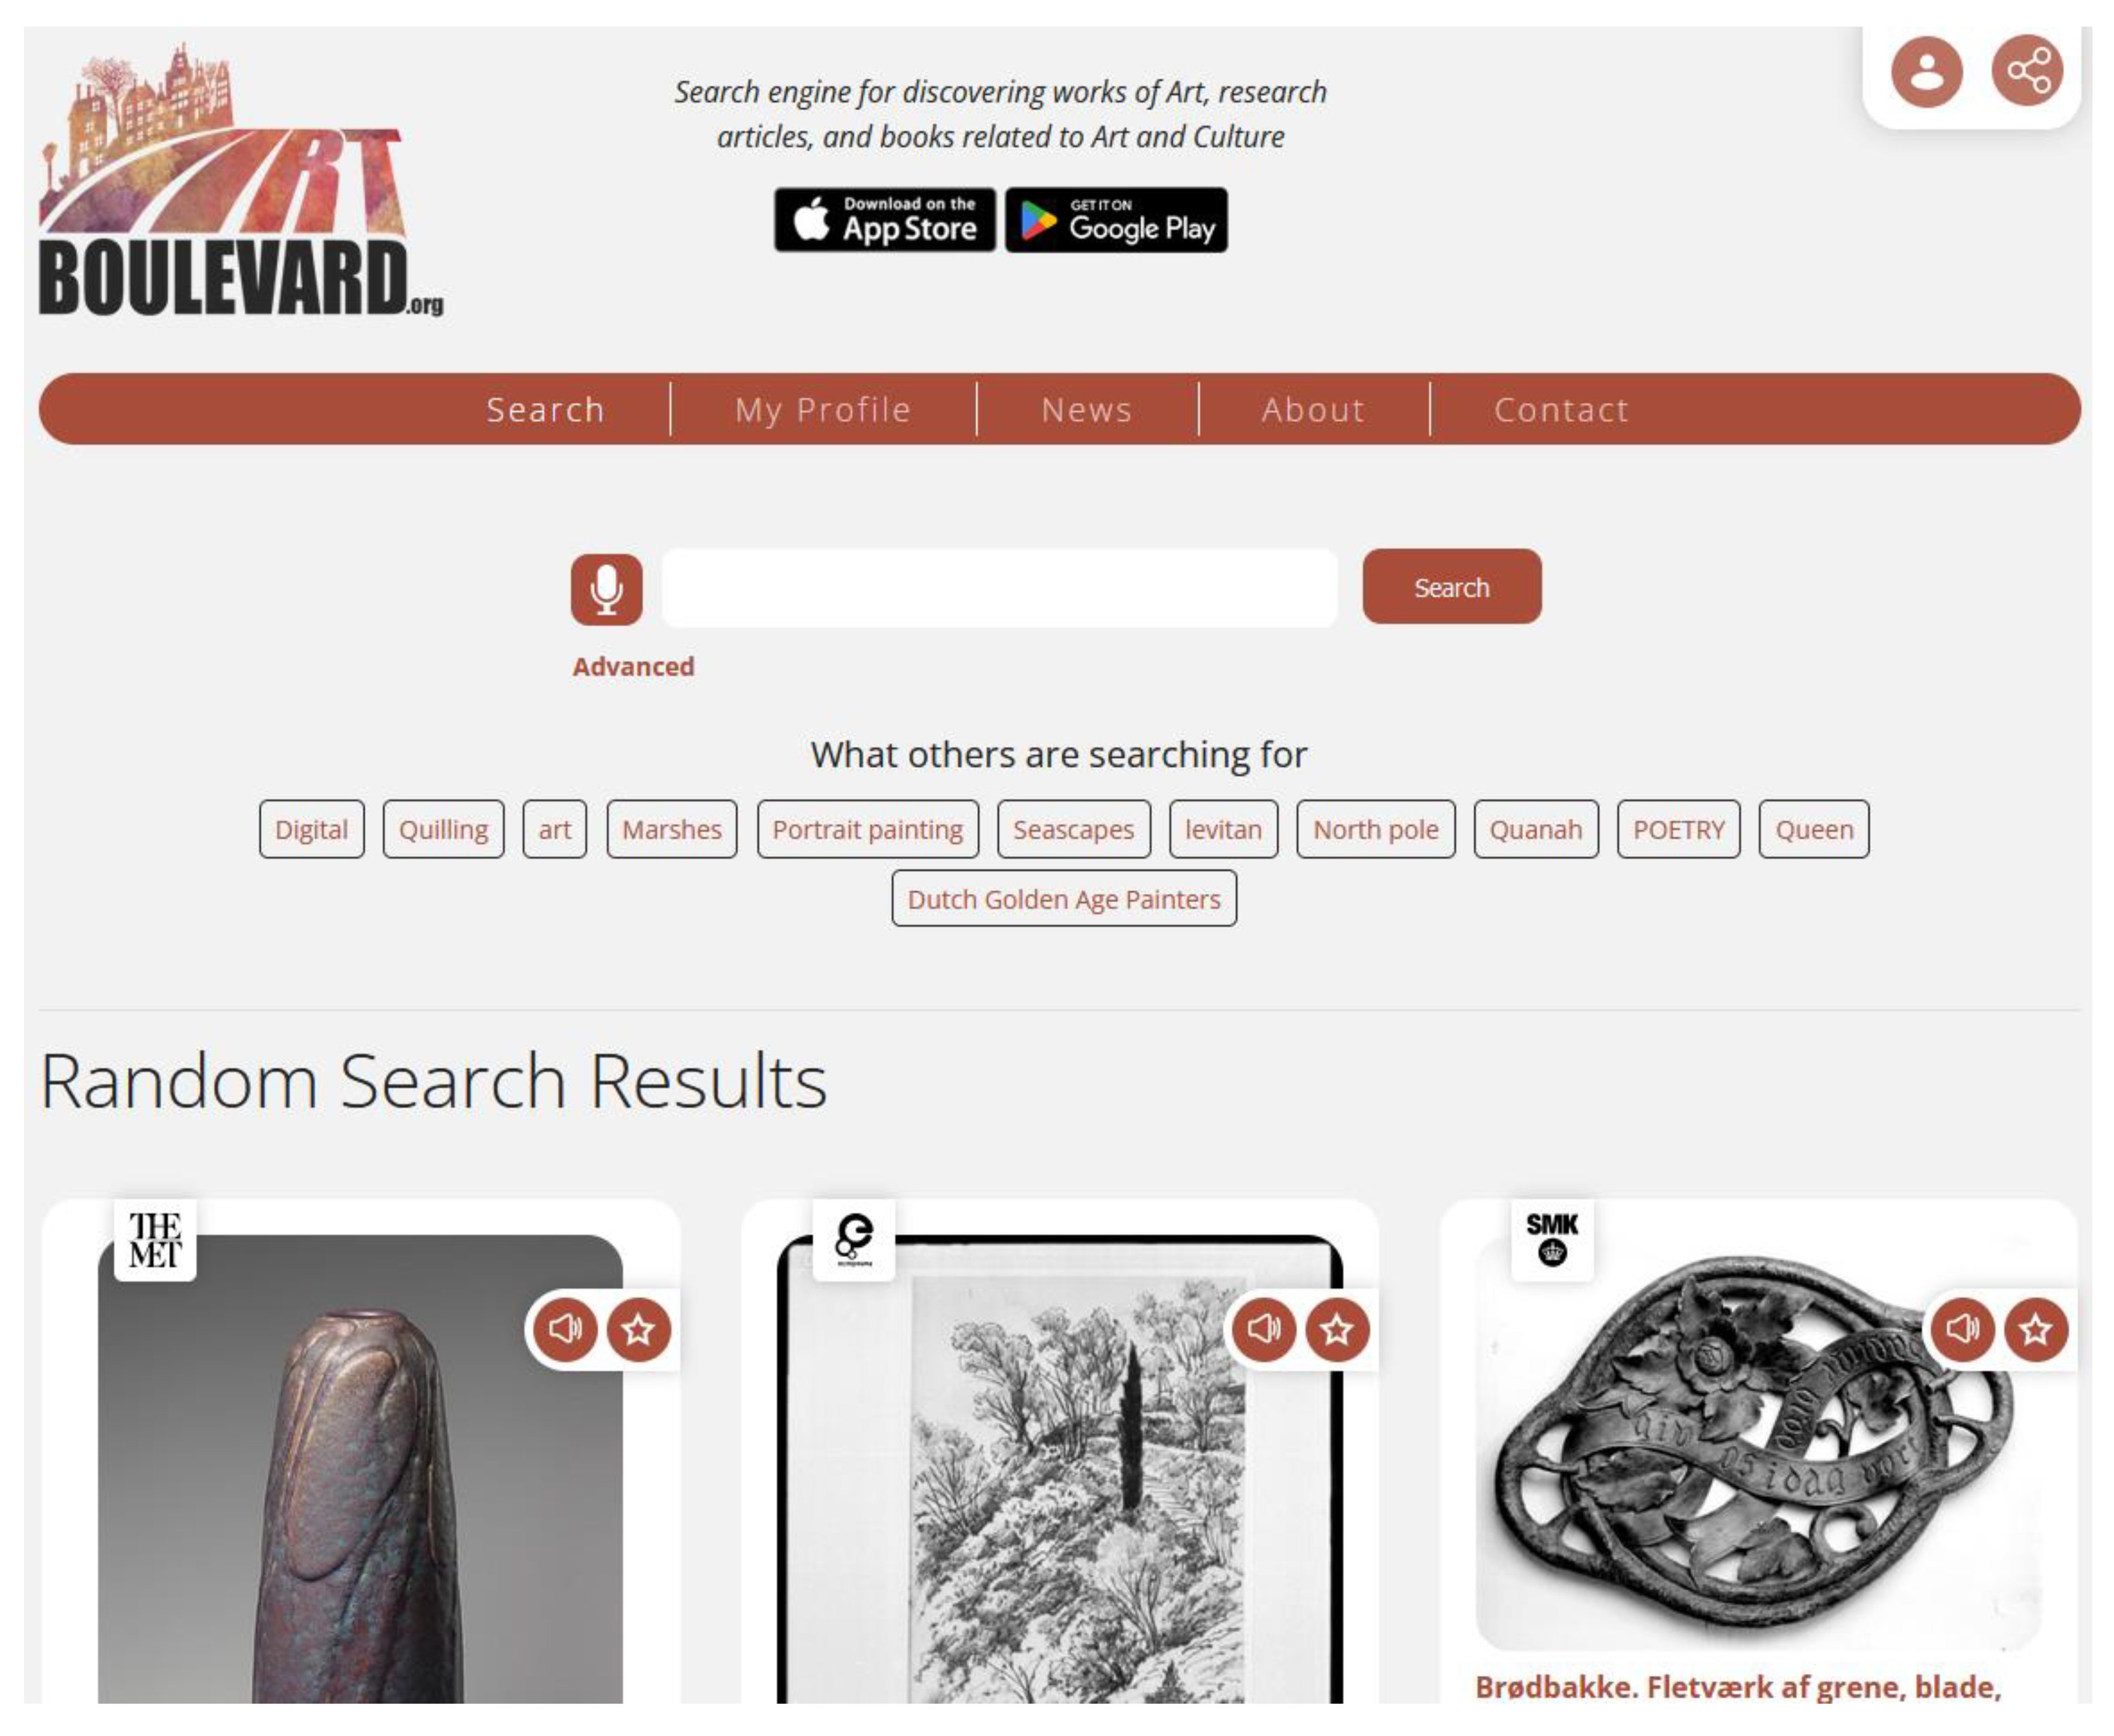
Figure 1 presents the homepage of the platform. The query input is in a prominent place. Additionally, query suggestions based on other users’ queries and some random results are provided in the frontage.
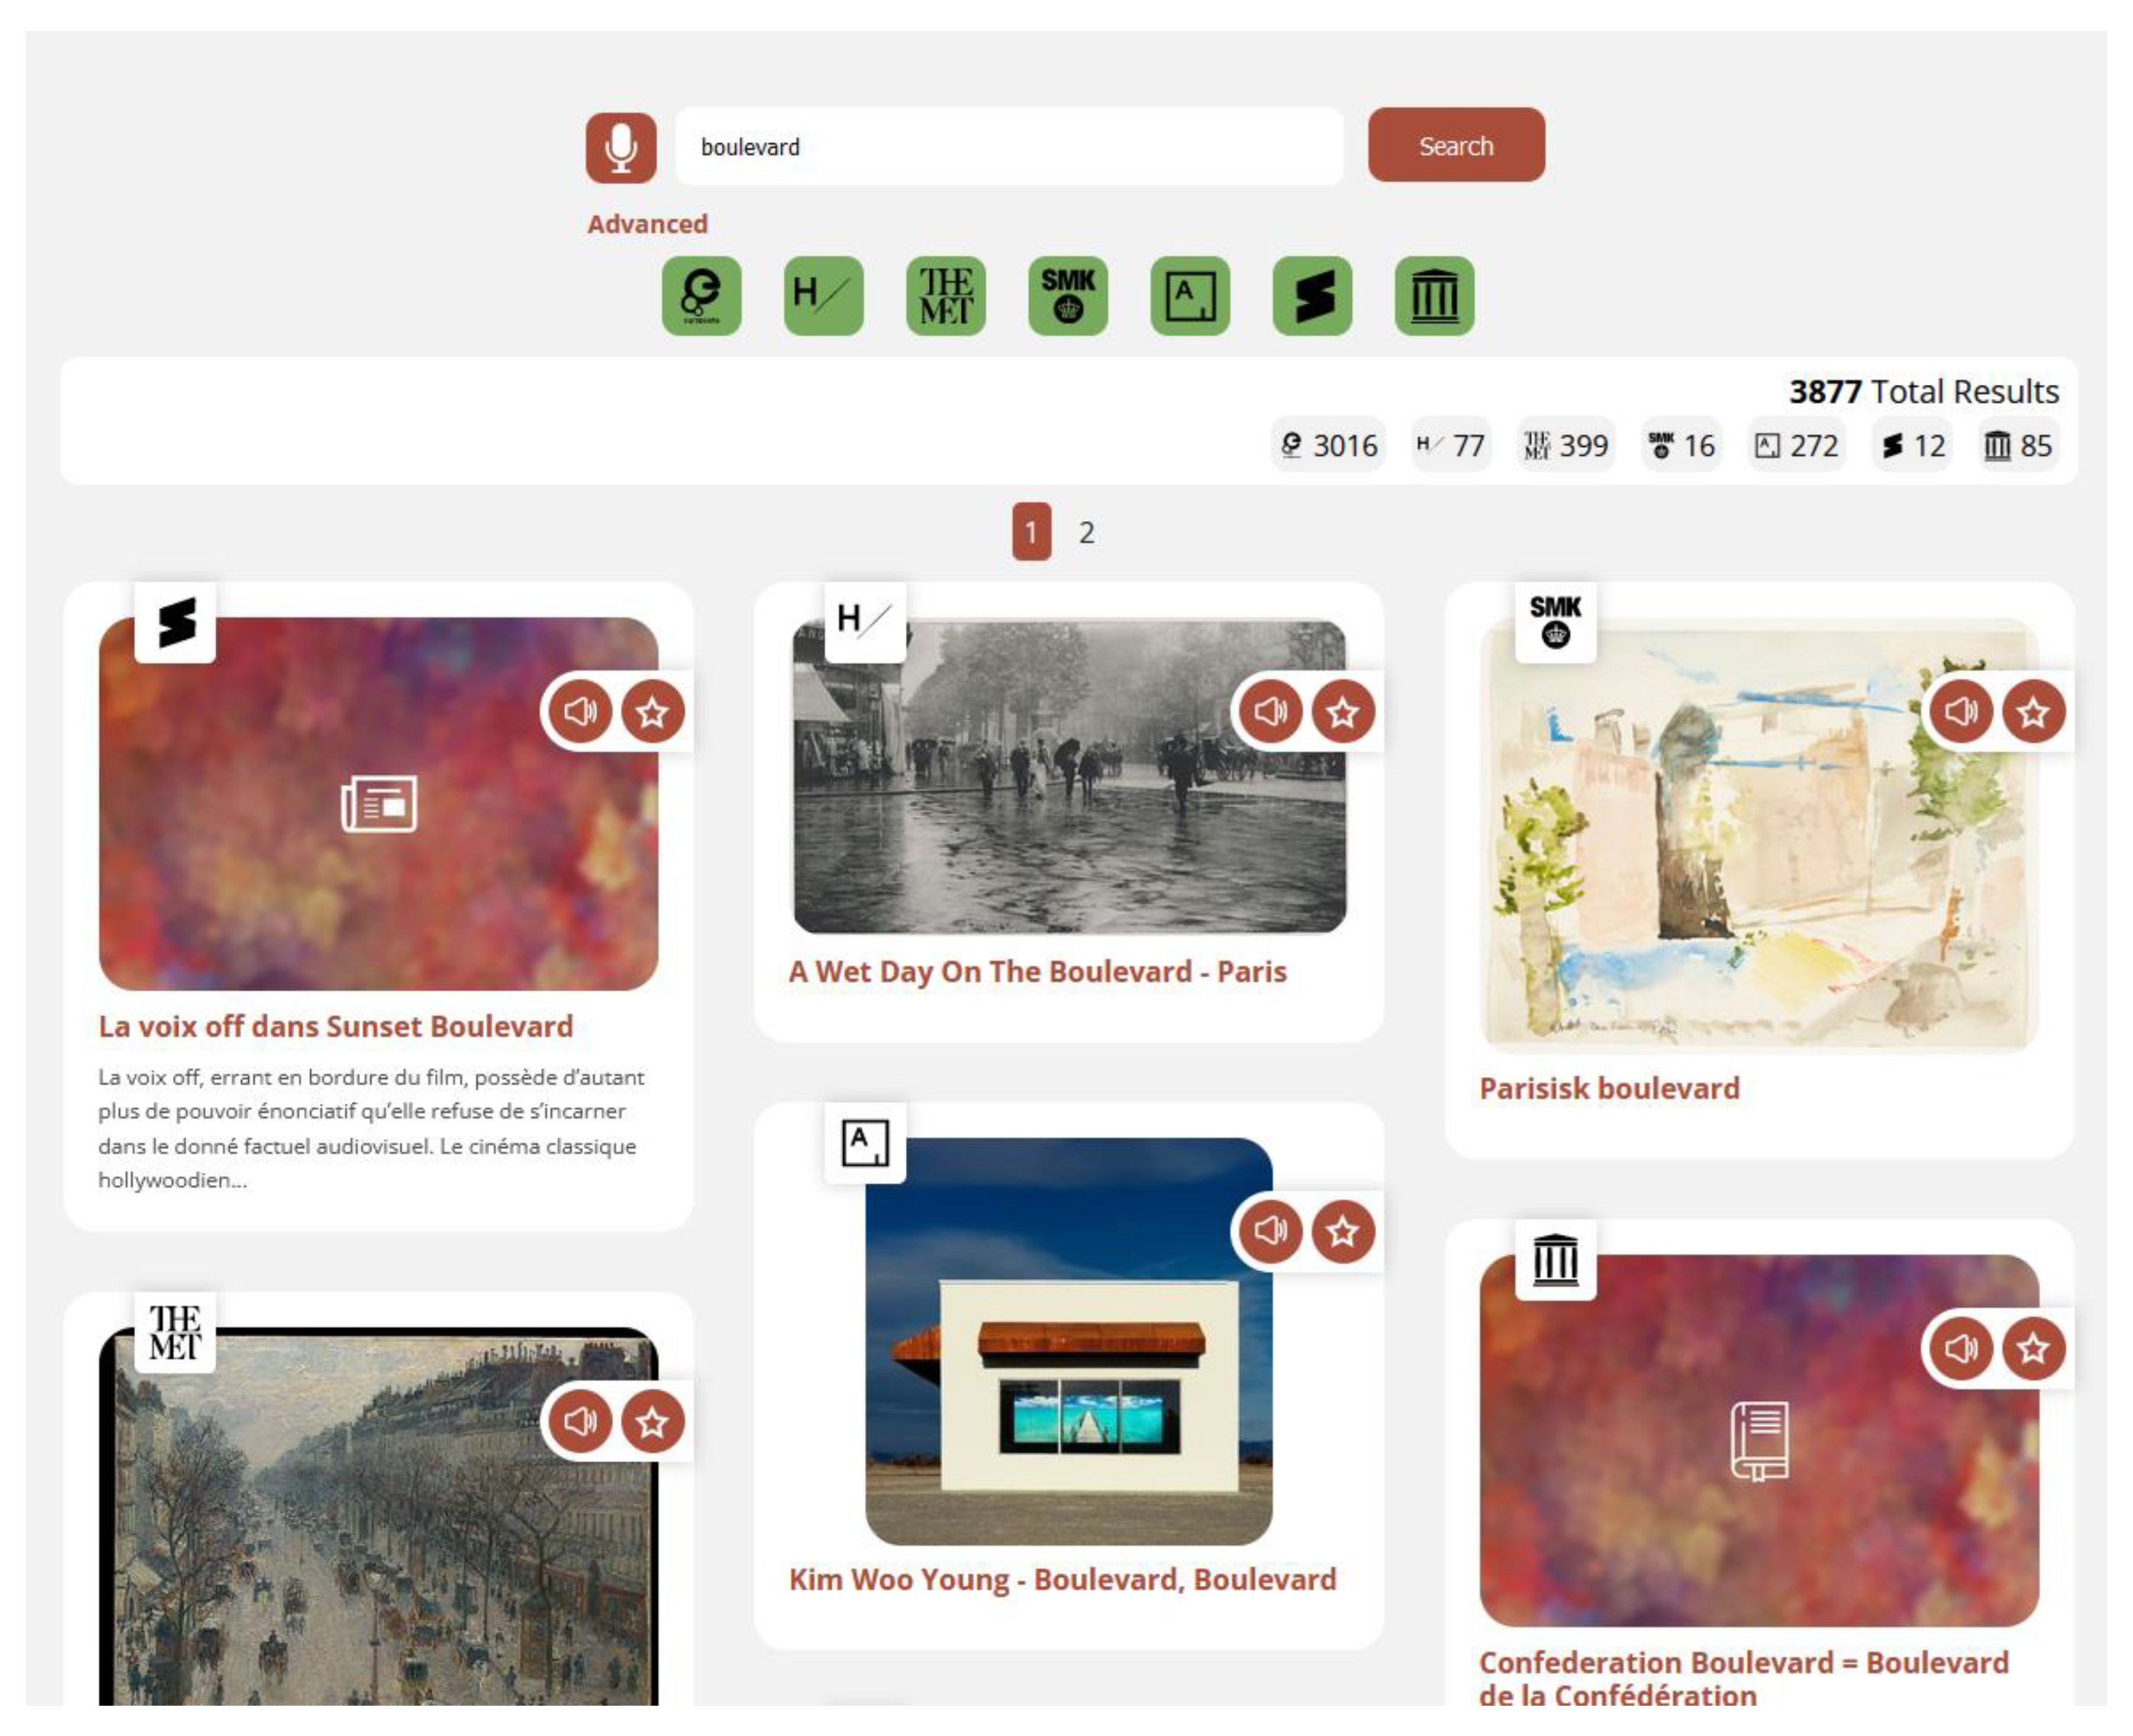
Figure 2 presents a listing of results that were produced by a user query. The results are received by their repositories in order of relevance and are then presented to the user with respect to that order. The Art Boulevard platform specifically requests from the repositories that the results are to be returned in an order determined by relevancy, and each repository calculates the relevancy of a result based on its own internal algorithms. The platform then uses the relevancy order by which each result is returned in the body of each API call’s response and presents the results to the user in that order. This means that results which were deemed more relevant by a repository will be presented further up the list in a manner that is well established in the field of search engines. The results’ page includes a total of up to 70 results if available, ten from each one of the repositories.
Figure 3 presents a result’s presentation page. When a user clicks on one of the results in the results’ list page, they will be navigated to a page containing all the information made available by the result’s repository. This includes an item’s title, description, terms relating to the spatial and temporal characteristics of the item (location, year of production etc.), the author or artist or other creator of the item, concepts such as methods, techniques, or subjects relevant to the item, and the item’s provenance and rights-related information. The terms related to the results are hyperlinks that will initiate a search process using these terms as the query’s content. Moreover, a preview of the item’s digital representation is presented alongside the option to search for similar such images as mentioned above. Finally, the result presentation page also includes a series of other results that are related to this one and might be of interest to the users. In a prevalent place at the top of the information regarding the item, a link to its original listing on the source repository is provided. Result presentation pages allow the user to get a more extensive look at the result and gauge whether it interests them enough to visit its original source repository, in order to receive even more information concerning this item. In addition to that, these pages help with the platform’s Search Engine Optimization (SEO) and increase an item’s findability, since each item is indexed individually. Art Boulevard enhances an item’s presence on the Web by implementing both Open Graph and Twitter Cards metadata structures as well as the schema.org data model for each result’s presentation page.
In order to preserve this article’s readability, more extensive details concerning the platform’s various other aspects are omitted. A more involved look at the platform, including the tenets behind its user interface and user experience design (UI/UX), the structure of its data model and the reasoning behind it, as well as the functionality of each secondary feature and its benefits are presented in a previous publication from earlier stages of this research, which involved the quantitative and qualitative evaluation of the prototype version of the platform [
5].
During its operation that lasted for six months between the launch of Art Boulevard on 15 July 2022 and 15 January 2023, the platform collected data documenting the users’ actions in great detail. These data came in three distinct categories:
Data concerning the queries performed in the platform;
Data concerning the results discovered and presented by the platform;
Data concerning the search session in general.
All of the above data were collected by the platform itself during usage. Since its design stages, Art Boulevard was intended to be not only a federated search engine, but also a useful tool for collecting behavioral data. The platform itself collects information that would have been part of a traditional search engine query log [
7], which has been characterized as a “gold mine” for studying user behavior [
11]. This information, instead of simply being available in the form of a log file as is customary in log studies, is stored in the platform’s relational database system, making it much easier to access and process.
Moreover, beyond user query information and result URLs, the platform collects a wealth of metadata regarding the results presented to the users. Search behavioral analyses on occasion successfully derive context from just using a results URL [
12]. In the case of Art Boulevard, textual annotations and other metadata are also aggregated from the source repositories and stored in the platform’s database, thus becoming available tools in the effort to study searcher behavior. Both the query-related data and the result-related data are collected and stored through a server-side data collection algorithm that is incorporated in the platform’s core functionality. This makes it easy to gain access to a wealth of well-structured information, while having minimal impact on engine performance and user experience.
More importantly, the platform’s server-side logic collaborates with client-side scripts, which are executed by the searcher’s browser, in order to collect a series of user interaction metrics. These include the duration of a visit, the amount of cursor movement or scrolling that the user performed, as well as a variety of interactions with the platform’s functionalities as expressed through user clicks. These client-side processes are served to the user’s browser as Javascript scripts and use AJAX techniques to store the collected information to the platform’s database. Similar interaction mining has been used by Caruccio et al. [
13] in their user intent analysis—except that in the case of Art Boulevard the data were collected from a wider user base, since this study’s participants are the general public.
Using the ability to collect information both from the system itself and from the user through their browser created the opportunity to study search behavior that goes beyond the model of typing a query and clicking a result. Instead, each user’s visit to the platform was recorded from start to finish; this included users that searched through browsing random or related results, users that came to the platform from direct links from other search engines or from social media, and so on.
For the purposes of this research, we considered a session to be over when the interaction between the user and the platform stopped for a substantial amount of time, so that any subsequent interaction may be considered a new session. This time was established at 24 min, which is also the default time for which the values of PHP session variables are retained server-side by the system.
The collected data were derived from 10,490 platform visits performed by actual members of the general public, since bots were identified and excluded from all aspects of this research. These people originated from 97 different countries from all around the globe. The data also included 2065 queries, a total of 64,134 results listed by the platform, and 2484 results clicked by users.
The users involved in these interactions were members of the general public that were not affiliated in any way with the platform or the researchers. In the platform’s terms of use section, it was indicated that data collection was taking place, as is commonplace for modern websites using general purpose analytics tools. Despite that, it is safe to assume that users displayed candid behavior while interacting with the platform, since their participation was not solicited.
Data concerning queries, results, and sessions were each held in their respective database tables, and relationships between them were recorded in appropriate pivot tables. Additionally, for session-related information, in order to record as much data as possible concerning the users’ interactions, the Session Timeline Table (STT) was created. In this table, a series of user actions were documented in order of their occurrence, using the entity-attribute-value (EAV) data model. For every user action, information regarding which session it originated from was recorded (entity of the EAV model) alongside the nature of the action (attribute if the EAV model) and a value specifying the object of the action (value of the EAV model). In addition to these metrics, the exact date and time of the action and the URLs it involved were also recorded, thus creating a complete picture.
Table 2 presents all of the variables of recorded actions accompanied by a short description, the value of each type of action involved, and a grouping of these actions based on the overall functionality that they supported.
After the data collection period was over, the information stored in the query, result and session database tables, as well as the pivot tables recording their interrelationships and the STT were used to derive a series of metrics that comprised the complete collected dataset.
Table 3 presents a summary of the variables that were derived from the collected data. In this study, a selection of metrics from the data that pertained to the user search sessions were used in order to investigate research questions RQ1 and RQ2. RQ3 was investigated using a dataset directly derived from the platform’s results database.
It should be noted that the study in general focuses on the results and result sources clicked by users and less on the results displayed from the search engine. This happens because due to the nature of the platform as a result aggregator, the occasions where no results were returned were minimal. The median of total results returned for each search query was recorded at 3728 results per query, while the average reached 39,953 results per query. From a total of 2065 queries, only 39 returned an empty result set, which is less than 2%. Instead, the study focuses on click-through events and clicked results.
2.3. Defining the Datasets and Using ML Techniques
In order to apply the necessary algorithms to the collected data, the R programming language was used, alongside the R Studio Integrated Development Environment (IDE). R is a programming language specifically developed for statistical computing and graphics, which was selected as the appropriate tool for this research’s purposes.
2.3.1. Classifying Sessions through K-Means Clustering
As mentioned in the research design section, the K-means clustering method was used to differentiate between the various types of recorded search sessions. The K-means algorithm was selected, because it is a clustering method that both guarantees convergence and can cluster all the sessions provided. The use of mean values both makes sense for the specific behavioral metrics provided by the Art Boulevard platform and presents useful information about the nature of the clusters as seen below in our discussion section. It is also an easy algorithm to implement and can serve as a starting point for session clustering. With the initial knowledge gained through K-means, in future studies, distribution or density-based algorithms might be utilized to refine this knowledge.
For every observation-session (x
1, x
2 … x
n), which consists of a multi-dimensional real vector of numerical variables, K-means will try to partition a number n of observations into a lesser number k of sets
S = {
S1,
S2, …,
Sk} in a way that minimizes the sum of squares within each cluster (WCSS), thus minimizing variance [
19,
20]. This means that the objective can be defined as:
where
μi is the centroid of all points in the
Si set:
and
is the Euclidean distance.
In our specific case, each of the 10,490 recorded sessions were considered observations that needed to be classified. Since in K-means each observation is assigned to the cluster with the nearest mean, categorical variables are not suitable and only numerical variables were employed. Out of the variables summarized in
Table 2 and
Table 3, the used dataset consisted of the following:
_duration, which measured the total duration of a search session in seconds;
_distance, which measured the distance traveled in pixels between mouse movements or screen taps;
_scroll, which measured the distance that the device screen was scrolled in pixels;
_total events, which measured the total number of actions recorded in the STT during the session;
_CT events, which measured the number of actions in which the user clicked on a link that provided them with further information (click-through event);
_queries, which measured the number of search queries performed;
_user, which measured the number of user public profiles viewed;
_result, which measured the number of result’s presentation pages viewed;
_related_r, which measured the number of clicked related results from a result’s presentation page;
_home_r, which measured the number of clicked results from the front page;
_direct_r, which measured the number of results’ presentation pages viewed directly by navigating to them from an external link;
_source, which measured the number of links to a result’s listing on its source repository clicked;
_related_q, which measured the number of terms clicked on a result’s presentation page;
_vs_events, which measured the total number of actions related to the visual search functionality;
_voice_events, which measured the total number of actions related to the speech recognition/synthesis functionality;
_user events, which measured the total number of actions related to the user system functionality.
First, any rows missing data in the dataset were omitted, and the values of each variable were scaled to have a mean of 0 and a standard deviation of 1. Scaling the data was an essential part of the process since it ensured that all variables were considered equally regardless of the unit of measurement. The empty rows were the result of “bounces”, as the term is known from Web traffic analysis. Since in our approach, a search session is considered the sum of interactions of a user with the platform, including not only querying but also browsing, scrolling, clicking, and so on, the dataset included some sessions with no interaction other than visiting the platform. In the discussion section, the notion of bounces will be further detailed and how it corresponds with the specific clusters defined by the K-Means algorithm and presented in the results section.
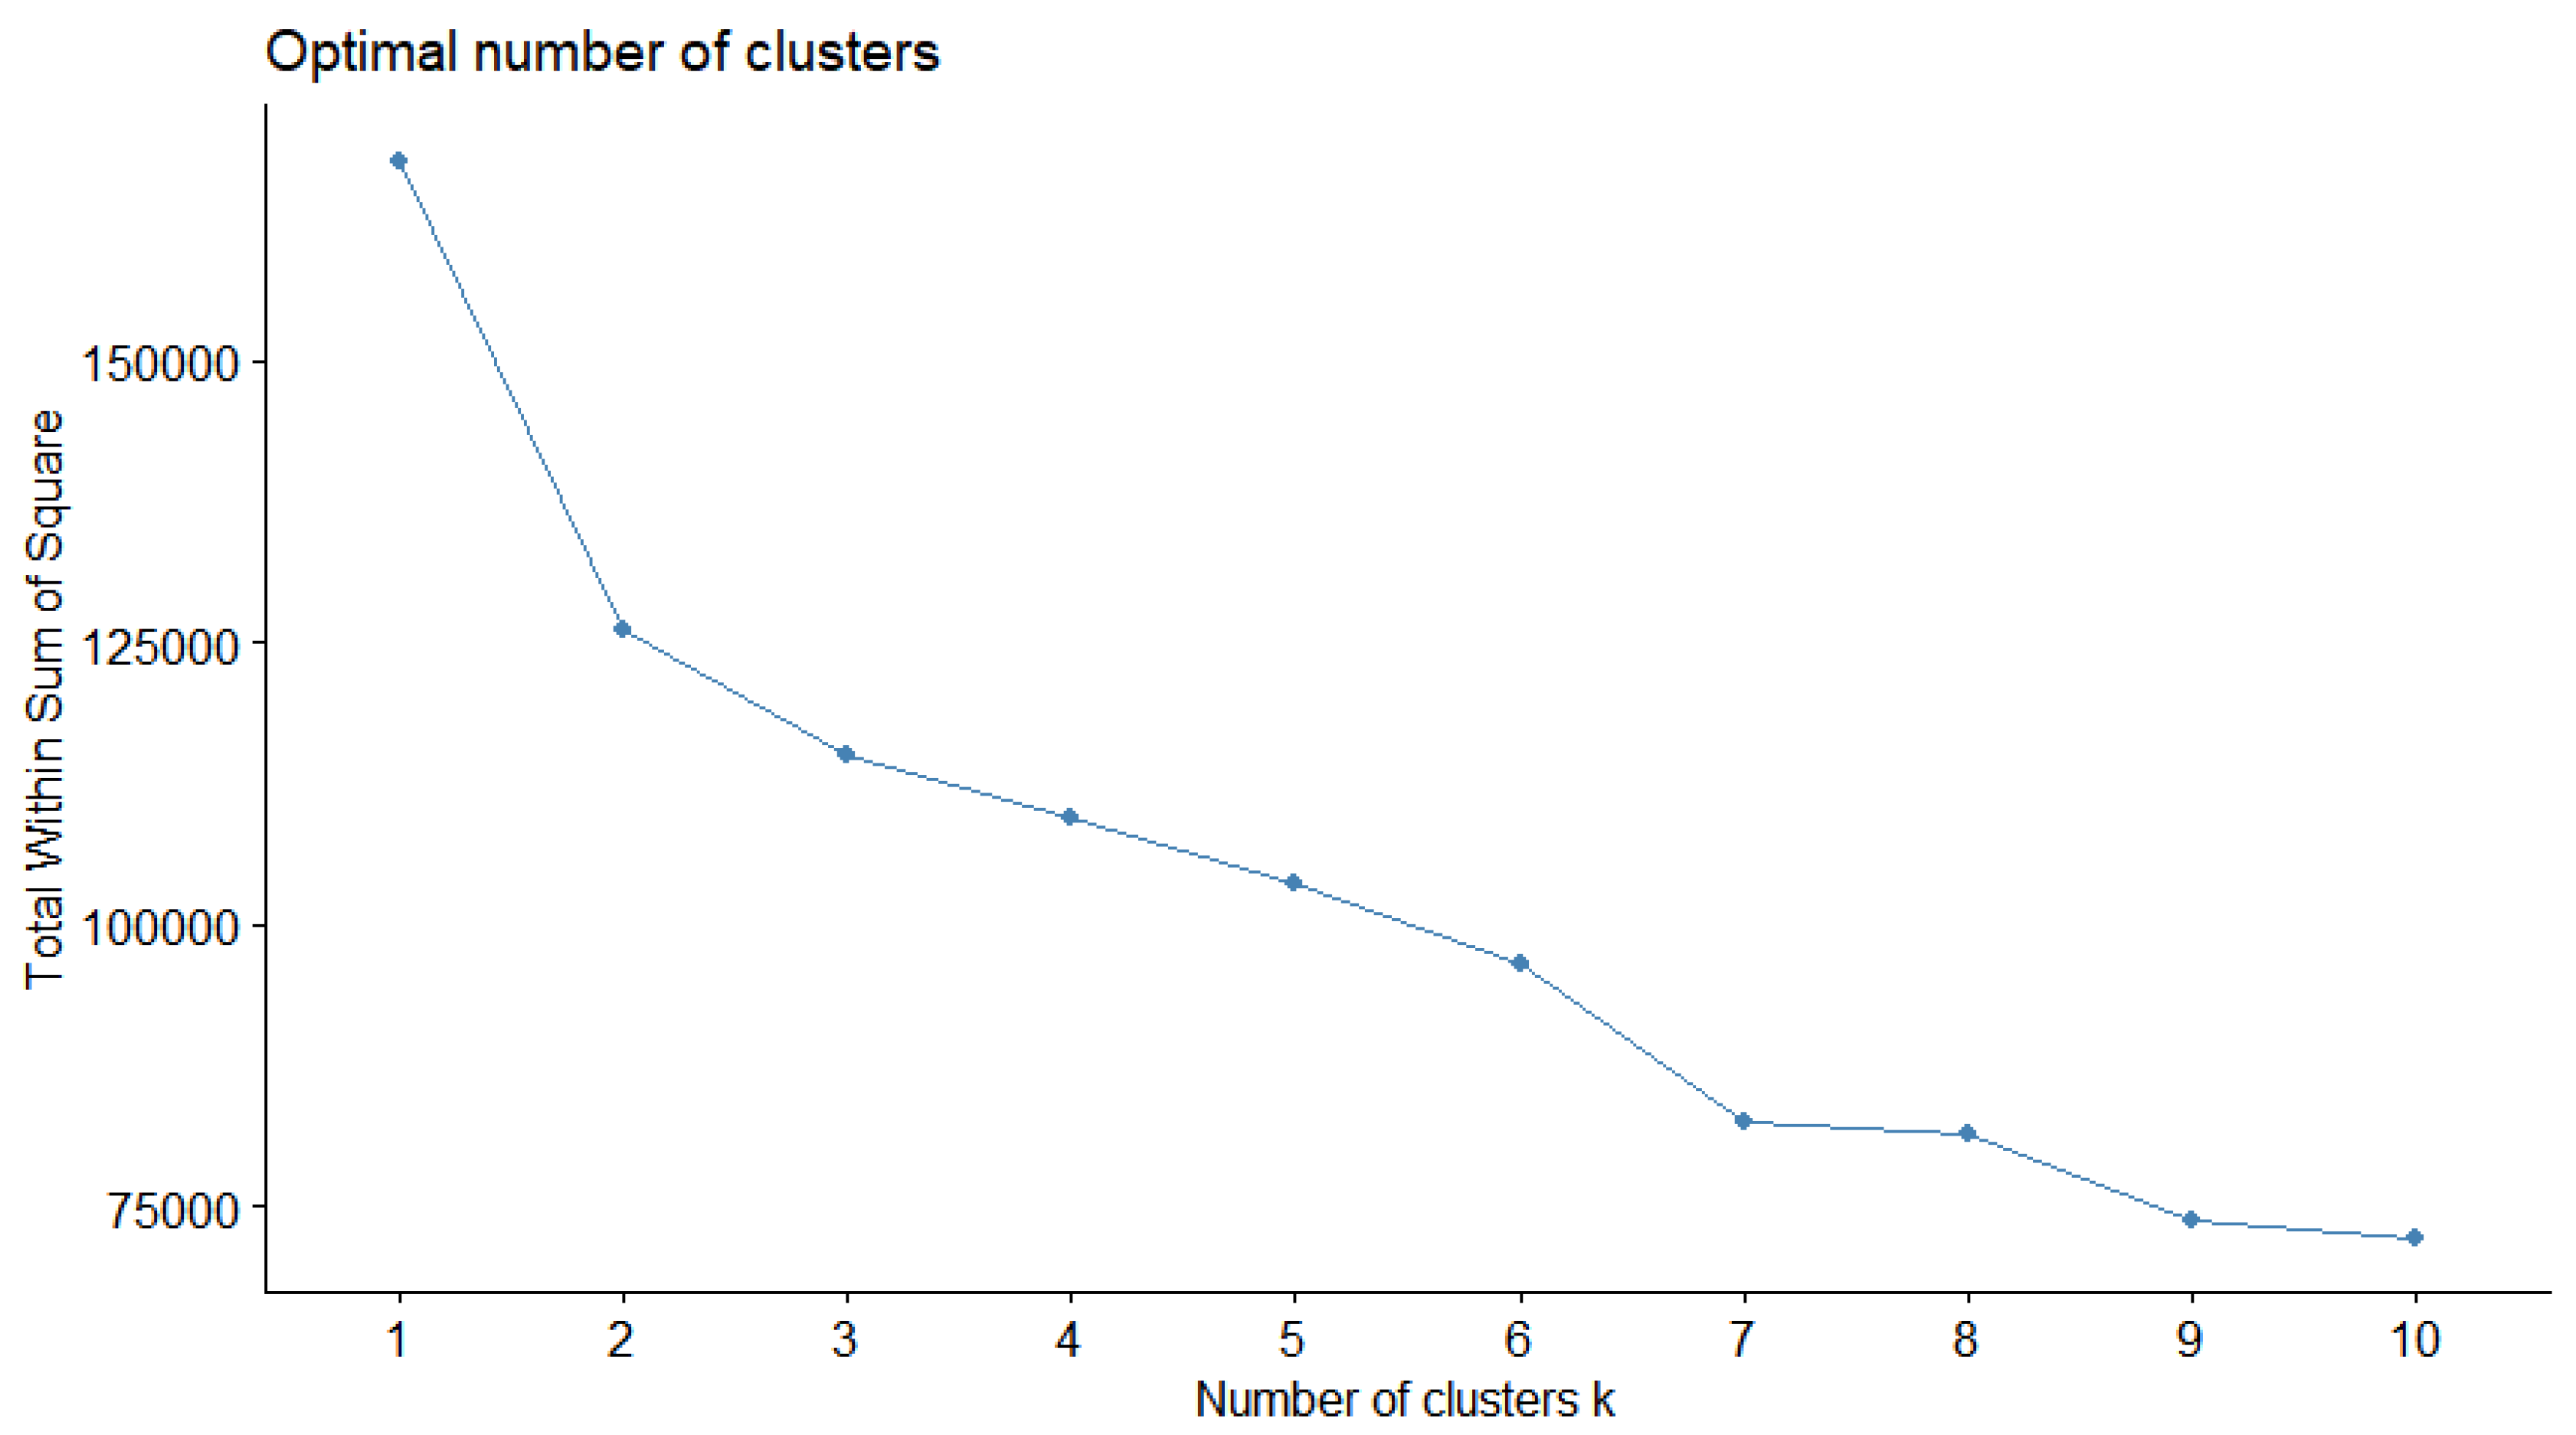
In order to apply the K-means algorithm, a specific number of clusters must be specified. For the purpose of investigating the optimal number of clusters through visualization, the fviz_nbclust function from the factoextra [
30] library of R was used with the “total within sum of square” method. The result of this is presented in
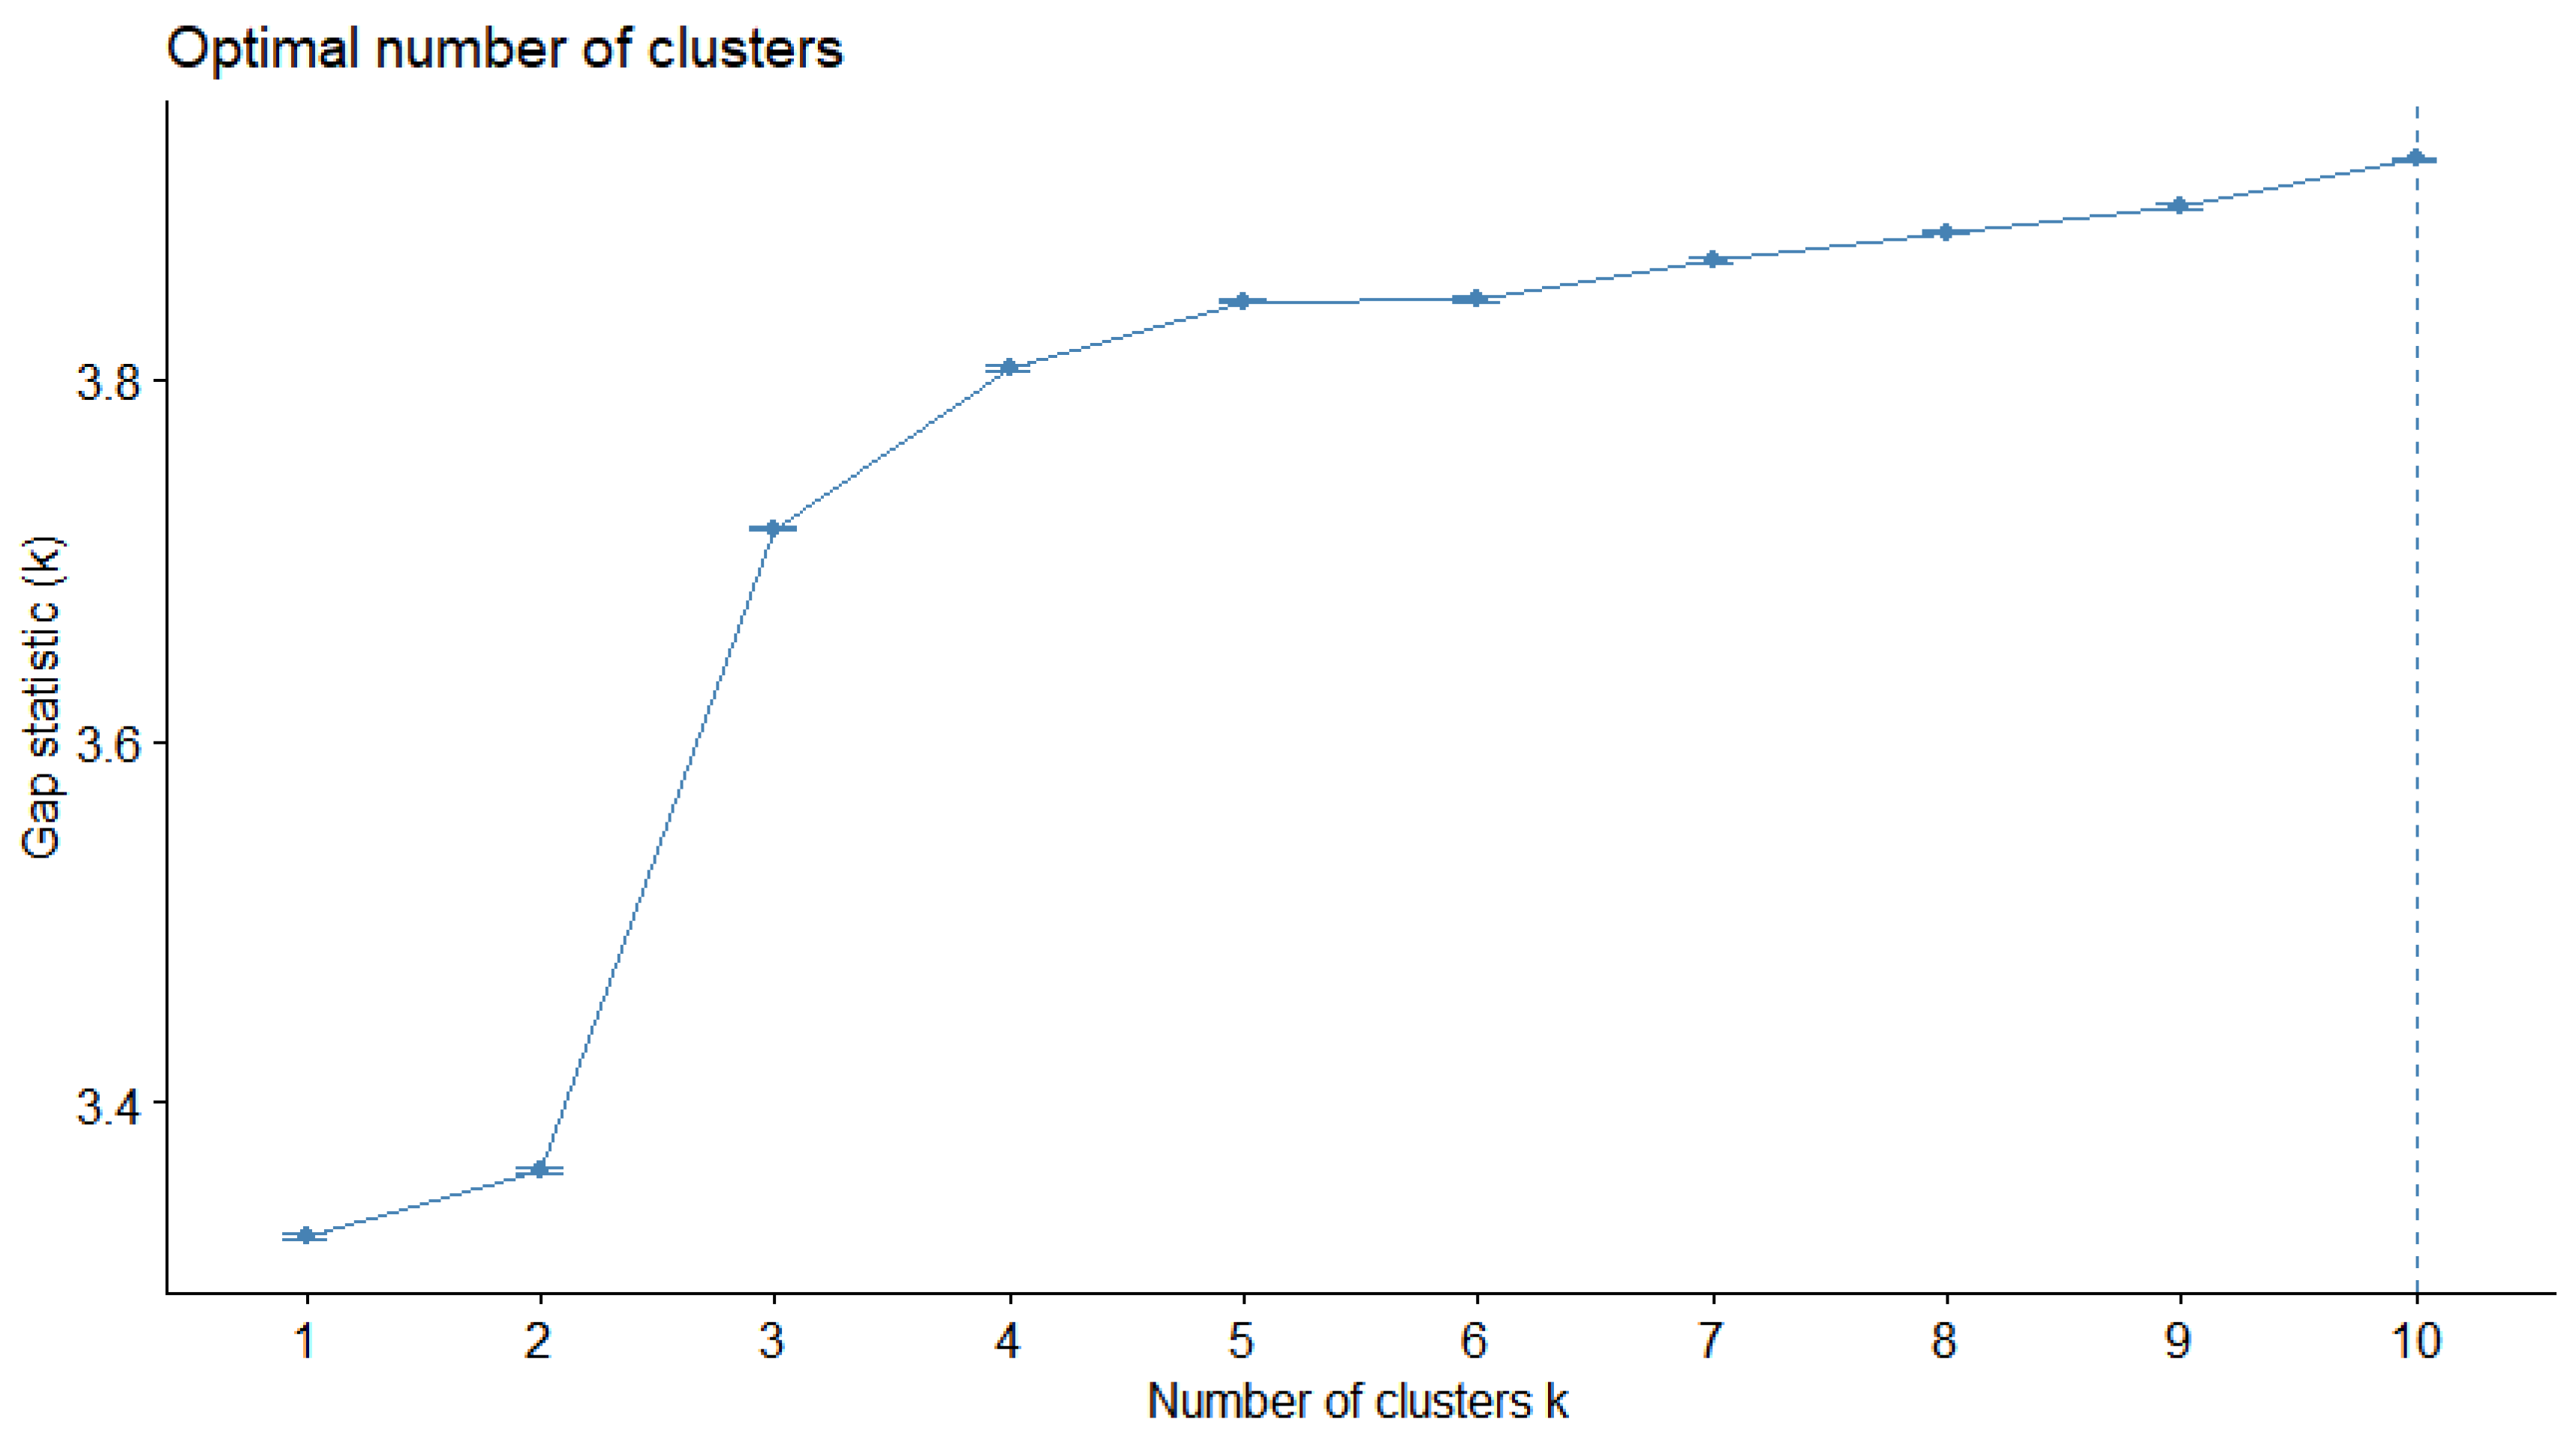
Figure 4. In addition to this, using the clusGap function from the cluster library [
31] and the fviz_gap_stat function [
30], a plot depicting the gap statistic for each number of clusters was created and is presented in
Figure 5. The parameters used for this plot are displayed in
Table 4. A low number of maximum clusters was selected to maintain the classification’s reasoning.
Figure 4 and
Figure 5 are labeled “Optimal number of clusters” because their intention is to help the researchers identify the number of clusters that better suits the nature of the analysis. On the x-axis of both of these figures, the potential number of clusters is displayed.
The Total Within Sum of Squares (TWSS) approach is a statistical technique used in cluster analysis in order to determine the degree of data variability inside a cluster. Each data point’s sum of squared distances from the cluster centroid is calculated. This value is depicted on the y-axis of
Figure 4. By distinguishing dissimilar observations and grouping comparable observations, it is possible to reduce the TWSS. The clustering solution is more effective when the TWSS is lower, because it shows that observations within each cluster are more similar to one another and less comparable to observations in other clusters. The TWSS is frequently combined with other techniques to identify the ideal number of clusters for a particular dataset.
The Gap statistic is a different statistical technique for figuring out how many clusters in a clustering analysis are best. For various values of k (the number of clusters), it compares the overall within-cluster variation to what might be predicted if the data were randomly distributed. The Gap statistic calculates the discrepancy between the observed log intra-cluster distances and the predicted log intra-cluster distances under a null reference distribution. This discrepancy is presented in
Figure 5 on the y-axis. The number of clusters that best separates the observed data structure from the anticipated random structure returns the optimal number of clusters, where k is the value that maximizes the gap statistic.
Taking both
Figure 4 and
Figure 5 into consideration, the optimal number of clusters was chosen to be four. As already pointed out, when performing K-means clustering, an ever-increasing number of clusters produce more and more optimal results, but in this case four clusters were selected as a compromise of having a high enough value in Gap statistic while being in an optimal place in the bend of the “total within sum of square” curve. The results of the K-means analysis for 4 clusters is presented in the results section below.
2.3.2. Investigating Feature Importance through XGBoost
A very good indicator of a successful search session during the usage of the Art Boulevard platform is when a user decides to visit the original listing of a search result in its source repository. This action not only indicates that a user was initially interested in the item but that this initial interest was also confirmed by the content of the result presentation page. Any session that has at least one external source clicked can be arguably determined to be a success.
In order to investigate whether we can predict this success or not, based on the various relevant variables from
Table 2 and
Table 3, we used an extreme radient boosting technique using the XGBoost open-source software library for the R language [
32]. XGBoost is a framework that implements gradient boosting in an efficient and scalable manner [
30] and that can achieve both performance and interoperability by using specific model compression techniques, according to Sagi & Rokach [
33].
XGBoost was selected for the purposes of this study, because it has proven to be both efficient and to perform better than traditional gradient boosting algorithms on many occasions. Additionally, our data set, though significant in size, was not large enough to warrant the use of a faster algorithm, such as LightGBM. Overall, XGBoost is a staple of unsupervised learning methodologies in the field of predictive modeling. It is a popular gradient boosting algorithm that is known for its fast implementation, scalability, and state-of-the-art performance in classification and regression tasks.
XGBoost consists of an ensemble of regression trees, where the prediction score is calculated by adding up the outputs of all the trees. The equation for this can be written as:
where
M is the number of trees and
fm is the output of the mth tree.
In XGBoost, a regularized objective is added to the loss function to improve its performance. The regularized objective for the mth iteration is given by:
where
n is the number of samples,
l is the differentiable loss function that measures the difference between the predicted
and the target
yi, and
Ω is the regularization term. The regularization term is controlled by two constants, γ and λ, and can be written as:
where
T is the number of nodes and
w is the weight of the
kth node.
Using the previous equation, we can rewrite the regularized objective in terms of the loss function’s first and second-order derivatives as:
where
and
are the first- and second-order derivatives of the loss function, respectively.
XGBoost improves the gradient boosting algorithm by using the second-order Taylor expansion for the loss function, which helps the gradient converge more accurately and quickly. The regularization term also helps reduce the model’s complexity and resolve overfitting.
XGBoost can also be used to determine the importance of a feature by using the feature weight, which is calculated as the number of times a feature is used to partition the data across all the trees. The equation for the feature weight is:
where
L is the number of nodes in the mth tree,
L−1 is the number of non-leaf nodes, is the feature corresponding to node
l, and
F is the set of all features, while
I() is the indicator function. The logLoss function is used to evaluate the model’s performance, which measures the penalized log-probability of the model’s predictions. The equation for logLoss is:
where
N is the number of observations,
M is the number of classes,
yij = {0, 1} indicates if observation
i belongs to class
j, and
pij is the respective probability.
In this study, the variable we were trying to predict was a binary variable that was set to 0 when no source repository link was clicked during a session and to 1 when at least one source repository link was clicked during a session. We created a dataset that included this variable alongside feature variables to create the boosting model dataset. The vast majority of the dataset’s variables were numerical variables similarly to our K-means analysis. For the purposes of this gradient boost analysis two categorical variables were used as well, _device which recorded whether a user used a desktop or mobile device during the session and_with_login which recorded whether the user logged into the Art Boulevard platform during the session. Both these categorical variables only have two states; so there is no logical error in converting them into a 2-level factor for the purposes of boosting. Additionally, some numerical variables that were very closely related to each other were excluded in order to make the process of discussing and drawing conclusions easier by focusing on fewer factors. This included the _distance variable which was closely related to the _scroll variable and the total_events, _ct_events, and _result variables, which were closely related, both with each other and with the target variable.
In an effort to achieve a more spherical and inclusive approach, as many variables as possible were used for the prediction model instead of focusing on selecting a few limited numbers of variables based on empirical knowledge or preexisting literature. This ensured that all aspects of user behavior where taken into account, even if not relevant at first glance. Based on the findings presented below, the methodology may be repeated with fewer, most important variables in future works in order to refine this result.
In total the predictor variables were as follows:
_device, which was set to 1 if a user used a desktop and 0 if they used a mobile device;
_duration, which measured the total duration of a search session in seconds;
_scroll, which measures the distance that the device screen was scrolled in pixels;
_with_login, which was set to 1 if a user logged into the Art Boulevard platform during the session and 0 if they didn’t;
_query, which measured the number of search queries performed;
_user, which measured the number of user public profiles viewed;
_related_r, which measured the number of clicked related results from a result’s presentation page;
_home_r, which measured the number of clicked results from the front page;
_direct_r, which measured the number of results’ presentation pages viewed directly by navigating to them from an external link;
_related_q, which measured the number of terms clicked on a result’s presentation page;
_vs_events, which measured the total number of actions related to the visual search functionality;
_voice_events, which measured the total number of actions related to the speech recognition/synthesis functionality;
_user events, which measured the total number of actions related to the user system functionality.
Firstly, the dataset was split into two parts with 80% of the sessions being assigned to the training dataset and 20% to the testing dataset. Afterwards, the two datasets were transformed into data matrices, since in the R language the XGBoost library [
32] uses matrix data as its input. The model was then fitted using the parameters displayed in
Table 5. Since the dataset wasn’t particularly large, the number of rounds was initially set to 50. After a first training and testing session and based on the test root mean squared error (RMSE) values, an increase of the test RMSE was noted after 13 rounds. This meant that with 50 rounds the model was being overfitted. Hence, we used an n rounds value of 13 in order to achieve a more proper fit. A max.depth value of 4 was selected in order to optimize accuracy, especially on the success condition of the target variable, which was encountered in many fewer sessions. The feature importance chart, alongside a confusion matrix and statistics regarding the prediction model is presented in the results section.
2.3.3. Thematic Analysis of Clicked Results through Topic Modeling
When a user clicks on a listed result, whether it is listed on a query’s results page or in the related results of a result’s presentation page or in the random results section of the front page, it is a clear indication that this result has intrigued them. In order to gain a better understanding of the various themes that draw the attention of the searchers, we proceeded to perform topic modeling on the textual information of these clicked results.
Specifically, the Latent Dirichlet Allocation (LDA) generative statistical model was used in order to discover topics in a collection of documents consisting of one document for every unique clicked result. Blei et al. introduced LDA as a model for the purposes of machine learning in 2003 [
34], and it has been a staple in topic discovery problems in natural language processing ever since. LDA a widely-used method for text mining [
35] and was selected for the purposes of this study because of its ability to provide topic modeling through an unsupervised process, thus generating the topics based solely on the collected data and not on human preconceptions. LDA’s bag-of-words approach [
34] can provide us with good results, especially since, as we discuss below, the textual content that comprises each LDA document, is a collection of terms derived from the result’s metadata. Finally, the findings derived from LDA can function as the basis for comparison against other methodologies, such as hierarchical latent tree analysis, in the future.
The LDA method models each item in a collection as a finite mixture across a set of underlying topics, and each topic is modeled as an infinite mixture over a collection of topic probabilities. This approach allows for an explicit representation of a document within the context of text modeling. The de Finetti’s representation theorem is utilized to implement LDA, based on a simple exchangeability assumption for the words and themes within a document. According to de Finetti’s theorem, the probability of a sequence of words and topics must have the following form:
Our research employed LDA as a probabilistic method to automatically discover underlying topics in texts, represented by word distributions. This allowed us to view texts as a distribution across topics, with words represented as a vector of topic contributions. In the case of this study, the content of each document consisted of the title of a result; its textual description; the names of its artists, authors, or other creators; any temporal or spatial characteristics of the item as provided by the item’s original repository (e.g., time of creation or location); any methods, techniques, or subjects related to the item; and finally, its rights and provenance-related information.
In order to create an appropriate corpus of documents for the application of the LDA model, this textual content underwent some alterations. Firstly, it was converted to lowercase letters only to avoid inconsistencies presented by natural written word capitalization. Afterwards, a series of common English language words were removed from each document. These words, often referred to as “stop words”, are commonplace in every written English text, and they conveyed very little meaning for the purposes of this task. Additionally, in an effort to focus the topic modeling away from the specific repositories that provided each result, words contained in the names of the repositories were also excluded (e.g., metropolitan, museum, Harvard etc.). In sequence, punctuation, numbers, and empty spaces were also removed from the documents and the document language was set to English.
It is commonplace in such endeavors to omit words with very low frequency from the corpus’s term matrix in order to increase performance, but since the number of documents was not very high, it was decided that all terms should remain in the term matrix, regardless of frequency of appearance.
As in the K-means method, the number of topics during LDA modeling must be provided to the algorithm. The optimal number of topics was investigated using the ldatuning function from the R language’s ldatuning library [
36]. This function integrates and executes the methodologies presented by Griffiths & Steyvers [
37], Cao Juan et al. [
38], Arun et al. [
39], and Deveaud et al. [
40], and when applied to a max number of 20 topics produced the chart shown in
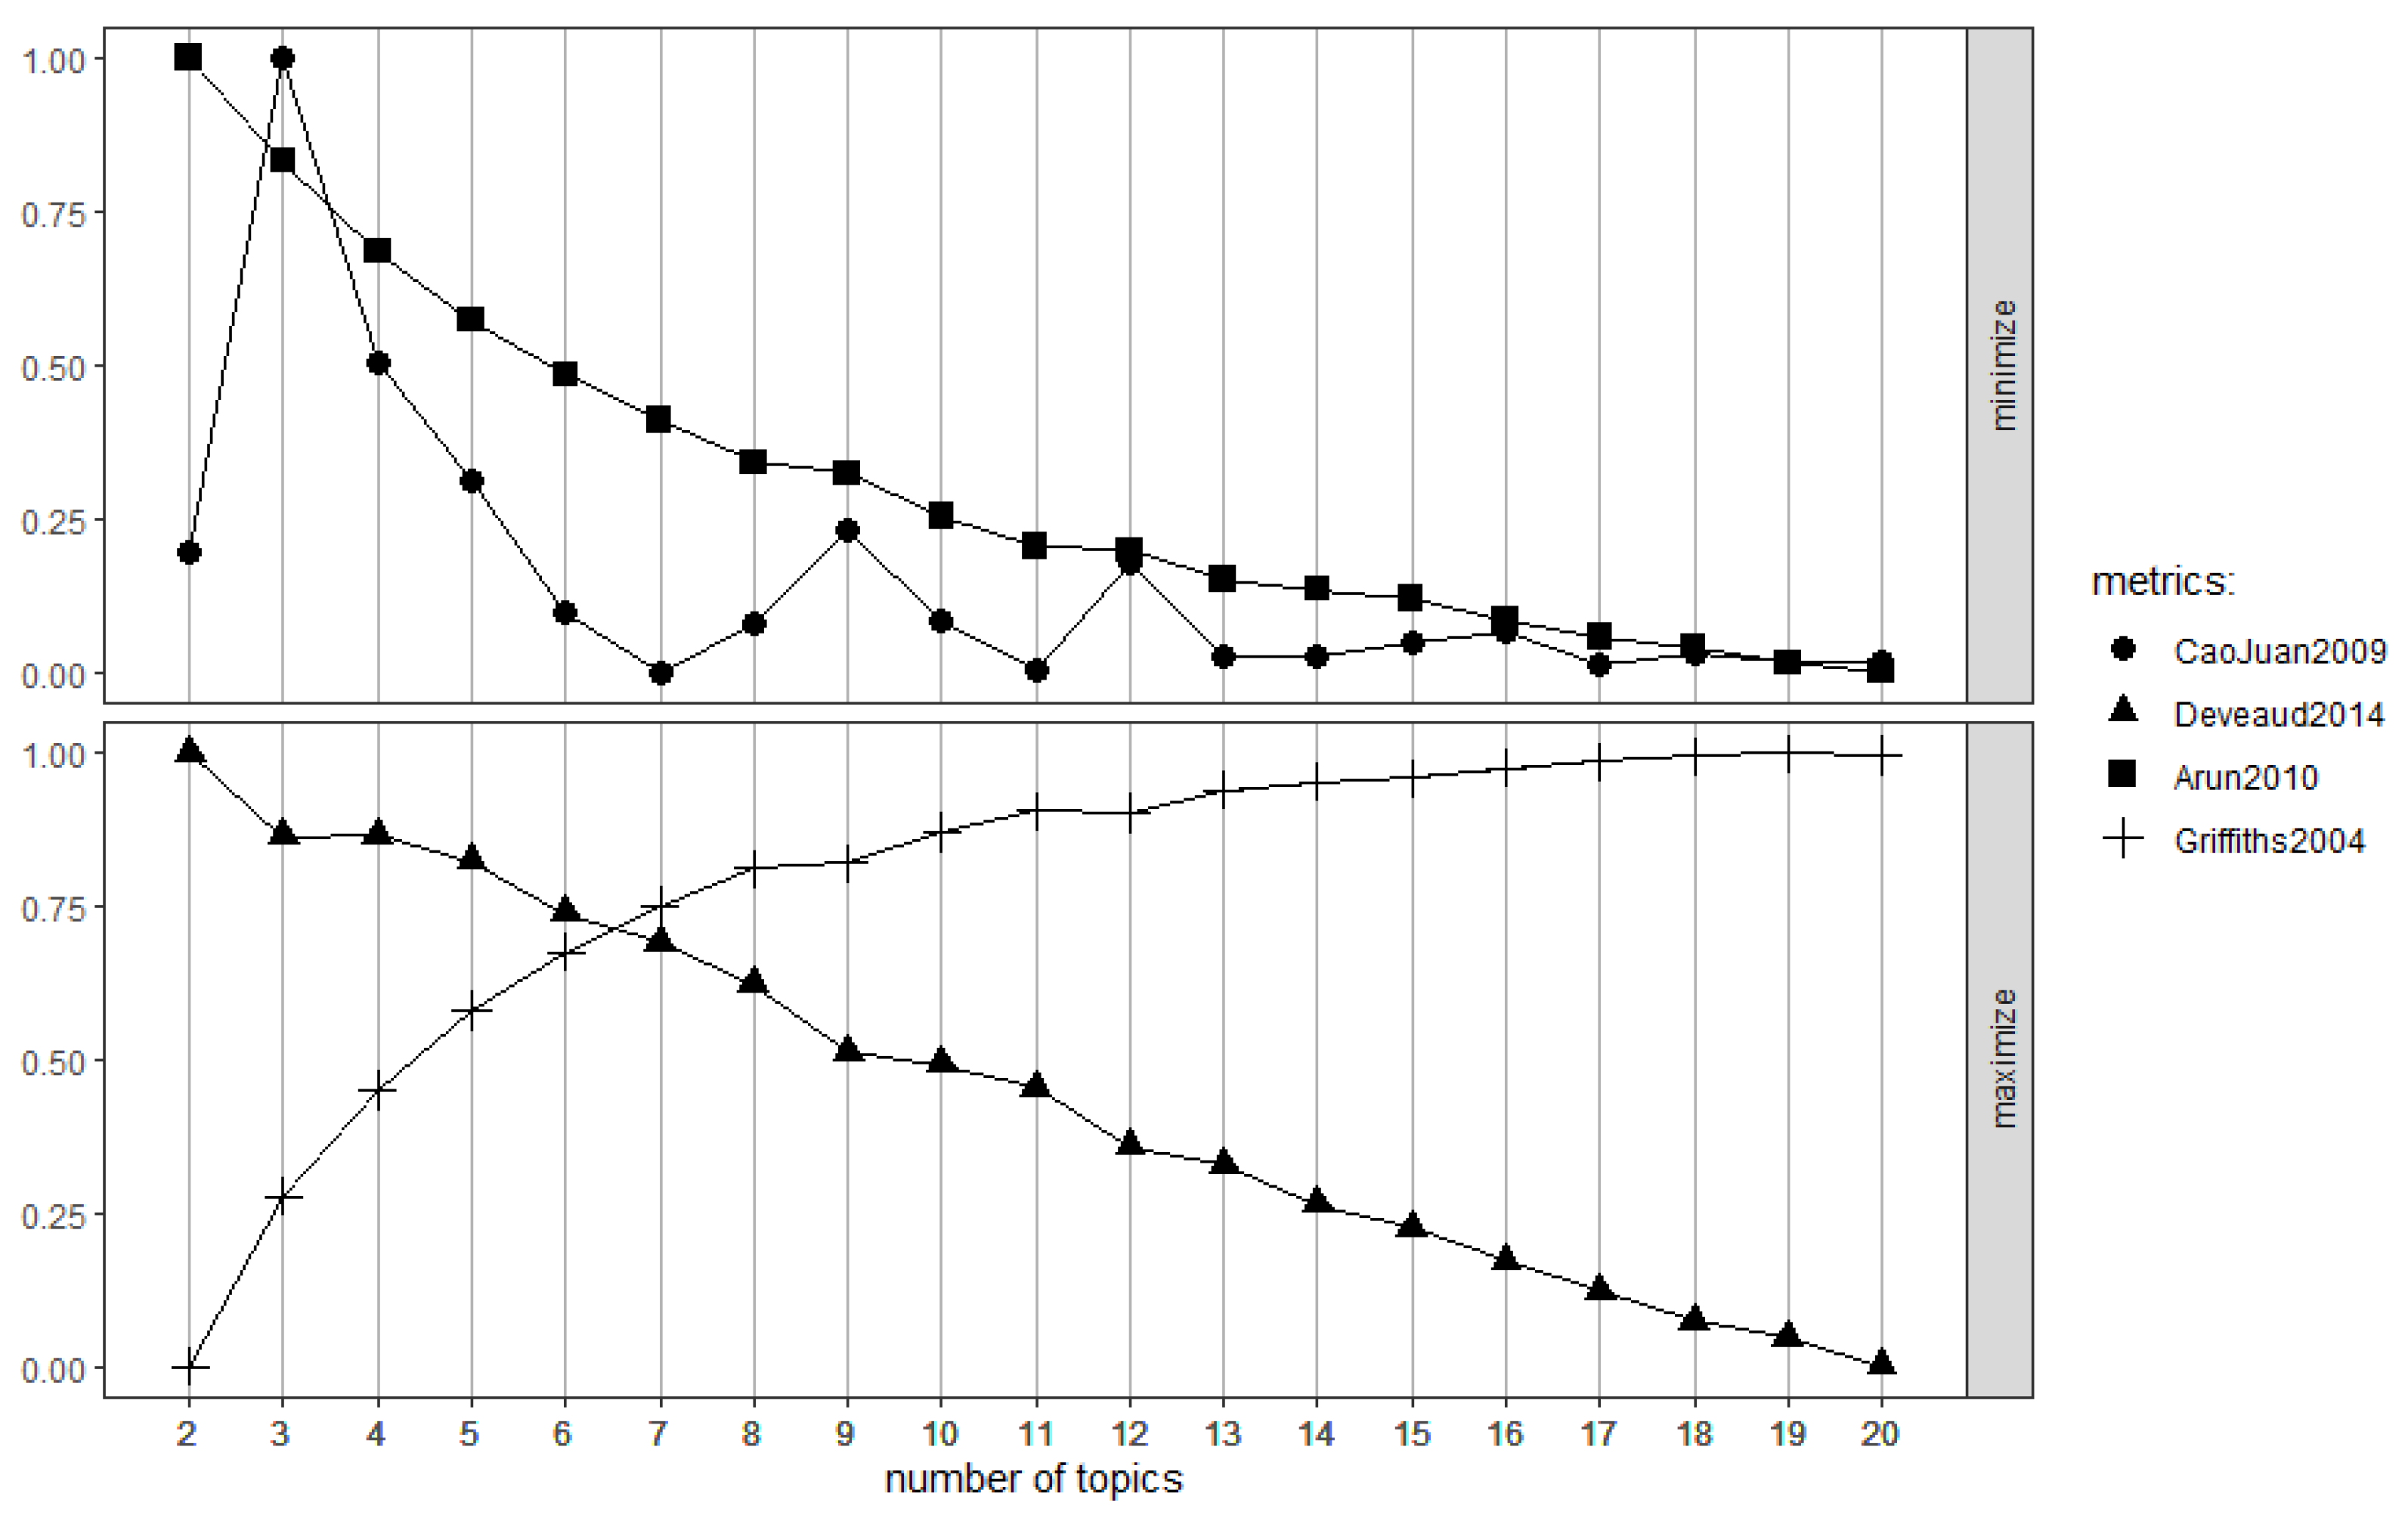
Figure 6.
Figure 6 consists of two charts depicting four metrics calculated by the methods thoroughly presented in the methodology sections of the above-cited references for an increasing number of potential topics. These charts can be used to visually decide the optimal number of topics for the LDA method. The top chart includes metrics derived by the algorithms CaoJuan2009 and Arun2010, while the bottom chart depicts metrics derived from the algorithms Devaud2014 and Griffiths2004. The value of each metric ranges from 0 to 1 and is presented on the y-axis, while on the x-axis the potential number of topics selected for the LDA method is provided. For algorithms CaoJuan2009 and Arun2010, a lesser value indicates a more optimal number of topics. In order to discover the optimal number of topics, the value provided by these algorithms should be minimized. On the other hand, for the algorithms Devaud2014 and Griffiths2004, a higher value indicates a more optimal number of topics. This means that in order to find the optimal number of topics, the value provided by these algorithms must be maximized. Using the charts of
Figure 6 and aiming for a point where CaoJuan2009 and Arun2010 metrics are low and Devaud2014 and Griffiths2004 metrics are high, but make sense in the context of the intended use of the LDA method, one can determine the optimal number of clusters.
From the CaoJuan2009 and Arun2010 algorithms there are several good numbers after six (7, 11, 13+), while at the same time from the Devaud2014 and Griffiths2004 algorithms a good cross section between the two plot-lines also appears near seven. Considering as well the fact that it is a number which suits our needs for a limited number of thematic categories, seven different topics were selected for our LDA model fitting.
Table 6 presents the parameters selected for the LDA model fit, which was accomplished through the use of the LDA library of the R language [
41]. The Gibbs sampling method was selected for fitting. The topics and their terms and intertopic distance map are detailed in the results section below.
3. Results
3.1. K-Means Clustering
After fitting the model as thoroughly detailed in
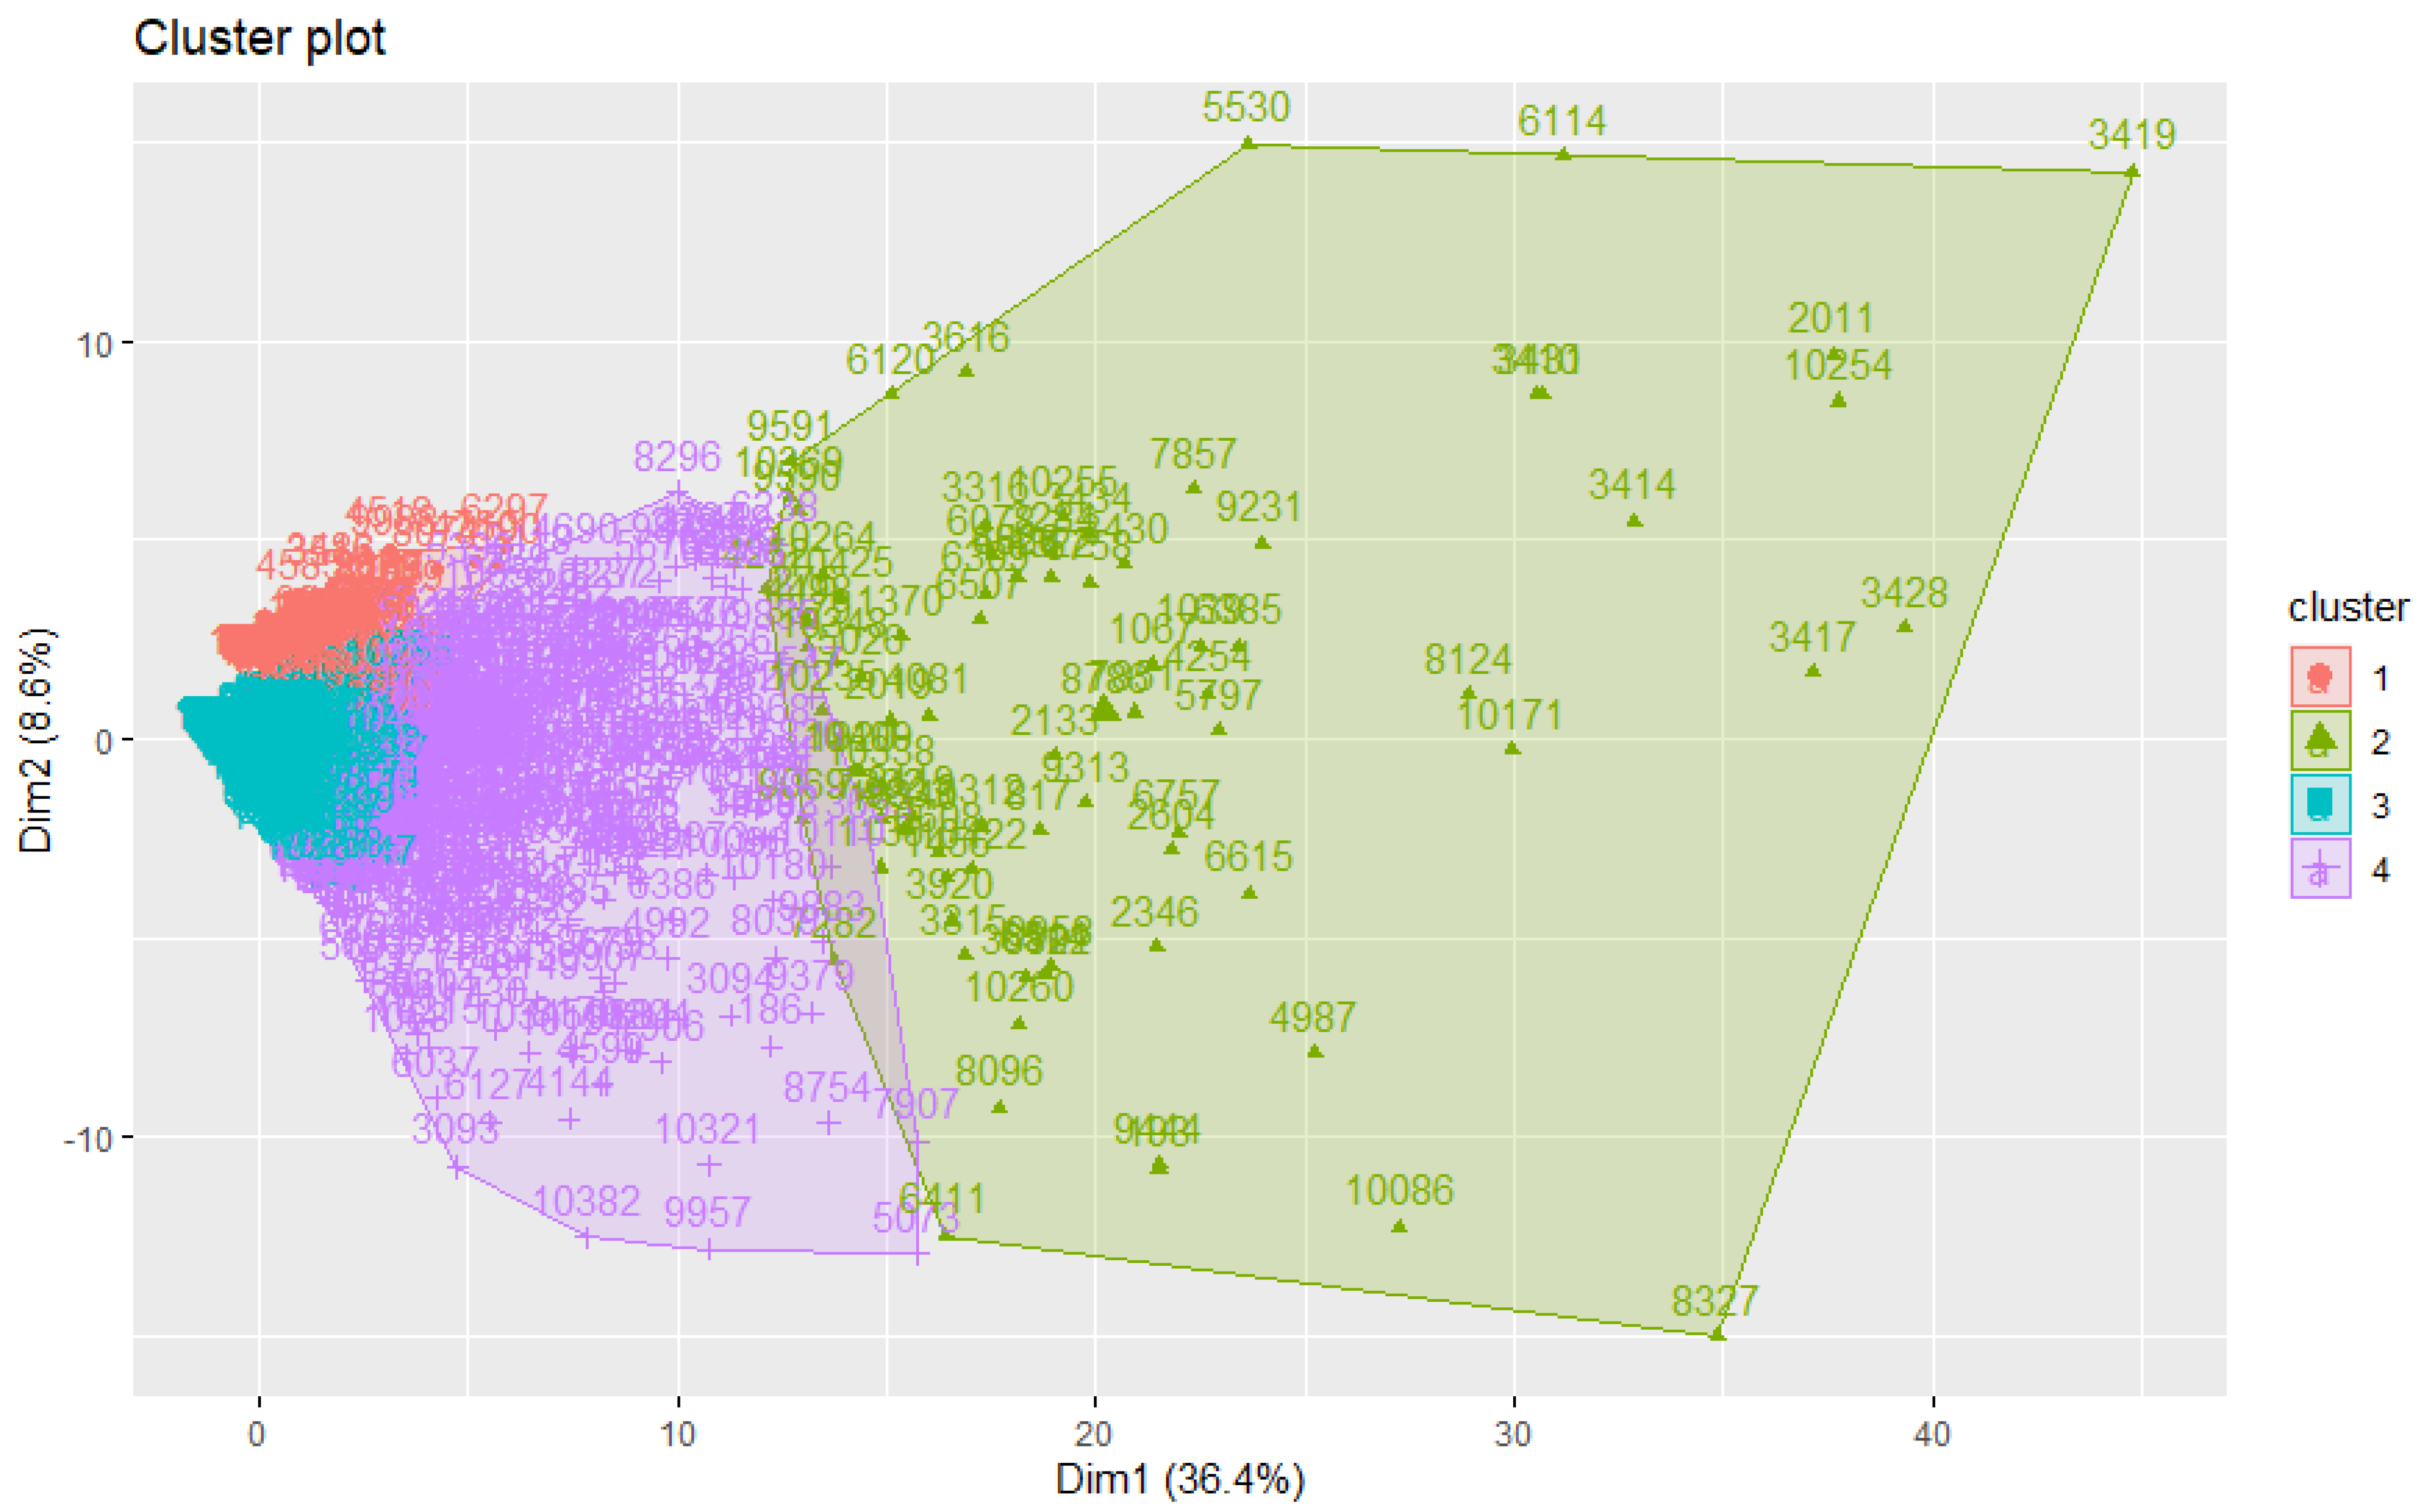
Section 2.3.1, the K-means method was used to cluster the search sessions into four clusters of sizes 1939, 85, 8072, and 394. The ratio of the between-cluster sum of squares divided by the total sum of squares was 38.8%.
Table 7 presents the means of each variable for every cluster using the original values (without scaling).
Figure 7 presents a visualization depicting the four clusters and their relative topography using four distinct colors.
3.2. XGBoost and Feature Importance
After fitting the XGBoost model as described in
Section 2.3.2, a confusion matrix was created in order to evaluate the model’s prediction accuracy.
Table 8 presents the actual confusion matrix, while
Table 9 presents the statistics of the prediction model. It is made clear that due to the nature of the target variable, the model is unbalanced. Even so, accuracy, as well as positive and negative prediction values are all well above the baseline.
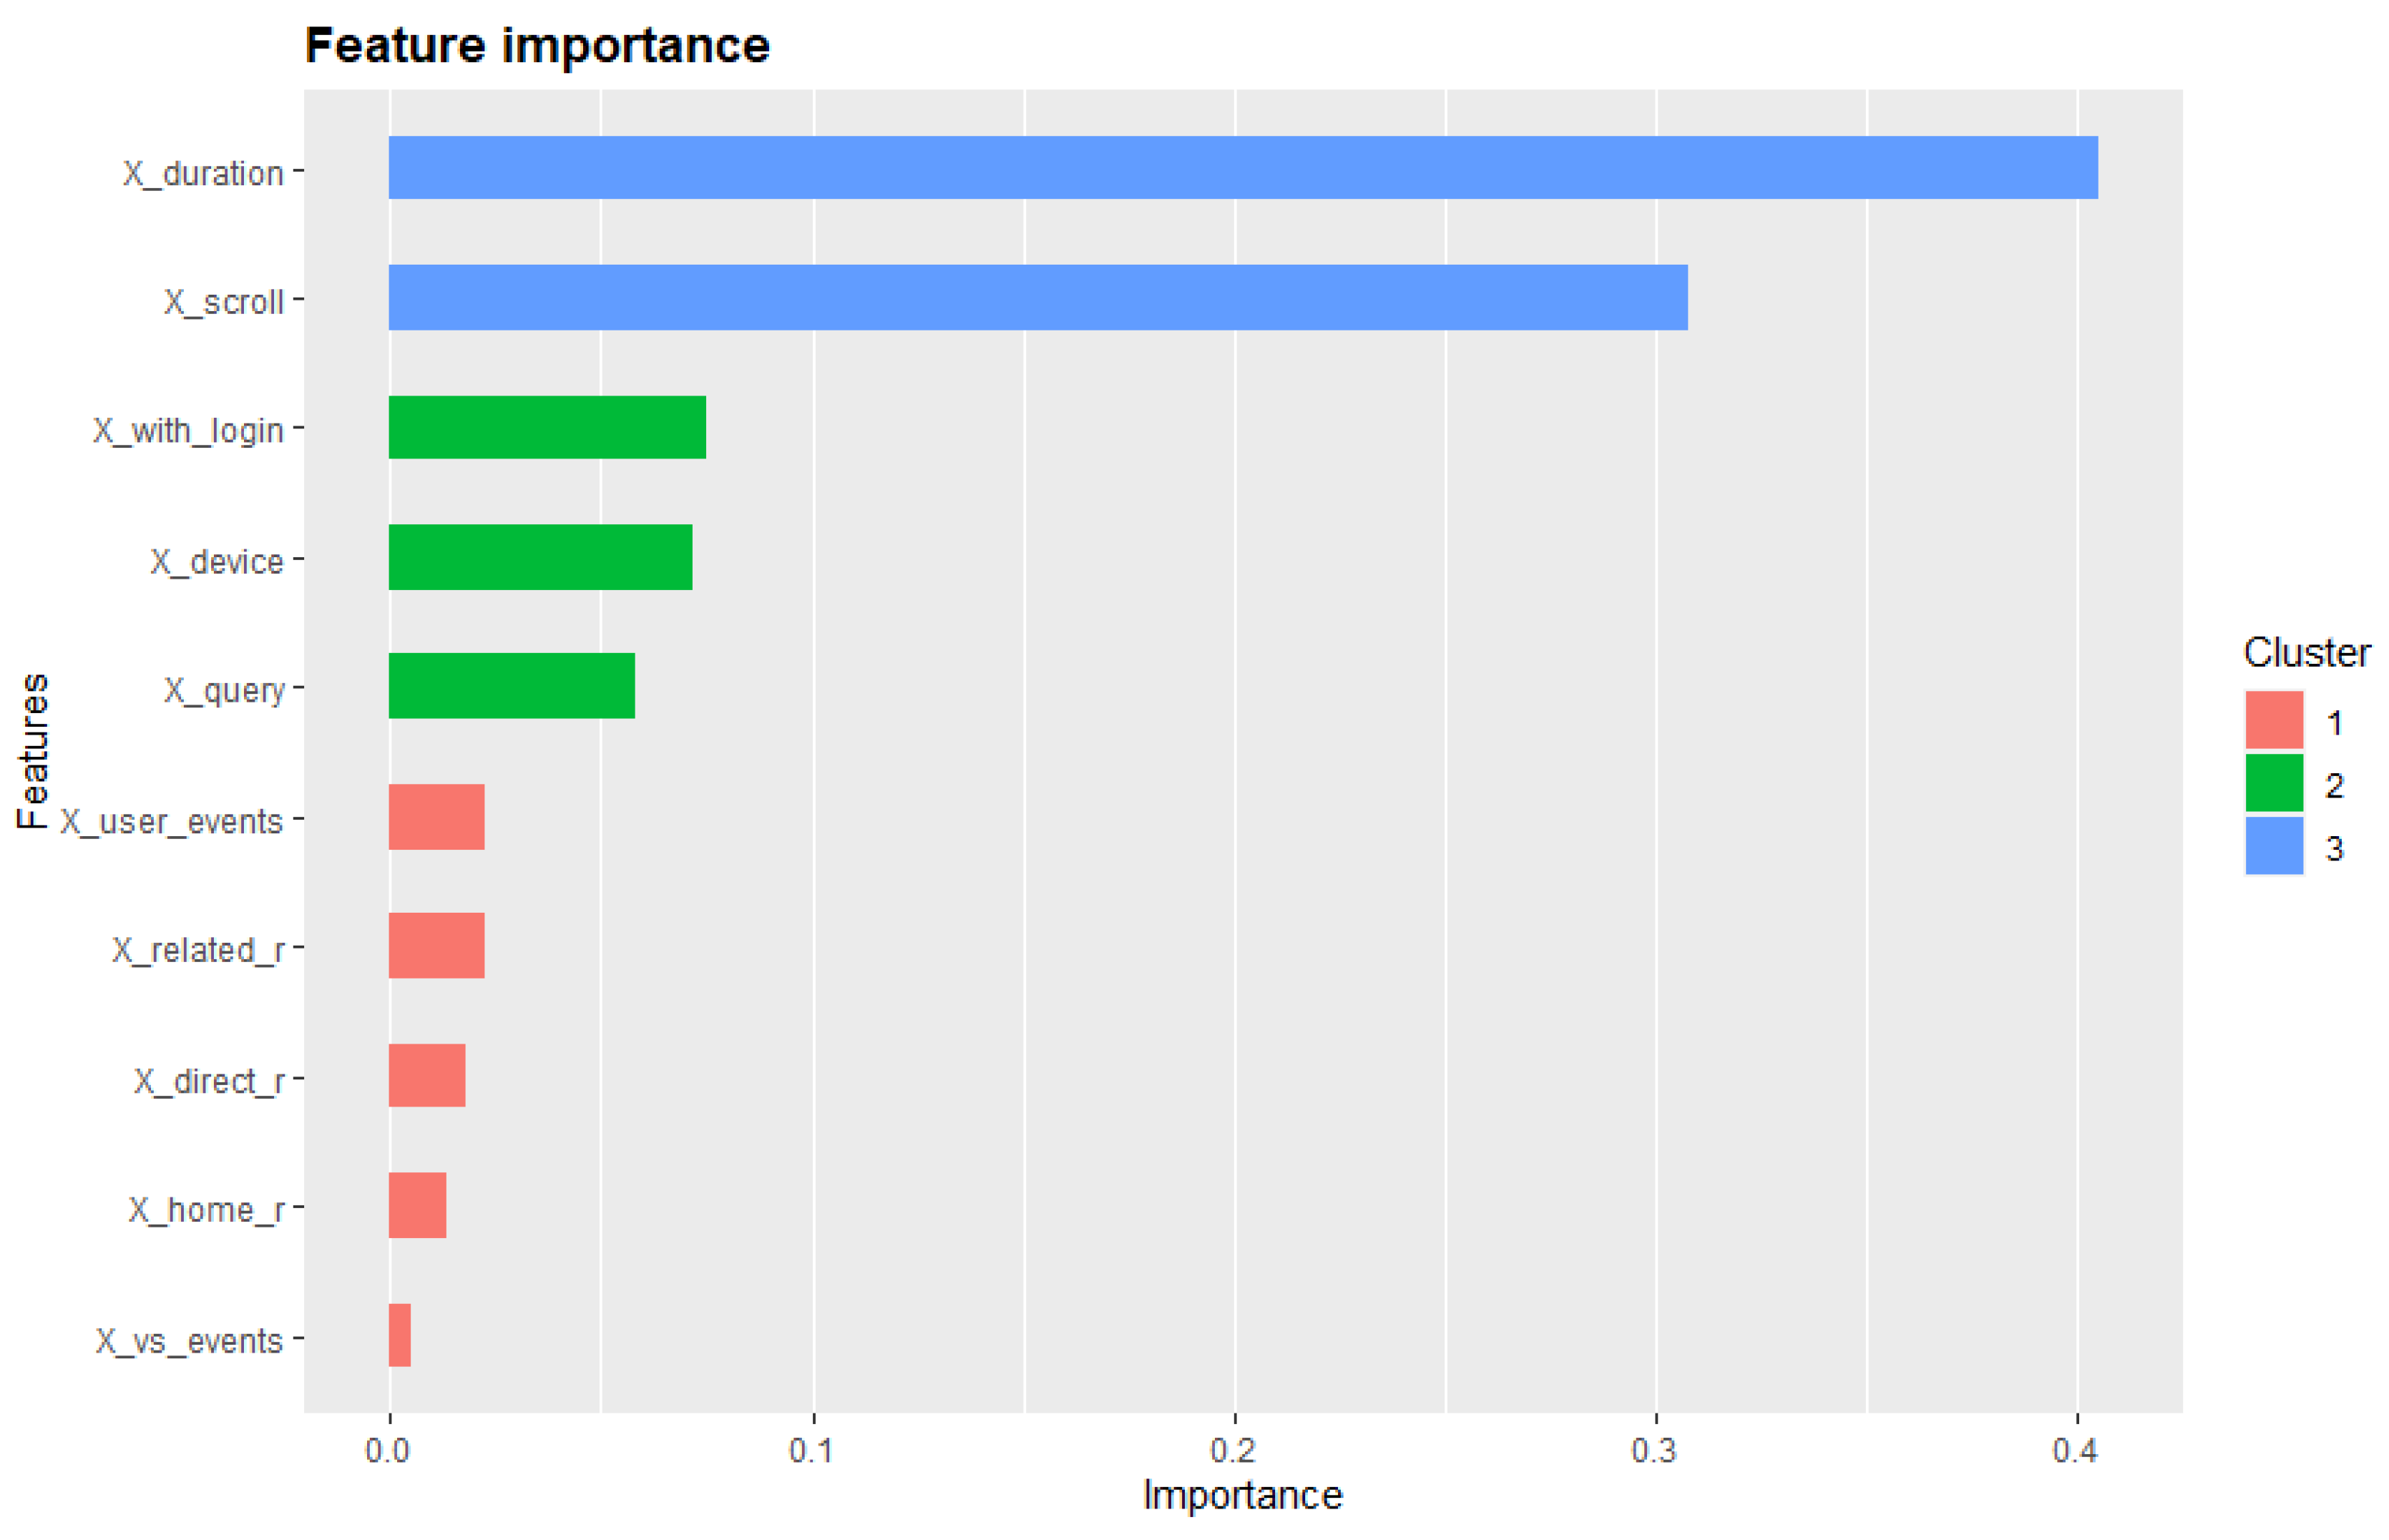
In order to assess the importance of each feature of this prediction, an importance matrix featuring the 10 most important features was generated and is presented in
Table 10.
Figure 8 displays a visualization of feature importance based on the generated importance matrix.
3.3. Topic Modeling with LDA
After fitting the model as described in detail in
Section 2.3.3, the R language’s LDAvis package [
42] was used to create a visualization of the topic model for results from the Art Boulevard platform that were clicked by the users.
Figure 9 presents the Intertopic Distance Map of the seven topics created through means of multidimensional scaling.
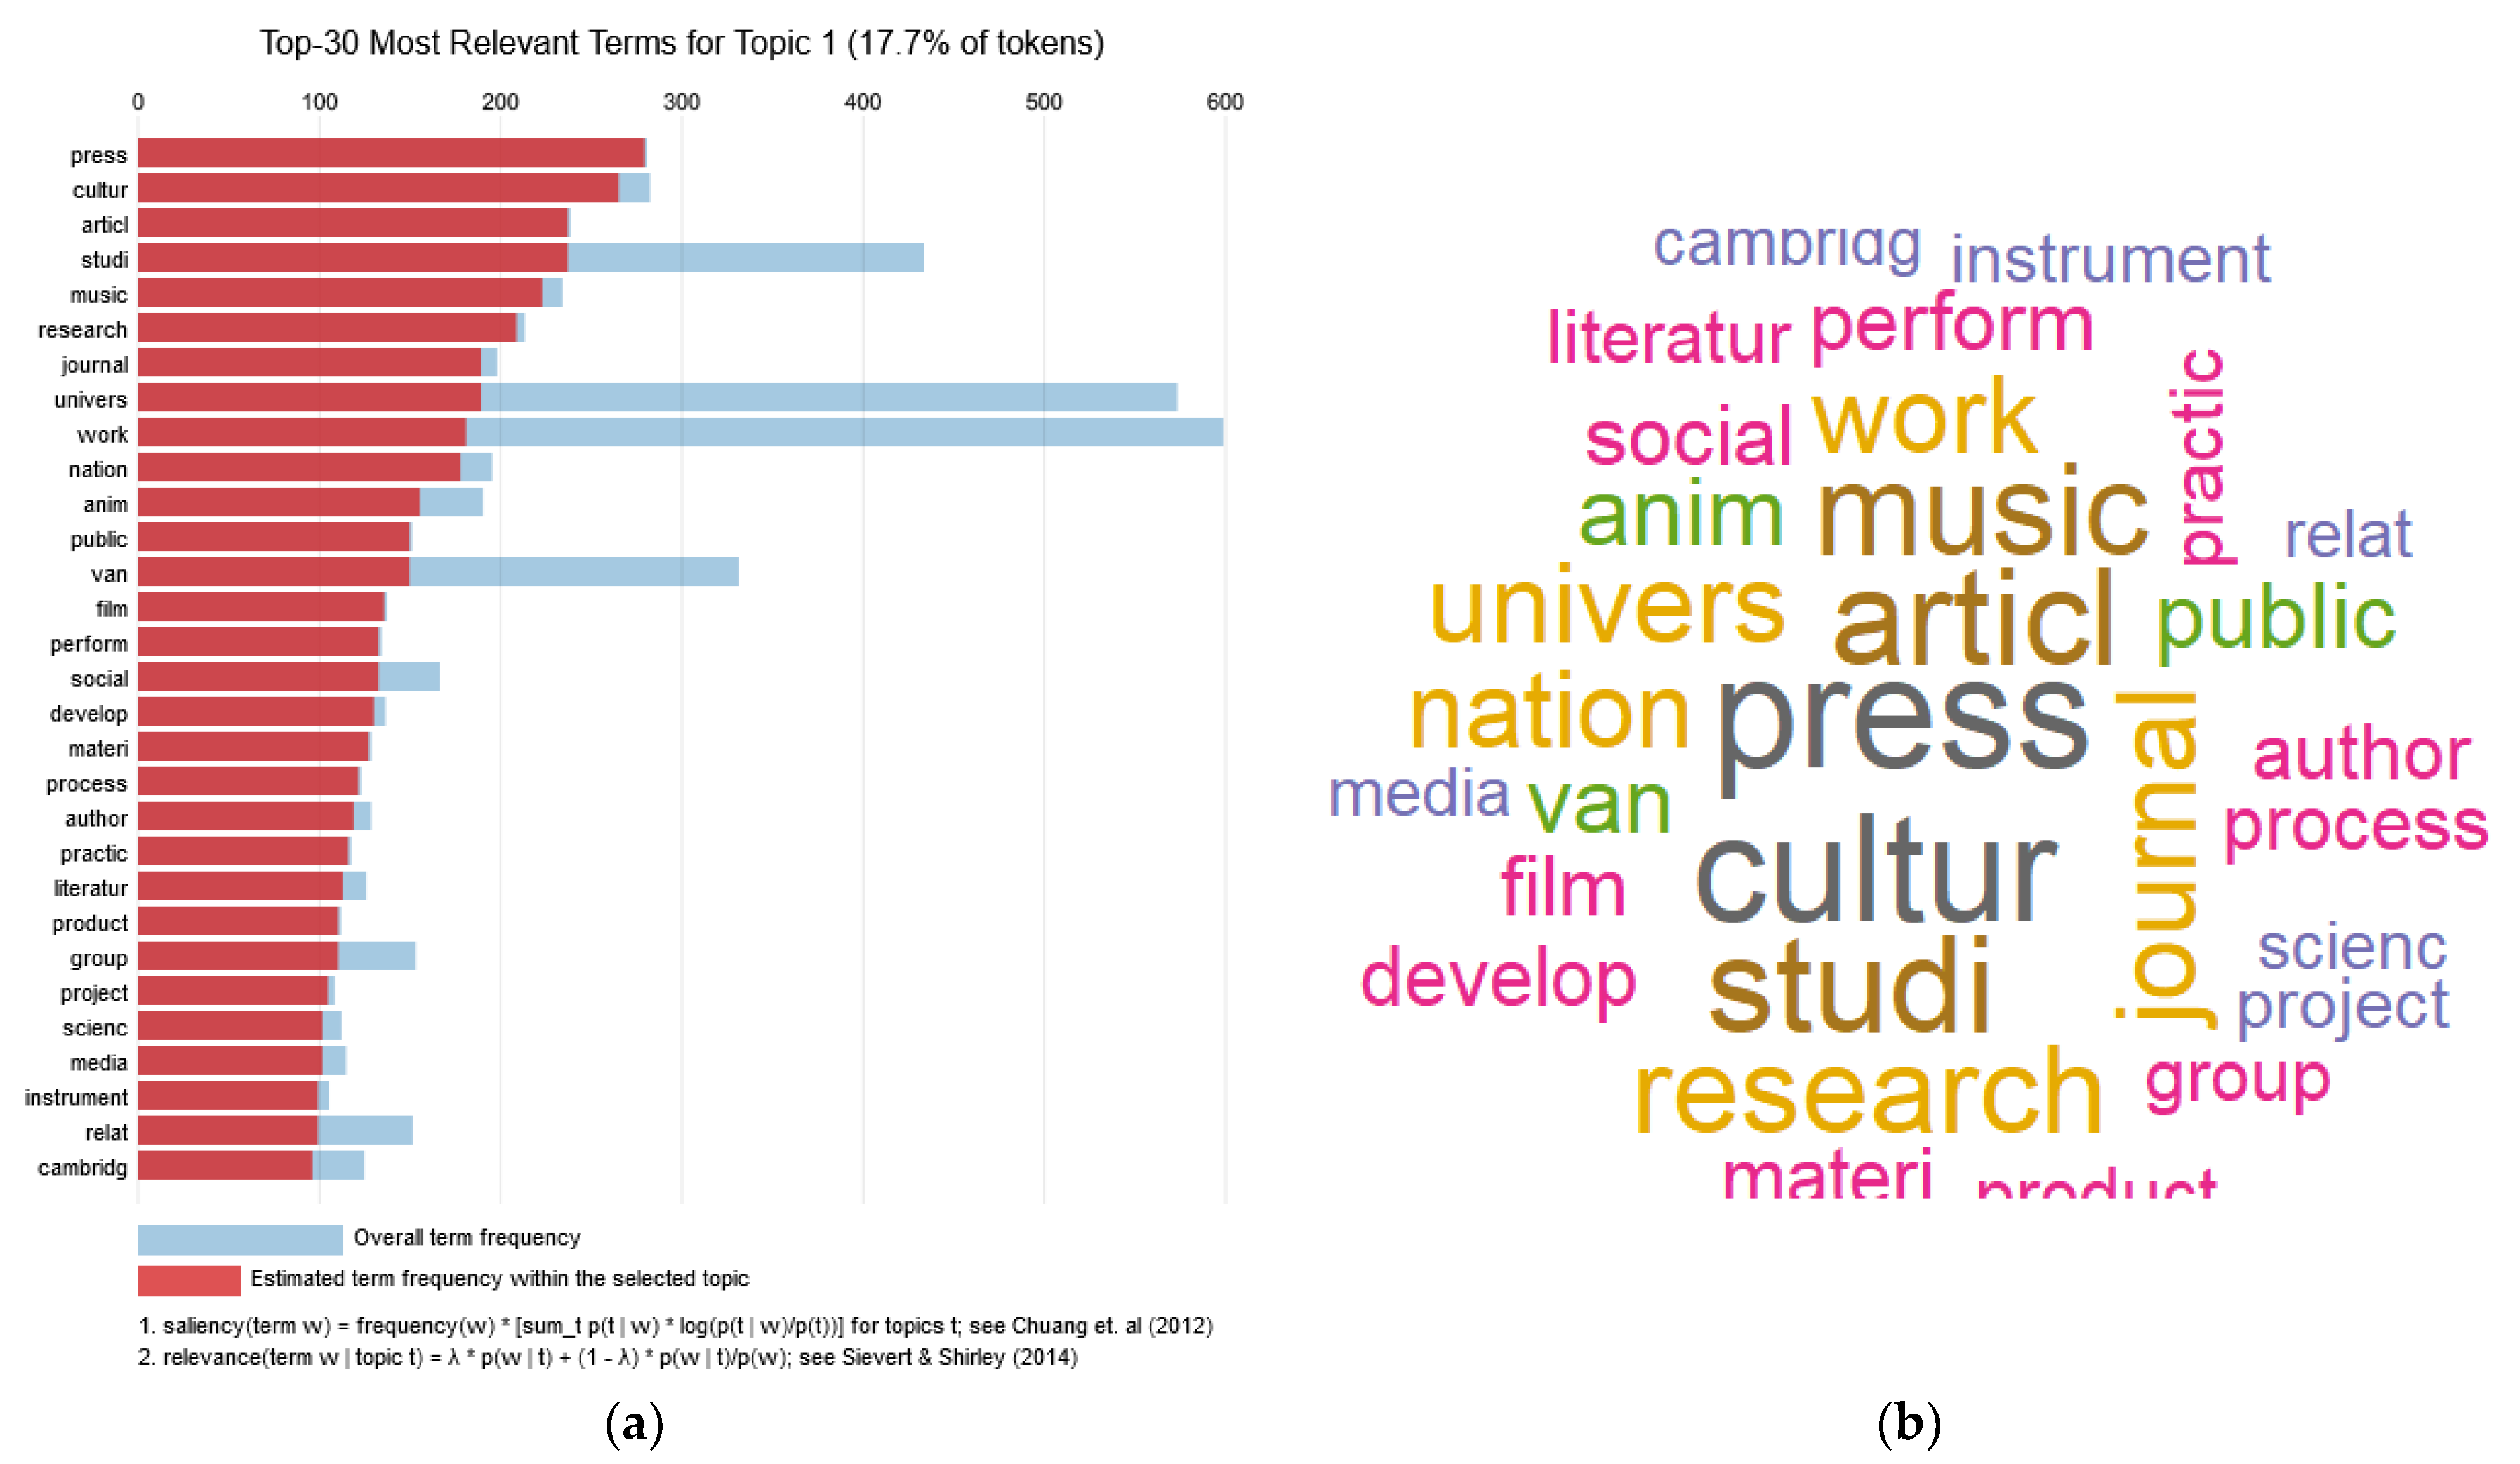
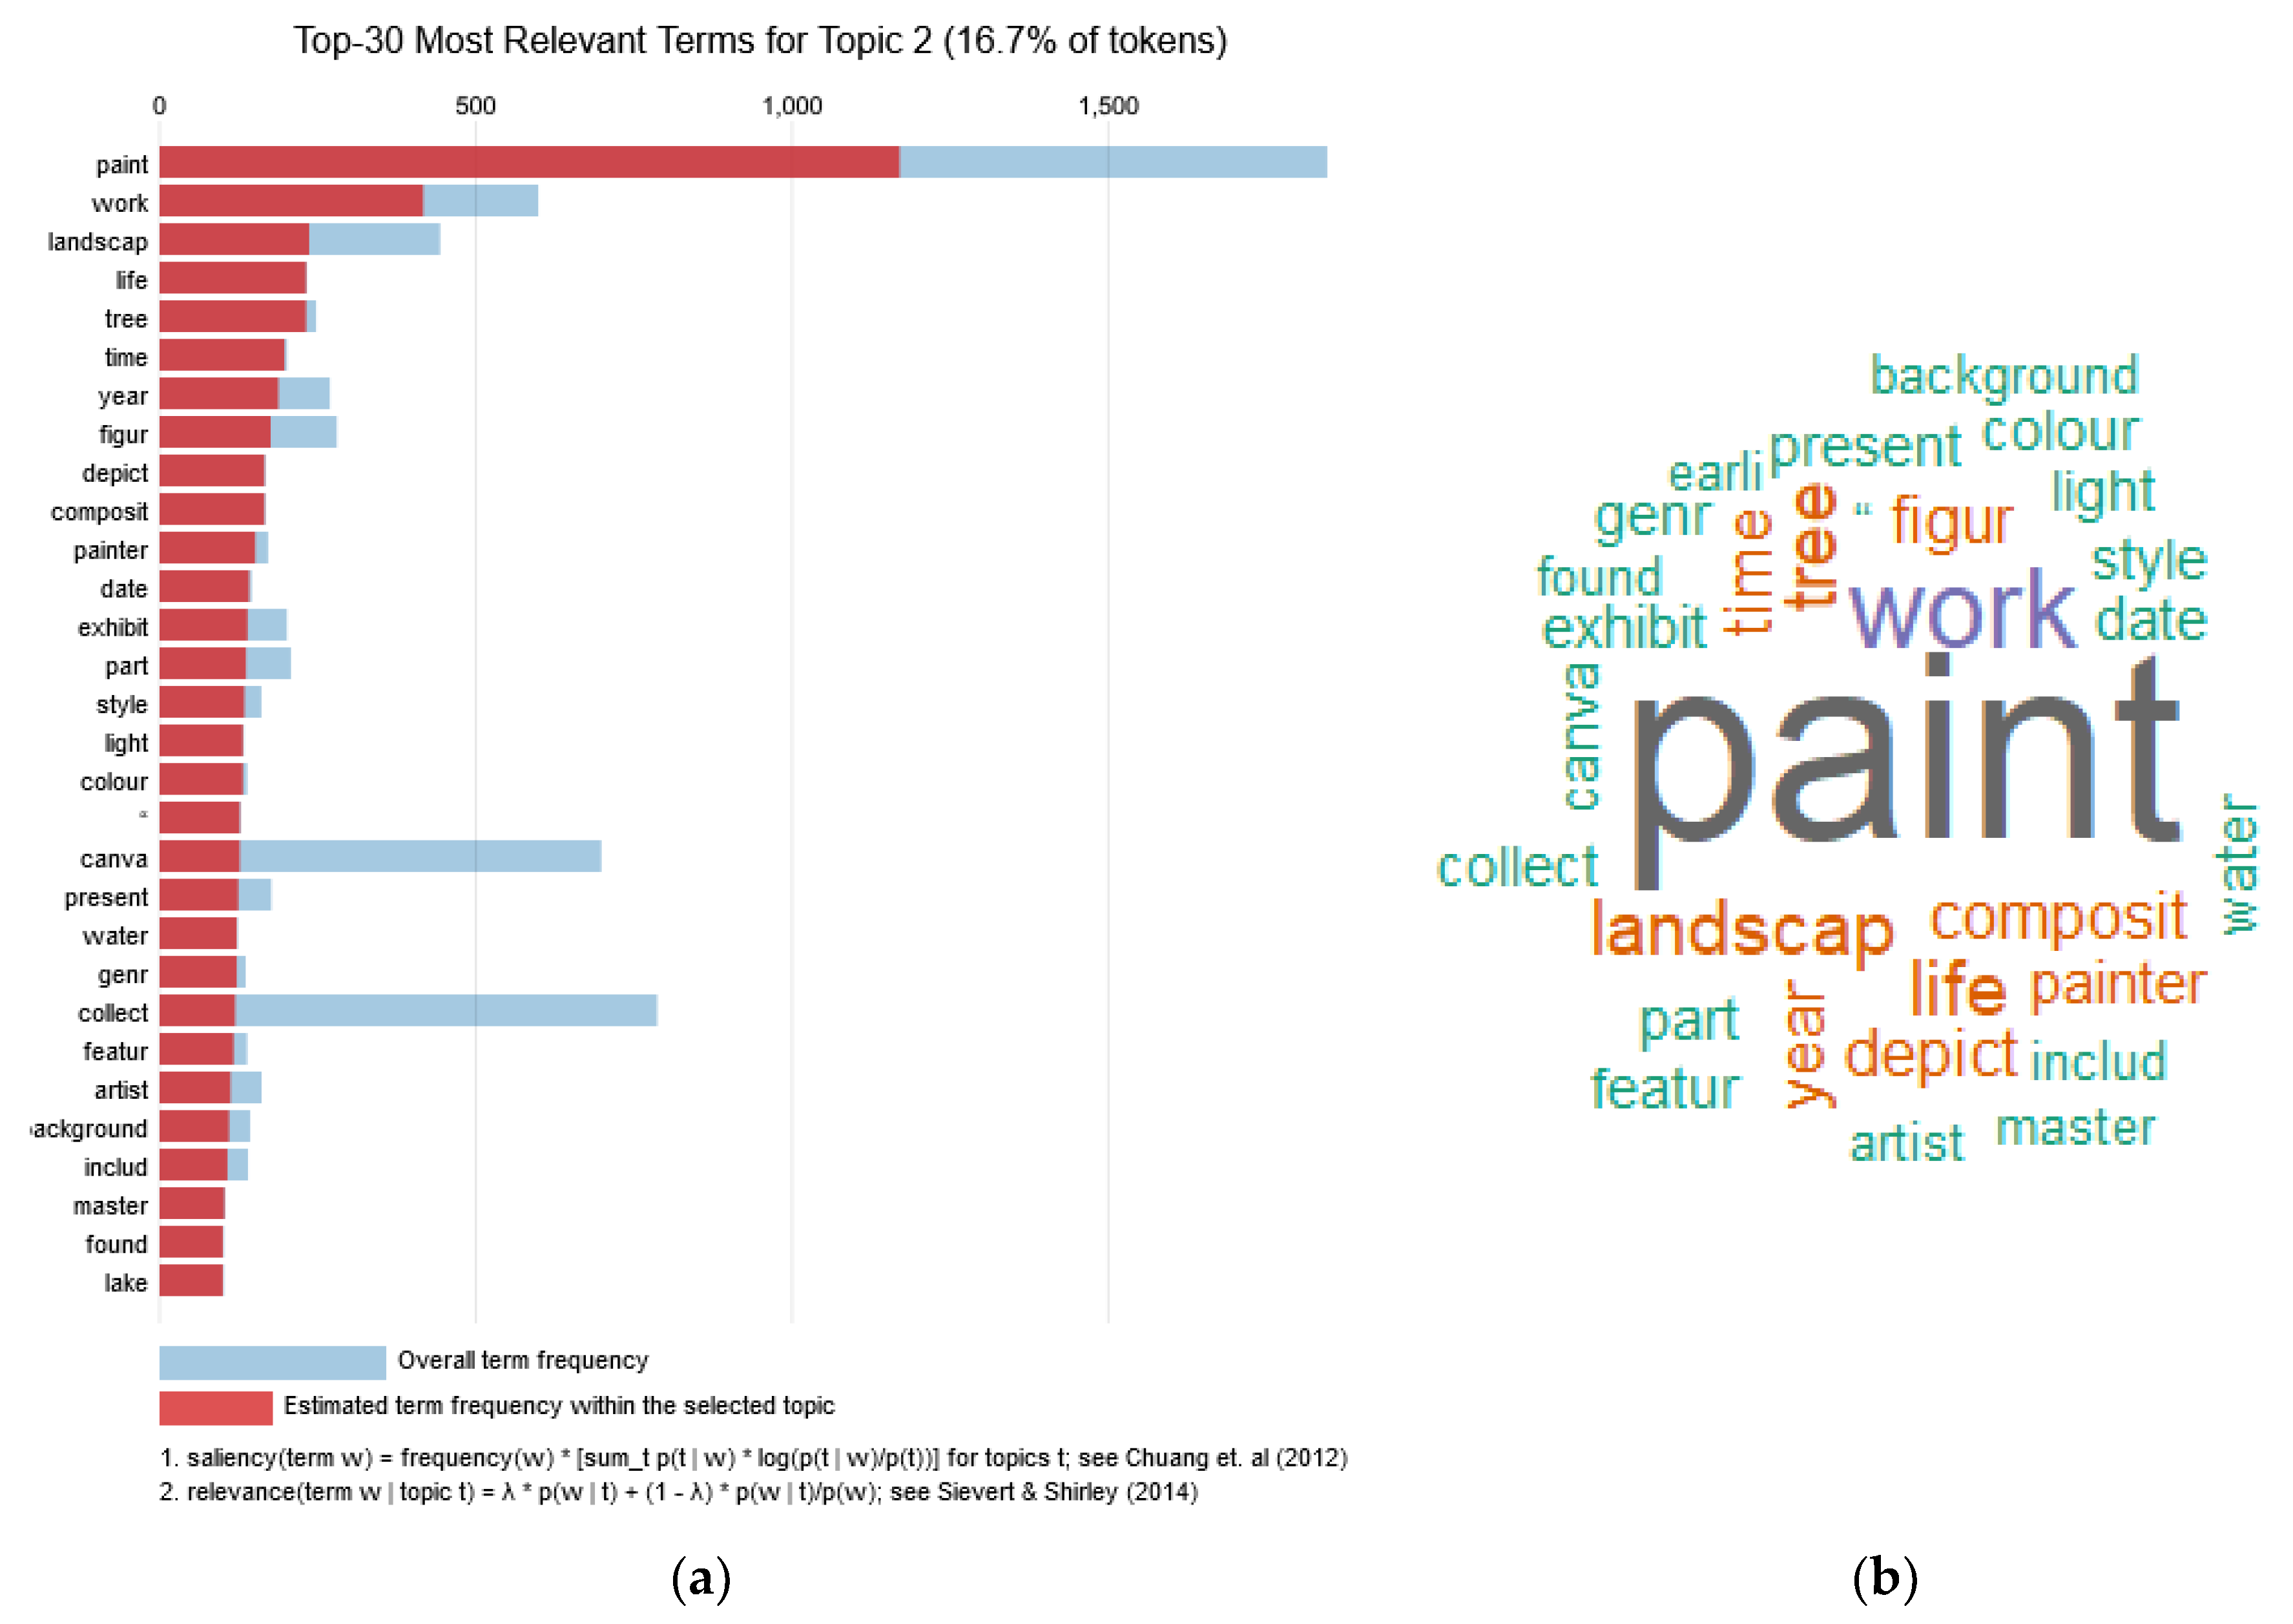
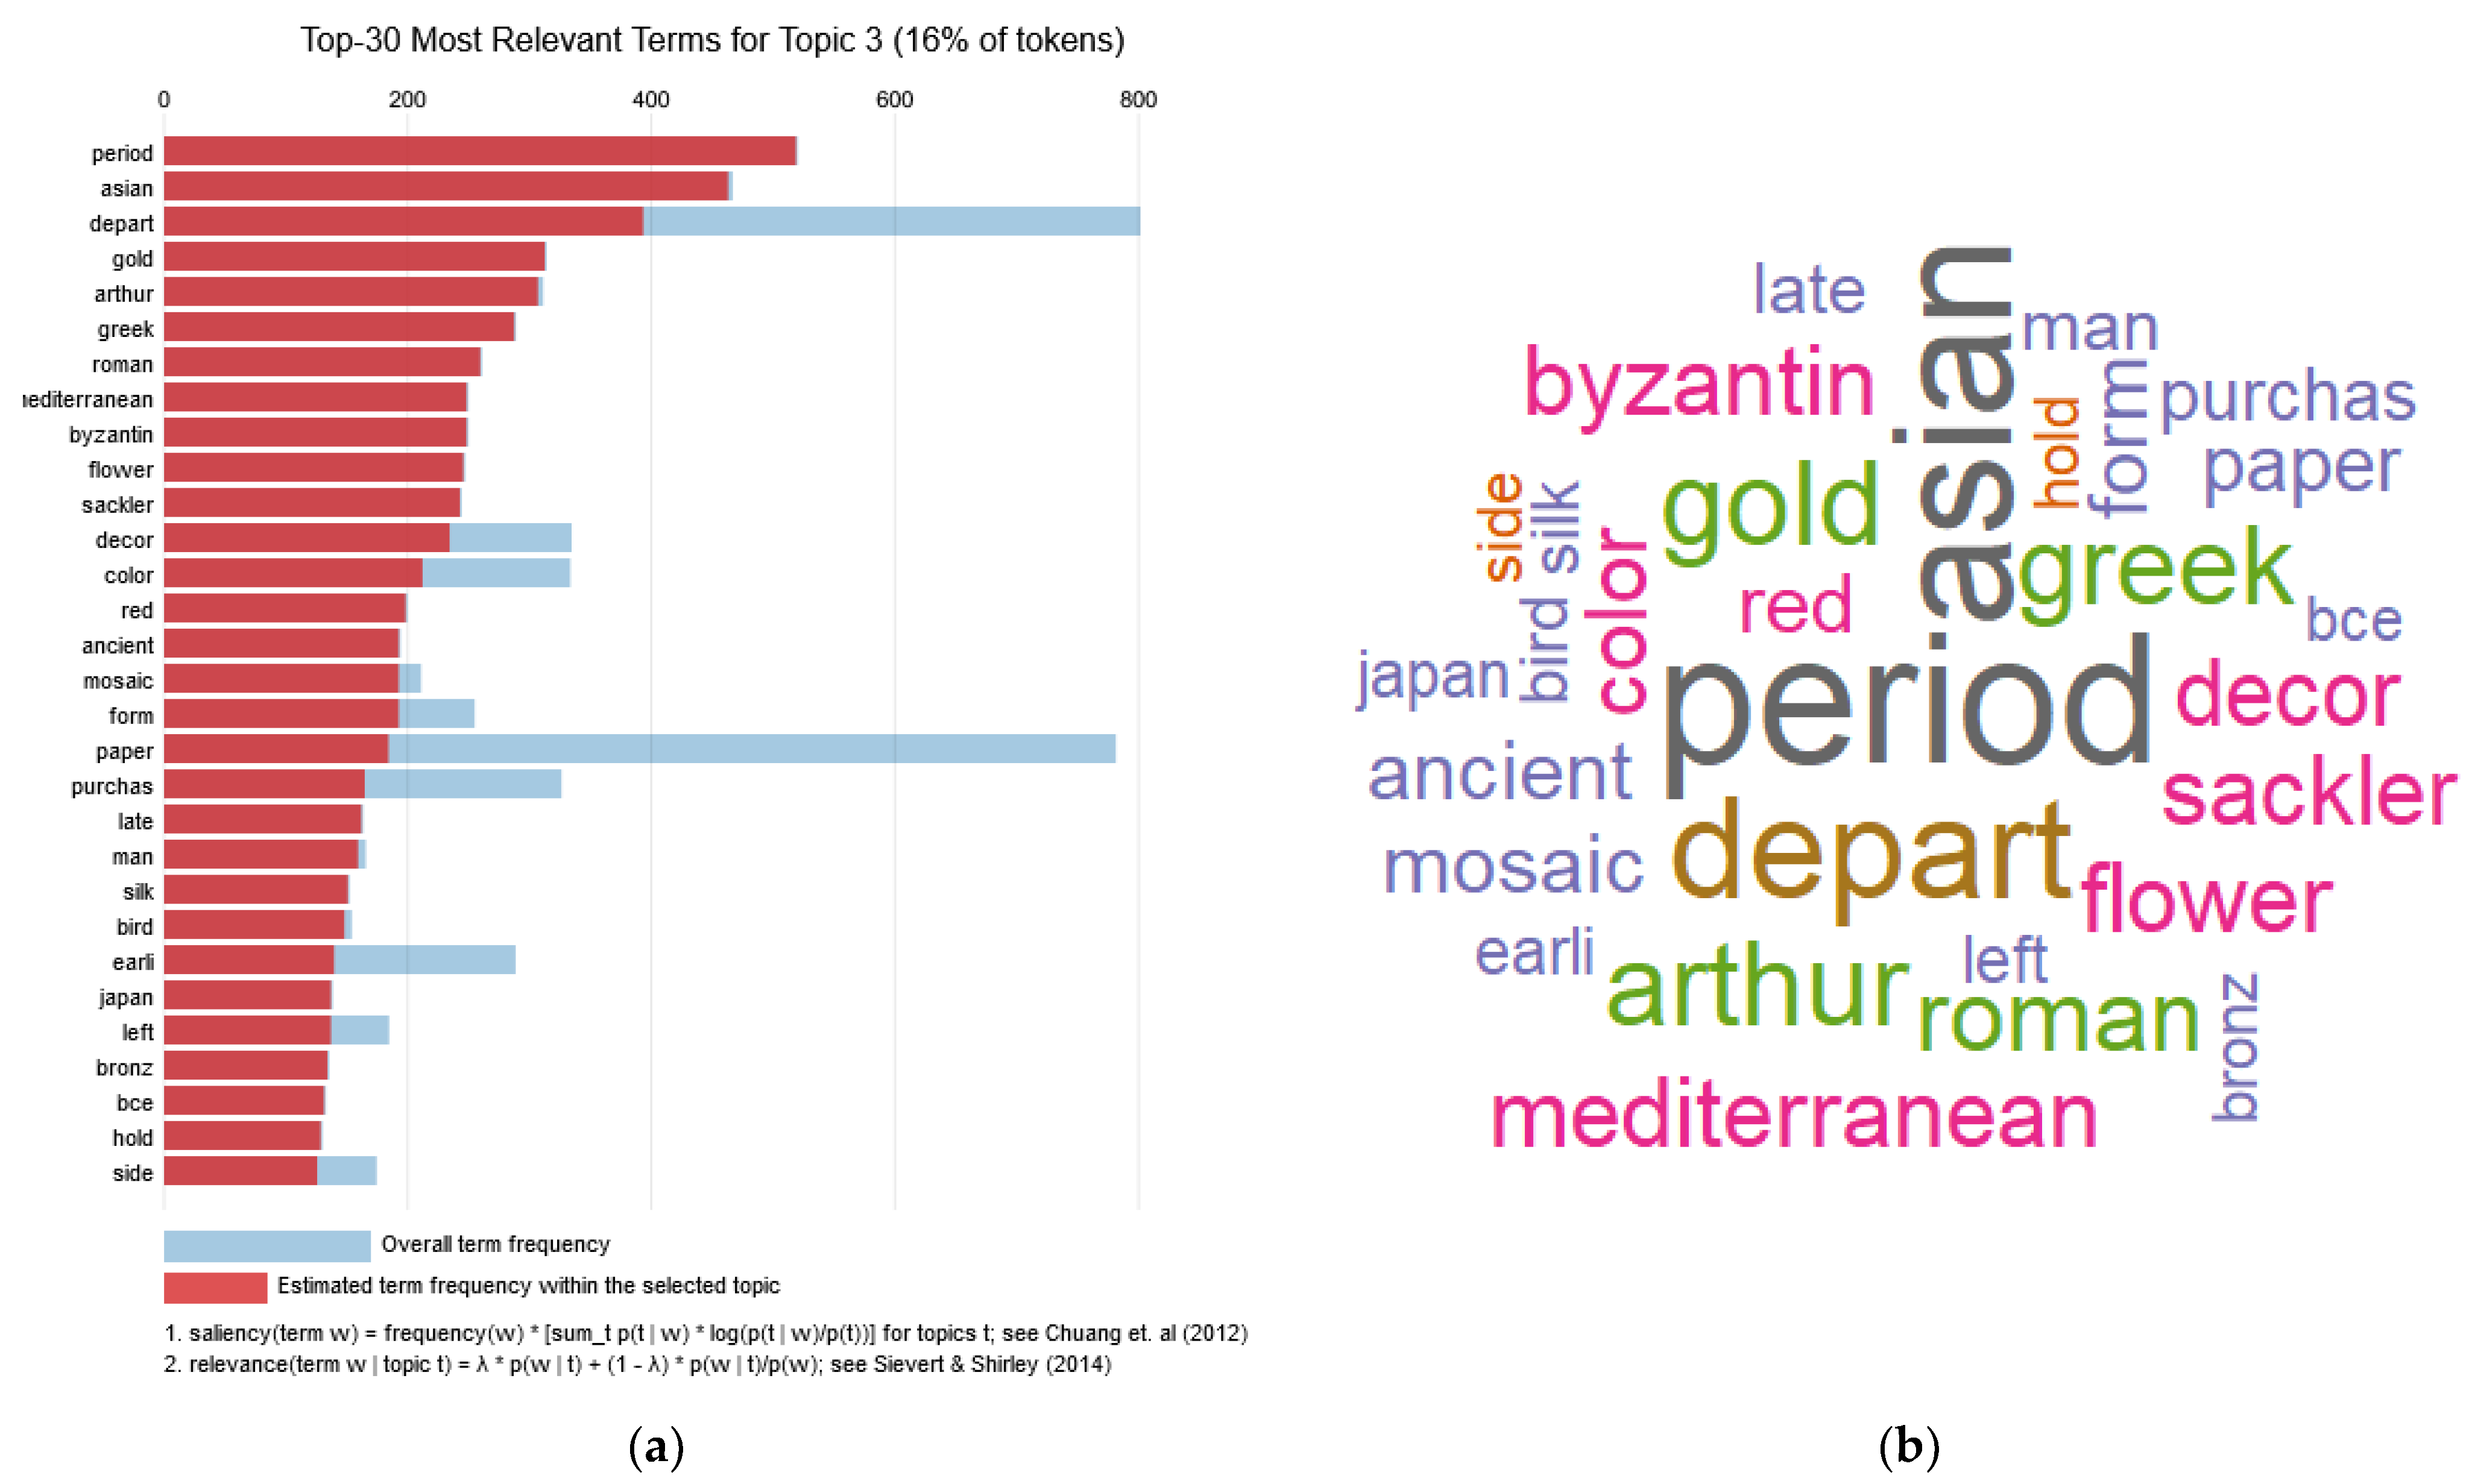
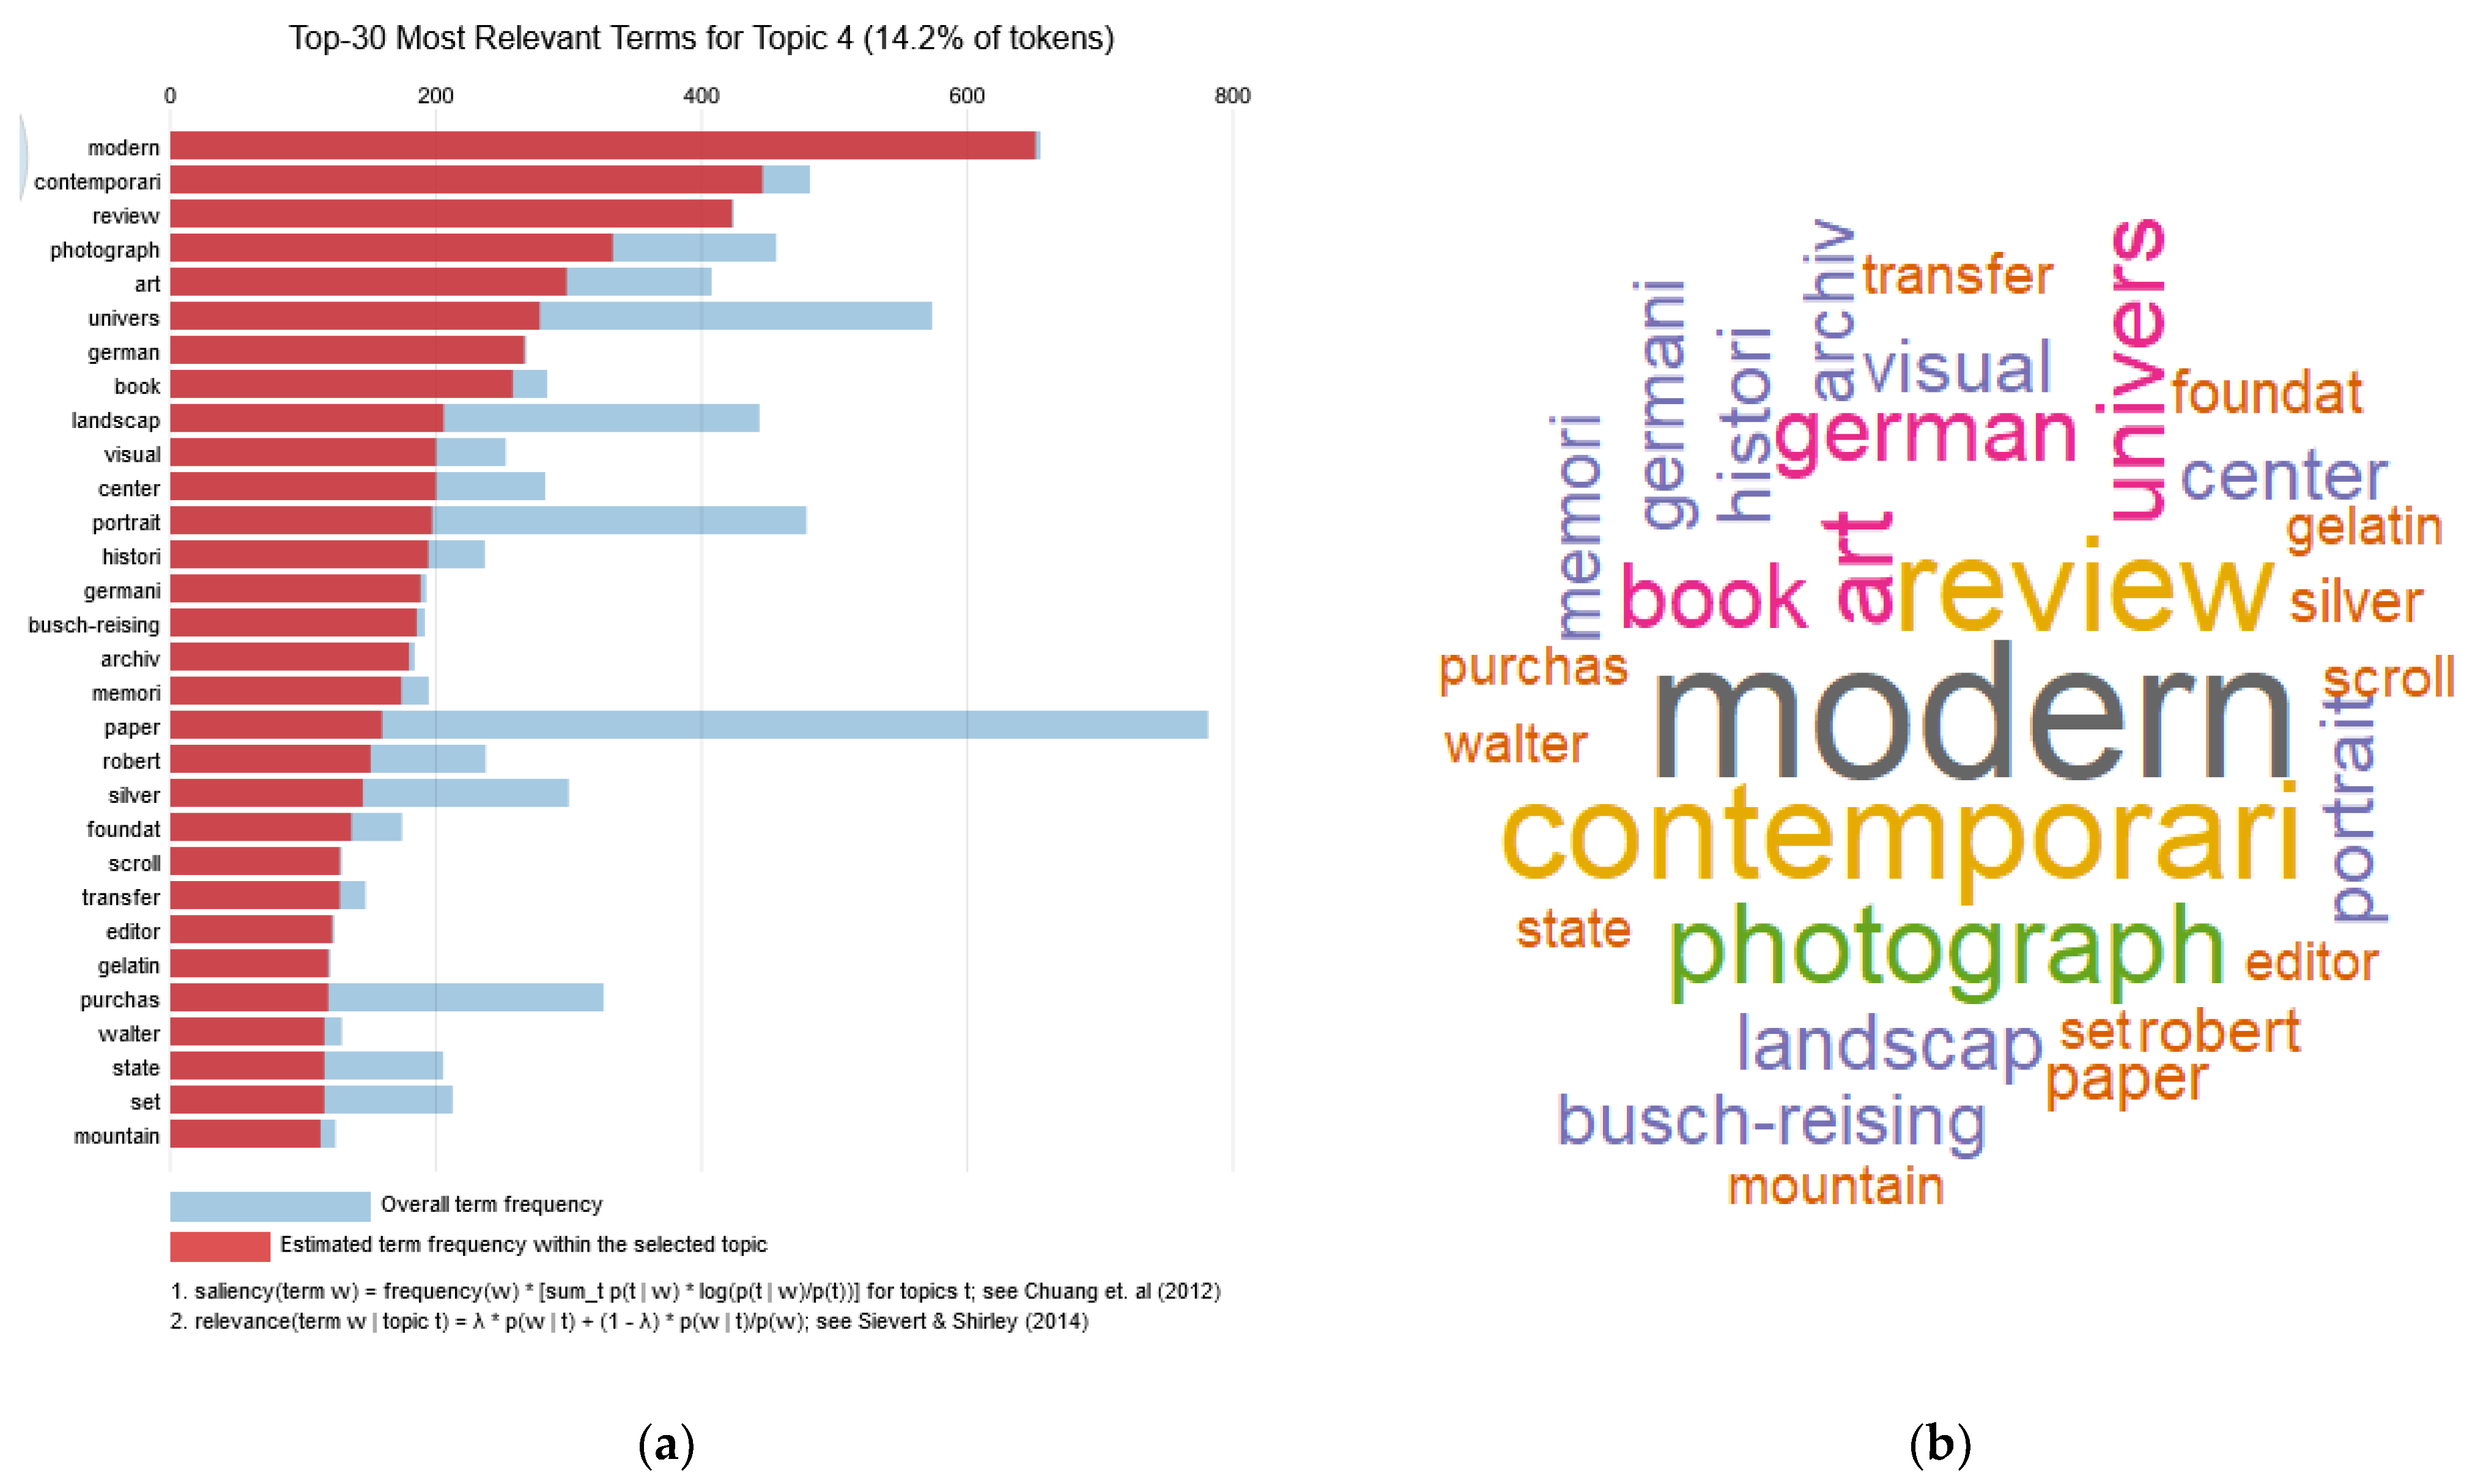
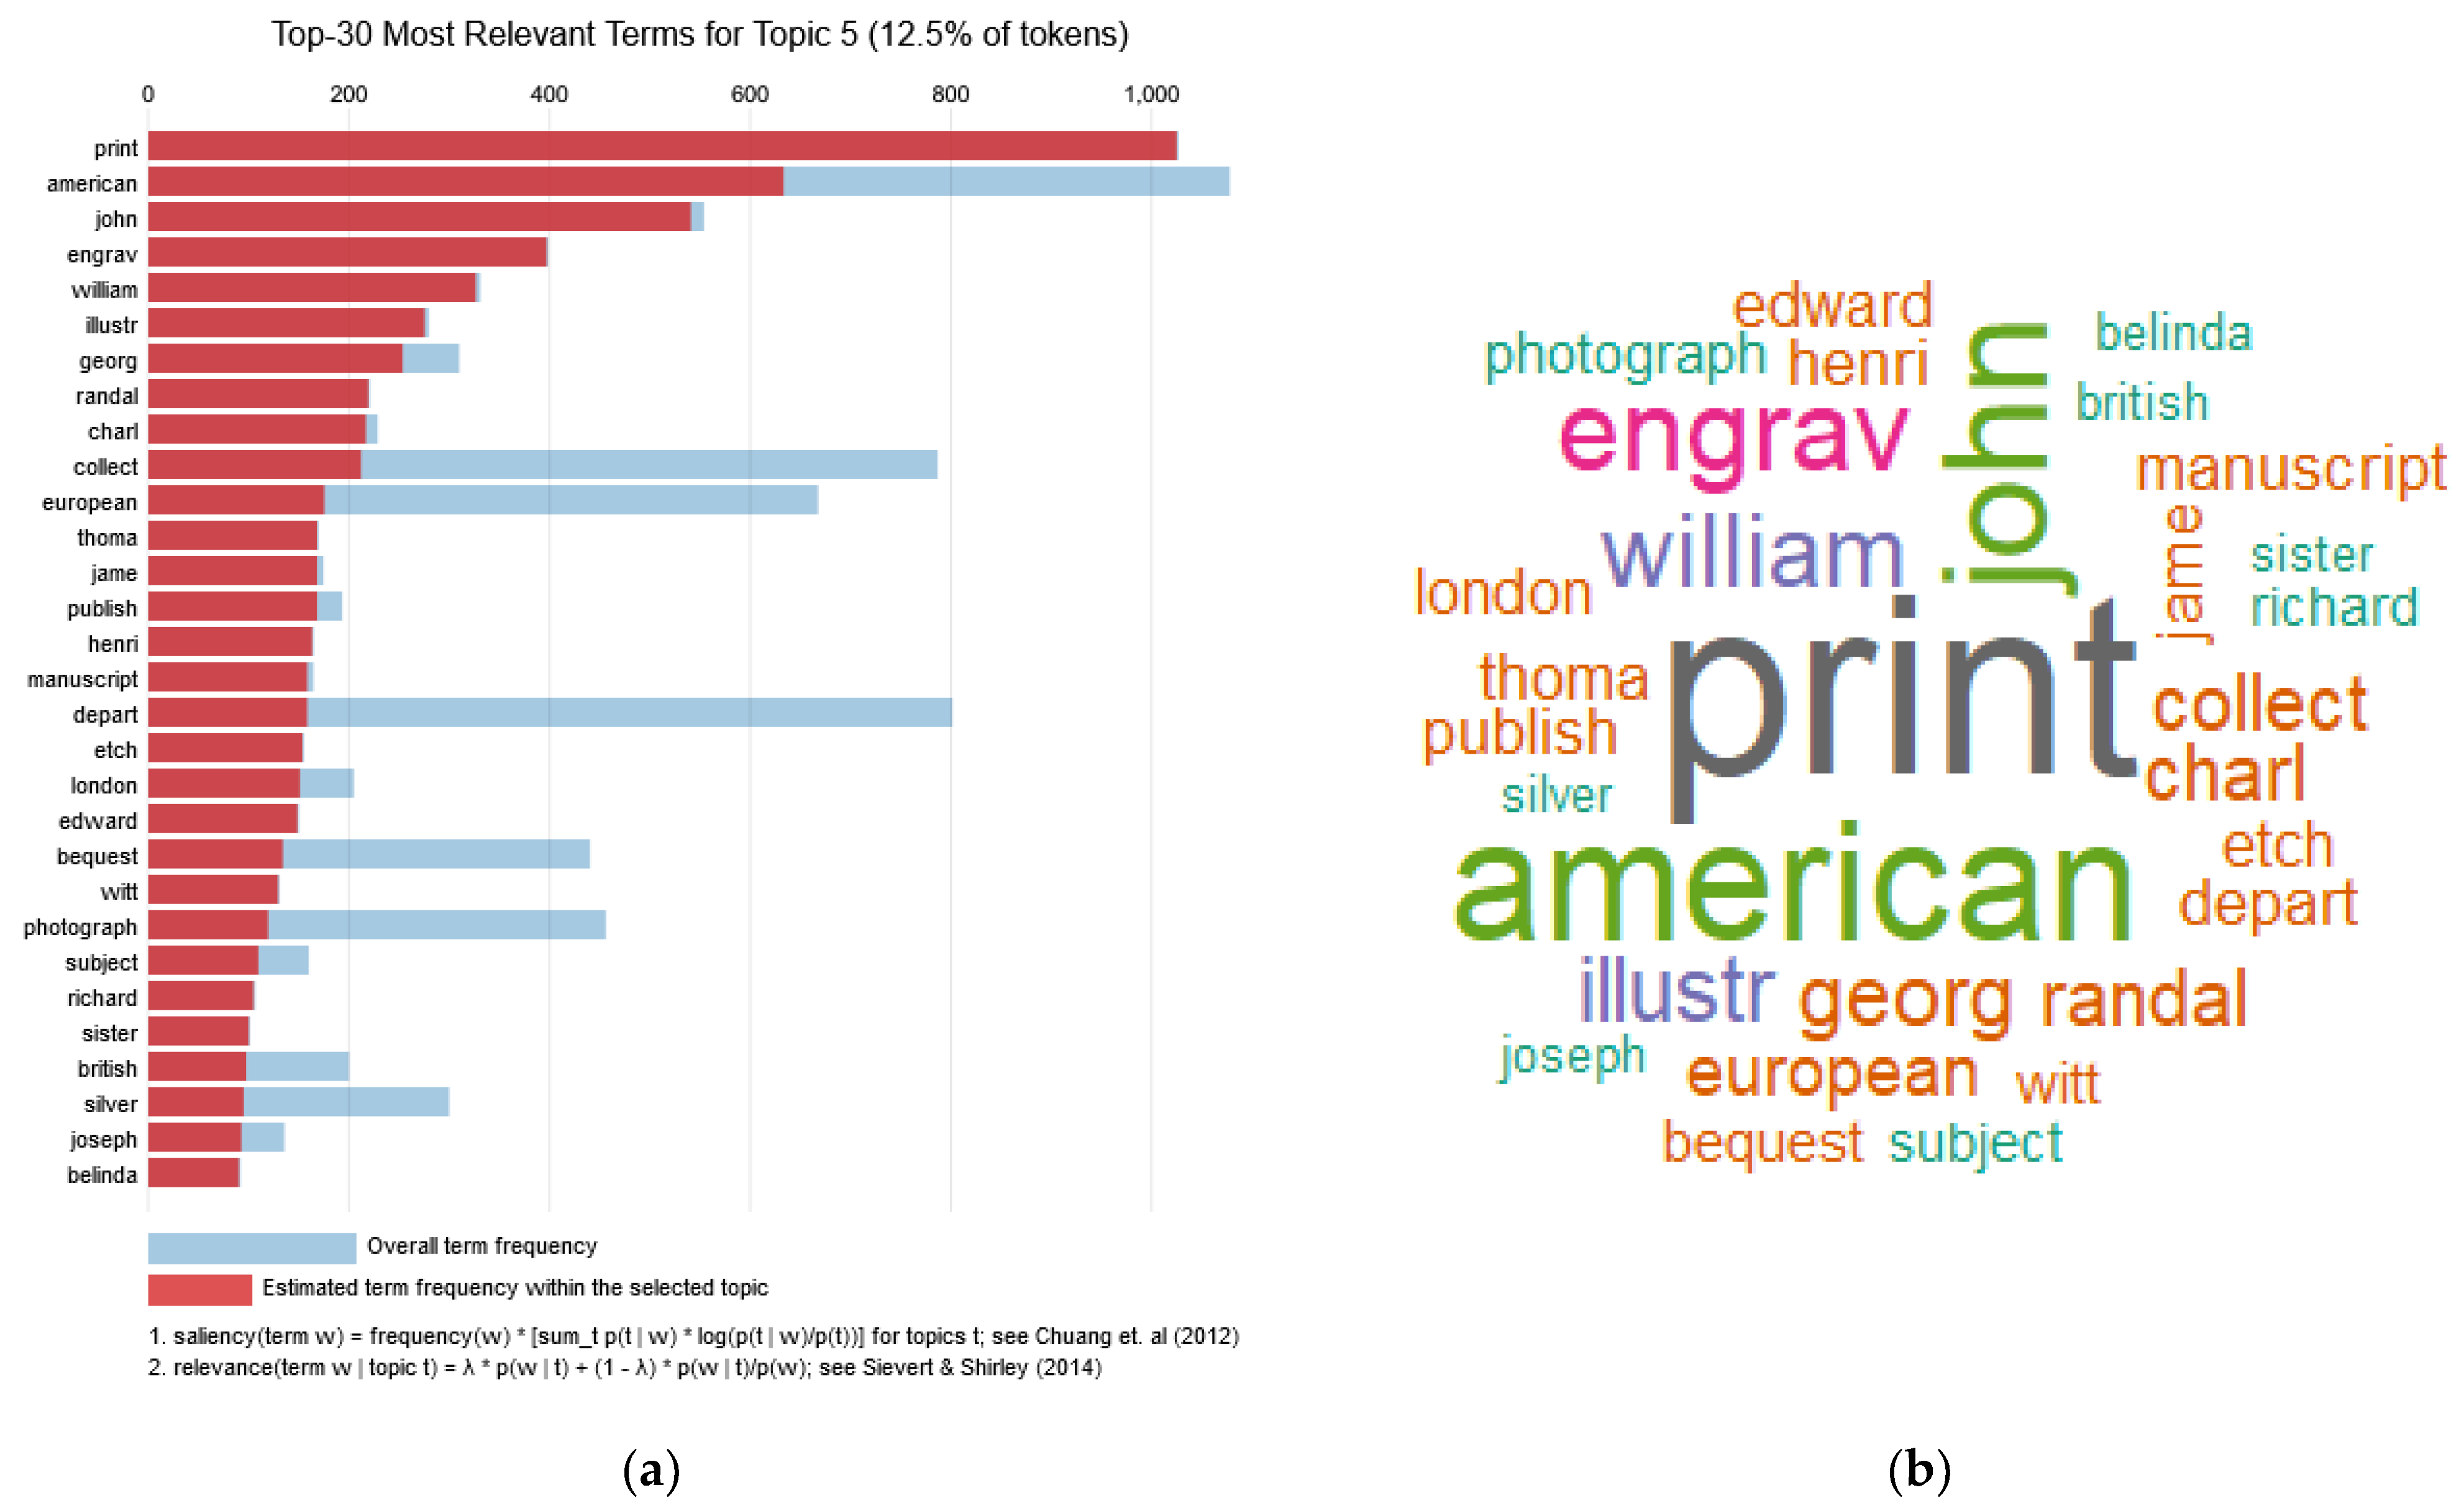
Figure 10 depicts the word clouds of every topic detected by the LDA topic modeling method. The topics were identified through unsupervised learning without any human input other than the model’s parameters as described in
Section 2.3.3. The size and color of each token word that appears in the word clouds are based on the frequency with which the word appeared in each topic. The word clouds are a good way to visualize the information produced by this method, in a manner that is easy for readers to comprehend at first glance. A more detailed representation of the topics is presented in a series of figures in
Appendix A below. Some notes on the word tokens that comprise each topic are presented below, while a more thorough discussion of what these topics denote and how their detection might be interpreted is presented in the discussion section.
Topic 1 as detected by the LDA method consisted of 17.7% of all tokens and appeared to have a close connection with the study of culture and the academic nature of the platform’s results. This was strongly supported by the high relevance of terms such as press, culture, article, studies, research, journal, university, and so on. Terms relating to specific art forms such as music, animation, film, performance, and literature also had high frequencies.
Topic 2 as detected by LDA consisted of 16.7% of all tokens and appeared to have a close connection to painting. The high frequency of terms such as paint and works were accompanied by a high frequency of subject-related terms like landscape, life, tree, figure, and other painting and gallery-related terms like depiction, composition, painter, and exhibition.
Topic 3 as detected by LDA consisted of 16% of all tokens and appeared to have a high connection to antiquity and themes related to Cultural Heritage. The most relevant term was period accompanied by high frequency terms indicating a variety of world cultures, such as Asian, Greek, Roman, Byzantine, Mediterranean, as well as terms relevant to historical artifacts, such as gold, decor, ancient, mosaic, silk, and bronze.
Topic 4 as detected by LDA consisted of 14.2% of all tokens and appeared to have a connection with modern and contemporary Art. Modern and contemporary were the two most frequent terms, followed by terms such as photograph, visual, review, and book that seemed to fit into the wider theme of modernity. The words university, center, and archive were also frequent in this topic, which might indicate a connection with institutions.
Topic 5 as detected by LDA consisted of 12.5% of all tokens and appeared to have a connection with printed Art, with the term print being the highest in frequency in the topic. This term was accompanied by frequent terms including engraving, illustration, collection, manuscript, and etching, which fit into the printing theme. Additional relevant terms included John, William, and George, which alluded to artist names and the terms American and European, which referred to the origin of the works.
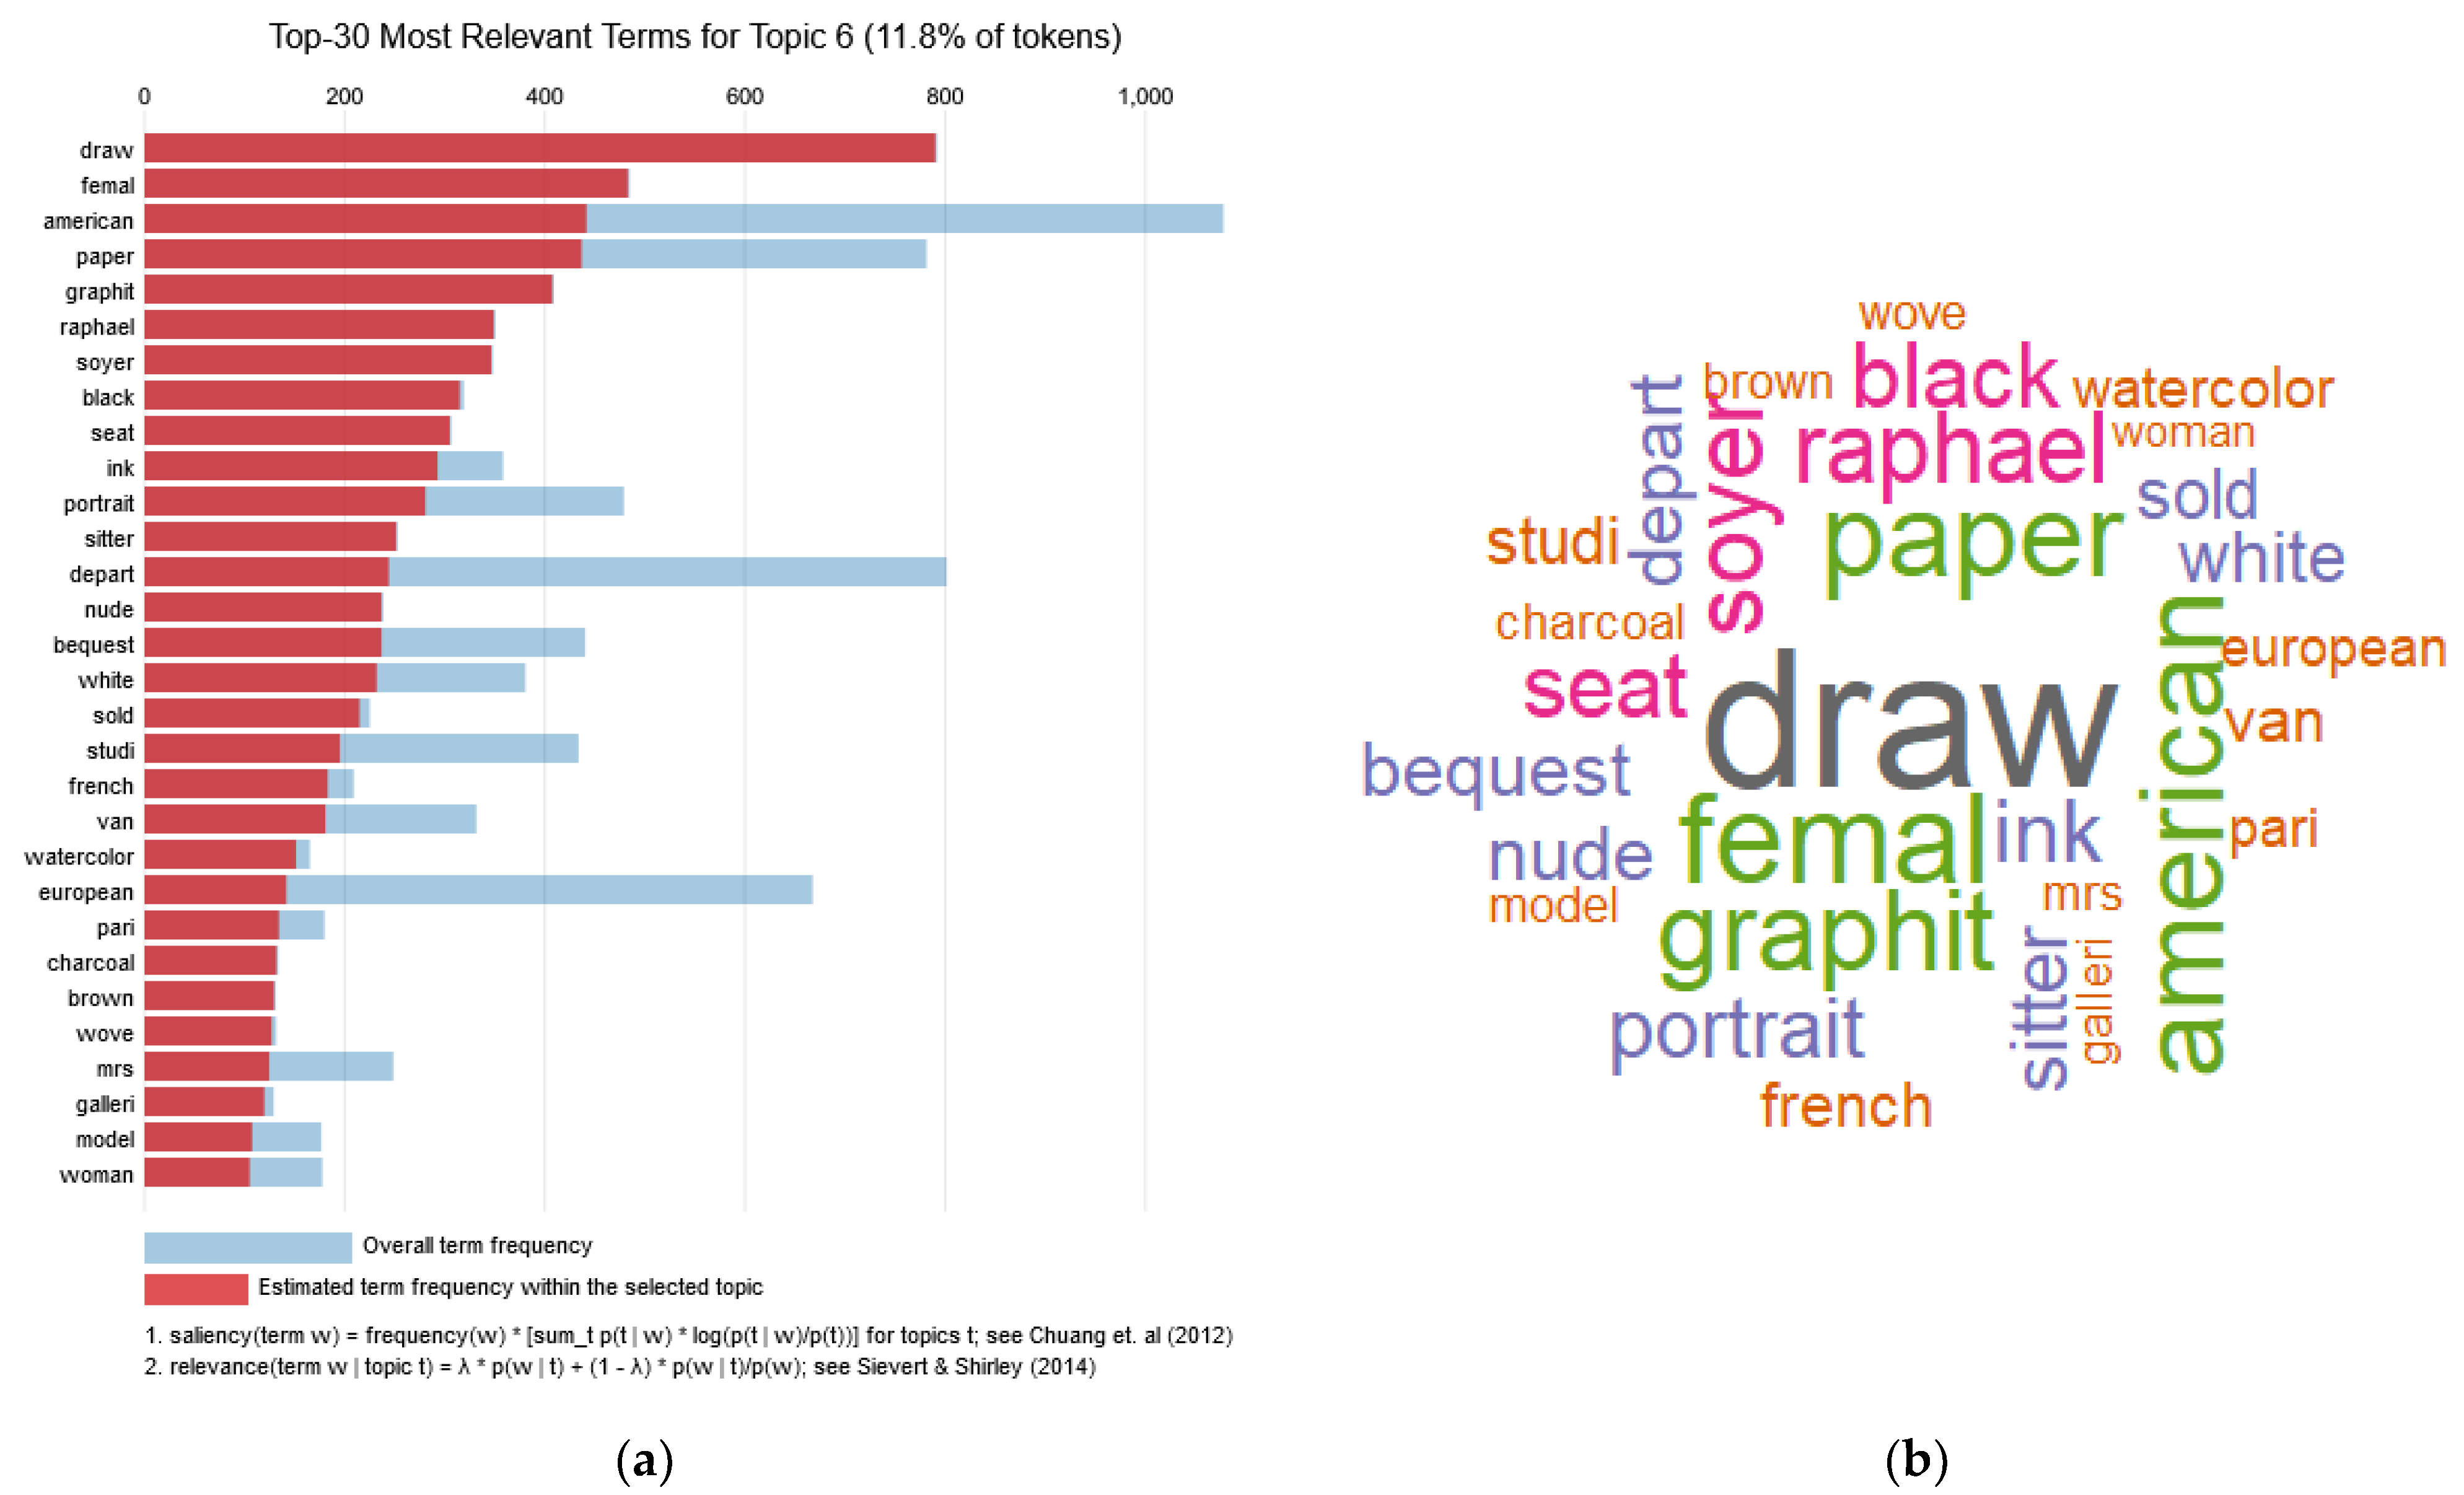
Topic 6 as detected by LDA consisted of 11.8% of all tokens and appeared to have a connection to drawing with the term draw being the most frequent term, accompanied by high frequency terms, including paper, graphite, black, ink, and charcoal, which make the connection to sketching and drawing stronger. Other terms such as female, seat, sitter, nude, and model might also indicate a connection with the subject of the human form. The term American was high in relevance in this topic, with European also appearing but with much lower frequency.
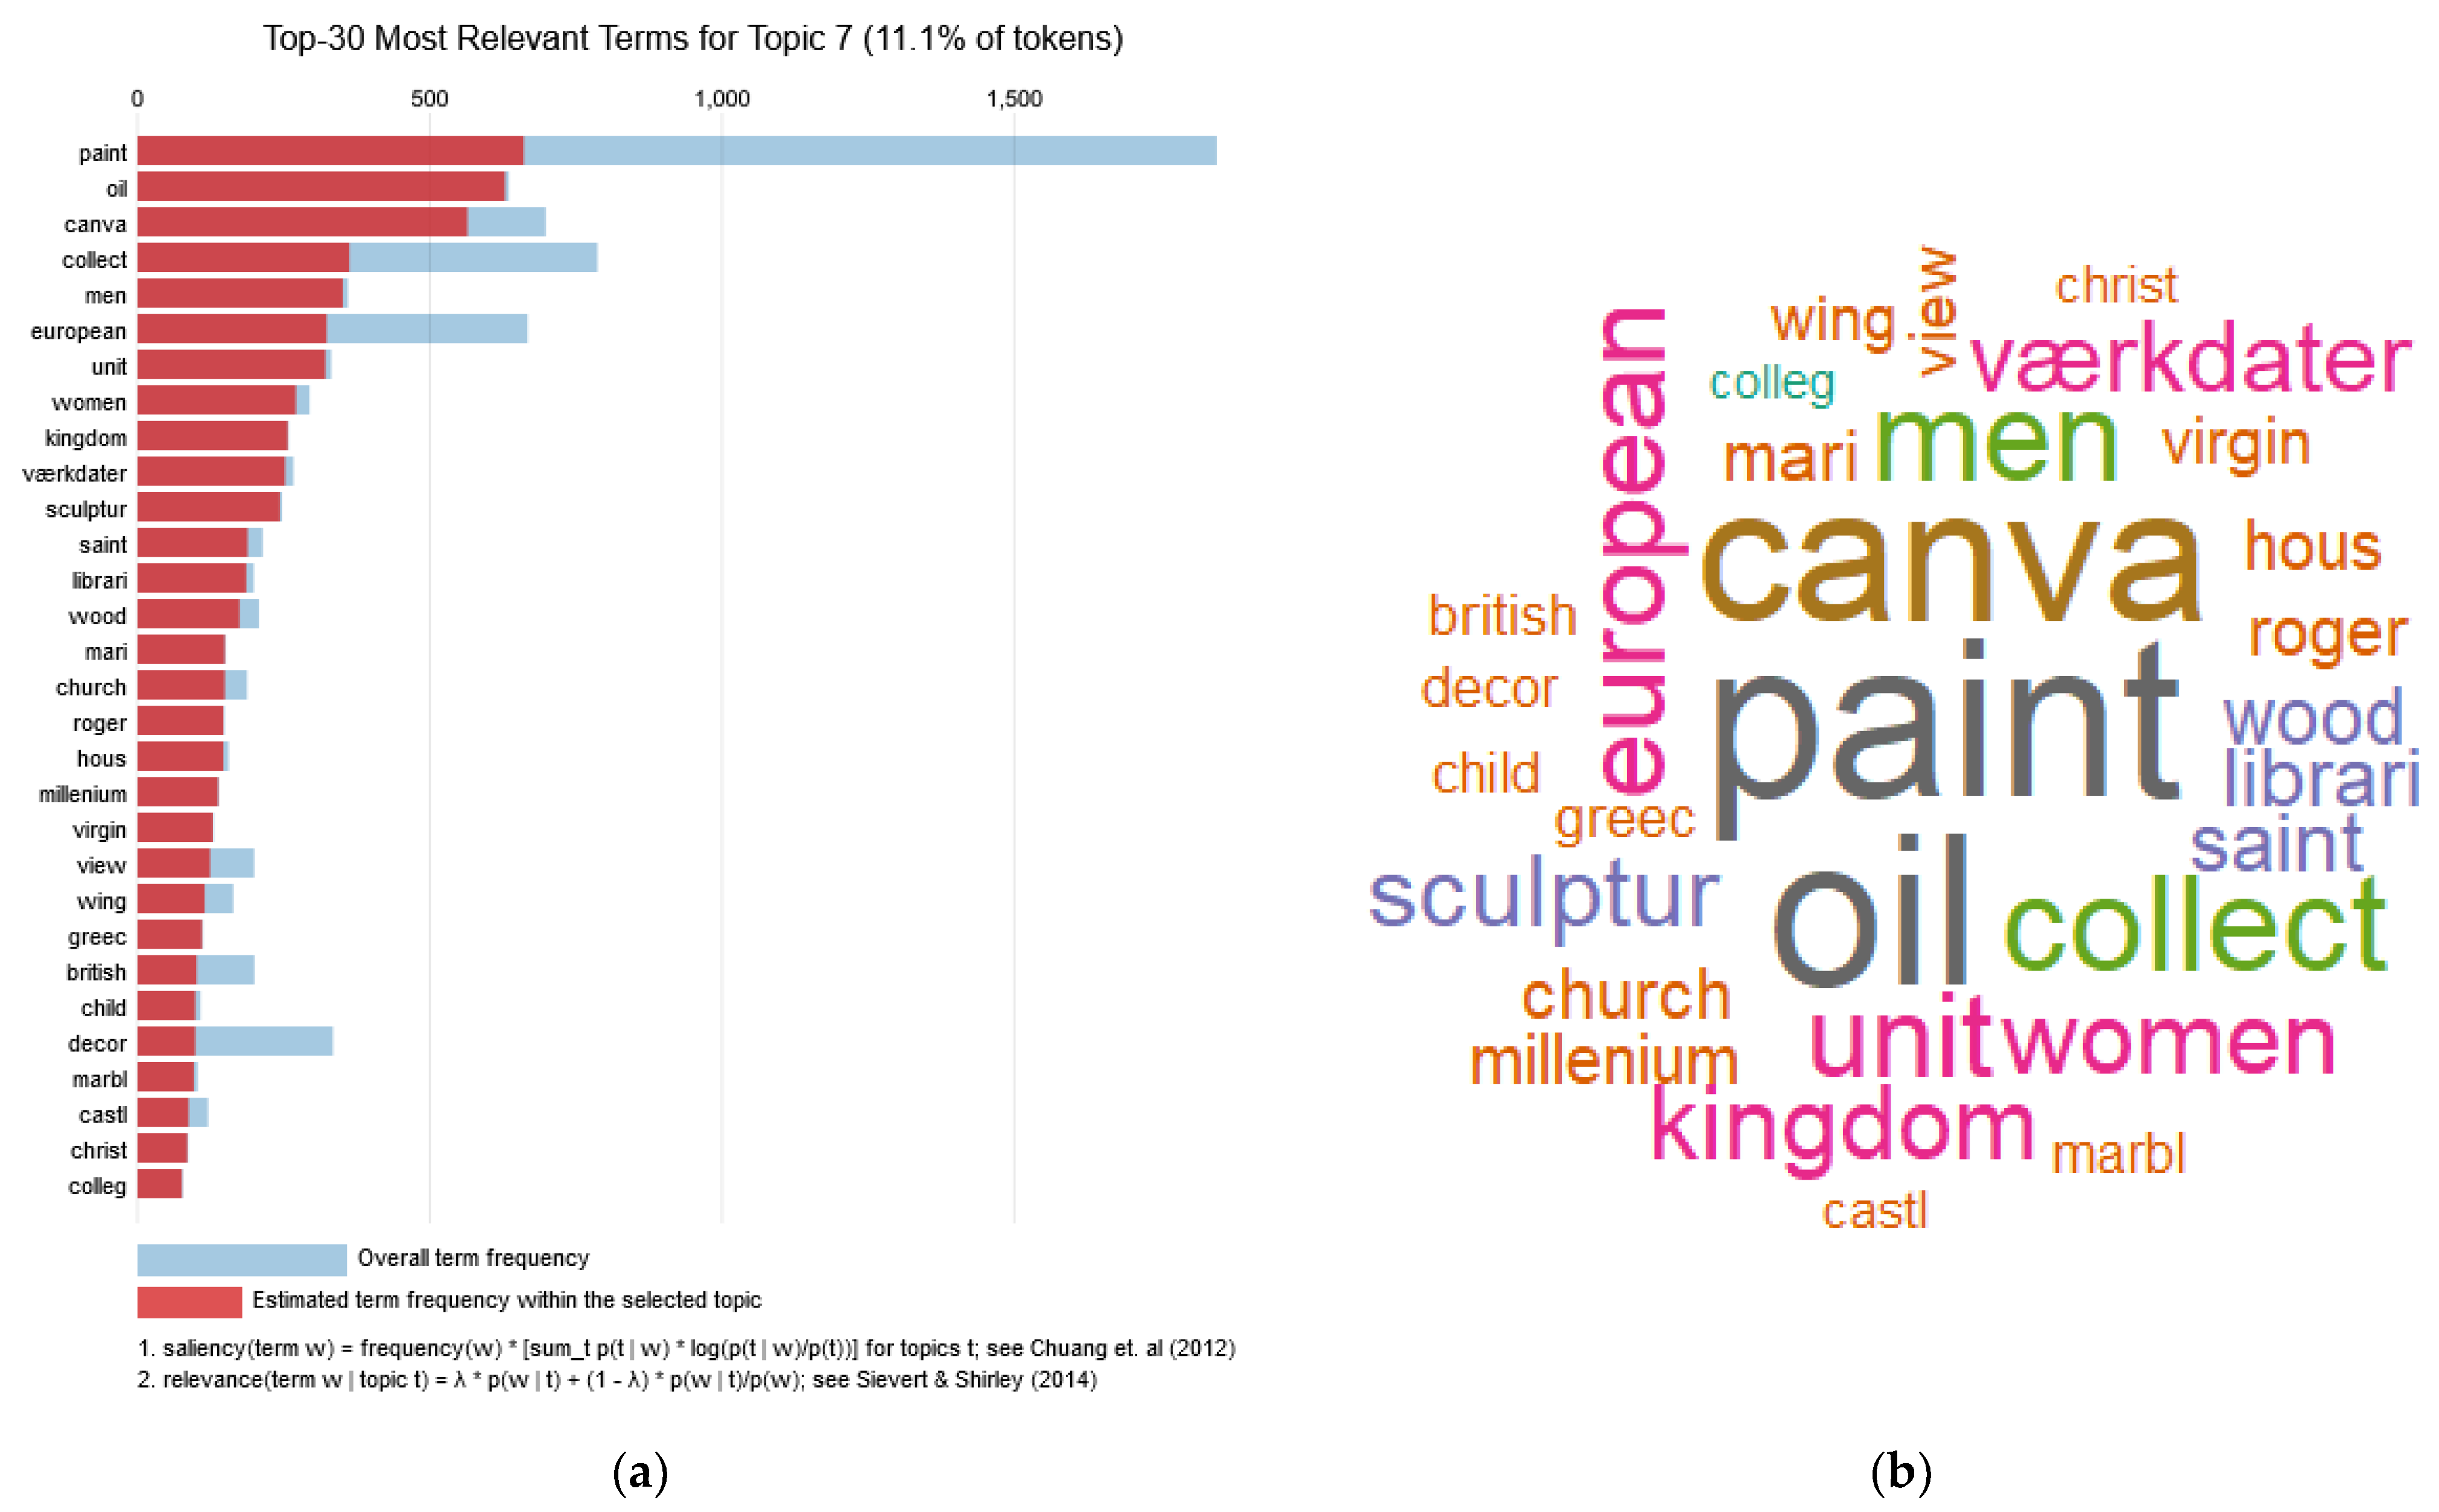
Topic 7 as detected by LDA consisted of 11.1% of all tokens and, similarly to topic 2, had paint as its most frequent term, while at the same time containing the term sculpture. This indicated a connection to the traditional visual arts. With oil and canvas being the second and third most frequent terms, these specific materials seemed to be important to the topic. Some of the relevant terms appeared to be referencing subjects such as men, women, saint, church, house, virgin, and castle. Place names also appeared, with European and United Kingdom being the most prevalent.
5. Conclusions
In this study the sum of information collected from real world usage of the Art Boulevard platform was used in conjunction with state-of-the-art data analysis methodologies based on machine learning to achieve a better understanding of the behavior of people searching online for content related to Art and Cultural Heritage. The data, which covered over ten thousand search sessions over the course of a six-month period, painted a candid picture of user behavior, described through implicit quantitative metrics. Clustering and gradient boosting techniques were used to study the classification and prediction aspects of Art search sessions. At the same time, textual data from the content in which searchers showed an active interest, was used for thematic classification through topic modeling.
Through K-means clustering the landscape of search session characteristics was defined, with four archetypes of search sessions emerging: direct result sessions, short sessions, substantial sessions and expert sessions. User engagement and search success were the major differentiating factors between these archetypes. Additionally, by making use of XGBoost’s extreme gradient boosting method, the ability to predict the successful outcome of a search session based on aspects of user engagement was established. Finally, topic modeling through the LDA method explored the dominance of traditional visual Arts among the interests of searchers and the various concepts that define the discussion of Cultural Heritage as opposed to modern Art.
The Art Boulevard platform was specifically designed not only to allow Art searchers to discover and engage with interesting content, but also to collect information about their behavior and utilize it to better understand them and help content providers satisfy their needs. The methods utilized in this study present some of the many cases where the collected data may be used to investigate user behavior. K-means clustering, Extreme Boosting, and LDA topic modeling have all seen similar or equivalent use in other aspects of searcher behavior studies and over the years have become staples of behavioral analysis, as discussed extensively both in the introduction and methodology sections. That being said, these methods only cover a limited amount of the potential insights that can be derived from the collected dataset. Repeating the methods using different metrics or parameters might provide additional insight and help refine this study’s findings. The same can be achieved by the use of alternative approaches provided by competing methodologies. Moreover, the data itself can be expanded with more metrics and the platform improved in order to attract more visitors.
An important endeavor in our work moving forward with this research is formulating a series of best practices on providing content related to Art and Cultural Heritage and establishing the ways in which these practices differentiate themselves relative to general purpose content diffusion practices in order to better suit the need of the specific field. Moreover, the system that collects information and derives insights may be used in the future to enhance the platform’s behavior in real time, using the acquired knowledge to offer more accurate results and improve the searcher experience. Finally, it will be important to revisit the data collected by the platform in the future. After six months of operation, the platform is more popular than ever, and moving forward both the collected data and the rate of collection will increase. Revisiting this dataset after two or three years of operation will not only provide us with more concrete results, but also allow us to research trends and changes in behavioral patterns.
The evolution of the Web and the role it plays in people’s everyday lives has generated a great deal of interest and provided motivation for extensive cutting-edge research in the fields of user behavior and search engine usage. However, this research is often either targeted strictly towards general-purpose searching or motivated by commercial gain and focused on the fields of advertising or media outlets. Using advanced data analysis to study user behavior in the service of Art and Cultural Heritage produces valuable knowledge that benefits both the content providers and the users themselves.


