
Hippocampal Asymmetry Increases with Age

1
School of Psychology, University of Auckland, Auckland 1010, New Zealand
2
Department of Women’s and Children’s Health, Uppsala University, 751 85 Uppsala, Sweden
3
Laboratory of Neuro Imaging, School of Medicine, University of Southern California, Los Angeles, CA 90033, USA
*
Author to whom correspondence should be addressed.
Anatomia 2023, 2(4), 328-335; https://doi.org/10.3390/anatomia2040029
Submission received: 3 September 2023
/
Revised: 27 September 2023
/
Accepted: 10 October 2023
/
Published: 16 October 2023
(This article belongs to the Special Issue Neuroanatomy, Neuroinflammation and Neurodegeneration)
Abstract
:It is unclear whether differences between the two brain hemispheres become larger or smaller with increasing age. Given that the hippocampus is particularly susceptible to age-related changes, here, we set out to investigate the correlation between chronological age and hippocampal asymmetry, both for the hippocampal complex as a whole and in cytoarchitectonically defined subregions (cornu ammonis 1, 2, 3, dentate gyrus, subiculum, and entorhinal cortex). We analyzed T1-weighted data of the brain from a sample of 725 healthy individuals (406 women/319 men) spanning a wide age range (36–100 years) from The Lifespan Human Connectome Project in Aging. Correlations between the absolute asymmetry index and chronological age were positive for all six subregions and also for the hippocampal complex as a whole, albeit effects the effects were not significant for the dentate gyrus. This suggests that, overall, hippocampal asymmetry increases with increasing age (i.e., the left and right hippocampi become more different over time). Given that the subregions of the hippocampal complex serve different brain functions, follow-up research is needed to explore the functional implications within the framework of brain aging. In addition, longitudinal studies will be necessary to confirm the observed cross-sectional effects.
1. Introduction
It is well established that some brain functions are predominantly processed in one or the other hemisphere and that corresponding brain regions located in the left and right hemisphere differ from each other structurally and functionally [1,2,3,4,5,6]. Several reports and theories posit that structural asymmetry as well as functional lateralization change with increasing age [7,8,9,10,11,12,13,14,15,16,17]. Some of these theories further specify that such changes help to retain cognitive functioning and mitigate age-related brain atrophy [7,8,13,15]. However, despite the significance of age-related changes in structural asymmetry and functional lateralization, our current knowledge about the magnitude of change as well as the direction of change (decrease vs. increase) is inconclusive at best.
The hippocampal complex is heavily implicated in ageing processes [18,19,20,21,22] and its subregions differ in their age-related volume loss [19,20,21,22,23]. In addition, there is some evidence of asymmetric atrophy later in life [24], but see also [18]. Thus, here, we set out to investigate hippocampal asymmetry as well as changes in hippocampal asymmetry over time, both for the hippocampal complex as a whole and in cytoarchitectonically defined subregions (cornu ammonis (CA) 1, 2 and 3, dentate gyrus, subiculum, and entorhinal cortex). More specifically, in terms of changes in hippocampal asymmetry over time, we investigated the correlation between chronological age and the absolute asymmetry of the hippocampal complex (its subregions, respectively). Working with absolute asymmetry allows for the possibility that asymmetry itself, as well as age-related asymmetry changes, differ across brains. For example, if there was an increase in asymmetry over time to opposite sites (e.g., more leftward in some brains and more rightward in others), these effects could cancel each other out because directional asymmetry is expressed by negative and positive values (leftward/rightward). In contrast, absolute asymmetry (no direction) is always positive and solely captures the magnitude of the asymmetry or change in magnitude, respectively. Thus, the absolute asymmetry index was the focus of interest for the main analysis. However, supplemental analyses using directional asymmetry were conducted to establish if hippocampal (sub)regions showed a leftward or rightward asymmetry independent of aging; to determine whether there was a change in the direction of asymmetry with increasing age, as well as to compare the outcomes when using the absolute and directional asymmetry index.
2. Materials and Methods
The image data and participant information were obtained from the Lifespan Human Connectome Project in Aging [25] via the National Institute of Mental Health Data Archive (NDA—https://nda.nih.gov). Specifically, we obtained the data from Lifespan 2.0, which contains T1-weighted images as well as the epidemiological information for a sample of 725 healthy participants (406 women/319 men) spanning a wide age range (36–100 years) collected at four acquisition sites (Washington University St. Louis, University of Minnesota, Massachusetts General Hospital, and University of California, Los Angeles). Descriptive statistics are provided in Table 1. All participants gave their informed consent, and the study was approved by the local IRBs. Additional local ethics approval for the data analysis was obtained from the University of Auckland (UoA) ethics committee (Protocol No. 022375).
All brain images were processed using SPM12 (http://www.fil.ion.ucl.ac.uk/spm) and the CAT12 toolbox (http://dbm.neuro.uni-jena.de/cat), as previously described [19,26,27,28,29]. In short, images were first de-noised, bias-corrected, and subsequently segmented into gray matter, white matter, and cerebrospinal fluid using a partial volume estimation algorithm. The gray matter segments were corrected for misclassifications due to white matter hyperintensities and then spatially normalized to the Shooting template in MNI152NLin2009c space (as provided with the CAT12 toolbox) using 12-parameter affine transformations and high-dimensional warping [30]. Finally, to preserve the original gray matter volume, the normalized gray matter segments were modulated using the Jacobian determinants derived from the normalization matrix [31,32,33]. In addition, the total intracranial volume (TIV) was calculated automatically during CAT12’s tissue segmentation step to be later included as a co-variate in the statistical model.
To extract the hippocampal (sub)volumes, we first multiplied the processed gray matter segments with the subarea-specific probability maps [34] provided by the Julich brain atlas v2.9 [35], as described in detail elsewhere [19,26,27,28,29]. This voxel-wise integration yielded a probability-weighted measure of gray matter content within each left and right CA1, CA2, CA3, dentate gyrus, subiculum, and entorhinal cortex (in mm3). The gray matter content for the hippocampal complex as a whole (hippo) was calculated by adding the volumes of all aforementioned subareas (hippo = CA1 + CA2 + CA3 + dentate gyrus + subiculum + entorhinal cortex). Then, we calculated the asymmetry index by applying the following formula to the left and right hippocampal (sub)volumes [36,37]: (right − left)/(0.5 × (right + left)). This resulted in positive values (rightward asymmetry) and negative values (leftward asymmetry). Finally, we calculated the absolute asymmetry index for all hippocampal (sub)volumes (non-directional asymmetry).
All subsequent statistical analyses were conducted in Matlab (The MathWorks, Natick, MA, USA), and mixed models were applied to assess the Pearson correlations between age and hippocampal asymmetries. The absolute asymmetry indices for all six subregions as well as the hippocampal complex as a whole were used as dependent variables; age as the independent variable; sex, handedness, and TIV as variables of no interest; and site as a random variable. Significance levels were set at p ≤ 0.05 after applying corrections for multiple comparisons by controlling the false discovery rate [38,39]. In addition to this main analysis using the absolute asymmetry index, we conducted a supplemental analysis repeating the aforementioned model but using the directional asymmetry index. This enabled us to calculate the asymmetry direction at the mean age of the sample, to test for a possible change in asymmetry direction with increasing age, as well as to compare the outcomes when using the absolute and directional asymmetry index.
3. Results
As shown in Table 2, at the sample mean age of 60.36 years, significant rightward asymmetries were observed for CA1, CA2, CA3, subiculum and also for the hippocampal complex as a whole. In contrast, significant leftward asymmetries were detected for the dentate gyrus and the entorhinal cortex. On average, there was no change in asymmetry direction over time for any (sub)region (i.e., leftward remained leftward, rightward remained rightward).
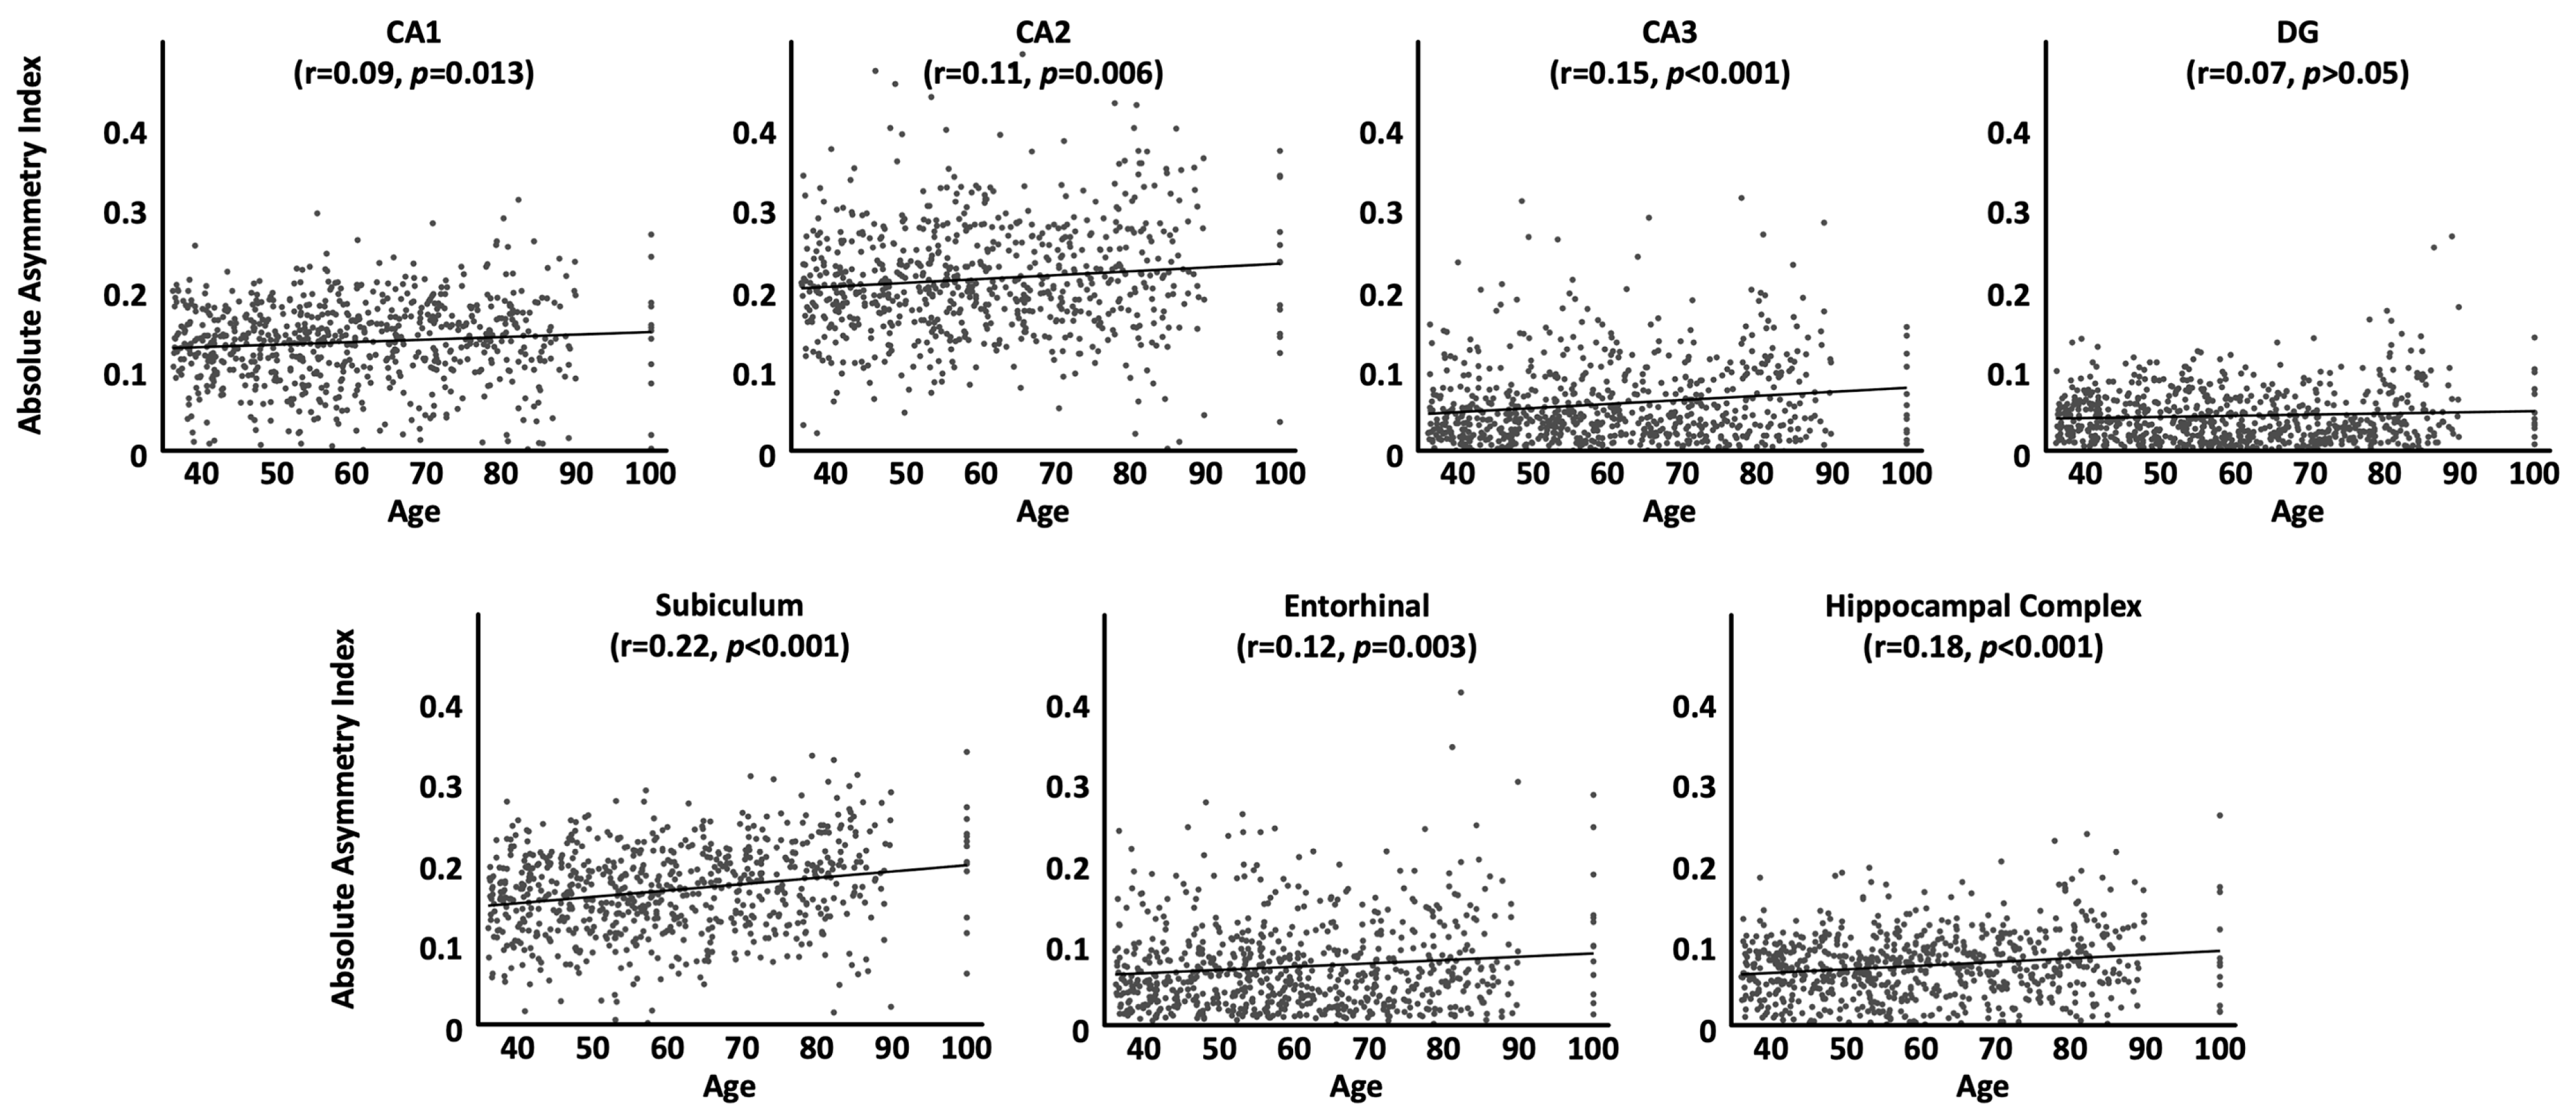
As shown in Table 3 and Figure 1, correlations between the absolute asymmetry index and chronological age were positive for all subregions and also for the hippocampal complex as a whole (i.e., the older the brain, the larger the differences between the two hemispheres), albeit effects were not significant for the dentate gyrus. In other words, the leftward asymmetry of the entorhinal cortex as well as the rightward asymmetry of CA1, CA2, CA3, subiculum, and also the hippocampal complex as a whole becomes significantly more pronounced as we get older.
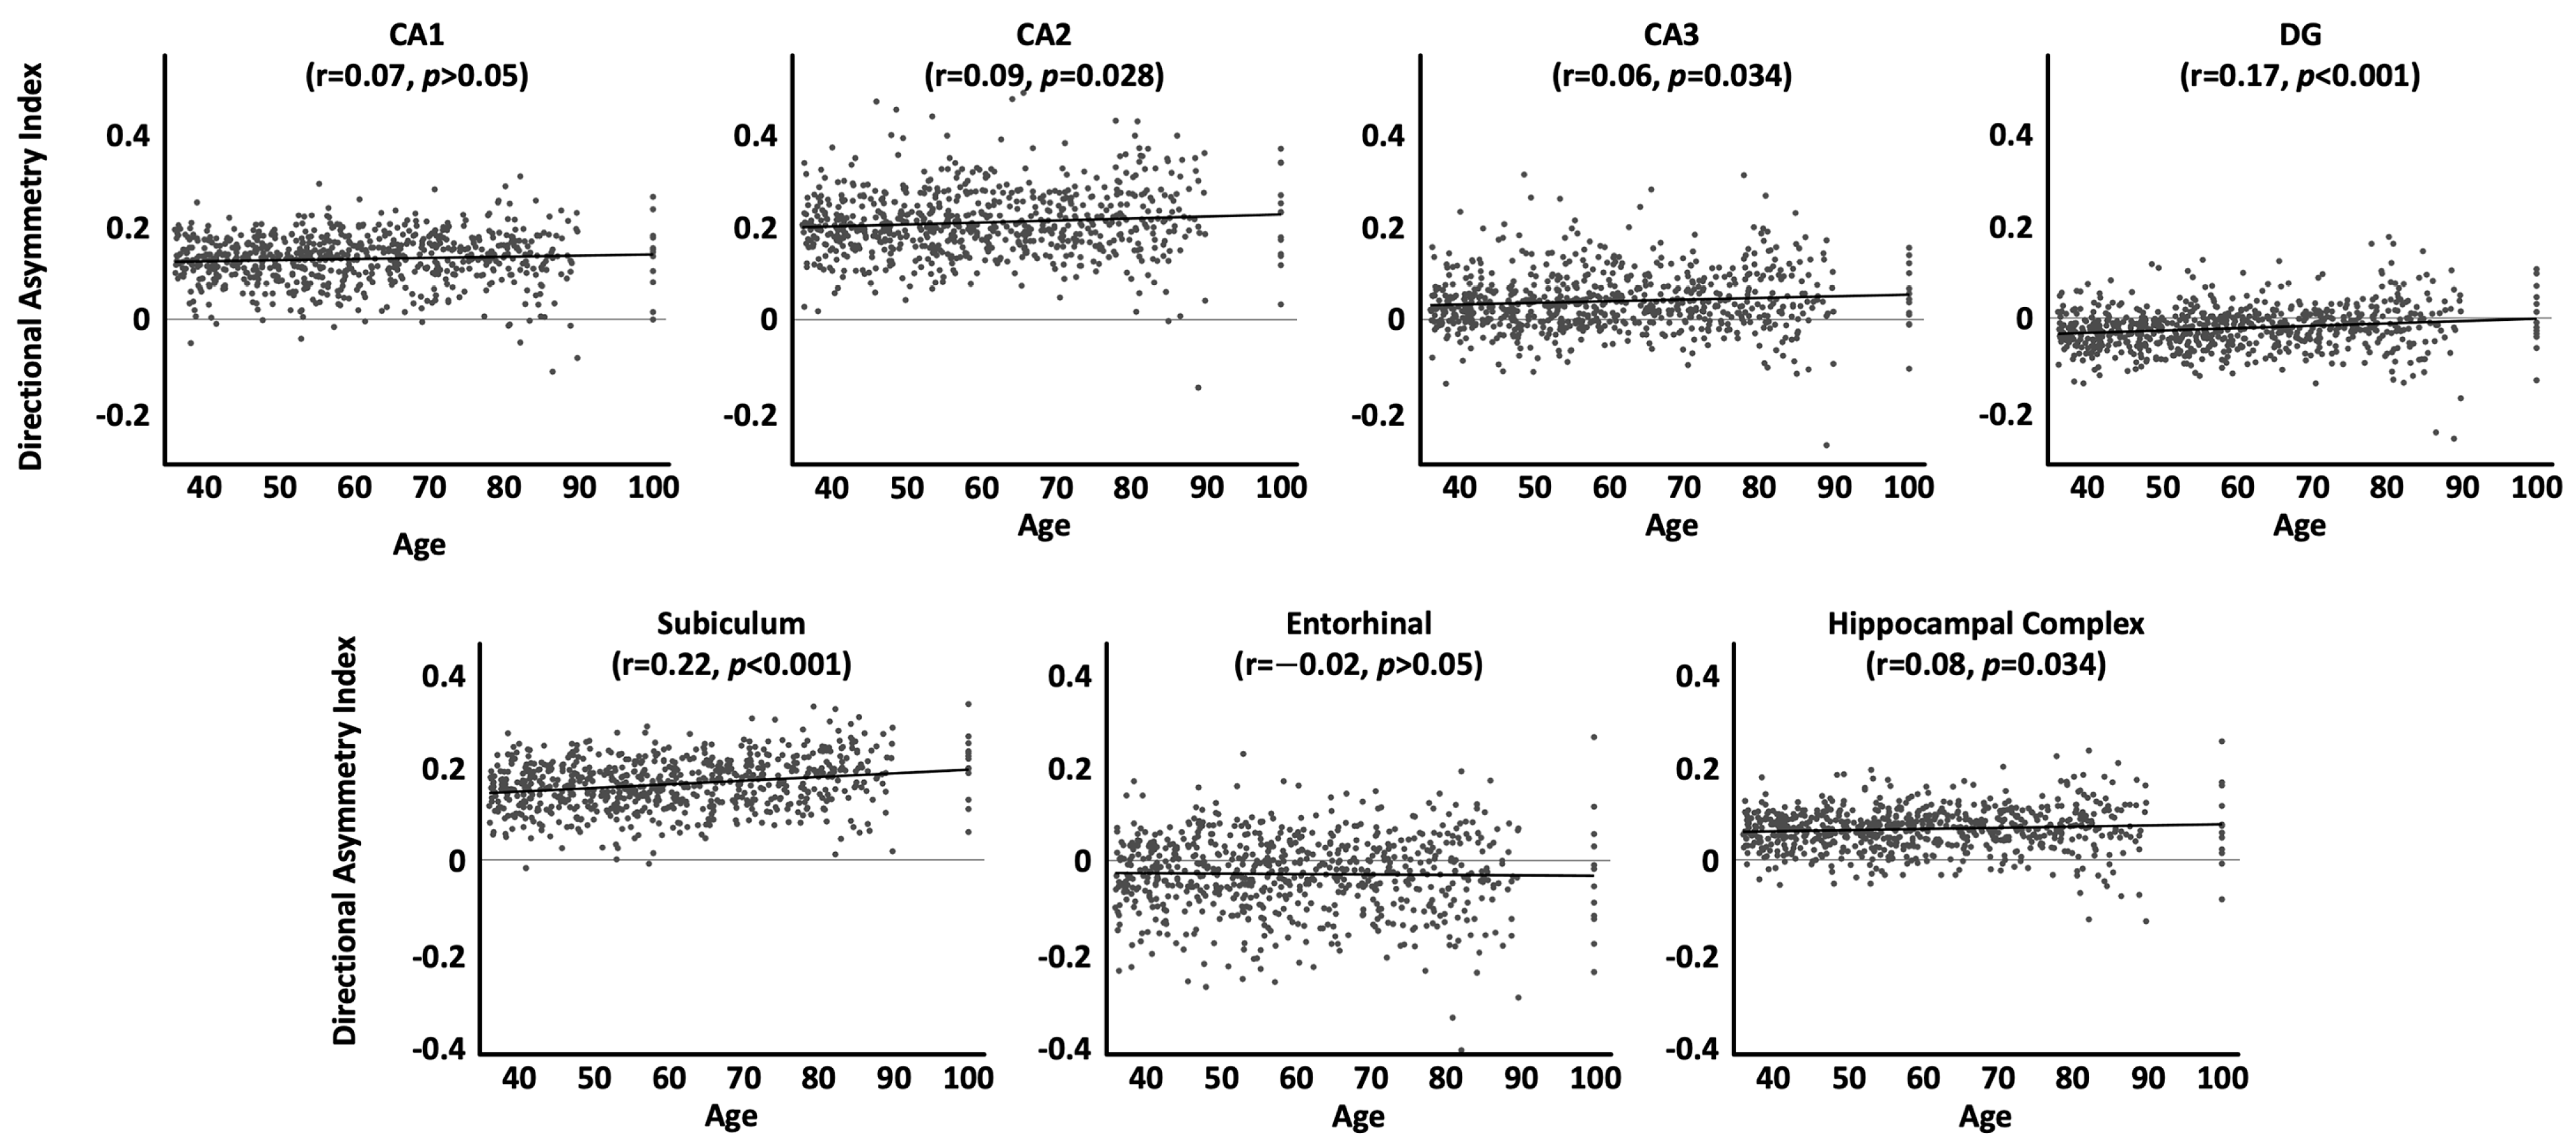
As shown in Table 4 and Figure 2, when using the directional asymmetry index, the aforementioned significant correlations for CA2, CA3, subiculum, and the hippocampal complex as a whole were confirmed. In contrast, the significant correlations for CA1 and the entorhinal cortex were no longer significant. Conversely, the correlation for the dentate gyrus became significant.
4. Discussion
Our study revealed a significant asymmetry in all hippocampal regions as well as significant asymmetry changes with increasing age for most hippocampal regions, except for the dentate gyrus. Significant links between asymmetry and age were positive (i.e., stronger asymmetries at an older age). This suggests that, overall, the left and the right hippocampi seem to become more different over time. In general, this conclusion is in line with findings from a previous study in 398 individuals, which revealed an increasing rightward asymmetry of the hippocampus with increasing age [24]. It also matches, at least to some degree, theories of an accelerated volume loss of the left hemisphere [11] as well as the right hemisphere [8,40]. Moreover, our current findings extend previous ones by adding insights into specific subregions (rather than the hippocampal complex as a whole), both with respect to the magnitude and the direction of asymmetry as well as the correlations between asymmetry and age.
Interestingly, when using the directional asymmetry index, the aforementioned effects pertaining to the absolute asymmetry index could not be replicated for CA1, the entorhinal cortex, or the dentate gyrus. For CA1 and the entorhinal cortex, the previously observed significant link with age was no longer significant; for the dentate gyrus, the previously observed non-significant link became significant. To understand what happened here, we should consult the plots for the directional asymmetry index (Figure 2). Taking the case of CA1 as an example, when visually inspecting the scatterplots and comparing younger ages (e.g., between 40 and 50 years) with older ages (e.g., 80–90 years), there are considerably larger leftward asymmetries as well as slightly larger rightward asymmetries later in life. So, when calculating the directional asymmetry (where leftward asymmetries are marked by negative values and rightward asymmetries by positive values), the increasingly stronger left- and rightward asymmetries over time may cancel each other out (i.e., the net change over time might appear closer to zero), at least enough so that the resulting correlation with age is not significant. In contrast, when using the absolute asymmetry index, there are only positive values regardless of whether asymmetries become more rightward or more leftward over time (i.e., the net change over time is no longer close to zero but rather substantial). As a result, the correlation with age is significant.
The differential outcomes when using the directional and absolute asymmetry index serve as a good reminder that each index has its own strengths and weaknesses: the absolute asymmetry index encodes the magnitude of the difference between the two hemispheres, but lacks information on the direction of the asymmetry, while the directional asymmetry index encodes both the magnitude and direction of asymmetry, but may obscure findings when conducting correlation analyses. The latter effect was explained above using the example of CA1 but should be considered for all subregions: as shown in the scatterplots displaying the directional asymmetry index (Figure 2), there is no single direction of asymmetry for a particular (sub)region across all individuals (albeit one direction might dominate). In our study, most (sub)regions show a rightward asymmetry on average, but there were always individuals who presented with a leftward asymmetry. If asymmetries increase with age, then it is plausible to assume that existing leftward asymmetries might increase just as existing rightward asymmetries do. Using the directional asymmetry index may then underestimate the magnitude of change over time across the sample as shifts in left- and rightward asymmetries would (at least partly) cancel each other out. This effect was also observed in the present study, where the directional asymmetry index yielded slightly different and mostly weaker associations between asymmetry and age than the absolute directional asymmetry index. If sample sizes lack the necessary statistical power, such weaker associations may manifest as non-significant effects in underpowered studies. On this note, effect sizes are small overall (see Table 3 and Table 4), so the significant correlations between hippocampal asymmetry and age in our study may have been the result of our relatively large sample (N = 725).
In summary, asymmetry studies that involve correlation analyses may benefit from using the absolute asymmetry index, preferably in combination with the directional asymmetry index. The latter is still necessary for establishing the direction of asymmetry independent of any correlation, as well as to detect any shifts in the direction of asymmetry over time or in dependence of an intervention, etc. Moreover, future longitudinal studies are needed to confirm the current cross-sectional effects and also to determine if hippocampal asymmetries—and possibly asymmetries in general—always increase over time regardless of whether they are small or large to begin with (leftward or rightward, respectively). Furthermore, given that the subregions of the hippocampal complex serve different brain functions, follow-up research is needed to explore the functional implications within the framework of brain aging, also considering the opposing asymmetries (leftward/rightward) not only across subregions, but also across individuals.
Author Contributions
Conceptualization, F.K. and E.L.; methodology, F.K. and E.L.; formal analysis, F.K.; data curation, F.K.; writing—original draft preparation, F.K. and E.L.; writing—review and editing, F.K. and E.L.; visualization, F.K.; project administration, F.K. and E.L.; funding acquisition, F.K. and E.L. All authors have read and agreed to the published version of the manuscript.
Funding
This research was funded by a Marsden grant to F.K. and E.L. by The Royal Society of New Zealand (20-UOA-045).
Institutional Review Board Statement
The study was conducted in accordance with the Declaration of Helsinki, and approved by the Institutional Review Board at each site where data were collected (Massachusetts General Hospital; University of California, Los Angeles; University of Minnesota; Washington University St. Louis). Additional ethics approval for the analysis of the data was obtained from the University of Auckland (UoA) ethics committee (Protocol No. 022375).
Informed Consent Statement
Informed consent was obtained from all participants involved in the study.
Data Availability Statement
All data were obtained from the Lifespan Human Connectome Project in Aging via the National Institute of Mental Health Data Archive (NDA—https://nda.nih.gov).
Conflicts of Interest
The authors declare no conflict of interest. The funders had no role in the design of the study; in the collection, analyses, or interpretation of data; in the writing of the manuscript; or in the decision to publish the results.
References
- Toga, A.W.; Narr, K.L.; Thompson, P.M.; Luders, E. Brain Asymmetry: Evolution. In Encyclopedia of Neuroscience; Squire, L.R., Ed.; Academic Press: Oxford, UK, 2009; pp. 303–311. [Google Scholar]
- Toga, A.W.; Thompson, P.M. Mapping brain asymmetry. Nat. Rev. Neurosci. 2003, 4, 37–48. [Google Scholar] [CrossRef]
- Corballis, M.C. The evolution and genetics of cerebral asymmetry. Philos. Trans. R. Soc. B Biol. Sci. 2008, 364, 867–879. [Google Scholar] [CrossRef] [PubMed]
- Corballis, M.C. Left Brain, Right Brain: Facts and Fantasies. PLOS Biol. 2014, 12, e1001767. [Google Scholar] [CrossRef]
- Zilles, K.; Dabringhaus, A.; Geyer, S.; Amunts, K.; Qü, M.; Schleicher, A.; Gilissen, E.; Schlaug, G.; Steinmetz, H. Structural Asymmetries in the Human Forebrain and the Forebrain of Non-human Primates and Rats. Neurosci. Biobehav. Rev. 1996, 20, 593–605. [Google Scholar] [CrossRef] [PubMed]
- Ocklenburg, S.; Gunturkun, O. The Lateralized Brain: The Neuroscience and Evolution of Hemispheric Asymmetries; Academic Press: London, UK, 2018. [Google Scholar]
- Cabeza, R. Hemispheric asymmetry reduction in older adults: The HAROLD model. Psychol Aging. 2002, 17, 85–100. [Google Scholar] [CrossRef]
- Dolcos, F.; Rice, H.J.; Cabeza, R. Hemispheric asymmetry and aging: Right hemisphere decline or asymmetry reduction. Neurosci. Biobehav. Rev. 2002, 26, 819–825. [Google Scholar] [CrossRef]
- Minkova, L.; Habich, A.; Peter, J.; Kaller, C.P.; Eickhoff, S.B.; Klöppel, S. Gray matter asymmetries in aging and neurodegeneration: A review and meta-analysis. Hum. Brain Mapp. 2017, 38, 5890–5904. [Google Scholar] [CrossRef] [PubMed]
- Kong, X.-Z.; Mathias, S.R.; Guadalupe, T.; Glahn, D.C.; Franke, B.; Crivello, F.; Tzourio-Mazoyer, N.; Fisher, S.E.; Thompson, P.M.; Francks, C.; et al. Mapping cortical brain asymmetry in 17,141 healthy individuals worldwide via the ENIGMA Consortium. Proc. Natl. Acad. Sci. USA 2018, 115, E5154–E5163. [Google Scholar] [CrossRef]
- Thompson, P.M.; Hayashi, K.M.; de Zubicaray, G.; Janke, A.L.; Rose, S.E.; Semple, J.; Herman, D.; Hong, M.S.; Dittmer, S.S.; Doddrell, D.M.; et al. Dynamics of gray matter loss in Alzheimer’s disease. J. Neurosci. 2003, 23, 994–1005. [Google Scholar] [CrossRef]
- Plessen, K.J.; Hugdahl, K.; Bansal, R.; Hao, X.; Peterson, B.S. Sex, Age, and Cognitive Correlates of Asymmetries in Thickness of the Cortical Mantle Across the Life Span. J. Neurosci. 2014, 34, 6294–6302. [Google Scholar] [CrossRef] [PubMed]
- Berlingeri, M.; Danelli, L.; Bottini, G.; Sberna, M.; Paulesu, E. Reassessing the HAROLD model: Is the hemispheric asymmetry reduction in older adults a special case of compensatory-related utilisation of neural circuits? Exp. Brain Res. 2013, 224, 393–410. [Google Scholar] [CrossRef] [PubMed]
- Nenert, R.; Allendorfer, J.B.; Martin, A.M.; Banks, C.; Vannest, J.; Holland, S.K.; Szaflarski, J.P. Age-related language lateralization assessed by fMRI: The effects of sex and handedness. Brain Res. 2017, 1674, 20–35. [Google Scholar] [CrossRef]
- Reuter-Lorenz, P.A.; Park, D.C. Human Neuroscience and the Aging Mind: A New Look at Old Problems. J. Gerontol. Ser. B 2010, 65, 405–415. [Google Scholar] [CrossRef] [PubMed]
- Hausmann, M.; Güntürkün, O.; Corballis, M. Age-related changes in hemispheric asymmetry depend on sex. Laterality 2003, 8, 277–290. [Google Scholar] [CrossRef] [PubMed]
- Ocklenburg, S.; Gunturkun, O. Hemispheric Asymmetries over the Lifespan. In The Lateralized Brain: The Neuroscience and Evolution of Hemispheric Asymmetries; Academic Press: London, UK, 2018; pp. 263–288. [Google Scholar]
- Fraser, M.A.; Shaw, M.E.; Cherbuin, N. A systematic review and meta-analysis of longitudinal hippocampal atrophy in healthy human ageing. NeuroImage 2015, 112, 364–374. [Google Scholar] [CrossRef] [PubMed]
- Kurth, F.; Cherbuin, N.; Luders, E. The impact of aging on subregions of the hippocampal complex in healthy adults. NeuroImage 2017, 163, 296–300. [Google Scholar] [CrossRef] [PubMed]
- De Flores, R.; La Joie, R.; Chételat, G. Structural imaging of hippocampal subfields in healthy aging and Alzheimer’s disease. Neuroscience 2015, 309, 29–50. [Google Scholar] [CrossRef]
- Mueller, S.; Stables, L.; Du, A.; Schuff, N.; Truran, D.; Cashdollar, N.; Weiner, M. Measurement of hippocampal subfields and age-related changes with high resolution MRI at 4T. Neurobiol. Aging 2007, 28, 719–726. [Google Scholar] [CrossRef] [PubMed]
- Jiang, J.; Sachdev, P.; Lipnicki, D.M.; Zhang, H.; Liu, T.; Zhu, W.; Suo, C.; Zhuang, L.; Crawford, J.; Reppermund, S.; et al. A longitudinal study of brain atrophy over two years in community-dwelling older individuals. NeuroImage 2014, 86, 203–211. [Google Scholar] [CrossRef]
- Raz, N.; Daugherty, A.M.; Bender, A.R.; Dahle, C.L.; Land, S. Volume of the hippocampal subfields in healthy adults: Differential associations with age and a pro-inflammatory genetic variant. Anat. Embryol. 2015, 220, 2663–2674. [Google Scholar] [CrossRef]
- Cherbuin, N.; Réglade-Meslin, C.; Kumar, R.; Sachdev, P.; Anstey, K.J. Mild cognitive disorders are associated with different patterns of brain asymmetry than normal aging: The PATH through life study. Front. Psychiatry 2010, 1, 11. [Google Scholar] [CrossRef]
- Bookheimer, S.Y.; Salat, D.H.; Terpstra, M.; Ances, B.M.; Barch, D.M.; Buckner, R.L.; Burgess, G.C.; Curtiss, S.W.; Diaz-Santos, M.; Elam, J.S.; et al. The Lifespan Human Connectome Project in Aging: An overview. NeuroImage 2019, 185, 335–348. [Google Scholar] [CrossRef] [PubMed]
- Kurth, F.; Cherbuin, N.; Luders, E. Reduced age-related degeneration of the hippocampal subiculum in long-term meditators. Psychiatry Res. 2015, 232, 214–218. [Google Scholar] [CrossRef]
- Kurth, F.; Jancke, L.; Luders, E. Integrating cytoarchitectonic tissue probabilities with MRI-based signal intensities to calculate volumes of interest. Spalletta, G., Gili, T., Piras, F., editors. In Brain Morphometry: Methods and Clinical Applications; Humana Press: New York, NY, USA, 2017; pp. 121–129. [Google Scholar]
- Kurth, F.; Jancke, L.; Luders, E. Sexual dimorphism of Broca’s region: More gray matter in female brains in Brodmann areas 44 and 45. J. Neurosci. Res. 2016, 95, 626–632. [Google Scholar] [CrossRef] [PubMed]
- Luders, E.; Kurth, F.; Toga, A.W.; Narr, K.L.; Gaser, C. Meditation effects within the hippocampal complex revealed by voxel-based morphometry and cytoarchitectonic probabilistic mapping. Front. Psychol. 2013, 4, 398. [Google Scholar] [CrossRef] [PubMed]
- Ashburner, J.; Friston, K.J. Diffeomorphic registration using geodesic shooting and Gauss–Newton optimisation. NeuroImage 2011, 55, 954–967. [Google Scholar] [CrossRef]
- Ashburner, J.; Friston, K.J.; Ashburner, J.; Friston, K.J.; Ashburner, J.; Friston, K.J. Voxel-Based Morphometry—The Methods. NeuroImage 2000, 11, 805–821. [Google Scholar] [CrossRef]
- Good, C.D.; Johnsrude, I.S.; Ashburner, J.; Henson, R.N.A.; Friston, K.J.; Frackowiak, R.S.J. A Voxel-Based Morphometric Study of Ageing in 465 Normal Adult Human Brains. NeuroImage 2001, 14, 21–36. [Google Scholar] [CrossRef]
- Kurth, F.; Luders, E.; Gaser, C. Voxel-based Morphometry. In Brain Mapping: An Encyclopedic Reference; Toga, A., Ed.; Academic Press: London, UK, 2015; pp. 345–349. [Google Scholar]
- Amunts, K.; Kedo, O.; Kindler, M.; Pieperhoff, P.; Mohlberg, H.; Shah, N.; Habel, U.; Schneider, F.; Zilles, K. Cytoarchitectonic mapping of the human amygdala, hippocampal region and entorhinal cortex: Intersubject variability and probability maps. Anat. Embryol. 2005, 210, 343–352. [Google Scholar] [CrossRef]
- Amunts, K.; Mohlberg, H.; Bludau, S.; Caspers, S.; Brandstetter, A.; Eickhoff, S.B.; Pieperhoff, P.; Dickscheid, T. Julich-Brain Atlas-Whole-Brain Collections of Cytoarchitectonic Probabilistic Maps (v2.9). Ebrains 2021. [Google Scholar] [CrossRef]
- Kurth, F.; Gaser, C.; Luders, E. A 12-step user guide for analyzing voxel-wise gray matter asymmetries in statistical parametric mapping (SPM). Nat. Protoc. 2015, 10, 293–304. [Google Scholar] [CrossRef] [PubMed]
- Kurth, F.; Thompson, P.M.; Luders, E. Investigating the differential contributions of sex and brain size to gray matter asymmetry. Cortex 2018, 99, 235–242. [Google Scholar] [CrossRef] [PubMed]
- Benjamini, Y.; Hochberg, Y. Controlling the False Discovery Rate: A Practical and Powerful Approach to Multiple Testing. J. R. Stat. Soc. Ser. B Methodol. 1995, 57, 289–300. [Google Scholar] [CrossRef]
- Benjamini, Y.; Yekutieli, D. The control of the false discovery rate in multiple testing under dependency. Ann. Stat. 2001, 29, 1165–1188. [Google Scholar] [CrossRef]
- Brown, J.W.; Jaffe, J. Hypothesis on cerebral dominance. Neuropsychologia 1975, 13, 107–110. [Google Scholar] [CrossRef] [PubMed]
Figure 1.
Associations between age and the absolute asymmetry index by subregion, adjusted for sex, handedness, TIV, and site effects. All correlation coefficients are positive, indicating an increase in asymmetry with age. Significance values are corrected for multiple comparisons.
Figure 1.
Associations between age and the absolute asymmetry index by subregion, adjusted for sex, handedness, TIV, and site effects. All correlation coefficients are positive, indicating an increase in asymmetry with age. Significance values are corrected for multiple comparisons.

Figure 2.
Associations between age and the directional asymmetry index by subregion, adjusted for sex, handedness, TIV, and site effects. Positive values denote a rightward asymmetry, negative values a leftward asymmetry. Significance values are corrected for multiple comparisons.
Figure 2.
Associations between age and the directional asymmetry index by subregion, adjusted for sex, handedness, TIV, and site effects. Positive values denote a rightward asymmetry, negative values a leftward asymmetry. Significance values are corrected for multiple comparisons.


Table 1.
Descriptive statistics.
| Variable | Statistics |
|---|---|
| N | 725 |
| Sex (F/M) | 406/319 |
| Age (Mean ± SD [range]) | 60.36 ± 15.73 [36–100] |
| Handedness (L/R) | 76/649 |
| Handedness Score (Mean ± SD (range)) | 66.92 ± 48.76 [−100–100] |
| TIV (Mean ± SD (range)) | 1.453 ± 152 [1.021–1.959] liters |
| N by Site (MGH, UCLA, UMinn, WashU) | 163, 148, 205, 209 |
F = females; M = males, SD = standard deviation; TIV = total intracranial volume; MGH = Massachusetts General Hospital; UCLA = University of California, Los Angeles; UMinn = University of Minnesota; WashU = Washington University St. Louis
Table 2.
Hippocampal asymmetries (directional) at the sample mean age (60.36 years).
| Region | Change in Asymmetry | Cohen’s d | T|df | p, Corrected |
|---|---|---|---|---|
| CA1 | rightward | 1.14 | 30.5|720 | <0.001 |
| CA2 | rightward | 1.39 | 37.4|720 | <0.001 |
| CA3 | rightward | 0.30 | 7.9|720 | <0.001 |
| DG | leftward | −0.22 | −5.9|720 | <0.001 |
| Subiculum | rightward | 1.45 | 38.9|720 | <0.001 |
| Entorhinal | leftward | −0.17 | −4.4|720 | <0.001 |
| Hippo | rightward | 0.68 | 18.2|720 | <0.001 |
CA1, 2, 3 = cornu ammonis 1, 2, 3; DG = dentate gyrus; df = degrees of freedom.
Table 3.
Pearson correlation between age and hippocampal asymmetries (absolute).
| Region | Change in Magnitude | Correlation Coefficient (r) | T|df | p, Corrected |
|---|---|---|---|---|
| CA1 | increase | 0.09 | 2.5|720 | 0.013 |
| CA2 | increase | 0.11 | 2.9|720 | 0.006 |
| CA3 | increase | 0.15 | 4.2|720 | <0.001 |
| DG | not significant | 0.07 | 1.8|720 | 0.073 |
| Subiculum | increase | 0.22 | 6.2|720 | <0.001 |
| Entorhinal | increase | 0.12 | 3.1|720 | 0.003 |
| Hippo | increase | 0.18 | 4.8|720 | <0.001 |
CA1, 2, 3 = cornu ammonis 1, 2, 3; DG = dentate gyrus; df = degrees of freedom.
Table 4.
Pearson correlation between age and hippocampal asymmetries (directional).
| Region | Change in Asymmetry|Change in Magnitude | Correlation Coefficient (r) | T|df | p, Corrected |
|---|---|---|---|---|
| CA1 | not significant | 0.07 | 1.9|720 | 0.067 |
| CA2 | rightward|increase | 0.09 | 2.5|720 | 0.028 |
| CA3 | rightward|increase | 0.06 | 2.3|720 | 0.034 |
| DG | leftward|decrease | 0.17 | 4.5|720 | <0.001 |
| Subiculum | rightward|increase | 0.22 | 6.2|720 | <0.001 |
| Entorhinal | not significant | −0.02 | 0.5|720 | 0.645 |
| Hippo | rightward|increase | 0.08 | 2.3|720 | 0.034 |
CA1, 2, 3 = cornu ammonis 1, 2, 3; DG = dentate gyrus; df = degrees of freedom.
Disclaimer/Publisher’s Note: The statements, opinions and data contained in all publications are solely those of the individual author(s) and contributor(s) and not of MDPI and/or the editor(s). MDPI and/or the editor(s) disclaim responsibility for any injury to people or property resulting from any ideas, methods, instructions or products referred to in the content. |
© 2023 by the authors. Licensee MDPI, Basel, Switzerland. This article is an open access article distributed under the terms and conditions of the Creative Commons Attribution (CC BY) license (https://creativecommons.org/licenses/by/4.0/).
Share and Cite
MDPI and ACS Style
Kurth, F.; Luders, E. Hippocampal Asymmetry Increases with Age. Anatomia 2023, 2, 328-335. https://doi.org/10.3390/anatomia2040029
AMA Style
Kurth F, Luders E. Hippocampal Asymmetry Increases with Age. Anatomia. 2023; 2(4):328-335. https://doi.org/10.3390/anatomia2040029
Chicago/Turabian StyleKurth, Florian, and Eileen Luders. 2023. "Hippocampal Asymmetry Increases with Age" Anatomia 2, no. 4: 328-335. https://doi.org/10.3390/anatomia2040029