
The Effects of Regional Muscle Strength and Mass on Standing Long Jump Performance

Abstract
:1. Introduction
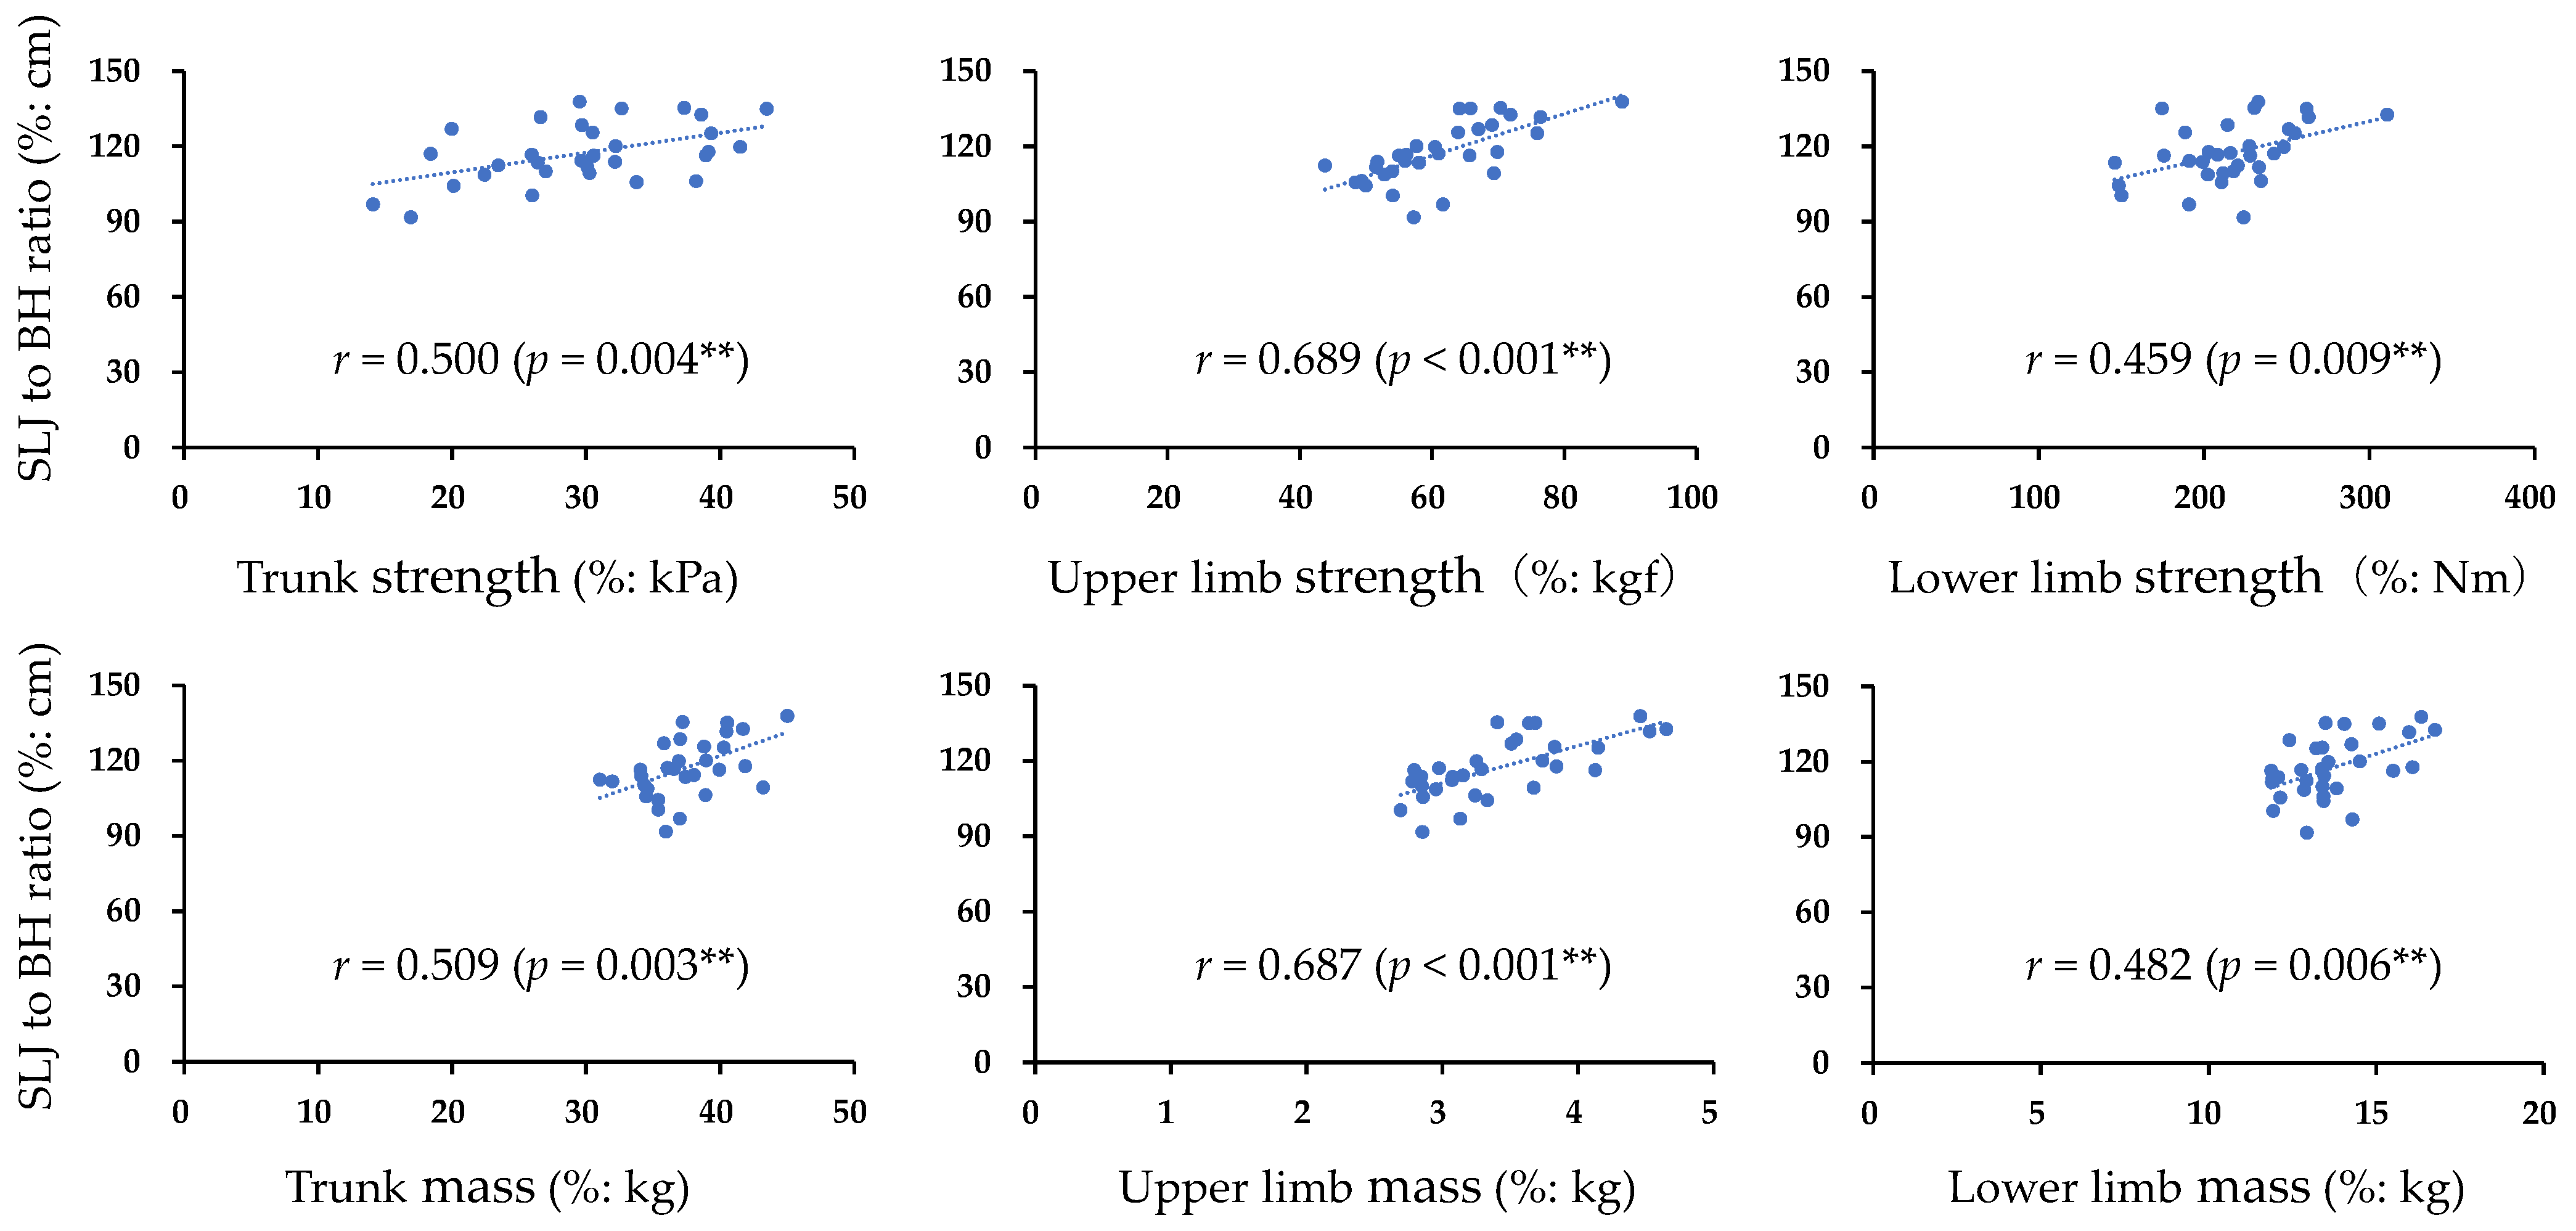
2. Results
3. Discussion
4. Materials and Methods
4.1. Participants
4.2. Ethics
4.3. Study Design and Procedures
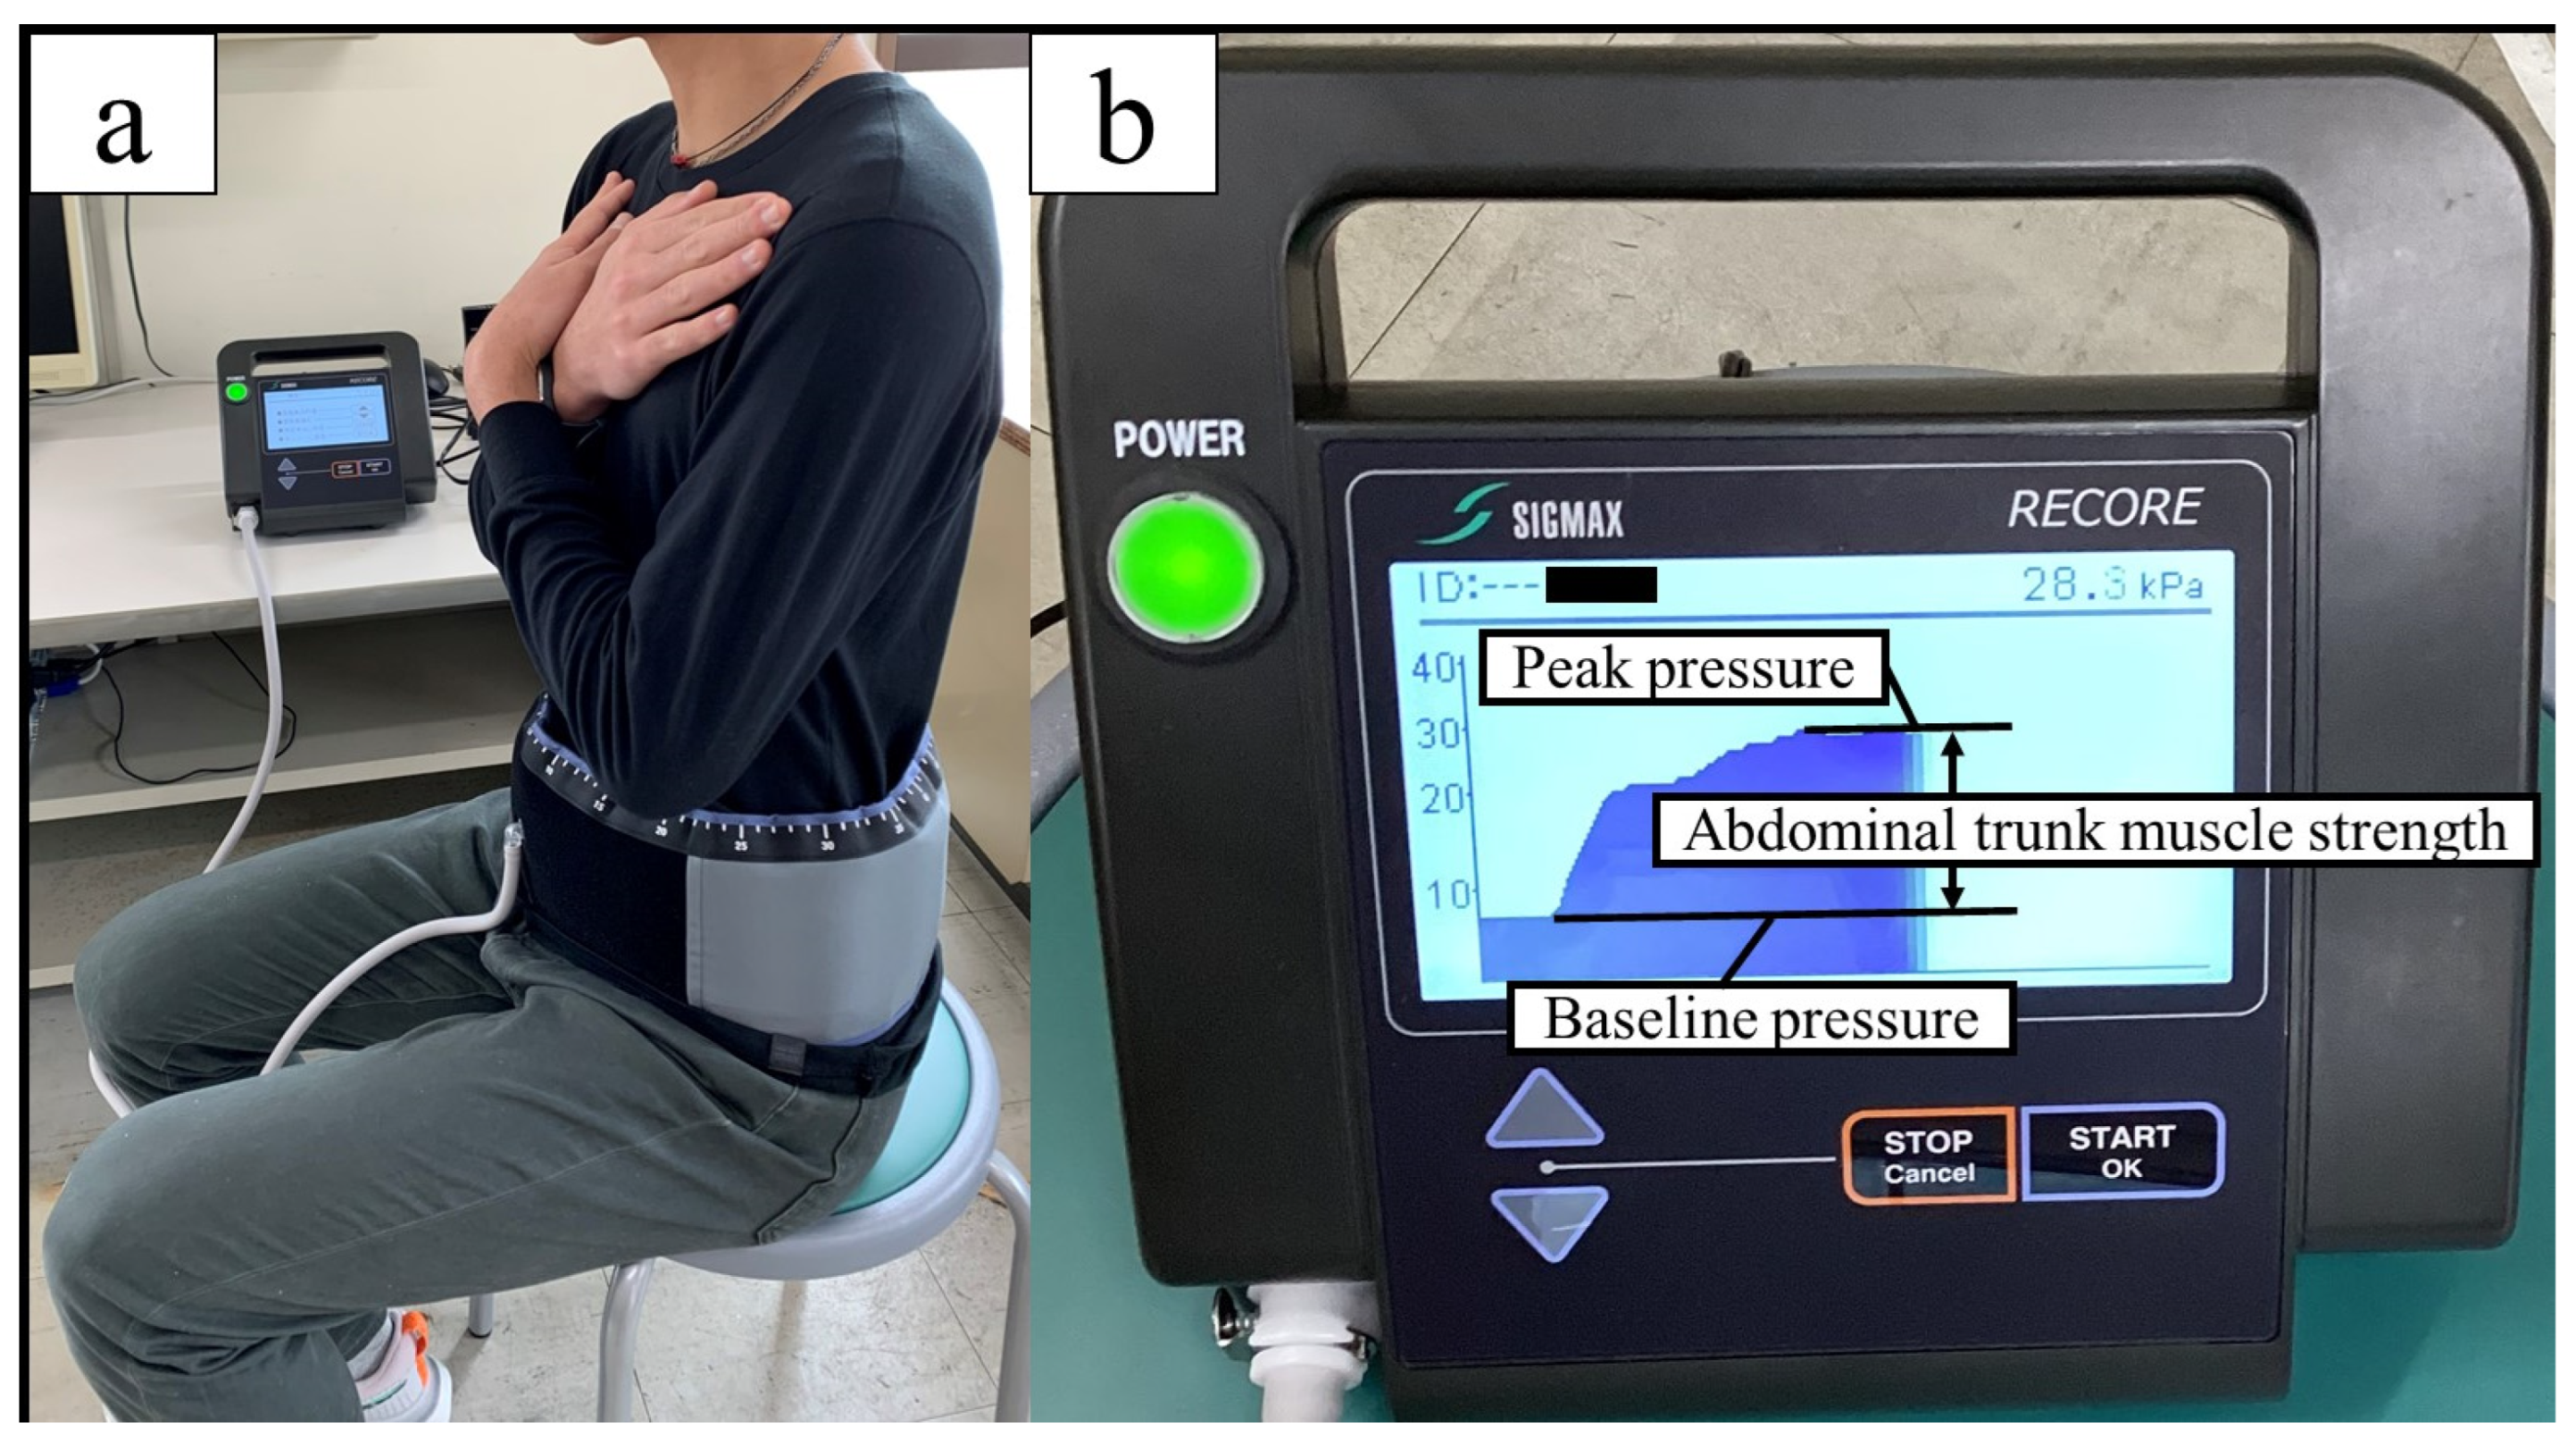
4.4. Measurement Methods
4.5. Statistical Analysis
5. Conclusions
Author Contributions
Funding
Institutional Review Board Statement
Informed Consent Statement
Data Availability Statement
Acknowledgments
Conflicts of Interest
References
- Schoenfeld, B.J.; Ogborn, D.; Krieger, J.W. Dose-Response Relationship between Weekly Resistance Training Volume and Increases in Muscle Mass: A Systematic Review and Meta-Analysis. J. Sports Sci. 2017, 35, 1073–1082. [Google Scholar] [CrossRef] [PubMed]
- Häkkinen, K.; Alén, M.; Komi, P.V. Neuromuscular, Anaerobic, and Aerobic Performance Characteristics of Elite Power Athletes. Eur. J. Appl. Physiol. Occup. Physiol. 1984, 53, 97–105. [Google Scholar] [CrossRef]
- Taber, C.B.; Vigotsky, A.; Nuckols, G.; Haun, C.T. Exercise-Induced Myofibrillar Hypertrophy Is a Contributory Cause of Gains in Muscle Strength. Sports Med. 2019, 49, 993–997. [Google Scholar] [CrossRef] [PubMed]
- Howe, L.P.; Read, P.; Waldron, M. Muscle Hypertrophy: A Narrative Review on Training Principles for Increasing Muscle Mass. Strength Cond. J. 2017, 39, 72–81. [Google Scholar] [CrossRef]
- Loenneke, J.P. Muscle Growth Does Not Contribute to the Increases in Strength That Occur after Resistance Training. Med. Sci. Sports Exerc. 2021, 53, 2011–2014. [Google Scholar] [CrossRef]
- Folland, J.P.; Balshaw, T.G. Muscle Growth Does Contribute to the Increases in Strength That Occur after Resistance Training. Med. Sci. Sports Exerc. 2021, 53, 2006–2010. [Google Scholar] [CrossRef]
- Kraemer, W.J.; Ratamess, N.A. Fundamentals of Resistance Training: Progression and Exercise Prescription. Med. Sci. Sports Exerc. 2004, 36, 674–688. [Google Scholar] [CrossRef]
- Kibler, W.B.; Press, J.; Sciascia, A. The Role of Core Stability in Athletic Function. Sports Med. 2006, 36, 189–198. [Google Scholar] [CrossRef]
- De Blaiser, C.; Roosen, P.; Willems, T.; Danneels, L.; Bossche, L.V.; De Ridder, R. Is Core Stability a Risk Factor for Lower Extremity Injuries in an Athletic Population? A Systematic Review. Phys. Ther. Sport 2018, 30, 48–56. [Google Scholar] [CrossRef]
- Bauer, J.; Gruber, M.; Muehlbauer, T. Correlations between Core Muscle Strength Endurance and Upper-Extremity Performance in Adolescent Male Sub-Elite Handball Players. Front. Sport. Act. Living 2022, 4, 1050279. [Google Scholar] [CrossRef]
- Ashby, B.M.; Delp, S.L. Optimal Control Simulations Reveal Mechanisms by Which Arm Movement Improves Standing Long Jump Performance. J. Biomech. 2006, 39, 1726–1734. [Google Scholar] [CrossRef] [PubMed]
- Deng, N.; Soh, K.G.; Zaremohzzabieh, Z.; Abdullah, B.; Salleh, K.M.; Huang, D. Effects of Combined Upper and Lower Limb Plyometric Training Interventions on Physical Fitness in Athletes: A Systematic Review with Meta-Analysis. Int. J. Environ. Res. Public Health 2022, 20, 482. [Google Scholar] [CrossRef]
- Roth, R.; Donath, L.; Kurz, E.; Zahner, L.; Faude, O. Absolute and Relative Reliability of Isokinetic and Isometric Trunk Strength Testing Using the IsoMed-2000 Dynamometer. Phys. Ther. Sport 2017, 24, 26–31. [Google Scholar] [CrossRef] [PubMed]
- Hori, Y.; Hoshino, M.; Inage, K.; Miyagi, M.; Takahashi, S.; Ohyama, S.; Suzuki, A.; Tsujio, T.; Terai, H.; Dohzono, S.; et al. ISSLS PRIZE IN CLINICAL SCIENCE 2019: Clinical Importance of Trunk Muscle Mass for Low Back Pain, Spinal Balance, and Quality of Life-a Multicenter Cross-Sectional Study. Eur. Spine J. 2019, 28, 914–921. [Google Scholar] [CrossRef] [PubMed]
- Castro-Piñero, J.; Ortega, F.B.; Artero, E.G.; Girela-Rejón, M.J.; Mora, J.; Sjöström, M.; Ruiz, J.R. Assessing Muscular Strength in Youth: Usefulness of Standing Long Jump as a General Index of Muscular Fitness. J. Strength Cond. Res. 2010, 24, 1810–1817. [Google Scholar] [CrossRef] [PubMed]
- Markovic, G.; Dizdar, D.; Jukic, I.; Cardinale, M. Reliability and Factorial Validity of Squat and Countermovement Jump Tests. J. Strength Cond. Res. 2004, 18, 551–555. [Google Scholar] [CrossRef] [PubMed]
- Wakai, M.; Linthorne, N.P. Optimum Take-off Angle in the Standing Long Jump. Hum. Mov. Sci. 2005, 24, 81–96. [Google Scholar] [CrossRef] [PubMed]
- Chen, C.-F.; Wu, H.-J. The Effect of an 8-Week Rope Skipping Intervention on Standing Long Jump Performance. Int. J. Environ. Res. Public Health 2022, 19, 8472. [Google Scholar] [CrossRef]
- Harman, E.A.; Rosenstein, M.T.; Frykman, P.N.; Rosenstein, R.M. The Effects of Arms and Countermovement on Vertical Jumping. Med. Sci. Sports Exerc. 1990, 22, 825–833. [Google Scholar] [CrossRef]
- Lees, A.; Vanrenterghem, J.; De Clercq, D. Understanding How an Arm Swing Enhances Performance in the Vertical Jump. J. Biomech. 2004, 37, 1929–1940. [Google Scholar] [CrossRef]
- Cummings, P.M.; Waldman, H.S.; Krings, B.M.; Smith, J.W.; McAllister, M.J. Effects of Fat Grip Training on Muscular Strength and Driving Performance in Division I Male Golfers. J. Strength Cond. Res. 2018, 32, 205–210. [Google Scholar] [CrossRef]
- Brown, S.J.; Nevill, A.M.; Monk, S.A.; Otto, S.R.; Selbie, W.S.; Wallace, E.S. Determination of the Swing Technique Characteristics and Performance Outcome Relationship in Golf Driving for Low Handicap Female Golfers. J. Sports Sci. 2011, 29, 1483–1491. [Google Scholar] [CrossRef] [PubMed]
- Vleeming, A.; Schuenke, M.D.; Danneels, L.; Willard, F.H. The Functional Coupling of the Deep Abdominal and Paraspinal Muscles: The Effects of Simulated Paraspinal Muscle Contraction on Force Transfer to the Middle and Posterior Layer of the Thoracolumbar Fascia. J. Anat. 2014, 225, 447–462. [Google Scholar] [CrossRef]
- Willson, J.D.; Dougherty, C.P.; Ireland, M.L.; Davis, I.M. Core Stability and Its Relationship to Lower Extremity Function and Injury. J. Am. Acad. Orthop. Surg. 2005, 13, 316–325. [Google Scholar] [CrossRef] [PubMed]
- Akuthota, V.; Ferreiro, A.; Moore, T.; Fredericson, M. Core Stability Exercise Principles. Curr. Sports Med. Rep. 2008, 7, 39–44. [Google Scholar] [CrossRef] [PubMed]
- Okubo, Y.; Kaneoka, K.; Shiina, I.; Tatsumura, M.; Miyakawa, S. Abdominal Muscle Activity during a Standing Long Jump. J. Orthop. Sports Phys. Ther. 2013, 43, 577–582. [Google Scholar] [CrossRef] [PubMed]
- Hodges, P.W.; Richardson, C.A. Feedforward Contraction of Transversus Abdominis Is Not Influenced by the Direction of Arm Movement. Exp. Brain Res. 1997, 114, 362–370. [Google Scholar] [CrossRef]
- Jamison, S.T.; McNeilan, R.J.; Young, G.S.; Givens, D.L.; Best, T.M.; Chaudhari, A.M.W. Randomized Controlled Trial of the Effects of a Trunk Stabilization Program on Trunk Control and Knee Loading. Med. Sci. Sports Exerc. 2012, 44, 1924–1934. [Google Scholar] [CrossRef]
- Butcher, S.J.; Craven, B.R.; Chilibeck, P.D.; Spink, K.S.; Grona, S.L.; Sprigings, E.J. The Effect of Trunk Stability Training on Vertical Takeoff Velocity. J. Orthop. Sports Phys. Ther. 2007, 37, 223–231. [Google Scholar] [CrossRef]
- Häkkinen, K.; Keskinen, K.L. Muscle Cross-Sectional Area and Voluntary Force Production Characteristics in Elite Strength- and Endurance-Trained Athletes and Sprinters. Eur. J. Appl. Physiol. Occup. Physiol. 1989, 59, 215–220. [Google Scholar] [CrossRef]
- Zamparo, P.; Minetti, A.E.; di Prampero, P.E. Interplay among the Changes of Muscle Strength, Cross-Sectional Area and Maximal Explosive Power: Theory and Facts. Eur. J. Appl. Physiol. 2002, 88, 193–202. [Google Scholar] [CrossRef] [PubMed]
- Minetti, A.E. On the Mechanical Power of Joint Extensions as Affected by the Change in Muscle Force (or Cross-Sectional Area), Ceteris Paribus. Eur. J. Appl. Physiol. 2002, 86, 363–369. [Google Scholar] [CrossRef] [PubMed]
- Krivickas, L.S.; Dorer, D.J.; Ochala, J.; Frontera, W.R. Relationship between Force and Size in Human Single Muscle Fibres. Exp. Physiol. 2011, 96, 539–547. [Google Scholar] [CrossRef] [PubMed]
- Balshaw, T.G.; Massey, G.J.; Maden-Wilkinson, T.M.; Morales-Artacho, A.J.; McKeown, A.; Appleby, C.L.; Folland, J.P. Changes in Agonist Neural Drive, Hypertrophy and Pre-Training Strength All Contribute to the Individual Strength Gains after Resistance Training. Eur. J. Appl. Physiol. 2017, 117, 631–640. [Google Scholar] [CrossRef] [PubMed]
- Frost, D.M.; Cronin, J.; Newton, R.U. A Biomechanical Evaluation of Resistance: Fundamental Concepts for Training and Sports Performance. Sports Med. 2010, 40, 303–326. [Google Scholar] [CrossRef] [PubMed]
- Lewis, D.A.; Kamon, E.; Hodgson, J.L. Physiological Differences between Genders. Implications for Sports Conditioning. Sports Med. 1986, 3, 357–369. [Google Scholar] [CrossRef] [PubMed]
- Gava, P.; Kern, H.; Carraro, U. Age-Associated Power Decline from Running, Jumping, and Throwing Male Masters World Records. Exp. Aging Res. 2015, 41, 115–135. [Google Scholar] [CrossRef]
- Gava, P.; Ravara, B. Master World Records Show Minor Gender Differences of Performance Decline with Aging. Eur. J. Transl. Myol. 2019, 29, 8327. [Google Scholar] [CrossRef]
- Sheppard, J.M.; Young, W.B. Agility Literature Review: Classifications, Training and Testing. J. Sports Sci. 2006, 24, 919–932. [Google Scholar] [CrossRef]
- Kang, H. Sample Size Determination and Power Analysis Using the G*Power Software. J. Educ. Eval. Health Prof. 2021, 18, 17. [Google Scholar] [CrossRef]
- Su, H.; Chang, N.-J.; Wu, W.-L.; Guo, L.-Y.; Chu, I.-H. Acute Effects of Foam Rolling, Static Stretching, and Dynamic Stretching During Warm-Ups on Muscular Flexibility and Strength in Young Adults. J. Sport Rehabil. 2017, 26, 469–477. [Google Scholar] [CrossRef]
- van den Helder, J.; Verreijen, A.M.; van Dronkelaar, C.; Memelink, R.G.; Engberink, M.F.; Engelbert, R.H.H.; Weijs, P.J.M.; Tieland, M. Bio-Electrical Impedance Analysis: A Valid Assessment Tool for Diagnosis of Low Appendicular Lean Mass in Older Adults? Front. Nutr. 2022, 9, 874980. [Google Scholar] [CrossRef] [PubMed]
- Verney, J.; Schwartz, C.; Amiche, S.; Pereira, B.; Thivel, D. Comparisons of a Multi-Frequency Bioelectrical Impedance Analysis to the Dual-Energy X-Ray Absorptiometry Scan in Healthy Young Adults Depending on Their Physical Activity Level. J. Hum. Kinet. 2015, 47, 73–80. [Google Scholar] [CrossRef] [PubMed]
- Campa, F.; Toselli, S.; Mazzilli, M.; Gobbo, L.A.; Coratella, G. Assessment of Body Composition in Athletes: A Narrative Review of Available Methods with Special Reference to Quantitative and Qualitative Bioimpedance Analysis. Nutrients 2021, 13, 1620. [Google Scholar] [CrossRef] [PubMed]
- Nakai, Y.; Oe, K.; Matsuno, R.; Kiyama, R.; Kawada, M.; Takeshita, Y.; Miyazaki, T.; Araki, S. Effect of Self-Myofascial Release of the Lower Back on Myofascial Gliding, Lumbar Flexibility, and Abdominal Trunk Muscle Strength: A Crossover Study. Sports 2023, 11, 147. [Google Scholar] [CrossRef] [PubMed]
- Kato, S.; Murakami, H.; Inaki, A.; Mochizuki, T.; Demura, S.; Nakase, J.; Yoshioka, K.; Yokogawa, N.; Igarashi, T.; Takahashi, N.; et al. Innovative Exercise Device for the Abdominal Trunk Muscles: An Early Validation Study. PLoS ONE 2017, 12, e0172934. [Google Scholar] [CrossRef]
- Monfort-Pañego, M.; Vera-García, F.J.; Sánchez-Zuriaga, D.; Sarti-Martínez, M.A. Electromyographic Studies in Abdominal Exercises: A Literature Synthesis. J. Manip. Physiol. Ther. 2009, 32, 232–244. [Google Scholar] [CrossRef] [PubMed]
- Zhou, J.; Wiggermann, N. Ergonomic Evaluation of Brake Pedal and Push Handle Locations on Hospital Beds. Appl. Ergon. 2017, 60, 305–312. [Google Scholar] [CrossRef]
- Ning, X.; Zhou, J.; Dai, B.; Jaridi, M. The Assessment of Material Handling Strategies in Dealing with Sudden Loading: The Effects of Load Handling Position on Trunk Biomechanics. Appl. Ergon. 2014, 45, 1399–1405. [Google Scholar] [CrossRef]
- Essendrop, M.; Schibye, B.; Hansen, K. Reliability of Isometric Muscle Strength Tests for the Trunk, Hands and Shoulders. Int. J. Ind. Ergon. 2001, 28, 379–387. [Google Scholar] [CrossRef]
- Cram, J.R.; Kasman, G.S.; Holtz, J. Introduction to Surface Electromyography; Aspen Publishers: Gaithersburg, MD, USA, 1998; ISBN 9780834207516. [Google Scholar]
- SENIAM Sensor Locations. Available online: http://seniam.org/sensor_location.htm (accessed on 15 March 2019).
- Stevens, V.K.; Bouche, K.G.; Mahieu, N.N.; Coorevits, P.L.; Vanderstraeten, G.G.; Danneels, L.A. Trunk Muscle Activity in Healthy Subjects during Bridging Stabilization Exercises. BMC Musculoskelet. Disord. 2006, 7, 75. [Google Scholar] [CrossRef] [PubMed]
- Peterson, K.F.; Kendall, M.E.; Geise, P.P.; McIntyre, R.M.; Anthony, R.W. Muscles: Testing and Function with Posture and Pain; Lippincott Williams & Wilkins: Philadelphia, PA, USA, 2005; ISBN 9780781747806. [Google Scholar]
- Cronin, J.; Lawton, T.; Harris, N.; Kilding, A.; McMaster, D.T. A Brief Review of Handgrip Strength and Sport Performance. J. Strength Cond. Res. 2017, 31, 3187–3217. [Google Scholar] [CrossRef] [PubMed]
- Roman-Liu, D.; Tokarski, T.; Mazur-Różycka, J. Is the Grip Force Measurement Suitable for Assessing Overall Strength Regardless of Age and Gender? Measurement 2021, 176, 109093. [Google Scholar] [CrossRef]
- Forman, D.A.; Forman, G.N.; Robathan, J.; Holmes, M.W.R. The Influence of Simultaneous Handgrip and Wrist Force on Forearm Muscle Activity. J. Electromyogr. Kinesiol. 2019, 45, 53–60. [Google Scholar] [CrossRef] [PubMed]
- Drouin, J.M.; Valovich-mcLeod, T.C.; Shultz, S.J.; Gansneder, B.M.; Perrin, D.H. Reliability and Validity of the Biodex System 3 pro Isokinetic Dynamometer Velocity, Torque and Position Measurements. Eur. J. Appl. Physiol. 2004, 91, 22–29. [Google Scholar] [CrossRef]
- Hoffman, M.; Schrader, J.; Applegate, T.; Koceja, D. Unilateral Postural Control of the Functionally Dominant and Nondominant Extremities of Healthy Subjects. J. Athl. Train. 1998, 33, 319–322. [Google Scholar] [PubMed]
- Hillermann, B.; Gomes, A.N.; Korporaal, C.; Jackson, D. A Pilot Study Comparing the Effects of Spinal Manipulative Therapy with Those of Extra-Spinal Manipulative Therapy on Quadriceps Muscle Strength. J. Manip. Physiol. Ther. 2006, 29, 145–149. [Google Scholar] [CrossRef] [PubMed]
- Bohannon, R.W. Dynamometer Measurements of Grip and Knee Extension Strength: Are They Indicative of Overall Limb and Trunk Muscle Strength? Percept. Mot. Ski. 2009, 108, 339–342. [Google Scholar] [CrossRef]
- Granacher, U.; Schellbach, J.; Klein, K.; Prieske, O.; Baeyens, J.-P.; Muehlbauer, T. Effects of Core Strength Training Using Stable versus Unstable Surfaces on Physical Fitness in Adolescents: A Randomized Controlled Trial. BMC Sport. Sci. Med. Rehabil. 2014, 6, 40. [Google Scholar] [CrossRef]


| Variables | |||
|---|---|---|---|
| Age (years) | 20.3 | ± | 1.4 |
| Height (cm) | 165.7 | ± | 9.0 |
| Weight (kg) | 62.4 | ± | 12.2 |
| Body mass index (kg/m2) | 22.6 | ± | 3.4 |
| Muscle strength to BW ratio | |||
| Trunk (%: kPa) | 29.8 | ± | 7.6 |
| Upper limb (%: kgf) | 61.2 | ± | 9.9 |
| Lower limb (%: Nm) | 215.8 | ± | 36.2 |
| Muscle mass to BW ratio | |||
| Trunk (%: kg) | 37.5 | ± | 3.2 |
| Upper limb (%: kg) | 3.4 | ± | 0.5 |
| Lower limb (%: kg) | 13.7 | ± | 1.4 |
| SLJ to BH ratio (%: cm) | 117.3 | ± | 11.9 |
| Normalized Variables | p | β | 95% CI | VIF |
|---|---|---|---|---|
| Trunk strength | 0.006 ** | 0.367 | 0.184–0.972 | 1.050 |
| Upper limb strength | <0.001 ** | 0.608 | 0.432–1.036 | 1.050 |
Disclaimer/Publisher’s Note: The statements, opinions and data contained in all publications are solely those of the individual author(s) and contributor(s) and not of MDPI and/or the editor(s). MDPI and/or the editor(s) disclaim responsibility for any injury to people or property resulting from any ideas, methods, instructions or products referred to in the content. |
© 2024 by the authors. Licensee MDPI, Basel, Switzerland. This article is an open access article distributed under the terms and conditions of the Creative Commons Attribution (CC BY) license (https://creativecommons.org/licenses/by/4.0/).
Share and Cite
Nakai, Y.; Usumoto, Y.; Takeshita, Y. The Effects of Regional Muscle Strength and Mass on Standing Long Jump Performance. Muscles 2024, 3, 60-70. https://doi.org/10.3390/muscles3010007
Nakai Y, Usumoto Y, Takeshita Y. The Effects of Regional Muscle Strength and Mass on Standing Long Jump Performance. Muscles. 2024; 3(1):60-70. https://doi.org/10.3390/muscles3010007
Chicago/Turabian StyleNakai, Yuki, Yujiro Usumoto, and Yasufumi Takeshita. 2024. "The Effects of Regional Muscle Strength and Mass on Standing Long Jump Performance" Muscles 3, no. 1: 60-70. https://doi.org/10.3390/muscles3010007