Article

Temporal Variations of Air Quality in Cage-Free Experimental Pullet Houses

Department of Poultry Science, College of Agricultural and Environmental Sciences, University of Georgia, Athens, GA 30602, USA
*
Author to whom correspondence should be addressed.
Poultry 2023, 2(2), 320-333; https://doi.org/10.3390/poultry2020024
Submission received: 8 April 2023 / Revised: 11 May 2023 / Accepted: 26 May 2023 / Published: 1 June 2023

Abstract

:
The welfare of laying hens in conventional caged houses has become an increased public concern, leading primary food chains, restaurants, and grocers in the United States to pledge to source only cage-free (CF) eggs by 2025 or 2030. Cage-free housing systems have been considered as a more humane alternative; however, they still come with certain challenges. One of the primary challenges with CF housing is the poor indoor air quality due to the high levels of ammonia (NH3) and particulate matter (PM). Despite the importance of air quality in animal welfare, most studies have focused on the egg-laying stage, thereby leaving a significant knowledge gap in the pullet phase. Addressing this gap is essential to ensure the well-being of laying hens in CF housing and to help producers and researchers identify effective strategies to mitigate the impact of poor indoor air quality on the bird’s health and welfare. Therefore, the objective of this study was to (a) examine the effect of the pullets’ age on NH3 and PM levels, and (b) find the effect of housing, litter moisture content (LMC), and relative humidity (RH) on air pollutant concentrations. The results show that the PM levels of PM2.5, PM10, and total suspended particles (TSP) increased significantly with the growth of birds from 1 to 16 weeks of age (WOA) (p < 0.01). For instance, PM2.5, PM10, and TSP levels were measured at 0.023 ± 0.003, 0.031 ± 0.004, and 0.058 ± 0.013 mg m−3 in the first week, and these levels increased to 1.44 ± 0.58, 2.723 ± 1.094, and 6.39 ± 2.96 mg m−3, respectively, by 16 WOA. In addition, PM levels measured near the perch were found to be three times higher than other locations inside the rooms (e.g., between the feeder and drinker or near the exhaust fan) (p < 0.01), as perching is one of the primary reasons for dust generation. Furthermore, a significant interaction between the age of the pullets and PM levels was found (p < 0.01), as the litter quality and the behaviors of birds were changing over time. For NH3 levels, average daily concentrations were lower than 1 ppm at 16 WOA for all rooms due to dry litter conditions (i.e., 9–10% LMC). Additionally, RH has been shown to have a significant effect on air pollutant concentration. Overall, the results indicate that the bird’s age significantly affects PM generation and PM variation within the rooms. The variation of PM was directly affected by RH inside the house. Therefore, this research will provide valuable information for both researchers and producers to control air pollutant emissions from the pullet stage in CF housing to ultimately improve the health and welfare of hens.

1. Introduction

The United States (US) egg production industry is transitioning from conventional caged to cage-free (CF) housing systems due to public concern regarding laying hen’s welfare [1,2]. Primary food retailers, restaurant chains, and grocers (e.g., McDonald’s and Walmart) support this movement and have pledged to only source CF eggs by 2025 or 2030 [2,3,4]. In addition, many US states have passed laws to become CF states in the near future (e.g., California by 2022; Washington by 2023; and Utah, Colorado, Oregon, and Michigan by 2025) [1]. The CF movement has been believed to improve hen welfare by providing more living space and opportunities for birds to perform their natural behaviors (e.g., dustbathing, perching, preening, nesting, and foraging). However, CF housing typically has poor indoor air quality due to high levels of ammonia (NH3) and particulate matter (PM) [3,5,6,7,8,9]. Ammonia and PM concentrations in CF houses are affected by the quality of litter, ventilation, feed additives, and bird activities on the floor [10,11,12]. In addition, air pollutant concentrations were observed at higher levels in winter or cold weather due to reduced ventilation runtime [6,13,14,15].
The primary PM source in CF layer houses is the floor litter (composed of a mixture of chicken manure with bird’s dander, feathers, excrement, and feed) [16,17]. PM is the primary carrier of airborne microorganisms; thus, high PM concentrations can cause chronic bronchitis, lung cancer, chronic obstructive pulmonary disorders, and pneumonia lesions [8,18,19,20,21,22]. Additionally, high NH3 levels can affect animal growth rate, welfare, health, and mortality [9,23,24,25,26]. Particulate matter can be classified into five different sizes: PM1 (PM of diameter ≤ 1 μm), PM2.5 (PM of diameter ≤ 2.5 μm), PM4 (PM of diameter ≤ 4 μm), PM10 (PM of diameter ≤ 10 μm), and total suspended particles (TSP, PM of diameter ≤ 100 μm) [7,8,27,28]. Among these five different PM sizes, smaller PMs (PM2.5 and PM10) are considered more problematic as fine PM can enter the respiratory system deeper than larger PM and affect the health and welfare of hens and their caretakers [8,29]. Therefore, the World Health Organization (WHO) and the National Ambient Air Quality Standard (NAAQS) have set occupational exposure limits (OEL) on the acceptable levels of PM10 and PM2.5 in the air. According to WHO guidelines [30], the annual average for PM10 should not exceed 15 µg/m3, and the 24 h mean should not exceed 45 µg/m3, respectively. Similarly, for PM2.5, the annual average should not exceed 5 µg/m3, and the 24 h mean should not exceed 15 µg/m3, respectively. NAAQS limits the exposure to 35 µg/m3 of PM2.5, and 150 µg/m3 of PM10 for 24 h (averaged over three years), respectively [31]. For instance, it has been reported that PM2.5 is more destructive than PM10 and can cause various respiratory and cardiovascular disorders [19,22]. Therefore, reducing PM levels in CF houses are crucial for protecting animal well-being and reducing emissions to the outdoor environment.
It has been reported that the growth of chickens can affect the air quality (e.g., PM from 1.8 to 4.8 mg m−3, and NH3 from 4 to 27 ppm, respectively) in chicken houses [32,33]. However, only a few studies have focused on the effects of bird age on air quality in CF houses, which are an emerging hen housing system in the US. Therefore, it is important to find the air pollutant concentrations at the earlier stage of layer production (pullet stage or before layer stage) and fill this gap to ensure healthy and happy hens. Furthermore, early assessments of air pollutant concentrations within the pullet housing will help farmers and researchers identify effective ways to prevent poor indoor air quality from harming the birds. Therefore, this study hypothesized that bird growth affects the levels of air pollutants in the CF housing system during pullet rearing (i.e., birds aged ≤ 16 weeks). Therefore, the objectives of this study were as follows: (1) to investigate the effects of bird growth and age (pullets from 0–16 weeks of age (WOA)) on size-fractioned PM and NH3, and (2) to relate PM and NH3 levels with functional areas within the birdhouse, litter moisture content (LMC), and ambient conditions in the CF housing system during the early production stage in order to develop the best management strategies.

2. Materials and Methods

2.1. Ethical Approval

All the procedures were approved by the Institutional Animal Care and Use Committee (IACUC) prior to starting this research (AUF#: A2020 08-014-A1).

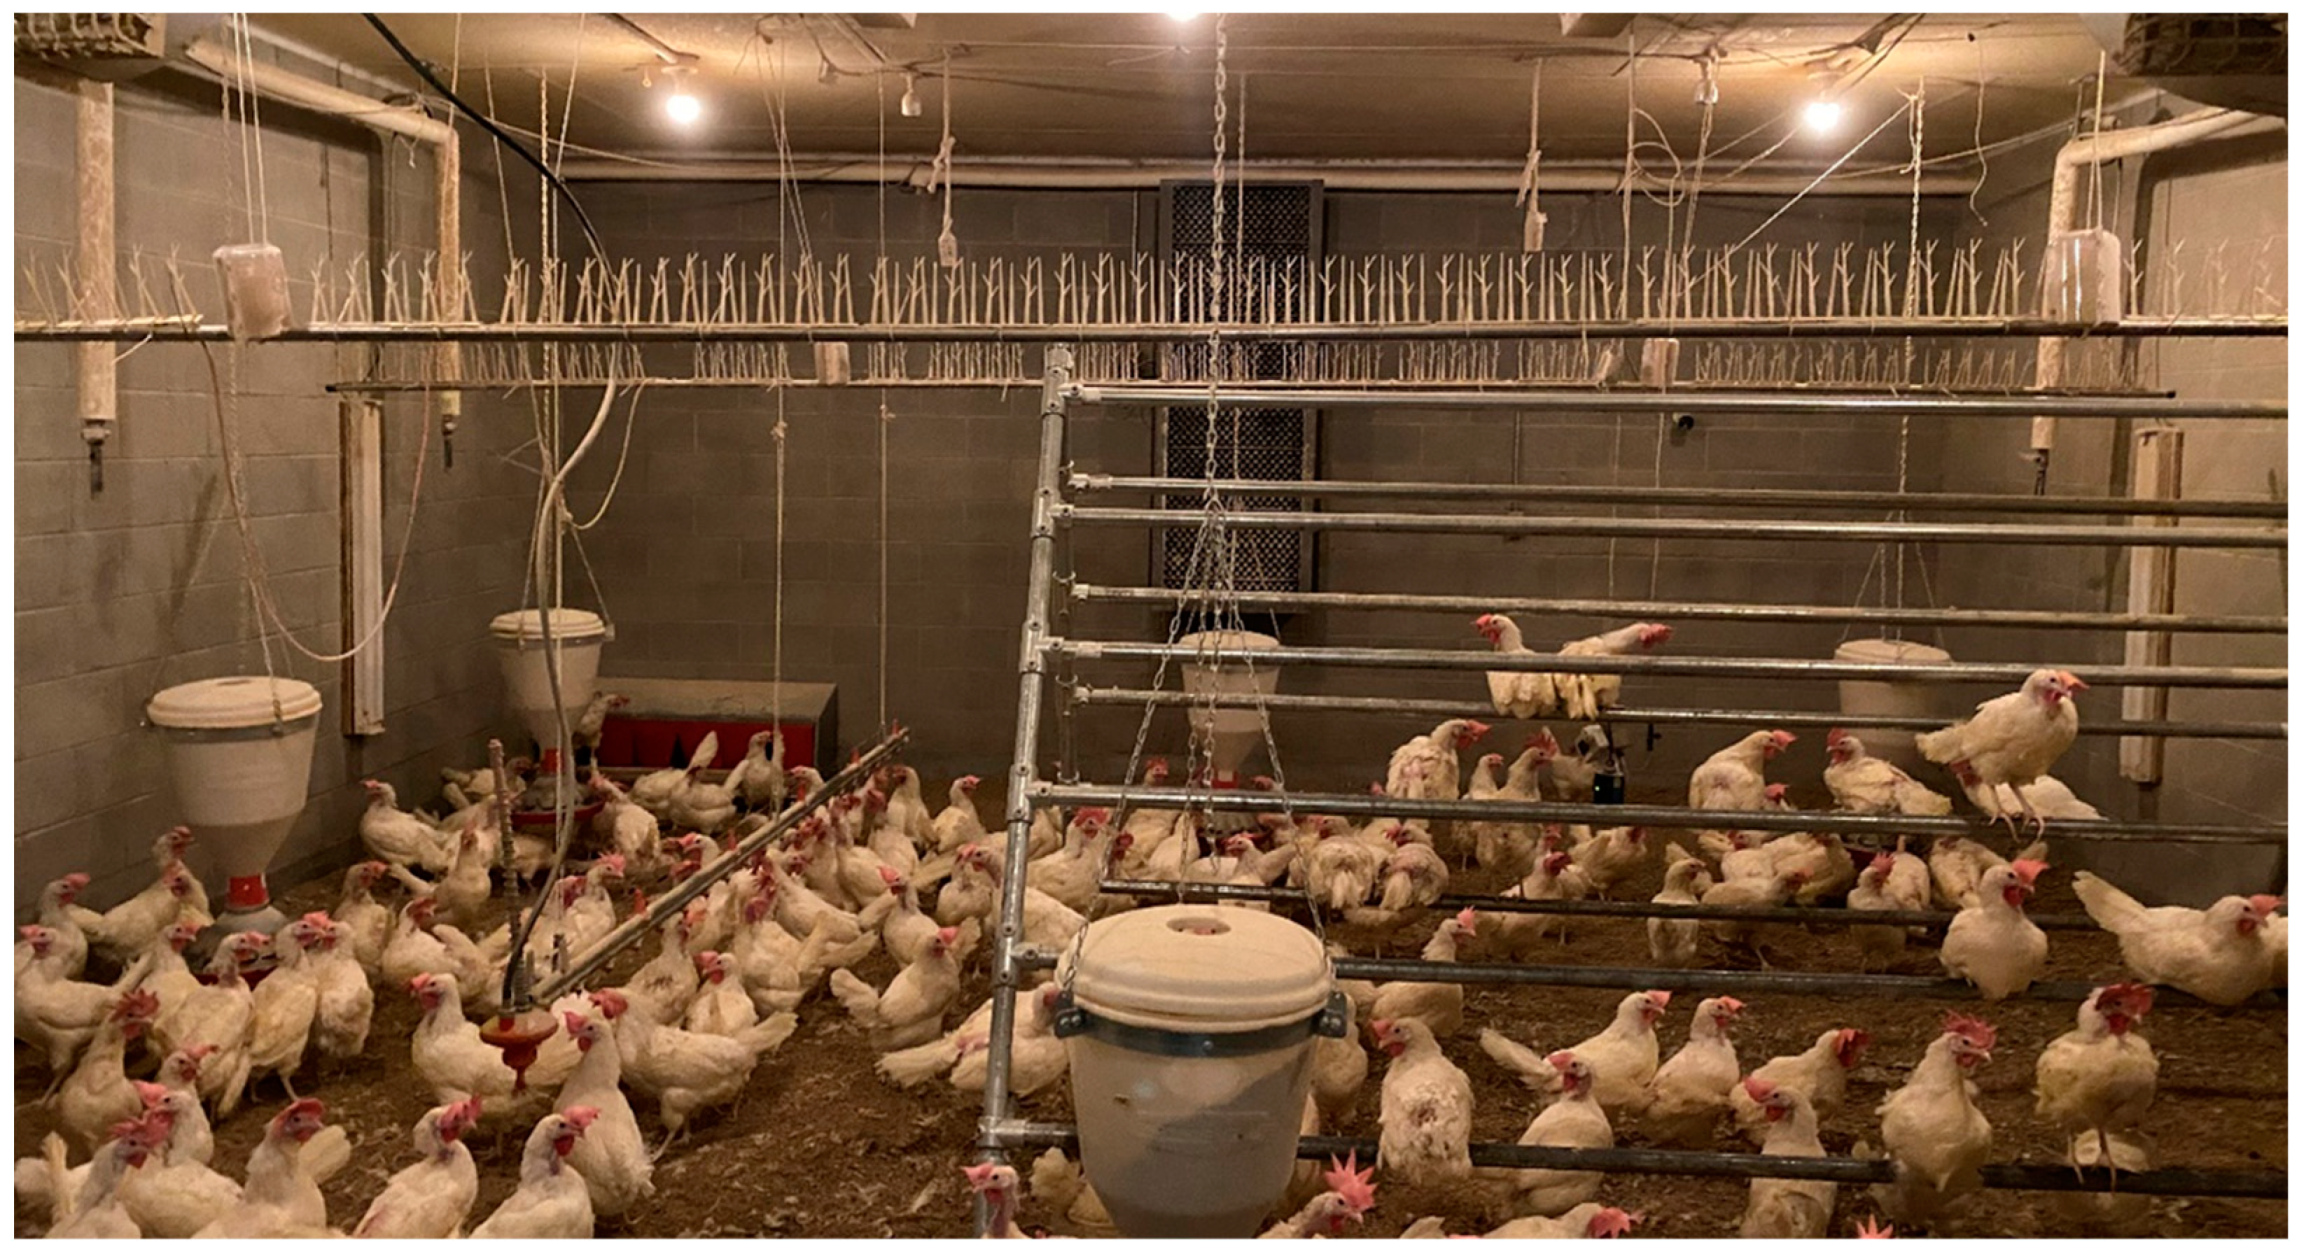
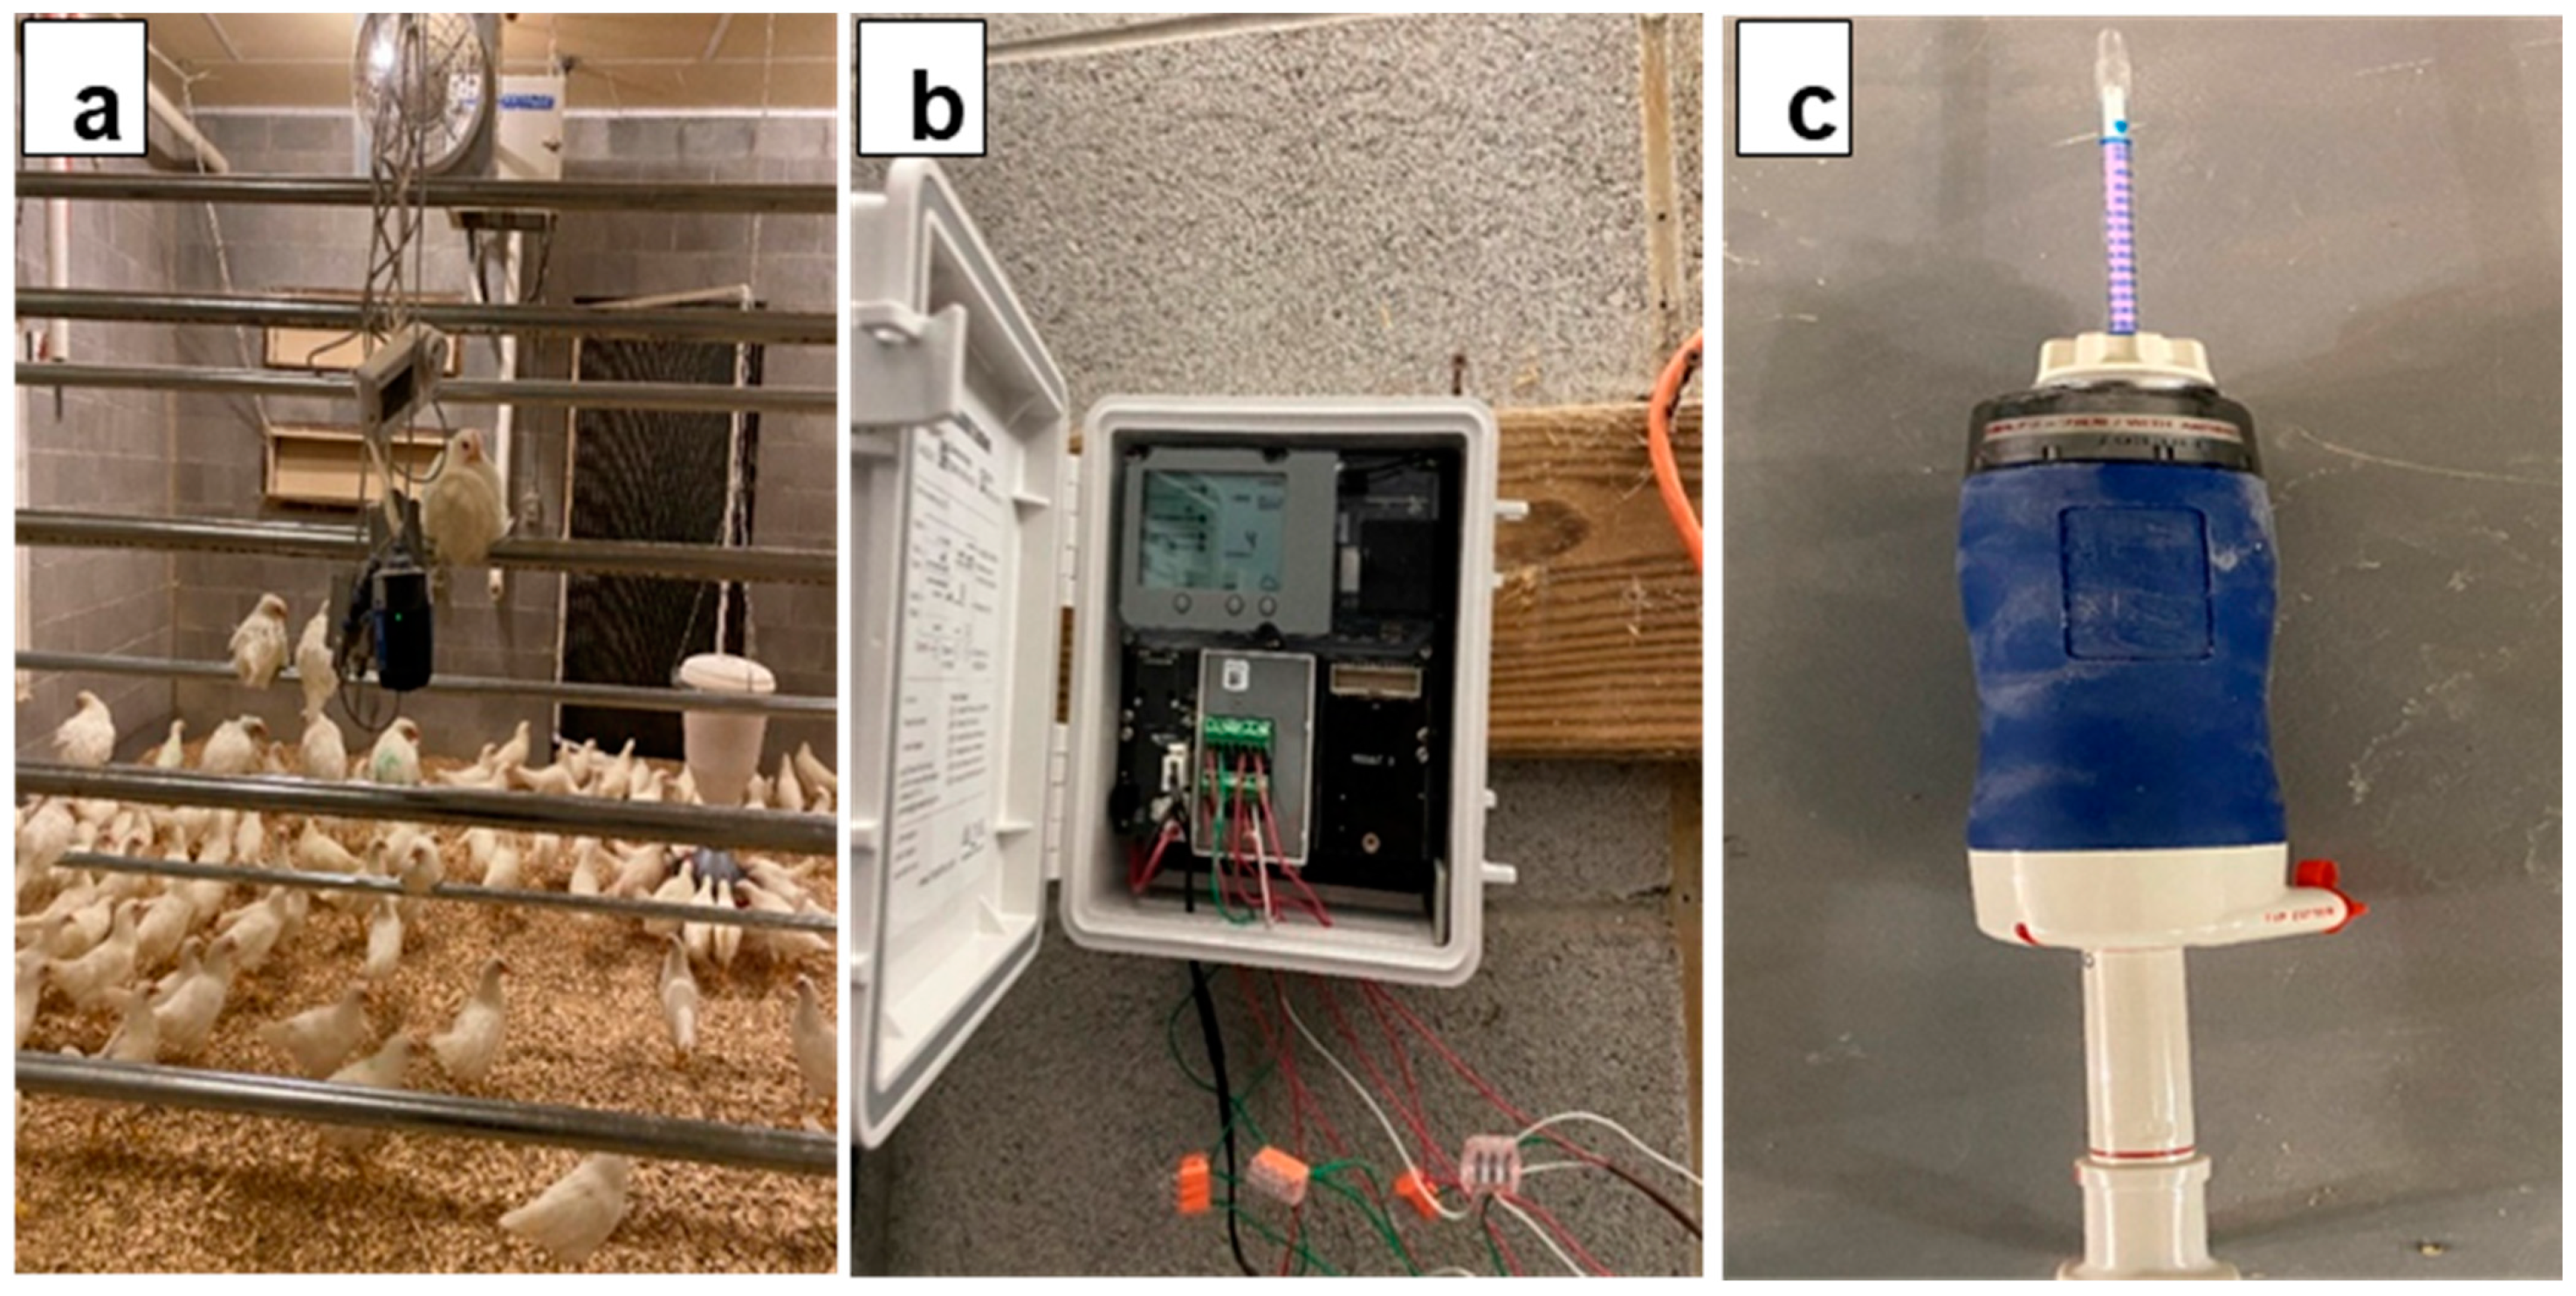
2.2. Housing and Management

This study was conducted in a CF floor-raised facility at the University of Georgia (UGA), utilizing four rooms within a poultry research facility (Athens, GA, USA; Figure 1). Each room had dimensions of 7.3 m L (24 ft) × 6.1 m W (20 ft) × 3.1 m H (10 ft), and each room housed 200 Hy-line W-36 pullets from day 1 to 16 WOA. The total litter space (excluding perches and other equipment space) was about 37.9 m2 (408 ft2) with a stocking density of 5.28 birds/m2, which meets the recommended stocking density of “no less than 8.62 birds/m2” recommended for commercial CF production in the US [34]. In addition, each room was provided with pine wood shavings as the bedding material (initial depth was 5 cm) and an A-shaped perch with a total length of 36.6 m or 120 ft (i.e., 0.18 m bird−1). Pullets were given standard mash feed for the starter, grower, developer, and pre-lay stages. The diets were formulated in the feed mill located at the University of Georgia’s Poultry Research Center. Husbandry and management practices followed the Hy-Line W-36 commercial layers management guidelines [34]. This study was focused on the pullet’s growing period of 1–16 WOA.

2.3. Environmental Parameters

Air pollutants inside the house are directly or indirectly influenced by environmental parameters such as temperature (T), relative humidity (RH), photoperiod and intensity, and ventilation rates. In addition, management and litter type also affect air pollutant concentrations inside CF housing. Therefore, a Chore-Tronics Model 8 controller (Chore-Time Group, Milford, IN, USA) was used to control the indoor environment, adjusting the room temperature, lighting, and ventilation rates to maintain a suitable environment.

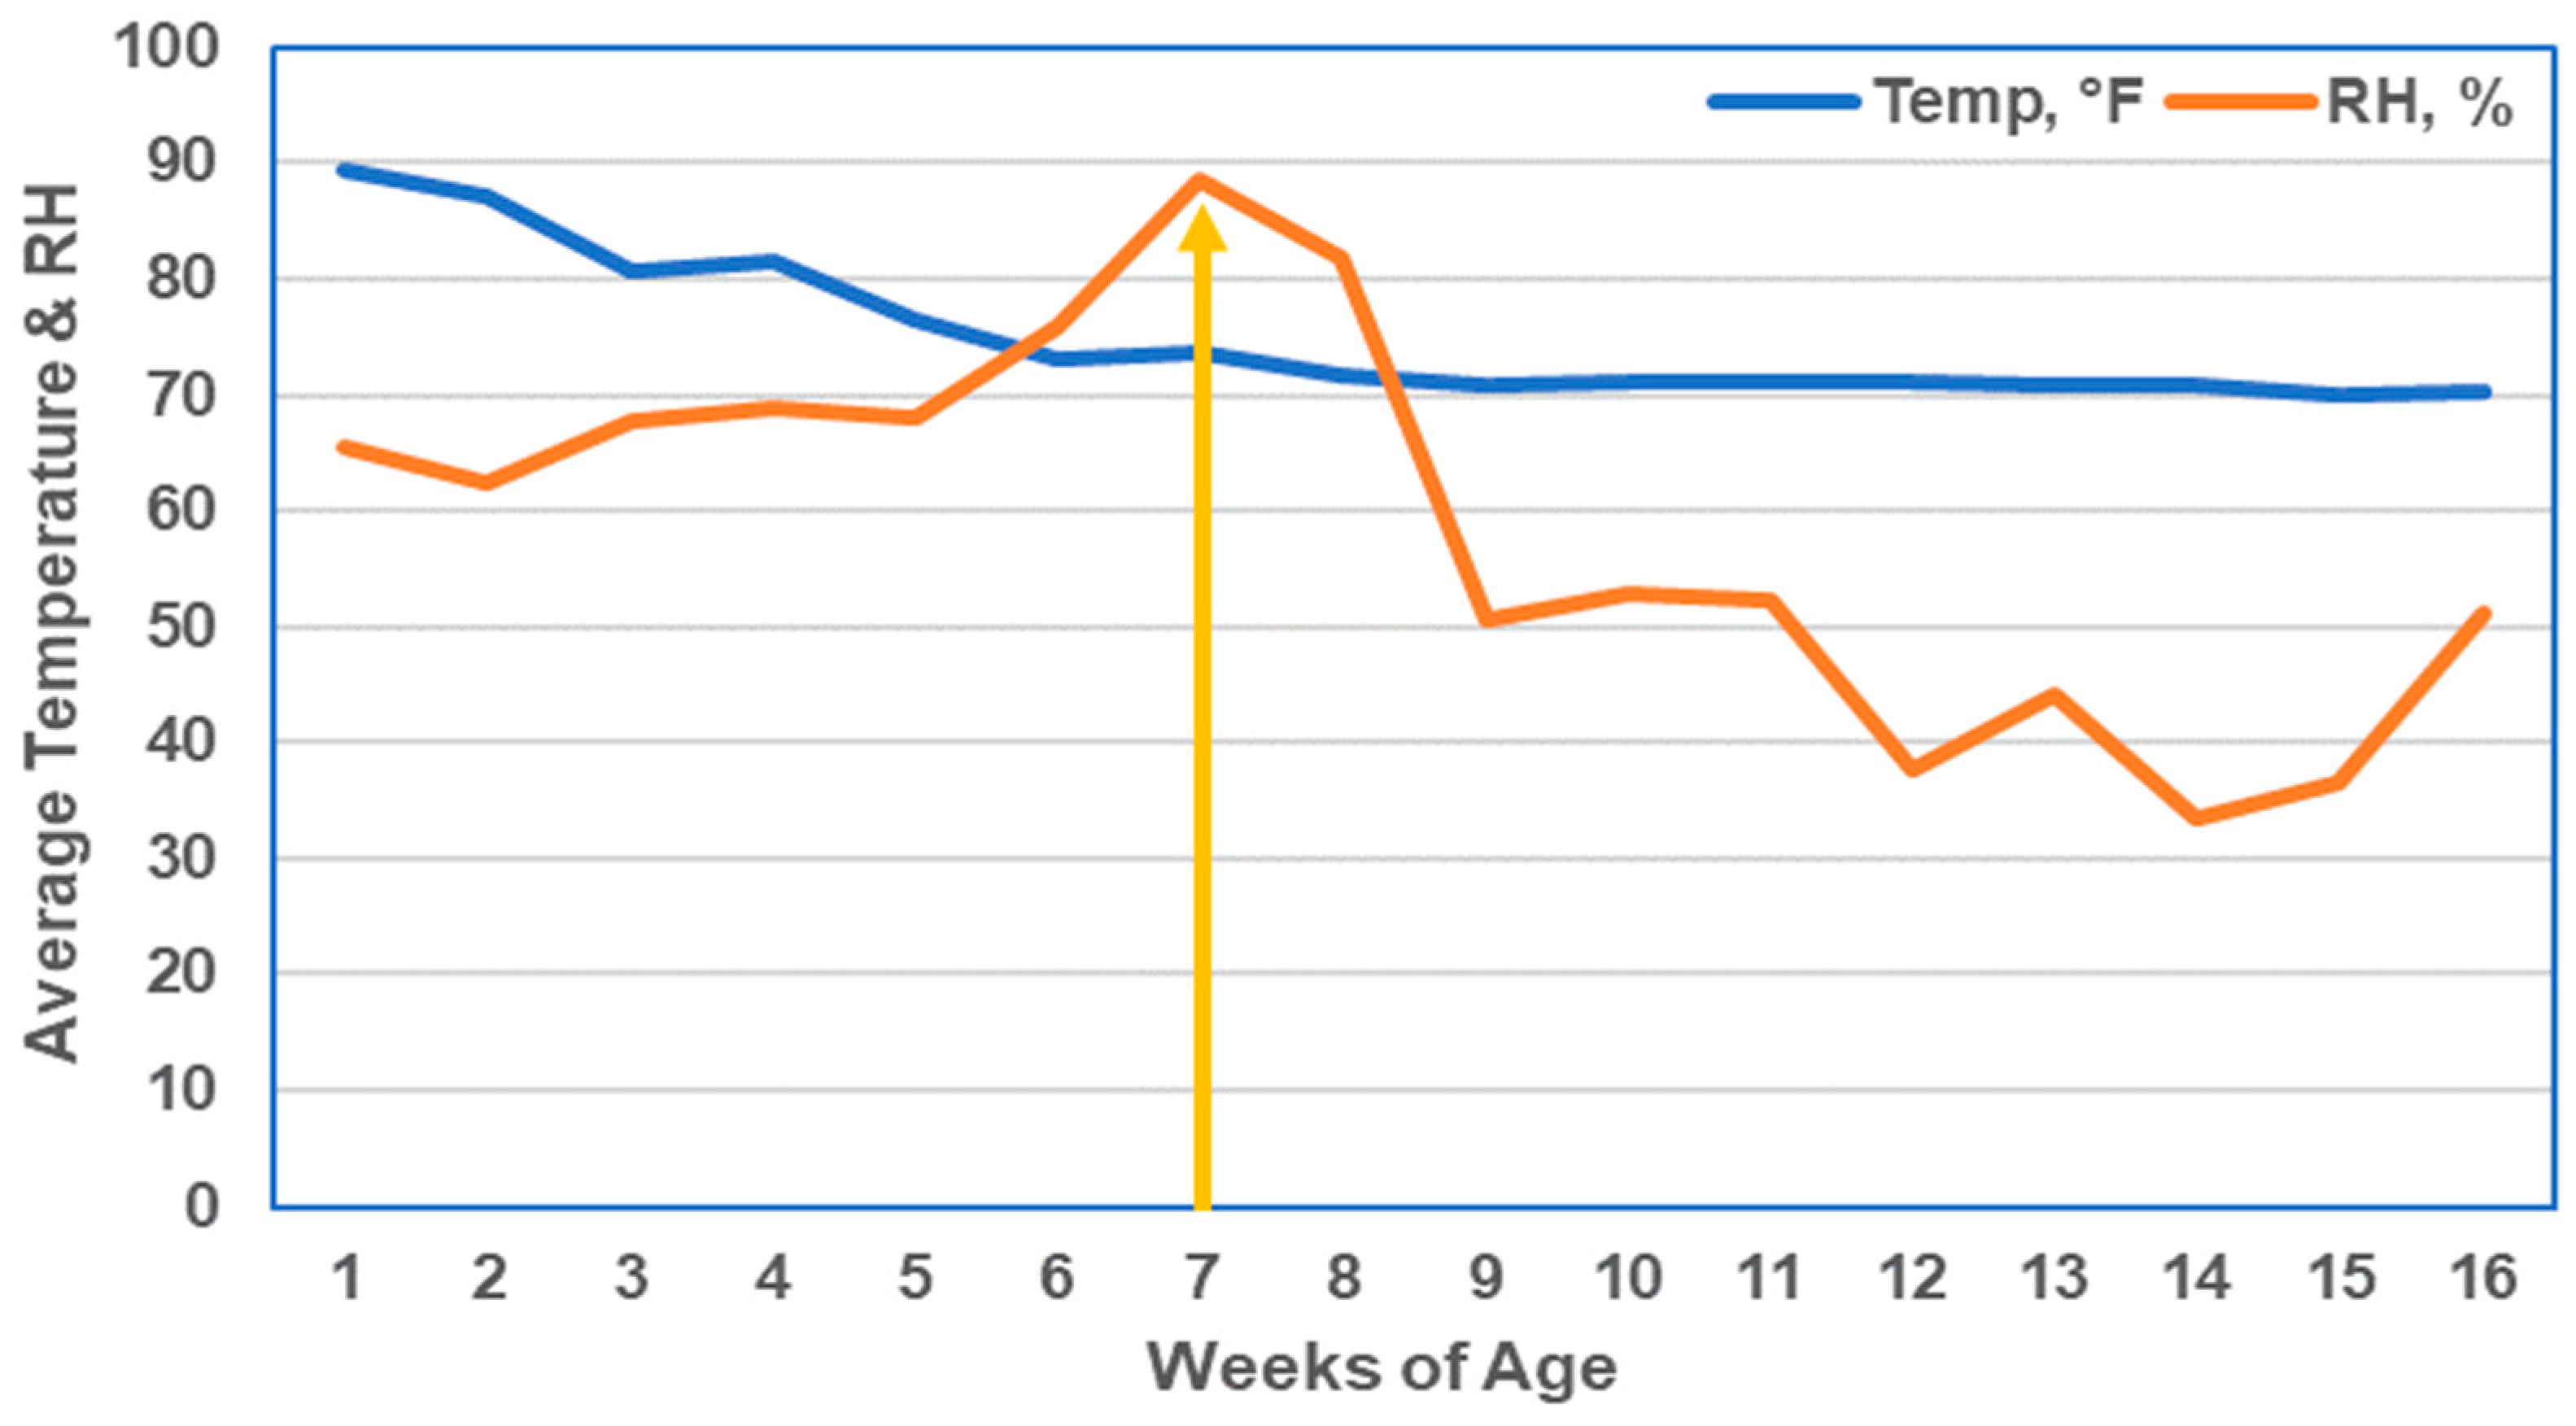
2.3.1. Temperature and Relative Humidity

The temperature and RH inside each room were measured continuously using an Onset HOBO CO2 data logger (HOBO MX CO2 Logger MX1102A, Bourne, MA, USA), while data for the outside the room was recorded using an Onset HOBO T/RH data logger (Onset HOBO MX1101 Wireless data logger, Bourne, MA, USA). Each data logger was programmed to collect data every 10 min for 24 h daily. The HOBO sensor inside the room was positioned 1.2 m above the floor litter, while the one placed outside was positioned 1.8 m above the ground. On a daily basis, the HOBOconnect app (Version: 1.5.0, 2023 Onset Computer Corporation, Bourne, MA, USA) was used to monitor the temperature and relative humidity data. The app was installed on a smartphone connected to the HOBO data logger via Bluetooth, which displayed real-time values. Regular checking was conducted to ensure that the birds were housed in a comfortable environment.

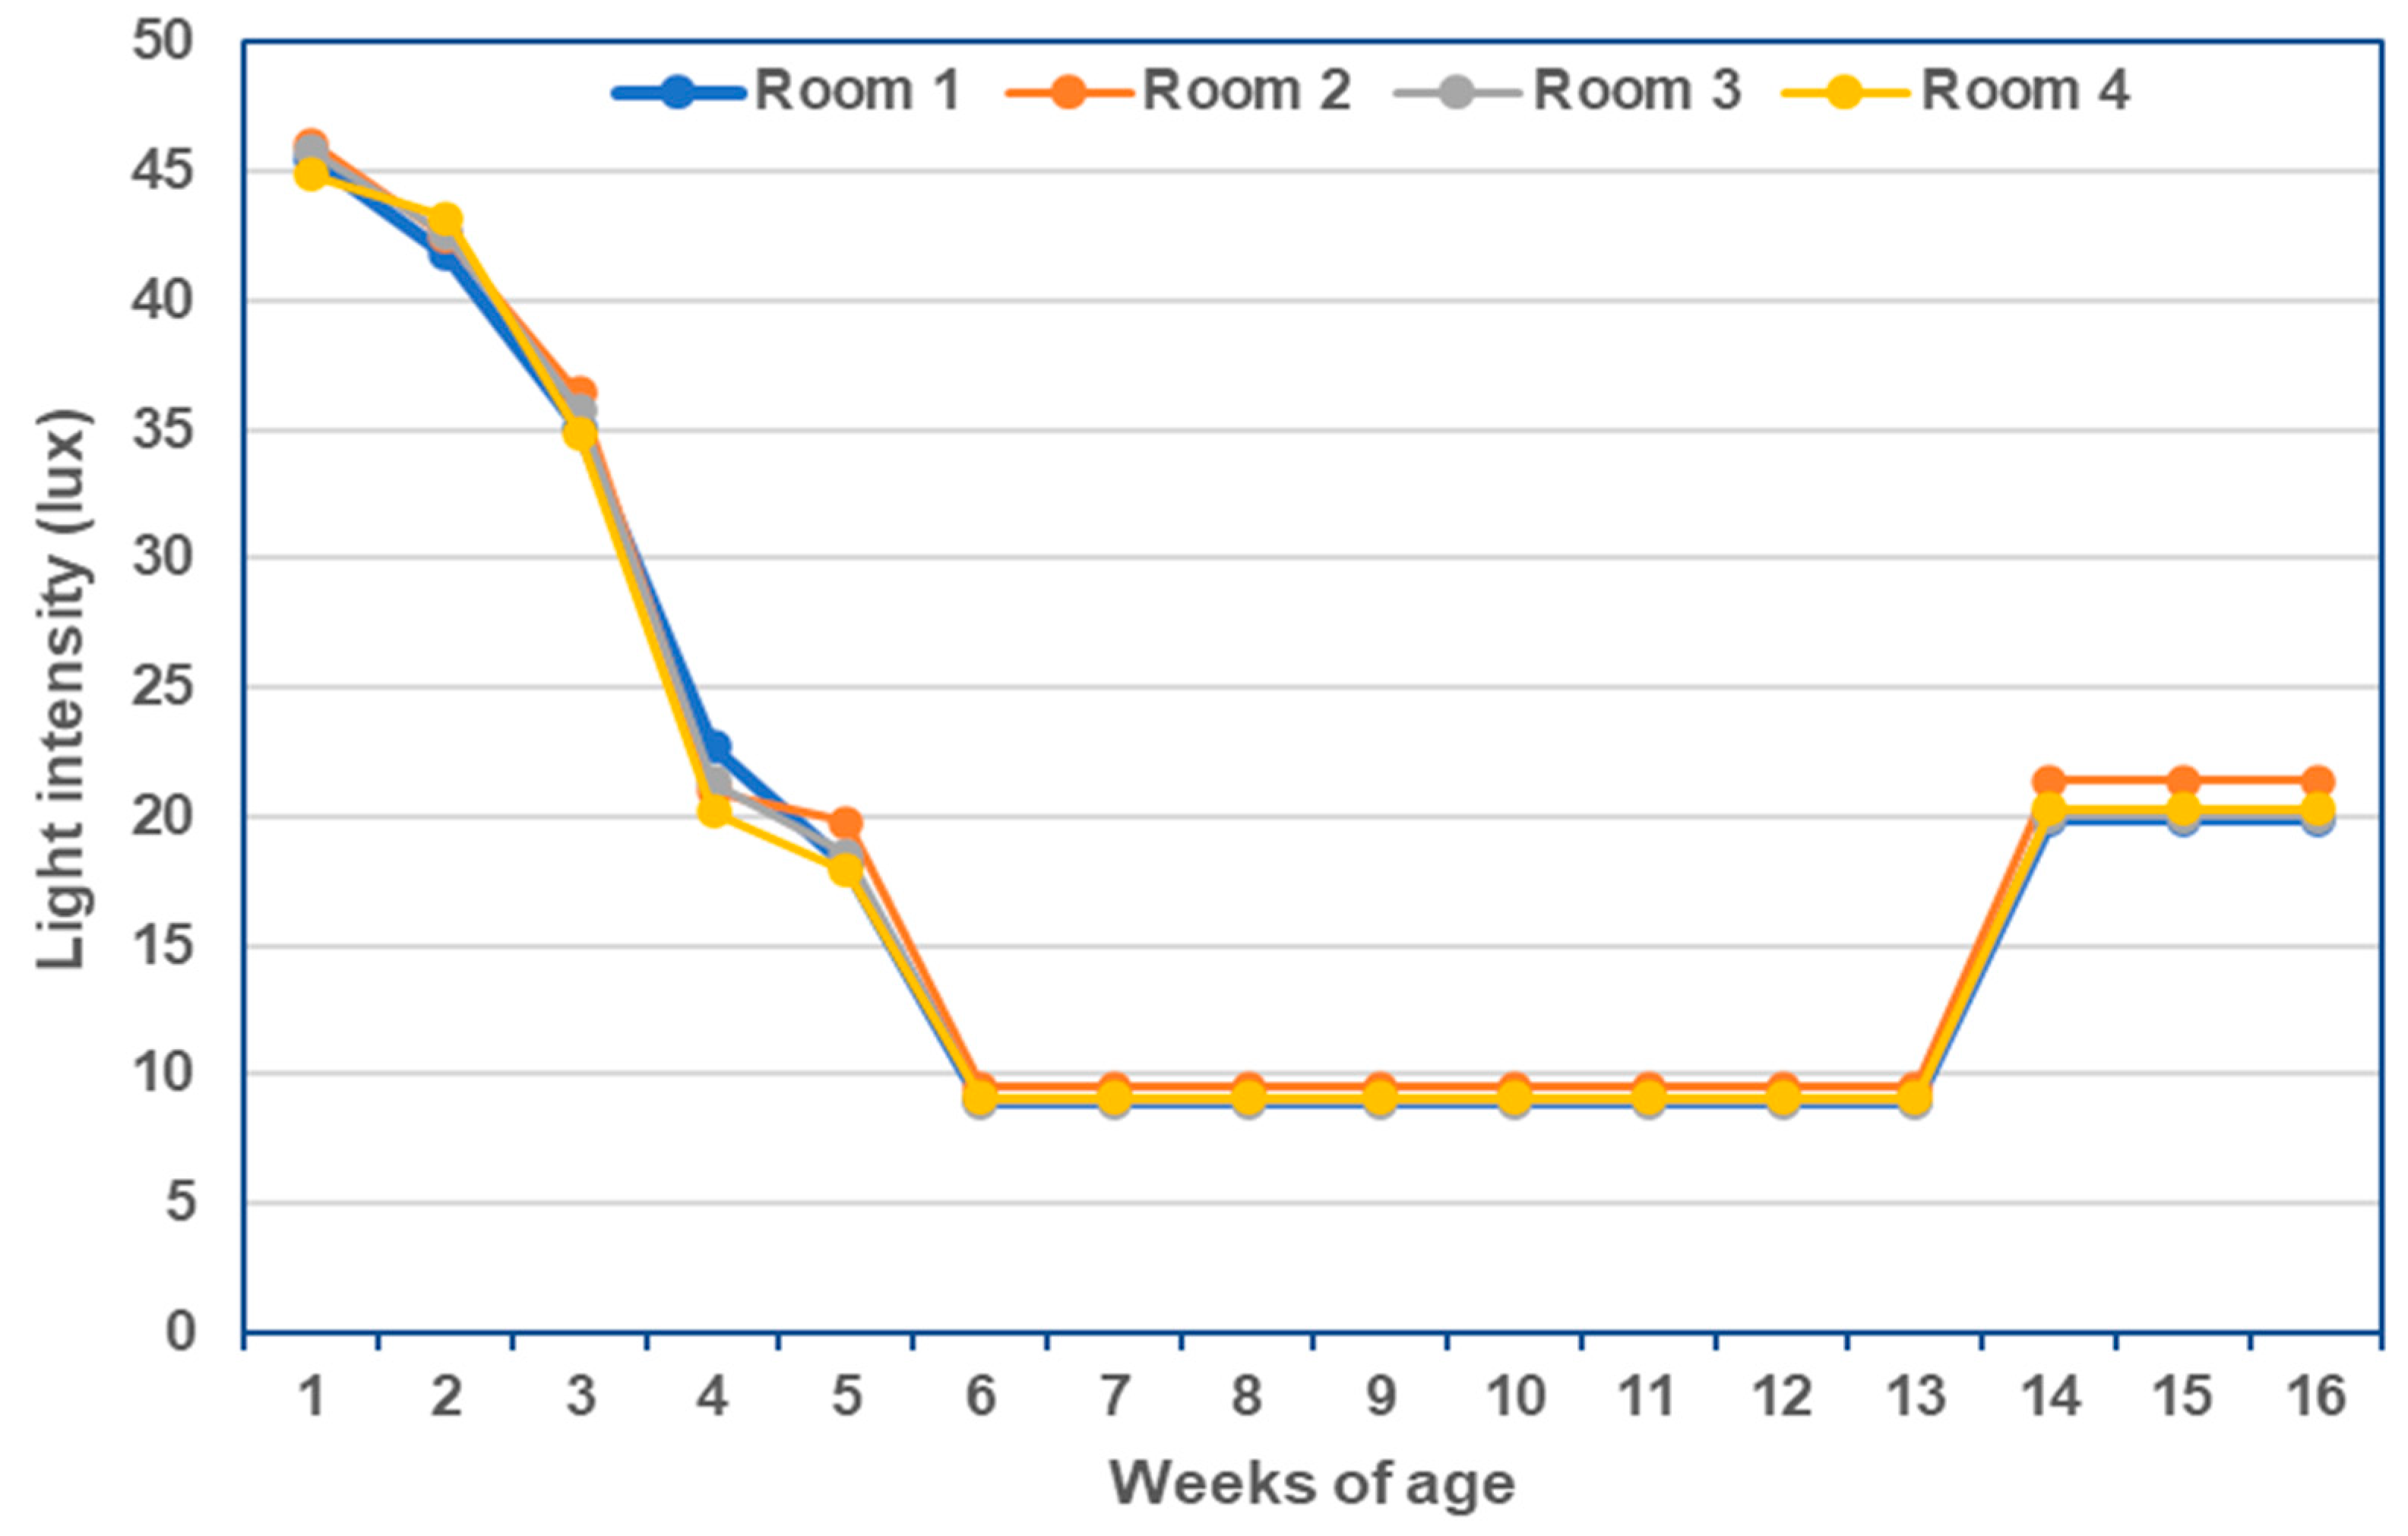
2.3.2. Light Settings

The light period was set for 22 h (days 0–3) and 21 h (days 4–7) for the first week and was then decreased by a 1 h light duration every week until 16 h (6–16 WOA) was reached. Similarly, light intensity varies during the pullet rearing, as shown in Figure 2. Light intensity (LED bulb) was measured randomly at 6 locations approximately 1 ft above the floor litter within each room with a digital illuminance light meter (Digital Illuminance Light Meter, LX1330B, Dr. meter). The light intensity was set as the highest during the starter phase to help the pullets to navigate the barn and find food and water [35]. After that, the light intensity was gradually reduced over the first 6 WOA following the Hy-Line W-36 management guidelines [34]. Finally, the light intensity was increased after 13 WOA to trigger the development of an egg-laying reproductive system.

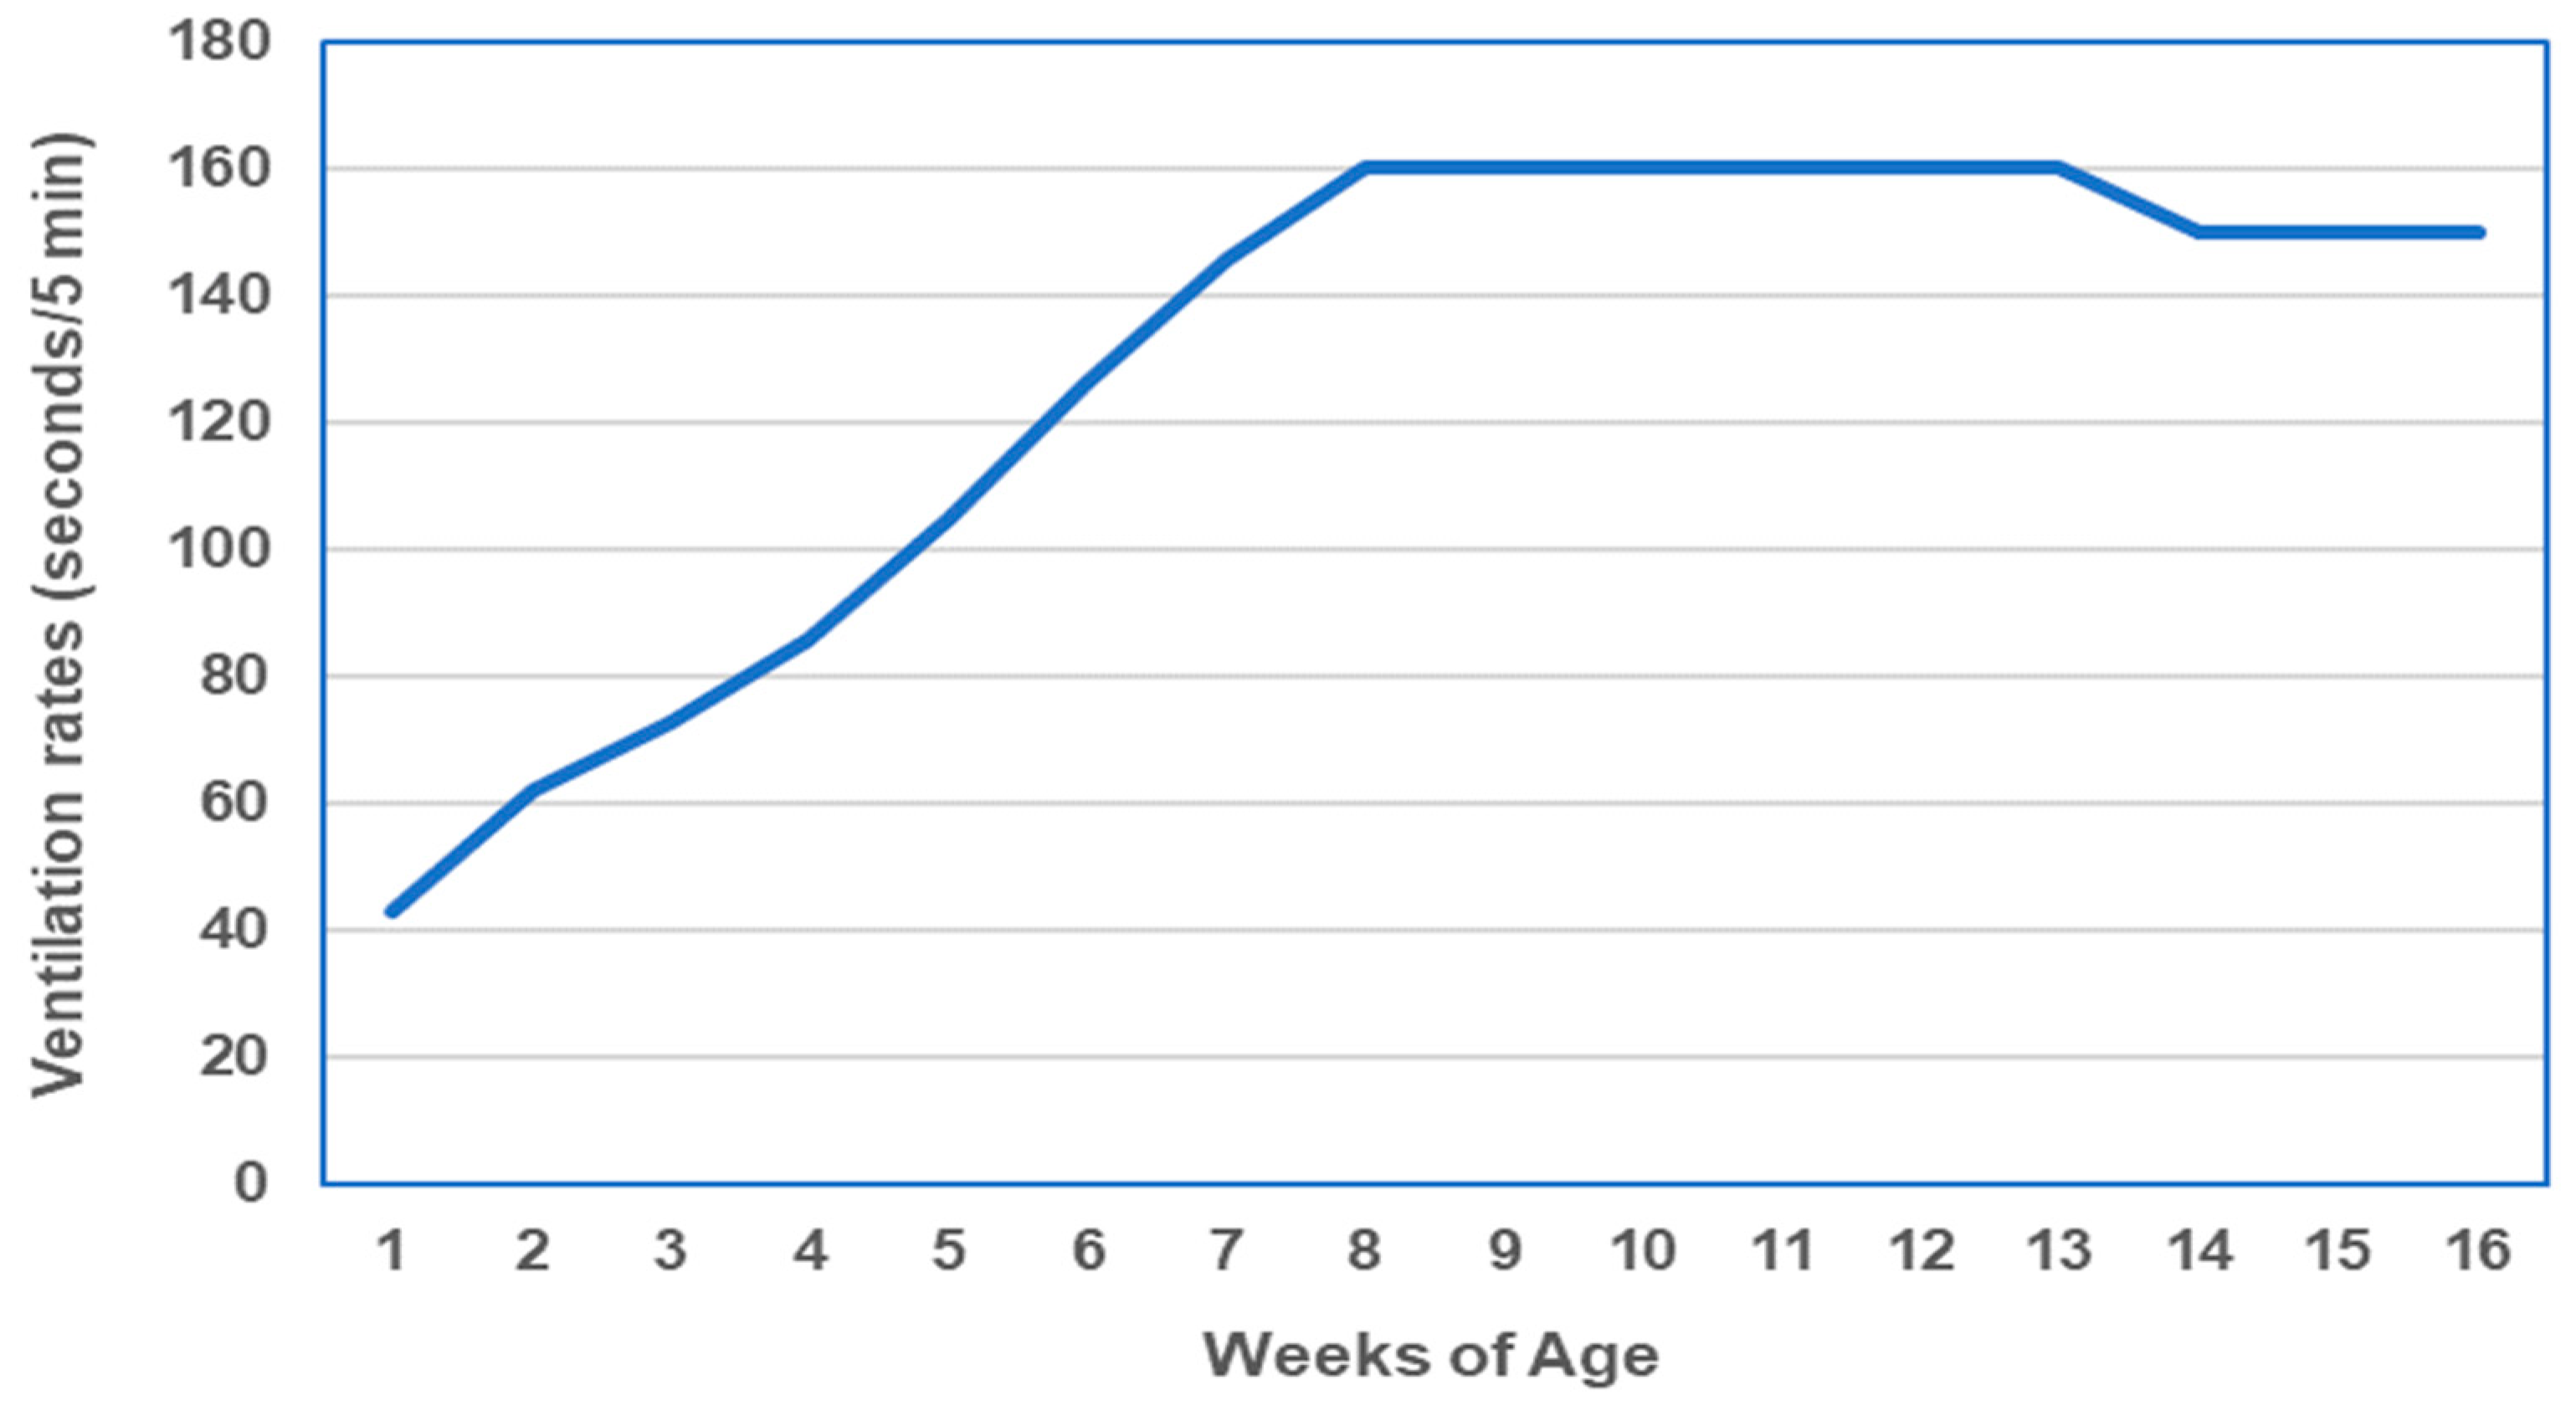
2.3.3. Ventilation Rates

In this study, the pullet production stage was from late August to December, when temperatures were cool, and no heat stress issues existed. Therefore, cold stress was our consideration during the test. In addition, tunnel ventilation fans, a heater, and cooling pads were operated to control the temperature and RH inside the rooms. The ventilation rates were adjusted as shown in Figure 3. Similarly, two circulating fans (Vortex fan, Munter Corporation, Mason, MI, USA) were used inside each room (attached to the ceiling) for continuous circulation and equal the air and temperature distribution.

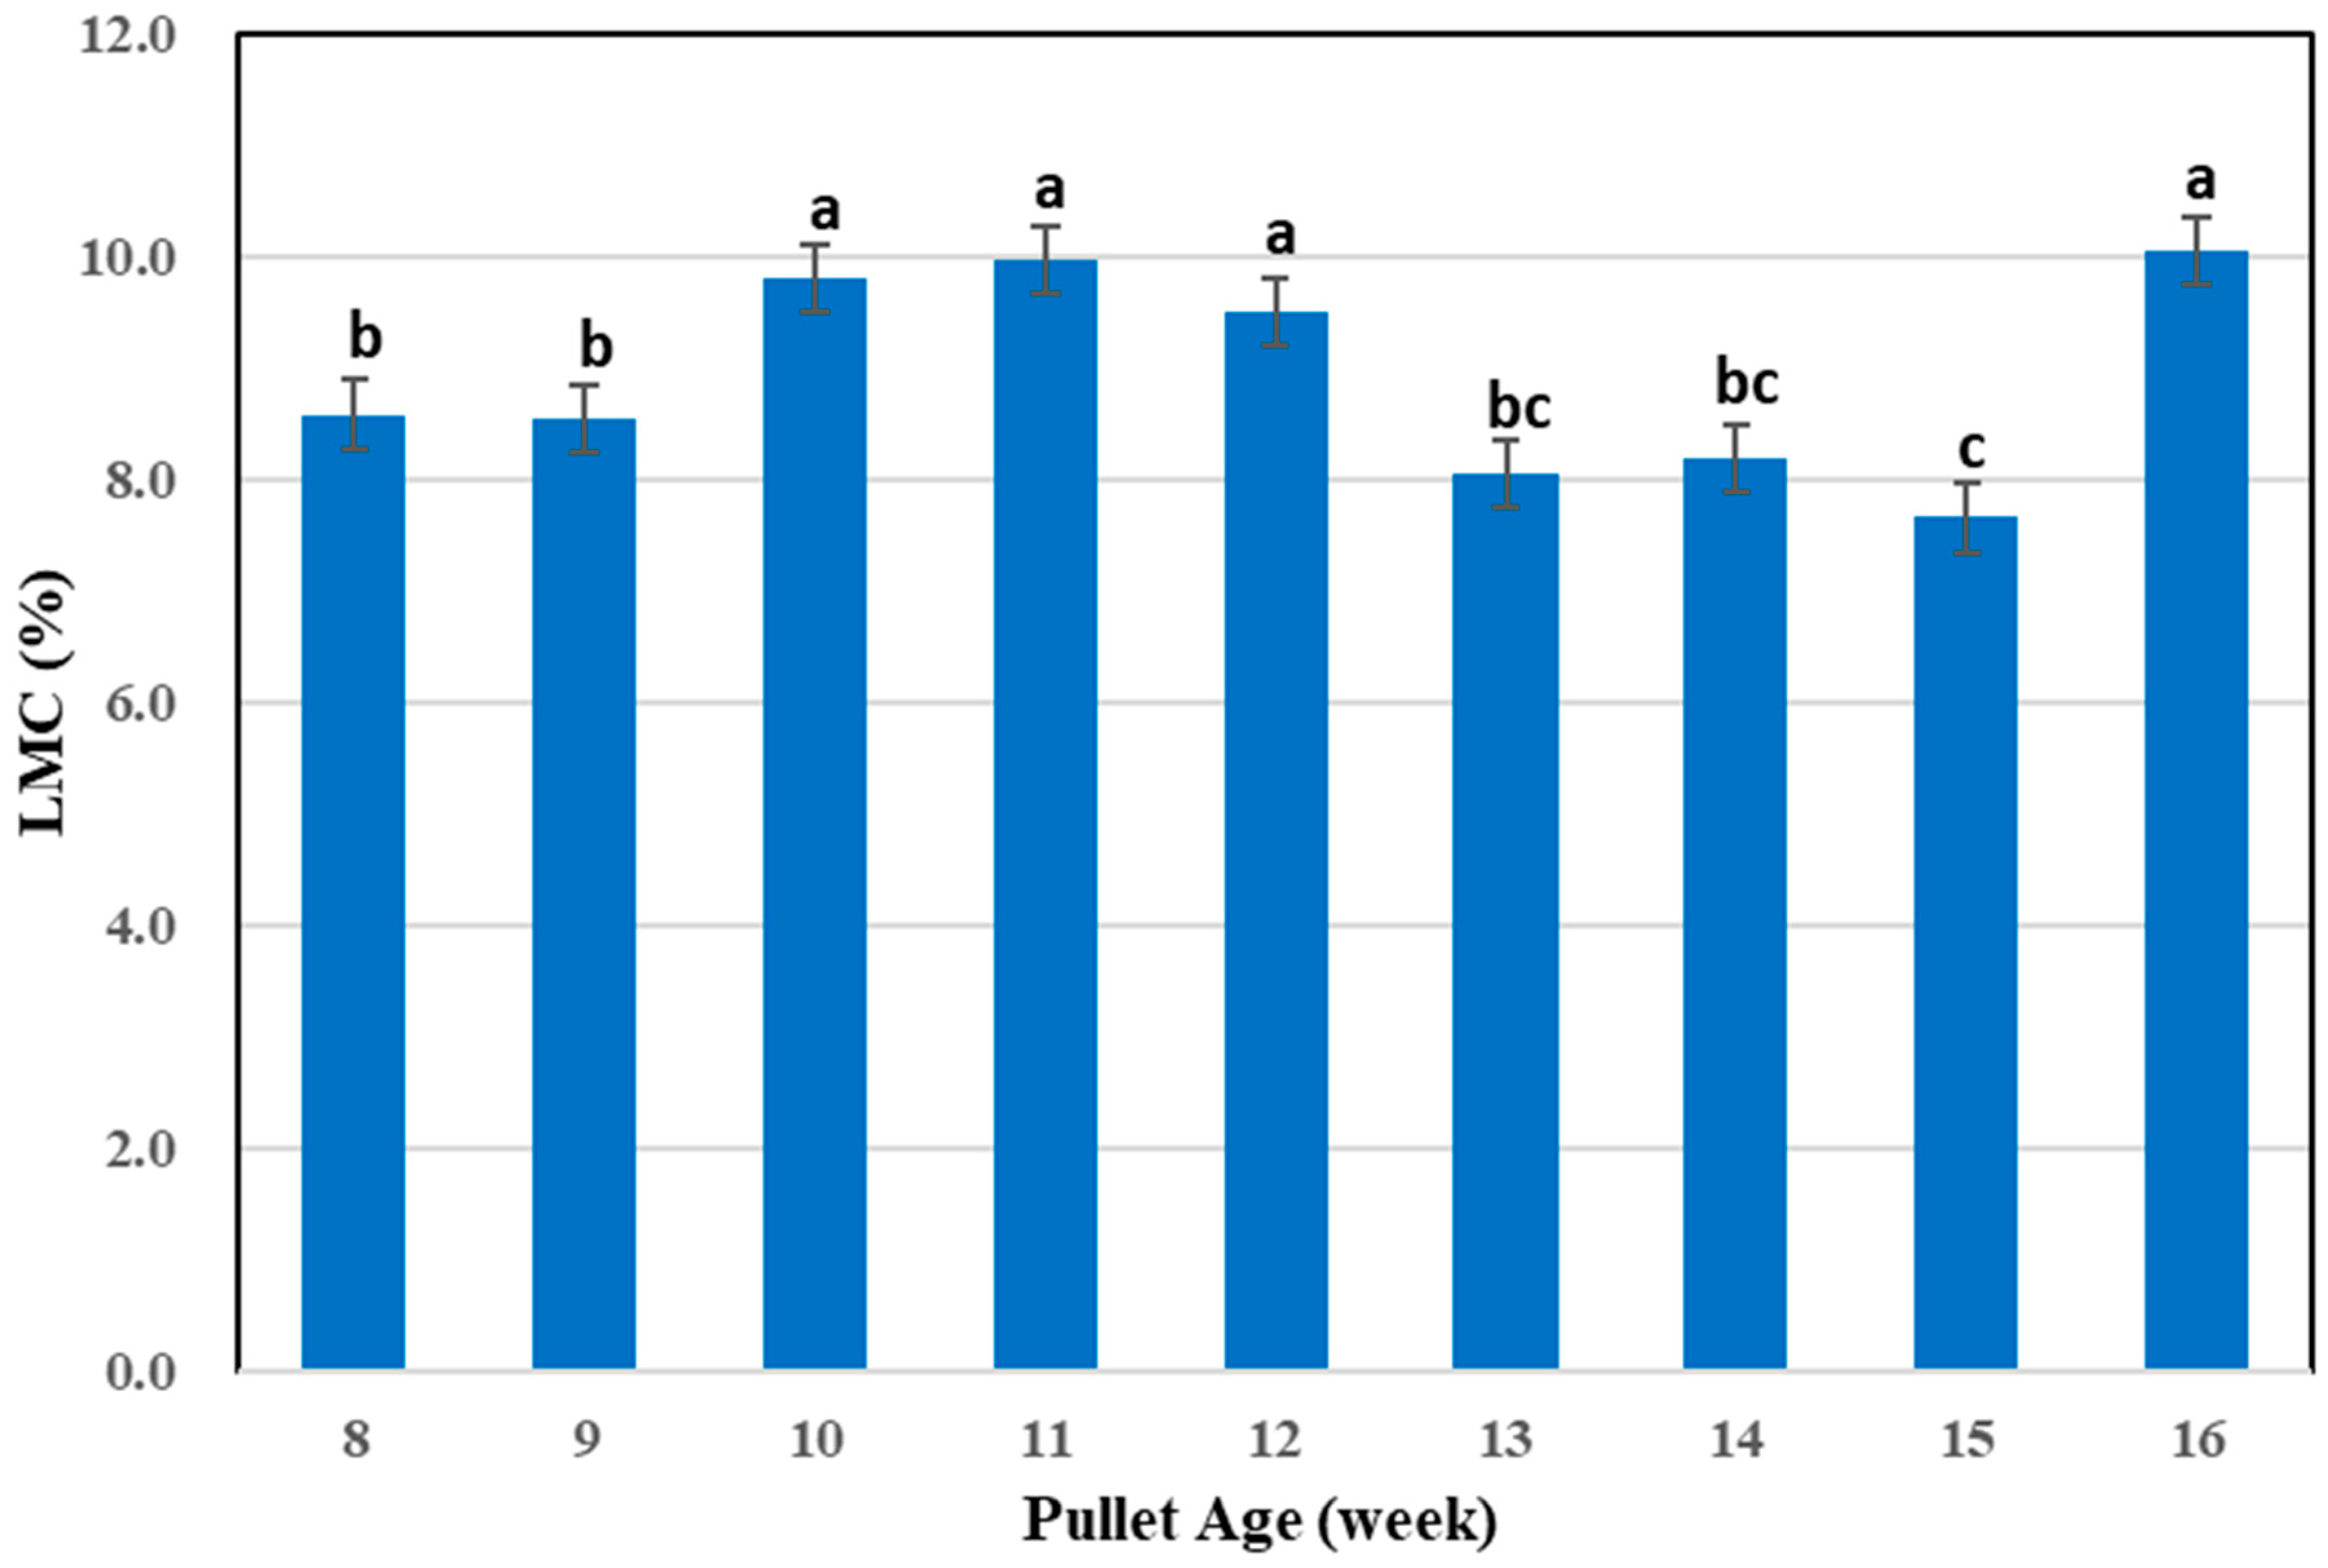
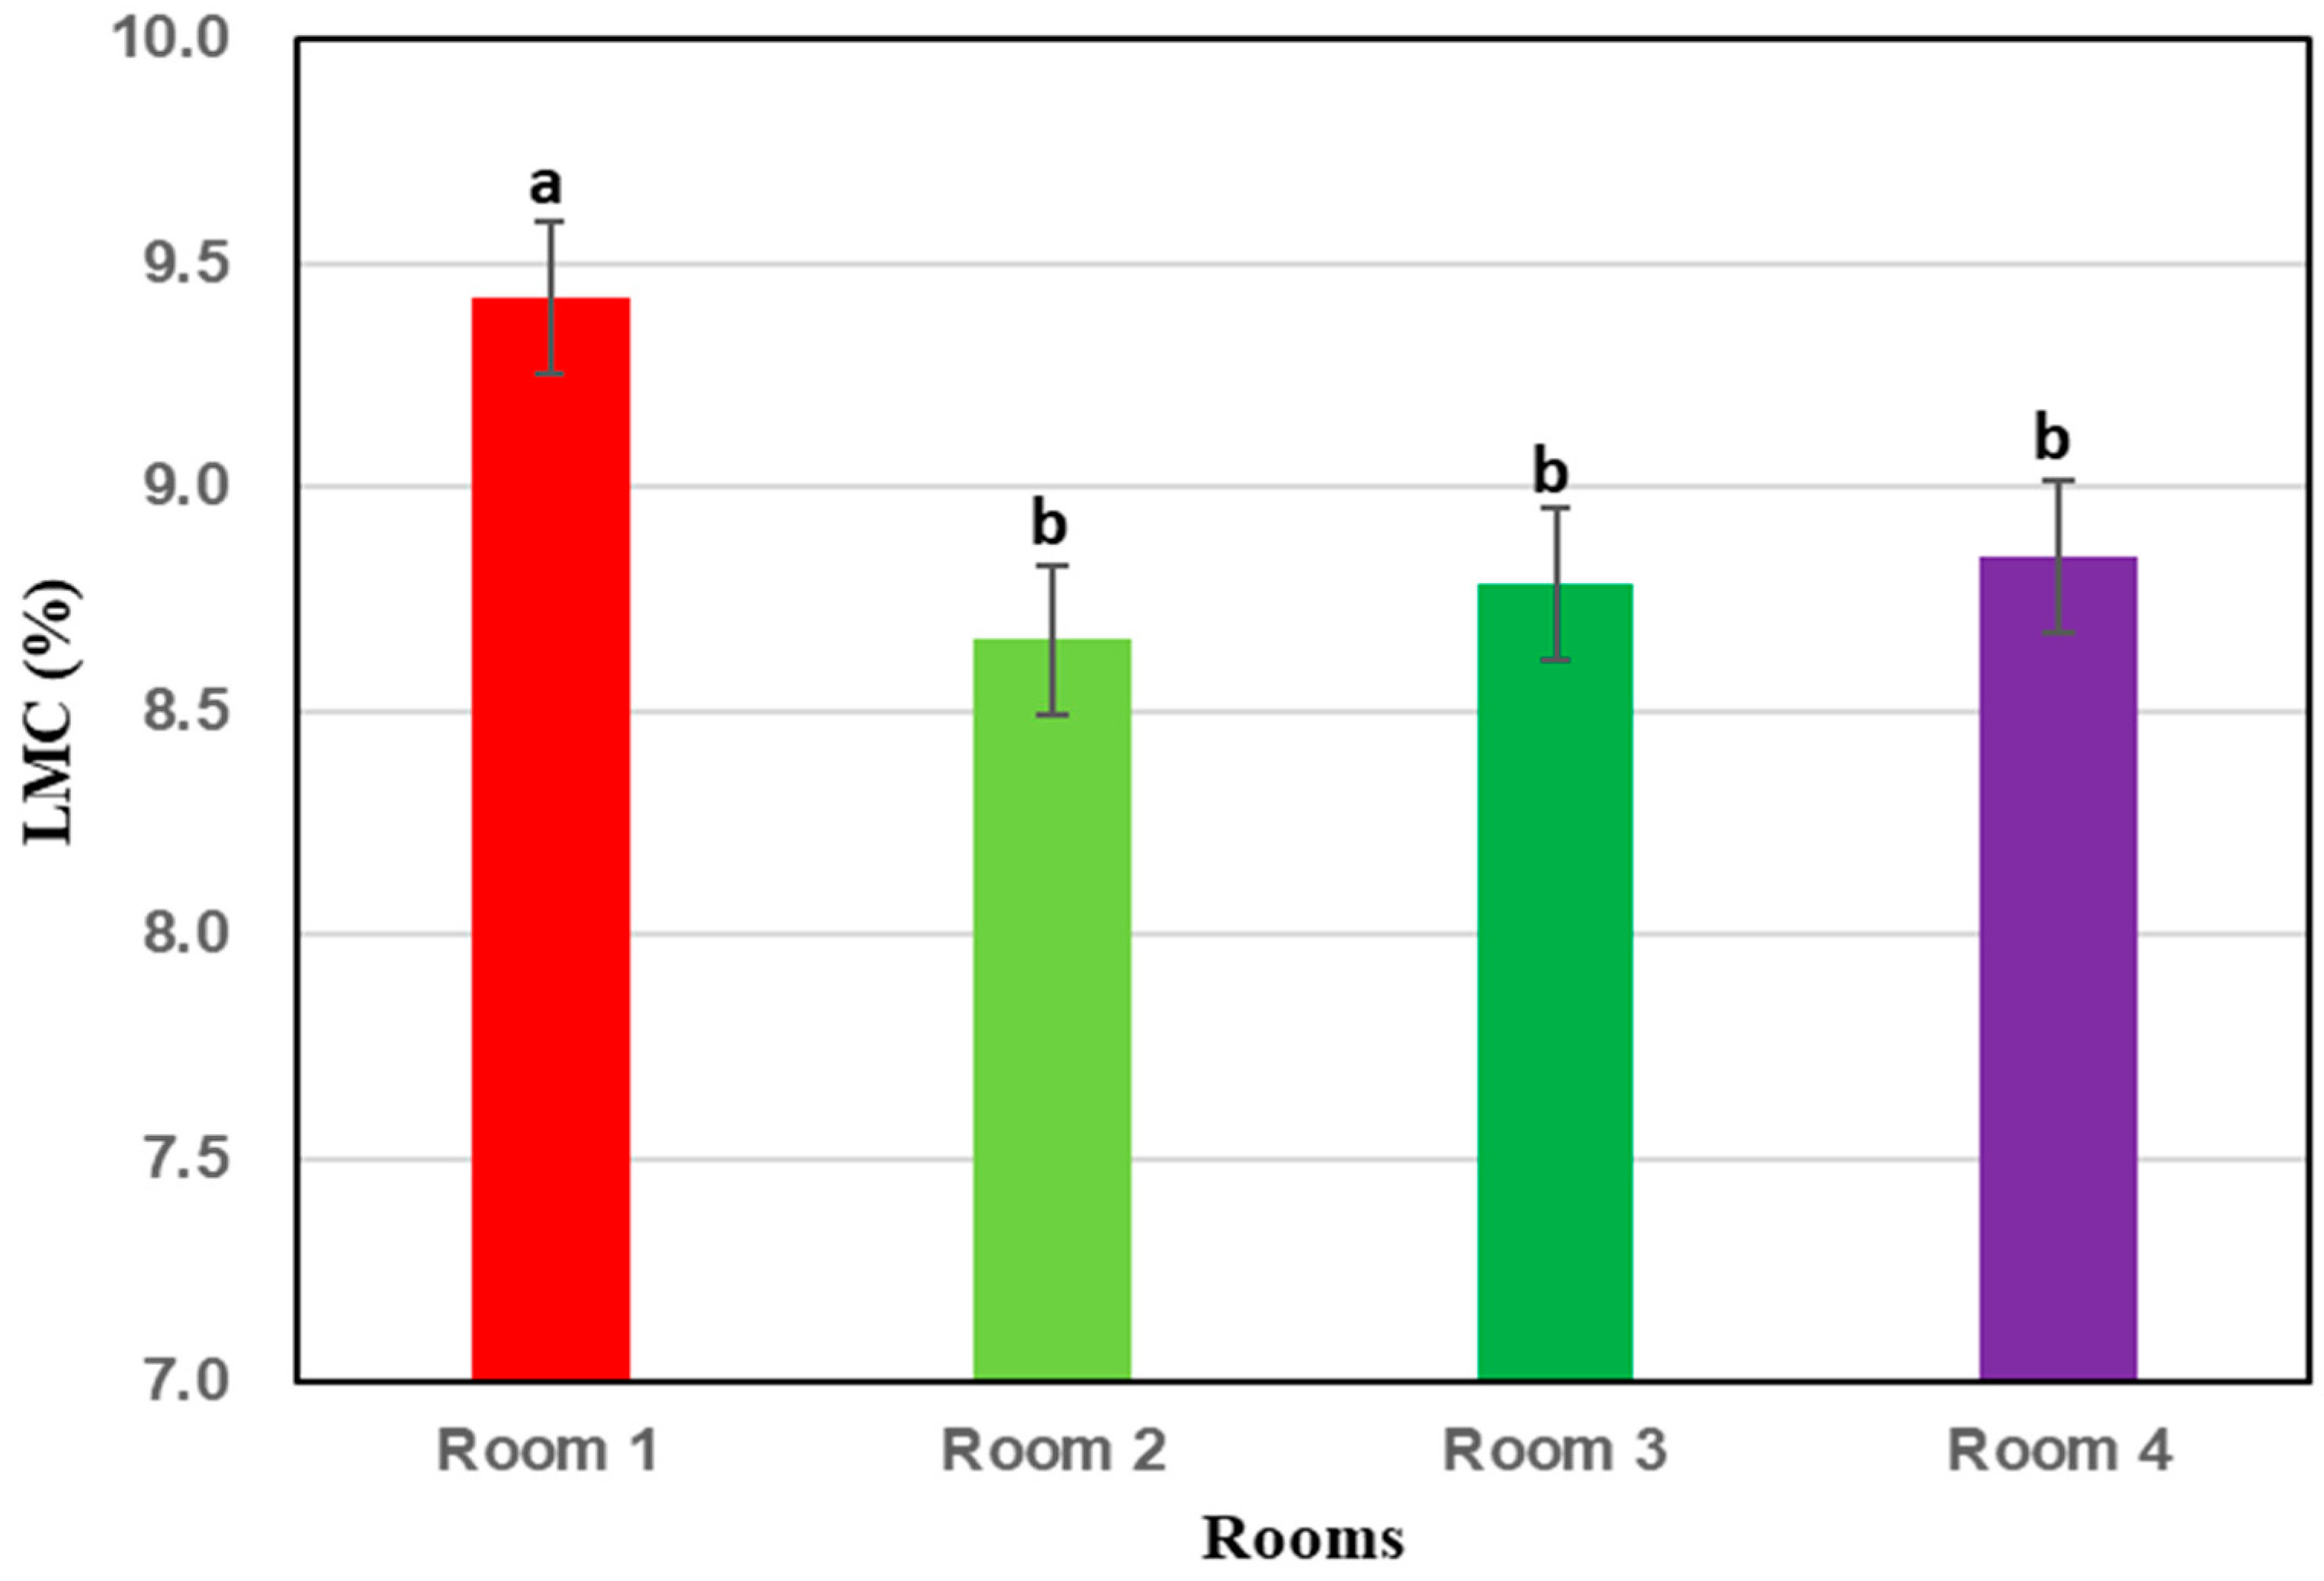
2.4. Litter Moisture Content

Litter moisture content (LMC) was measured by collecting four ziplock bags of 100 g of the litter sample (twice a week) from four locations within each room during the test. The collected litter samples were transported to the UGA poultry science laboratory for further analysis. At the lab, 100 g of each litter sample was mixed uniformly, and two samples of 10 grams were taken from each bag (one for analysis and another for validation). Litter samples were weighed in a Mettler AE 160 (Mettler-Toledo, Columbus, OH, USA) as the Mettler AE 160 provides an enclosed space, thus preventing outside air from interfering with the sample weighting. The samples were placed in an aluminum container, and the initial weight was measured. After weighing, the samples were transferred to a THELCO Laboratory oven (Precision Scientific; Chicago, IL, USA) and heated at 105 °C for 24 h. After 24 h, the litter samples were taken out, and final litter weights were recorded. The LMC was calculated with the following Equation (1).
L M C = 100 × L W W L D W L W W
where LMC—litter moisture content, %; LWW—wet litter weight, and g; LDW—dry litter weight, g.

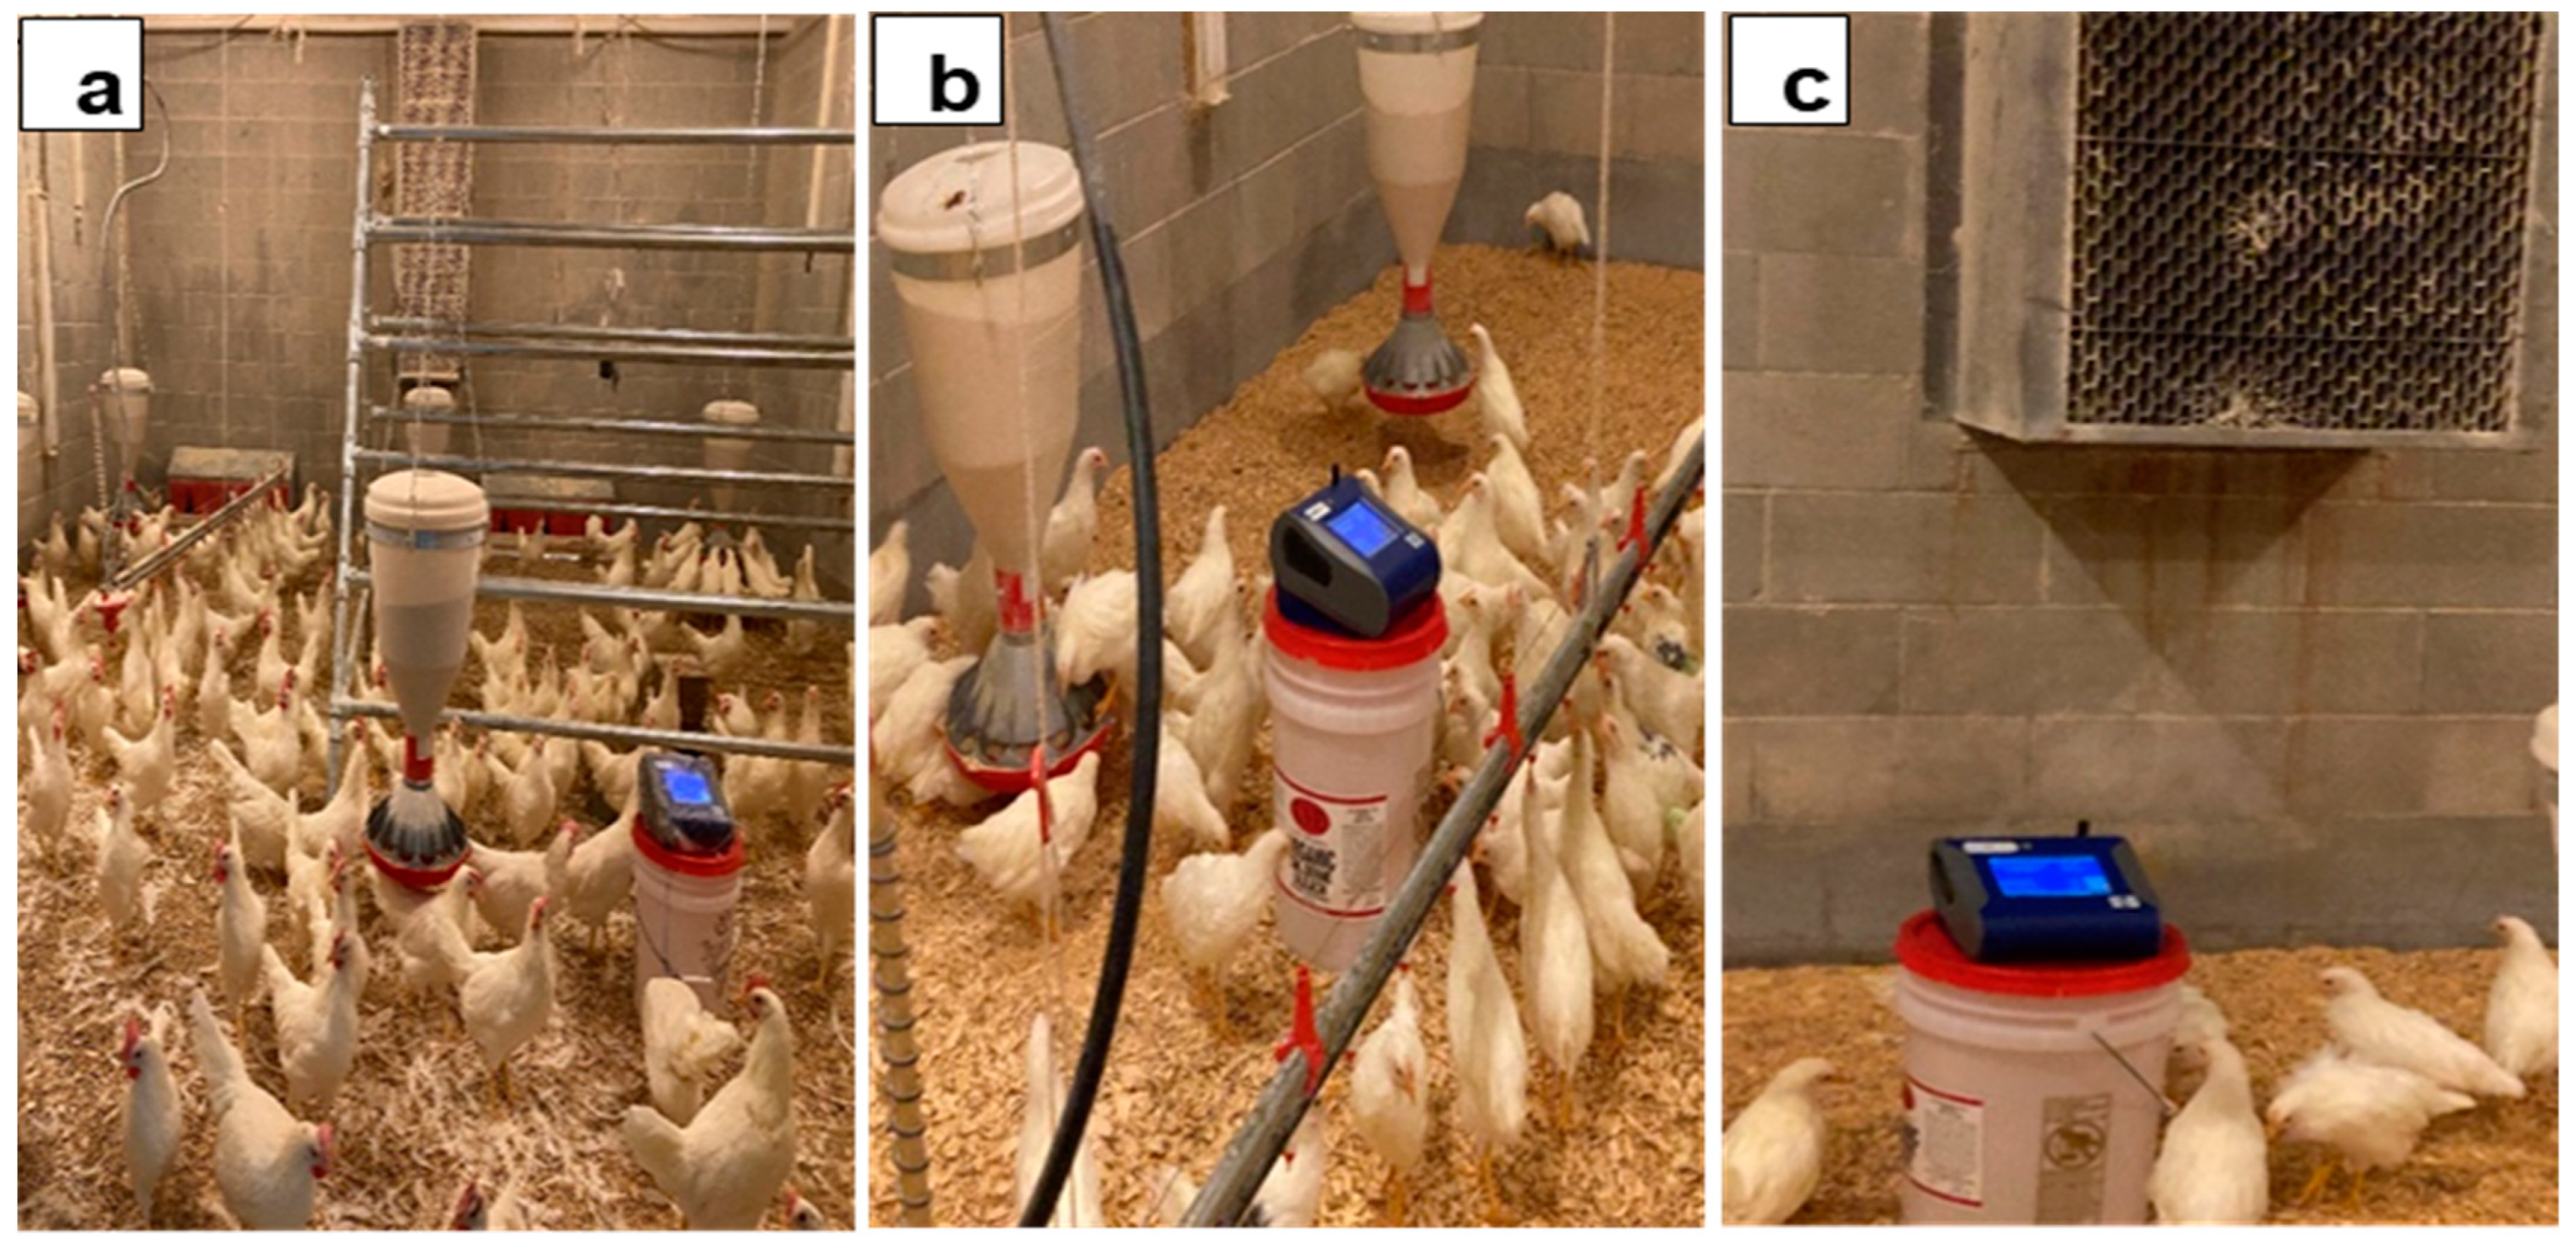
2.5. Particulate Matter Measurements

Particulate matter was measured twice a week manually with the help of an optical PM sensor (DustTrak DRX Aerosol Monitor 8533, TSI Incorporated, Shoreview, MN, USA). The PM sensor measured PM of different particle sizes (e.g., PM1, PM2.5, PM4, PM10, and TSP, respectively) at three different locations inside each room: near the perch, in between the feeder and drinker, and near the exhaust ventilation (Figure 4). These three locations were selected for PM monitoring as the hens spent most of their time drinking, walking, perching, preening, nesting, and resting [36]. Of the hens’ daily activities, resting (27.72%) and perching (13.56%) accounted for the most time. Most of the birds use perch for resting [37]. Perching behaviors are associated with running and flipping wings, causing an increase in PM generation. In addition, the reason for choosing the location between feeder and drinker was due to their time spent drinking (1.36%) and feeding (11.57%). In addition, the hens walked around almost 11% of each day around the room. Similarly, the reason behind choosing a near exhaust fan was because an exhaust fan can help remove the PM matters and other pollutants and therefore was deemed the perfect place to compare. Before taking measurements, the PM sensor was positioned 36 cm above the floor litter to prevent interference from chicken pecking behavior. In addition, the PM sensor was covered with plastic (keeping the PM sensor inlet open) to avoid dust accumulation inside or over the sensor (Figure 4a). To improve PM reading accuracy, the PM sensor was sent for manufacturer calibration (multi-point) prior to the start of the research, and was maintained by zero calibrating, changing a filter, and cleaning inside once every two weeks during the research. The device was programmed to monitor PM levels for 2 min (one reading each 5 s, a total of 24 readings per measurement). The first 30 s of PM reading (6 samples) were not used for data analysis considering the potential interferences of sensor relocation. Only one PM sensor was used for all the measurements taken throughout the entire study period. Similarly, the sampling locations remained constant throughout, while the rooms were randomly selected each time for sampling.

2.6. Ammonia Measurement

Ammonia was measured using the Drager DOL-53 NH3 sensor (Dol-sensors A/S, Aarhus N, Denmark) connected to Onset’s HOBO RX3000 (Onset Computer Corporation, Bourne, MA, USA). Each room had one DOL sensor and was placed 0.91 m above the floor litter. The NH3 reading was recorded from 8 WOA onwards as the NH3 concentration before 8 WOA was negligible (<0.3 ppm) inside each room. The NH3 sensor was programmed to record data every minute for 24 h every day until 16 WOA. Every week the NH3 levels inside the room were verified with the help of the manually operated Kitagawa NH3 Sampling Pump (Kit AP-20; Figure 5) with gas detection tubes (PN#105SC; accuracy ±5% to ±15% and sampling range 5 to 260 ppm) at sampling times of 1 min. The detection tubes used in this study were single-use tubes.

2.7. Statistical Data Analysis

In this study, four CF floor-raised rooms were considered a block (identical room), and weeks were considered the treatment. Statistical analyzes were performed using JMP Pro-16 (SAS Institute Inc., Cary, NC, USA). The PM, LMC, and NH3 data collected from each room were analyzed using a Randomized Complete Block Design method. First, the PM data (n = 4) were normalized using log transformation and then analyzed using the two-way ANOVA. Similarly, LMC (n = 4) and NH3 (n = 4) data included the week as the main effects, while rooms were considered a block, and therefore they were also assessed using the two-way ANOVA. Finally, the means were separated by the LSMeans Tukey HSD method, and the difference was considered statistically significant at p < 0.05.
The mathematical model for PM, NH3, and LMC data was fitted for this study as follows:
y i j = μ + τ i + β j + ε i j    
where y i j —the PM, NH3, or LMC observation of the ith WOA treatment in the jth block room; μ is the overall mean of the monitored PM, NH3, or LMC; τ_iith WOA treatment effect for PM (i = 1, 2, 3, 4, 5, 6, 7, 8, 9, 10, 11, 12, 13, 14, 15, and 16 WOA), NH3, or LMC (i = 8, 9, 10, 11, 12, 13, 14, 15, and 16 WOA); β_jjth block room effect; j = 1, 2, 3, 4; and ε_ij represents the NID (0, σ2) errors.

3. Results and Discussion

3.1. Temperature and Relative Humidity

As the pullets aged from 1 to 16 weeks old, the temperature inside the rooms decreased from 32 °C to 21 °C (90 °F to 70 °F), respectively, suggesting that a high temperature is required during the early stage of chick development than in the later stages (Figure 6). The average temperature and RH of the rooms at the pullet stage (1–16 WOA) were 23.90 °C ± 3.38 °C (75.02 ± 6.29 °F) and 58.64 ± 16.39%, respectively. However, this study found the highest RH (almost 90%) at 7 WOA due to heavy rainfall.

3.2. Litter Moisture Content Data

The LMC changes as the bird’s age increases but depends on other factors, such as the external environment [3]. These results indicate that the LMC in the litter significantly differed with pullet age, as shown in Figure 7 (p < 0.01). The LMC recorded was below 10%, which was exceptionally low compared to commercial houses. According to previous studies, maintaining a low LMC (below 10% or 20%) is preferable, leading to lower ammonia emissions from the litter [6]. One possible reason for the dry litter observed in this study could be due to the two circulating fans that continually operated. These fans helped to circulate the air across the floor litter, facilitating the faster evaporation of moisture and reducing the LMC [38].
Rooms with similar treatments usually have a similar LMC and RH. However, these results show that three rooms (far from the outside environment and close to each other’s rooms) show similar LMC, while the one room in which the wall is attached to the outside environment possessed a significantly higher LMC due to higher RH and ventilation rates. In hot weather, the wall of Room 1 facing the outside environment heated up, causing the ventilation fan to run frequently. This results in increased moisture entering the room, leading to higher levels of RH and LMC, as shown in Figure 8.

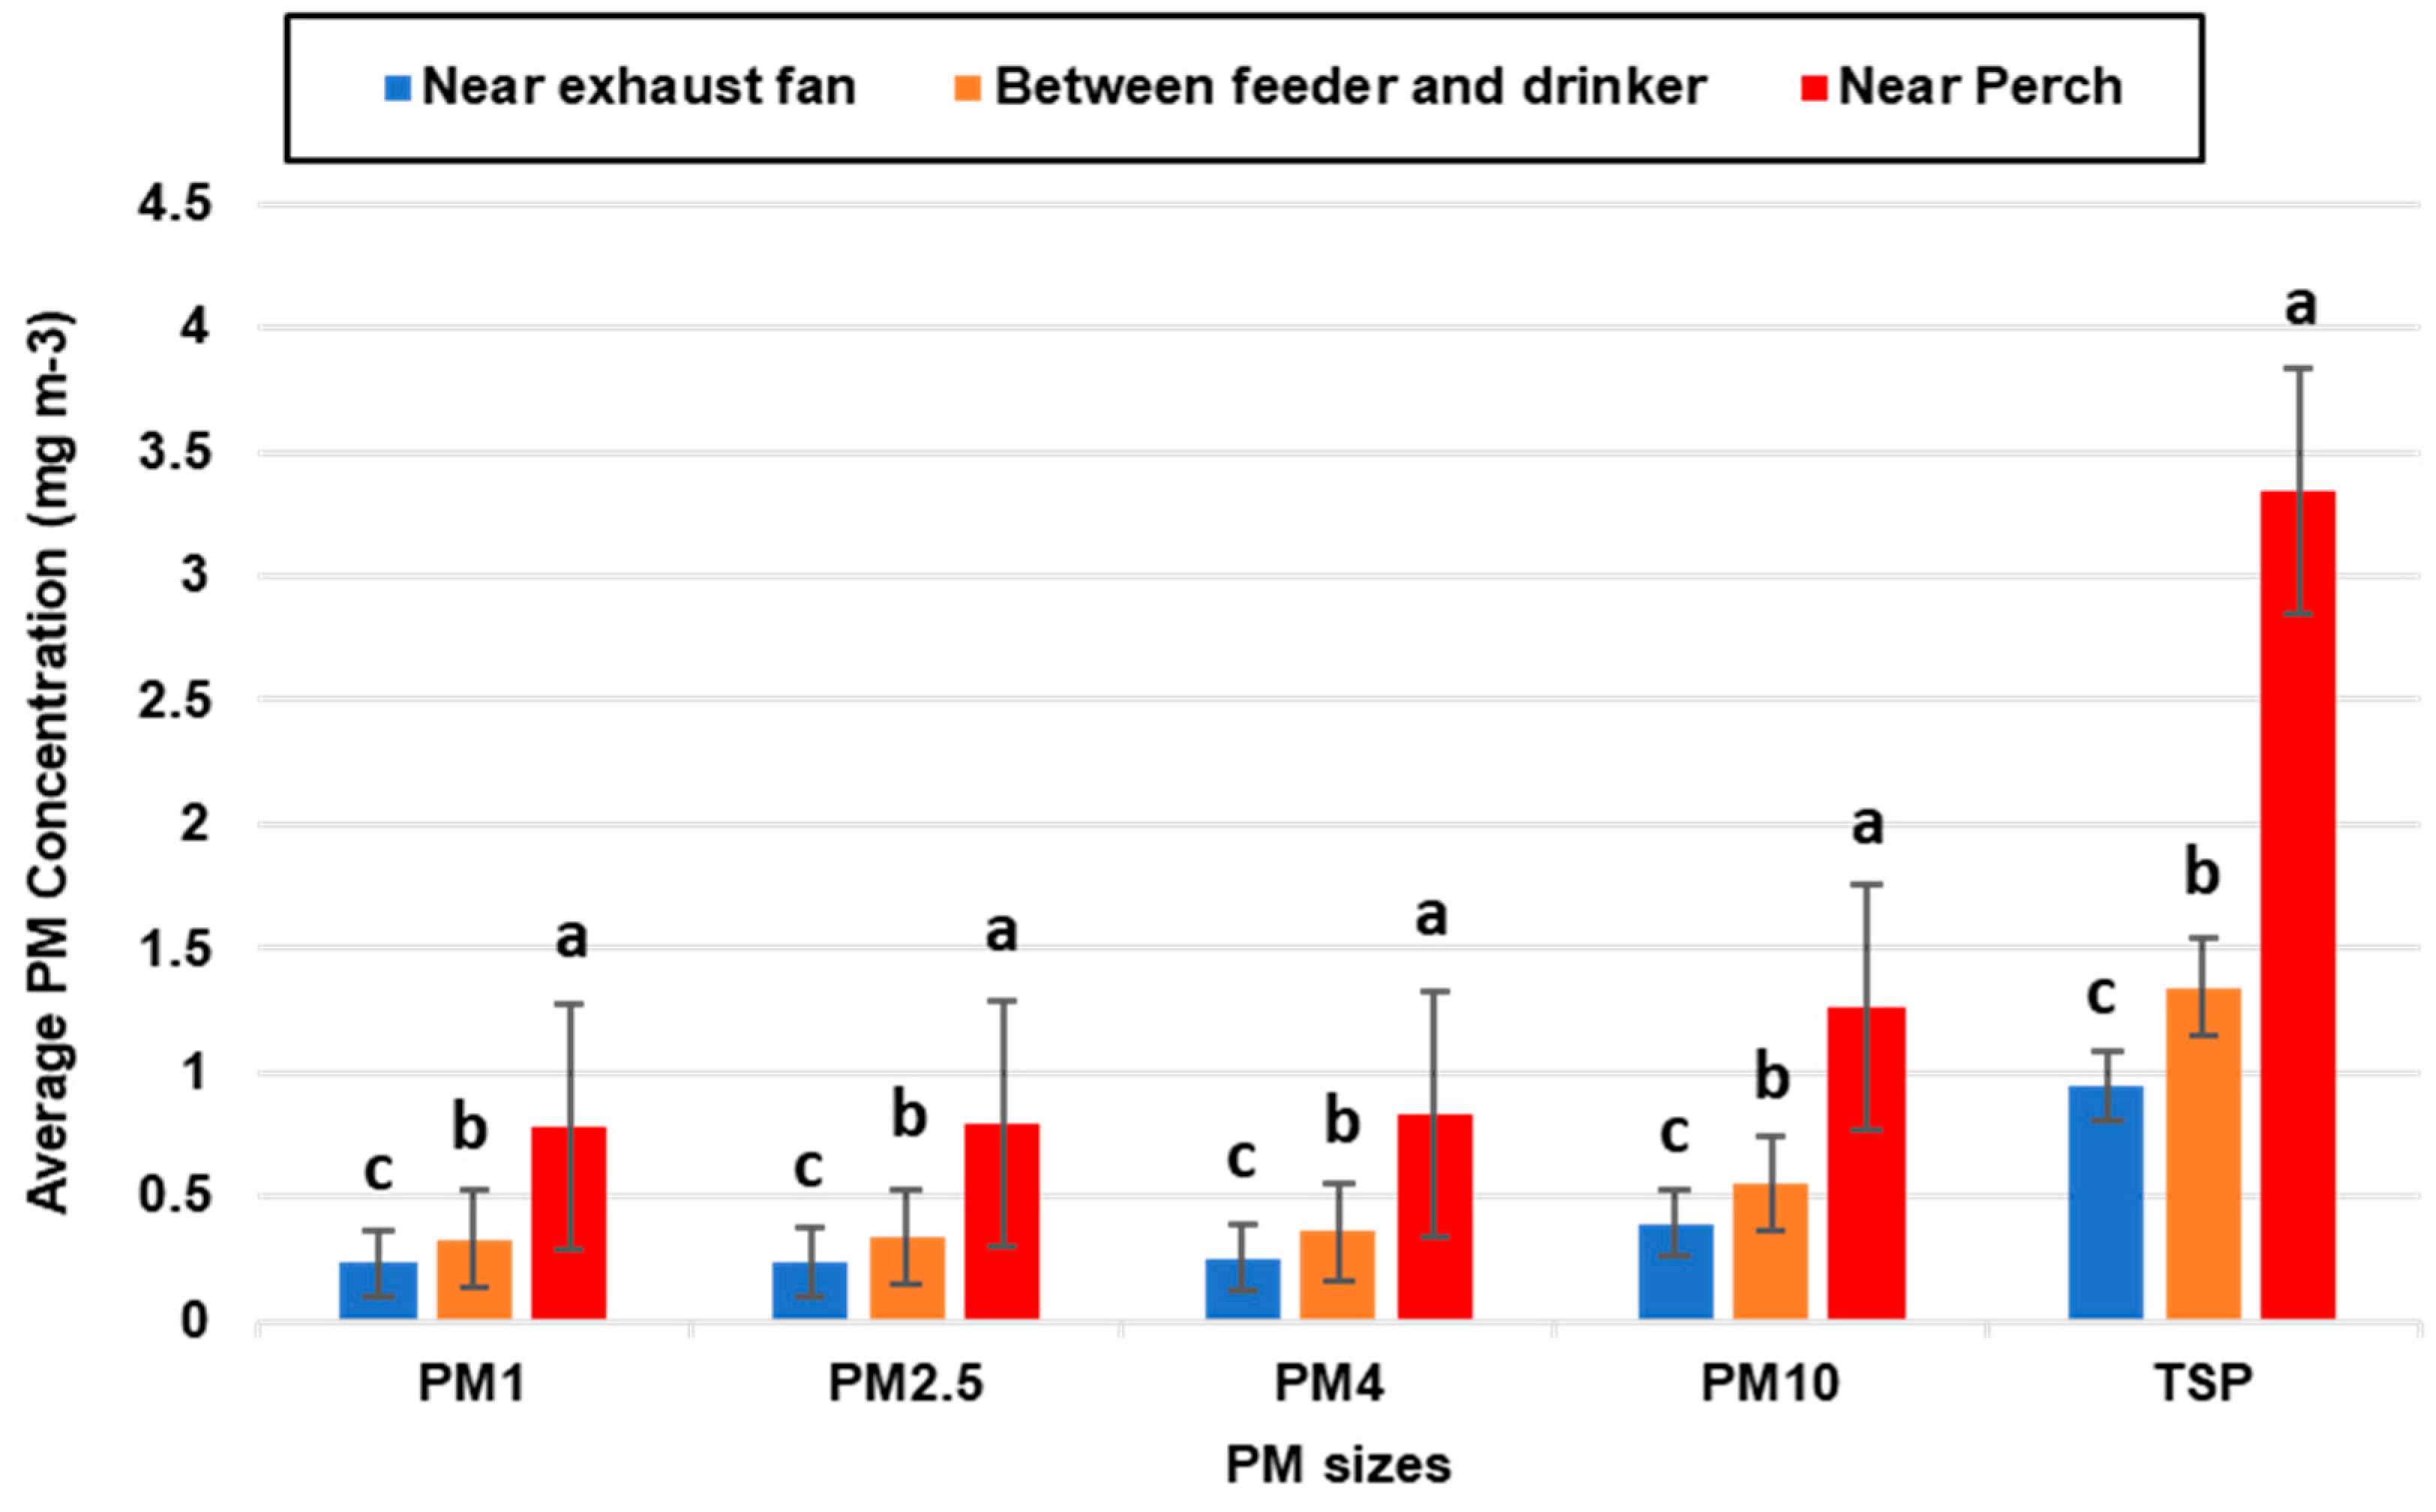
3.3. Particulate Matter Concentration

The results show that pullets’ age significantly affected the PM concentration, similar to those observed in broiler houses [33]. In this study, the PM concentration increased with the increase of pullets’ age in all four rooms (p < 0.01) (Table 1). The PM1, PM2.5, PM4, PM10, and TSP levels were 0.022 ± 0.003, 0.023 ± 0.003, 0.024 ± 0.003, 0.031 ± 0.004, and 0.058 ± 0.013 mg m−3 on the first WOA, and reached 1.394 ± 0.573, 1.436 ± 0.579, 1.587 ± 0.620, 2.723 ± 1.094, and 6.387 ± 2.963 mg m−3 by 16 WOA, respectively. Similarly, PM depends on the RH inside the house [8,39]. At 7 WOA, a slight decrease in PM concentrations was observed due to the highest RH observed over 16 weeks of rearing. A higher RH level makes dust heavy to settle down and decreases the PM concentration in the air [8,40].
The levels of PM were found to vary across different zones (i.e., between the feeder and the drinker, the exhaust fan, and the perching zones) of the same room due to bird activities (e.g., perching) and LMC on the floor [7,10,11]. In addition, all the activities were monitored and observed with the help of a camera for 24 h [41]. The results showed that the PM concentration near the perches was significantly higher than in other locations, such as areas near the exhaust fans, feeders, and drinkers in the same room (p < 0.01). A previous study found that the increased activities due to perching behavior were among the highest activities performed by birds daily [36]. The average PM levels near the perch (PM1: 0.780 ± 0.685; PM2.5: 0.792 ± 0.696; PM4: 0.833 ± 0.740; PM10: 1.260 ± 1.195; and TSP: 3.345 ± 3.098 mg m−3, respectively) were measured as two times higher than the reading at feeders and drinkers (PM1: 0.328 ± 0.305; PM2.5: 0.335 ± 0.313; PM4: 0.358 ± 0.337; PM10: 0.551 ± 0.547; and TSP: 1.345 ± 1.2954 mg m−3, respectively), and the exhaust fan (PM1: 0.230 ± 0.221; PM2.5: 0.236 ± 0.226; PM4: 0.254 ± 0.244; PM10: 0.394 ± 0.3844; and TSP: 0.944 ± 0.893 mg m−3, respectively; Figure 9). Similarly, the location between the feeder and the drinker showed higher activities after near the perch, mainly for dustbathing, foraging, feeding, and drinking, while the least performed activities, including dustbathing and foraging, were observed near the exhaust fan. The exhaust fan ran continuously for 5 min at on/off intervals based on the inside temperature. If the temperature was higher than the required temperature, small and large exhaust fans ran continuously until the room temperature was controlled. Thus, the high temperature caused the continuous running of the exhaust fans, bringing in more moisture, and increasing the RH and LMC levels inside the room, thus decreasing PM levels. In addition, the increased exchange of air pulled out PM from the rooms and subsequently decreased the PM levels [40,42].

3.4. Ammonia Concentration

The LMC plays an important role in NH3 generation, as high amounts of LMC promote the microbial breakdown of manure or litter nitrogen [9,43,44,45], resulting in higher volatilization of NH3 [9,43]. In this study, the NH3 concentration in all four rooms during pullet rearing was below 1 ppm (p = 0.13) due to the dry litter (i.e., LMC was 9–10%). At 16 WOA, the NH3 levels in all four rooms were found to be lower than 0.5 ppm with similar ventilation rates. Maintaining low NH3 concentrations can improve animal health and welfare. This finding differs from a previous study that monitored NH3 levels over 20 ppm during winter in commercial houses [7], where high NH3 levels were primarily generated from wet floor litter due to bird excretion deposition over time. In commercial poultry houses, heat insulation issues and reduced ventilation rates during the winter can also lead to high RH levels. However, our research rooms, which were chamber rooms inside a large building, had a better heating system, and we did not encounter any heating system issues during our entire research period, which may have contributed to the dry litter and lower NH3 concentrations observed. Another reason for the lower NH3 concentration could be the low stocking density per bird compared to commercial poultry houses.
This study identified that the perching area had higher PM levels than other places due to bird perching behaviors (perching and landing). This finding agrees with the previously reported situation in commercial CF houses in that bird landings from the aviary system generated the highest levels of daily PM [7]. As PM is the primary carrier of airborne bacteria that could lead to respiratory system issues in laying hens or pullets [8], mitigation strategies should be considered. Bedding amendments, electrostatic space charging systems, liquid spray, solid additives, and acid scrubbers have been evaluated or implemented to suppress the PM and NH3 levels and improve the health and welfare of birds and their caretakers [46,47,48,49,50]. In addition, optimizing the design of the perching system or adding bedding materials can help control the dust levels. For instance, frequently adding fresh bedding materials to perching areas can suppress dust generation due to the birds landing [8].

4. Conclusions

This study investigated the effects of bird age on air quality in CF research rooms during pullet rearing. We observed that PM concentration significantly changed with bird age. As the pullets grew older, the PM production increased significantly from 1 to 16 WOA. Similarly, PM1, PM2.5, PM4, PM10, and TSP concentrations at 16 WOA were 62–106 times higher than in the first week of pullet rearing. Furthermore, the perching area had almost twice higher PM concentrations than the other areas. In addition, the NH3 concentrations were recorded as low (<1 ppm) due to dry litter conditions. Therefore, this study’s results can aid producers and researchers in identifying strategies to mitigate air pollutants and the adverse effects on the health and well-being of laying hens from an early stage, which will ultimately improve their overall welfare. These findings will be further verified in commercial CF houses in the future.

Author Contributions

Methodology, R.B.B. and L.C.; Validation, R.B.B.; Formal analysis, R.B.B.; Investigation, R.B.B., X.Y., S.S., M.K.S., A.K.S. and L.C.; Resources, L.C.; Writing—original draft, R.B.B. and L.C.; Supervision, C.W.R., W.K.K. and L.C. All authors have read and agreed to the published version of the manuscript.

Funding

Egg Industry Center (EIC); USDA-NIFA AFRI (2022-33610-37532); USDA-NIFA AFRI CARE Program (2023-68008-39853); the USDA-Hatch projects: Future Challenges in Animal Production Systems: Seeking Solutions through Focused Facilitation (GEO00895; Accession Number: 1021519) and Enhancing Poultry Production Systems through Emerging Technologies and Husbandry Practices (GEO00894; Accession Number: 1021518); and from the UGA COVID Impact Research Recovery Funding.

Institutional Review Board Statement

Approved by the Institutional Animal Care and Use Committee (IACUC) before start-ing this research (AUF#: A2020 08-014-A1).

Informed Consent Statement

Not applicable.

Data Availability Statement

The data are available on reasonable request from the corresponding author.

Conflicts of Interest

The authors declare no conflict of interest.

References

  1. Mintus, C. More States in the United States to Switch to Cage-Free Eggs. Available online: https://www.thepoultrysite.com/news/2021/06/more-states-in-the-united-states-to-switch-to-cage-free-eggs (accessed on 1 April 2023).
  2. UEP Facts & Stats. United Egg Producers. 2021. Available online: https://unitedegg.com/facts-stats/ (accessed on 22 May 2022).
  3. Xin, H. Environmental Challenges and Opportunities with Cage-Free Hen Housing Systems. In Proceedings of the The XXV World’s Poultry Congress, Beijing, China, 5–9 September 2016; pp. 5–9. [Google Scholar]
  4. Gates, R.S.; Ramirez, B.; Li, G.; Xiong, Y.; Of, O.B. Evaluating Draft EPA Emissions Models for Laying Hen Facilities. Unitedegg 2022. Available online: https://unitedegg.com/wp-content/uploads/2022/06/EIC-Evaluation-of-Draft-EPA-Emissions-Models-for-Layers-06-09-2022.pdf (accessed on 1 April 2023).
  5. Greenwood, A. These 15 Restaurant Chains Are Switching To Cage-Free Eggs|HuffPost Impact. Available online: https://www.huffpost.com/entry/restaurants-cage-free-eggs_n_566f0497e4b011b83a6bfb02 (accessed on 1 April 2023).
  6. Chai, L.; Xin, H.; Zhao, Y.; Wang, T.; Soupir, M.; Liu, K. Mitigating Ammonia and PM Generation of Cage-Free Henhouse Litter with Solid Additive and Liquid Spray. Trans. ASABE 2018, 61, 287–294. [Google Scholar] [CrossRef]
  7. Chai, L.; Xin, H.; Wang, Y.; Oliveira, J.; Wang, K.; Zhao, Y. Mitigating Particulate Matter Generation in a Commercial Cage-Free Hen House. Trans. ASABE 2019, 62, 877–886. [Google Scholar] [CrossRef]
  8. Bist, R.B.; Chai, L. Advanced Strategies for Mitigating Particulate Matter Generations in Poultry Houses. Appl. Sci. 2022, 12, 11323. [Google Scholar] [CrossRef]
  9. Bist, R.B.; Subedi, S.; Chai, L.; Yang, X. Ammonia Emissions, Impacts, and Mitigation Strategies for Poultry Production: A Critical Review. J. Environ. Manag. 2023, 328, 116919. [Google Scholar] [CrossRef]
  10. Knight, R.M.; Tong, X.; Liu, Z.; Hong, S.; Zhao, L. Spatial and Seasonal Variations of PM Concentration and Size Distribution in Manure-Belt Poultry Layer Houses. Trans. ASABE 2019, 62, 415–427. [Google Scholar] [CrossRef]
  11. Lin, X.-J.; Cortus, E.; Zhang, R.; Jiang, S.; Heber, A. Ammonia, Hydrogen Sulfide, Carbon Dioxide and Particulate Matter Emissions from California High-Rise Layer Houses. Atmos. Environ. 2012, 46, 81–91. [Google Scholar] [CrossRef]
  12. Shen, D.; Li, C. Distribution of Particulate Matter and Ammonia in a Mechanically Ventilated Layer House. Anim. Environ. Welf. 2017, 10–16. [Google Scholar]
  13. Takai, H.; Pedersen, S.; Johnsen, J.O.; Metz, J.; Koerkamp, P.G.; Uenk, G.; Phillips, V.; Holden, M.; Sneath, R.; Short, J. Concentrations and Emissions of Airborne Dust in Livestock Buildings in Northern Europe. J. Agric. Eng. Res. 1998, 70, 59–77. [Google Scholar] [CrossRef]
  14. Hayes, M.; Xin, H.; Li, H.; Shepherd, T.; Zhao, Y.; Stinn, J. Ammonia, Greenhouse Gas, and Particulate Matter Emissions of Aviary Layer Houses in the Midwestern US. Trans. ASABE 2013, 56, 1921–1932. [Google Scholar]
  15. Zhao, Y.; Xin, H.; Shepherd, T.; Hayes, M.; Stinn, J.; Li, H. Thermal Environment, Ammonia Concentrations, and Ammonia Emissions of Aviary Houses with White Laying Hens. Trans. ASABE 2013, 56, 1145–1156. [Google Scholar]
  16. Qi, R.; Manbeck, H.; Maghirang, R. Dust Net Generation Rate in a Poultry Layer House. Trans. ASAE 1992, 35, 1639–1645. [Google Scholar] [CrossRef]
  17. Cambra-López, M.; Hermosilla, T.; Lai, H.T.; Aarnink, A.J.A.; Ogink, N. Particulate Matter Emitted from Poultry and Pig Houses: Source Identification and Quantification. Trans. ASABE 2011, 54, 629–642. [Google Scholar] [CrossRef]
  18. Miller, K.A.; Siscovick, D.S.; Sheppard, L.; Shepherd, K.; Sullivan, J.H.; Anderson, G.L.; Kaufman, J.D. Long-Term Exposure to Air Pollution and Incidence of Cardiovascular Events in Women. N. Engl. J. Med. 2007, 356, 447–458. [Google Scholar] [CrossRef] [PubMed]
  19. Cambra-López, M.; Aarnink, A.J.; Zhao, Y.; Calvet, S.; Torres, A.G. Airborne Particulate Matter from Livestock Production Systems: A Review of an Air Pollution Problem. Environ. Pollut. 2010, 158, 1–17. [Google Scholar] [CrossRef] [PubMed]
  20. Viegas, S.; Faísca, V.M.; Dias, H.; Clérigo, A.; Carolino, E.; Viegas, C. Occupational Exposure to Poultry Dust and Effects on the Respiratory System in Workers. J. Toxicol. Environ. Health Part A 2013, 76, 230–239. [Google Scholar] [CrossRef] [PubMed]
  21. WHO (World Health Organization). Health Effects of Particulate Matter: Policy Implications for Countries in Eastern Europe, Caucasus and Central Asia. 2013. Available online: https://apps.who.int/iris/handle/10665/344854 (accessed on 7 April 2022).
  22. Michiels, A.; Piepers, S.; Ulens, T.; Van Ransbeeck, N.; Sacristán, R.D.P.; Sierens, A.; Haesebrouck, F.; Demeyer, P.; Maes, D. Impact of Particulate Matter and Ammonia on Average Daily Weight Gain, Mortality and Lung Lesions in Pigs. Prev. Vet. Med. 2015, 121, 99–107. [Google Scholar] [CrossRef] [PubMed]
  23. Oyetunde, O.; Thomson, R.; Carlson, H. Aerosol Exposure of Ammonia, Dust and Escherichia Coli in Broiler Chickens. Can. Vet. J. 1978, 19, 187. [Google Scholar]
  24. Miles, D.; Branton, S.; Lott, B. Atmospheric Ammonia Is Detrimental to the Performance of Modern Commercial Broilers. Poult. Sci. 2004, 83, 1650–1654. [Google Scholar] [CrossRef]
  25. Wei, F.X.; Hu, X.F.; Sa, R.N.; Liu, F.; Li, S.; Sun, Q. Antioxidant Capacity and Meat Quality of Broilers Exposed to Different Ambient Humidity and Ammonia Concentrations. Genet. Mol. Res. 2014, 13, 3117–3127. [Google Scholar] [CrossRef]
  26. Piorkowska, K.; Żukowski, K.; Nowak, J.; Połtowicz, K.; Ropka-Molik, K.; Gurgul, A. Genome-wide RNA-Seq Analysis of Breast Muscles of Two Broiler Chicken Groups Differing in Shear Force. Anim. Genet. 2016, 47, 68–80. [Google Scholar] [CrossRef]
  27. Bonifacio, H.F.; Maghirang, R.G.; Trabue, S.L.; McConnell, L.L.; Prueger, J.H.; Bonifacio, E.R. TSP, PM10, and PM2.5 Emissions from a Beef Cattle Feedlot Using the Flux-Gradient Technique. Atmos. Environ. 2015, 101, 49–57. [Google Scholar] [CrossRef]
  28. U.S. Environmental Protection Agency. Particulate Matter (PM) Basics. Available online: https://www.epa.gov/pm-pollution/particulate-matter-pm-basics (accessed on 30 September 2022).
  29. Shepherd, T.A.; Zhao, Y.; Li, H.; Stinn, J.P.; Hayes, M.D.; Xin, H. Environmental Assessment of Three Egg Production Systems—Part II. Ammonia, Greenhouse Gas, and Particulate Matter Emissions. Poult. Sci. 2015, 94, 534–543. [Google Scholar] [CrossRef] [PubMed]
  30. WHO (World Health Organization). Air Quality Guidelines: Global Update 2005: Particulate Matter, Ozone, Nitrogen Dioxide, and Sulfur Dioxide; World Health Organization: Geneva, Switzerland, 2006; ISBN 92-890-2192-6. [Google Scholar]
  31. U.S. Environmental Protection Agency. National Ambient Air Quality Standards (NAAQS) for PM. Available online: https://www.epa.gov/pm-pollution/national-ambient-air-quality-standards-naaqs-pm (accessed on 30 September 2022).
  32. Redwine, J.S.; Lacey, R.E.; Mukhtar, S.; Carey, J. Concentration and Emissions of Ammonia and Particulate Matter in Tunnel–Ventilated Broiler Houses under Summer Conditions in Texas. Trans. ASAE 2002, 45, 1101. [Google Scholar] [CrossRef]
  33. Vucemilo, M.; Matković, K.; Vinković, B.; Jakšić, S.; Granić, K.; Mas, N. The Effect of Animal Age on Air Pollutant Concentration in a Broiler House. Czech J. Anim. Sci 2007, 52, 170–174. [Google Scholar] [CrossRef]
  34. Hy-Line International. Hy-Line W-36 Commercial Layers Management Guide. ENG.Pdf. Available online: https://www.hyline.com/filesimages/Hy-Line-Products/Hy-Line-Product-PDFs/W-36/36%20COM%20ENG.pdf (accessed on 10 September 2022).
  35. Kristensen, H.H. The Effects of Light Intensity, Gradual Changes between Light and Dark and Definition of Darkness for the Behaviour and Welfare of Broiler Chickens, Laying Hens, Pullets and Turkeys. Sci. Rep. Nor. Sci. Comm. Food Saf. 2008, 1–44. Available online: https://vkm.no/download/18.1b70ef9115d3ac37645b2b5/1500030302470/7643446bd0.pdf (accessed on 21 April 2022).
  36. Mishra, A.; Koene, P.; Schouten, W.; Spruijt, B.; Van Beek, P.; Metz, J. Temporal and Sequential Structure of Behavior and Facility Usage of Laying Hens in an Enriched Environment. Poult. Sci. 2005, 84, 979–991. [Google Scholar] [CrossRef]
  37. Bist, R.B.; Subedi, S.; Chai, L.; Regmi, P.; Ritz, C.W.; Kim, W.K.; Yang, X. Effects of Perching on Poultry Welfare and Production: A Review. Poultry 2023, 2, 134–157. [Google Scholar] [CrossRef]
  38. Ritz, C.W.; Fairchild, B.D.; Lacy, M.P. Litter Quality and Broiler Performance. UGA Extension Bulletin, 1267. 2009. Available online: https://esploro.libs.uga.edu/esploro/outputs/report/Litter-quality-and-broiler-performance/9949316366502959 (accessed on 8 August 2022).
  39. Just, N.; Duchaine, C.; Singh, B. An Aerobiological Perspective of Dust in Cage-Housed and Floor-Housed Poultry Operations. J. Occup. Med. Toxicol. 2009, 4, 13. [Google Scholar] [CrossRef]
  40. Pedersen, S.; Nonnenmann, M.; Rautiainen, R.; Demmers, T.; Banhazi, T.; Lyngbye, M. Dust in Pig Buildings. J. Agric. Saf. Health 2000, 6, 261. [Google Scholar] [CrossRef]
  41. Yang, X.; Chai, L.; Bist, R.B.; Subedi, S.; Wu, Z. A Deep Learning Model for Detecting Cage-Free Hens on the Litter Floor. Animals 2022, 12, 1983. [Google Scholar] [CrossRef] [PubMed]
  42. Chai, L.; Ni, J.-Q.; Diehl, C.A.; Kilic, I.; Heber, A.; Chen, Y.; Cortus, E.; Bogan, B.; Lim, T.; Ramirez-Dorronsoro, J.-C. Ventilation Rates in Large Commercial Layer Hen Houses with Two-Year Continuous Monitoring. Br. Poult. Sci. 2012, 53, 19–31. [Google Scholar] [CrossRef] [PubMed]
  43. Miles, D.; Rowe, D.; Cathcart, T. High Litter Moisture Content Suppresses Litter Ammonia Volatilization. Poult. Sci. 2011, 90, 1397–1405. [Google Scholar] [CrossRef] [PubMed]
  44. Koerkamp, P.G. Ammonia Emission from Aviary Housing Systems for Laying Hens: Inventory, Characteristics and Solutions; Wageningen University and Research: Wageningen, The Netherlands, 1998; ISBN 9798515234881. [Google Scholar]
  45. Liu, Z.; Wang, L.; Beasley, D.; Oviedo, E. Effect of Moisture Content on Ammonia Emissions from Broiler Litter: A Laboratory Study. J. Atmos. Chem. 2007, 58, 41–53. [Google Scholar] [CrossRef]
  46. Ritz, C.; Mitchell, B.; Fairchild, B.; Czarick III, M.; Worley, J. Improving In-House Air Quality in Broiler Production Facilities Using an Electrostatic Space Charge System. J. Appl. Poult. Res. 2006, 15, 333–340. [Google Scholar] [CrossRef]
  47. Melse, R.; Ogink, N.; Bosma, A. Multi-Pollutant Scrubbers for Removal of Ammonia, Odor, and Particulate Matter from Animal House Exhaust Air. In Exploring the Advantages, Limitations, and Economics of Mitigation Technologies; ISU College of Agriculture and Life Science University Extension: Ames, IA, USA, 2008. [Google Scholar]
  48. Zhao, Y.; Aarnink, A.; De Jong, M.; Ogink, N.; Koerkamp, P.G. Effectiveness of Multi-Stage Scrubbers in Reducing Emissions of Air Pollutants from Pig Houses. Trans. ASABE 2011, 54, 285–293. [Google Scholar] [CrossRef]
  49. Gustafsson, G.; Von Wachenfelt, E. Reducing Airborne Dust in a Loose-Housing System for Laying Hens. J. Agric. Sci. Technol. A 2012, 2, 350. [Google Scholar]
  50. Chai, L.; Zhao, Y.; Xin, H.; Wang, T.; Atilgan, A.; Soupir, M.; Liu, K. Reduction of Particulate Matter and Ammonia by Spraying Acidic Electrolyzed Water onto Litter of Aviary Hen Houses: A Lab-Scale Study. Trans. ASABE 2017, 60, 497–506. [Google Scholar]
Figure 1. Cage-free pullet research room used for this study.
Poultry 02 00024 g001
Figure 2. The light intensity setup during different stages of pullet rearing in four different CF floor-raised rooms from 1 WOA to 16 WOA.
Poultry 02 00024 g002
Figure 3. Ventilation rates were set during different stages of pullet rearing in CF floor-raised housing from 1 WOA to 16 WOA (e.g., the fan’s running time was set up as 45 s per 5 min, equivalent to 0.9 m3 bird−1 h−1).
Poultry 02 00024 g003
Figure 4. PM concentration measurement at three locations: (a) near the perch, (b) between the feeder and the drinker, and (c) near the exhaust fan with the help of the TSI DustTrak optical sensor.
Poultry 02 00024 g004
Figure 5. Daily ammonia concentration measurements taken with the help of the (a) DOL 53 sensor, recorded on (b) Onset’s HOBO RX3000, and verified using the (c) Kitagawa Ammonia Sampling Pump Kit AP-20 with gas detection tubes once a week.
Poultry 02 00024 g005
Figure 6. Average temperature and RH measured during pullet rearing in CF housing from 1 WOA to 16 WOA. Temperature measured in degrees Fahrenheit (°F) and RH- relative humidity measured in percentage. Arrorw indicates that the highest RH happened at 7 WOA.
Poultry 02 00024 g006
Figure 7. Percentage changes in LMC at different pullet rearing in CF floor-raised housing from 8 WOA to 16 WOA (different letters represent significant differences at p < 0.01; n = 4).
Poultry 02 00024 g007
Figure 8. LMC at different pullet rearing in four identical CF floor-raised rooms from 8 WOA to 16 WOA (different letters represent significant difference at p < 0.01; n = 4).
Poultry 02 00024 g008
Figure 9. Average PM concentration at three different locations within CF floor-raised housing. Different letters represent significant differences at p < 0.01; Number of replicates (n) = 4.
Poultry 02 00024 g009
Table 1. Average PM concentration of different sizes in CF floor-raised housing during pullet rearing.
Weeks *PM1 (mg/m3)PM2.5 (mg/m3)PM4 (mg/m3)PM10 (mg/m3)TSP (mg/m3)
10.022 ± 0.0030.023 ± 0.0030.024 ± 0.0030.031 ± 0.0040.058 ± 0.013
20.032 ± 0.0130.033 ± 0.0130.035 ± 0.0130.052 ± 0.0220.123 ± 0.064
30.047 ± 0.0090.048 ± 0.0090.050 ± 0.0100.075 ± 0.0150.184 ± 0.052
40.074 ± 0.0270.075 ± 0.0270.079 ± 0.0280.122 ± 0.0490.316 ± 0.155
50.113 ± 0.0910.115 ± 0.0920.123 ± 0.0950.187 ± 0.1350.469 ± 0.349
60.171 ± 0.1140.174 ± 0.1140.182 ± 0.1180.246 ± 0.1430.631 ± 0.426
70.112 ± 0.0630.114 ± 0.0630.120 ± 0.0640.182 ± 0.0930.497 ± 0.297
80.275 ± 0.2210.279 ± 0.2220.293 ± 0.2280.419 ± 0.3001.147 ± 0.806
90.432 ± 0.2550.439 ± 0.2560.461 ± 0.2610.646 ± 0.3381.733 ± 0.913
100.607 ± 0.3380.619 ± 0.3430.649 ± 0.3510.924 ± 0.4652.412 ± 1.304
110.631 ± 0.3640.641 ± 0.3660.673 ± 0.3750.969 ± 0.5132.573 ± 1.461
120.852 ± 0.5120.867 ± 0.5150.916 ± 0.5301.395 ± 0.7753.602 ± 2.245
130.897 ± 0.4840.914 ± 0.4880.966 ± 0.5051.480 ± 0.7593.842 ± 2.169
140.912 ± 0.5500.929 ± 0.5550.983 ± 0.5731.528 ± 0.8673.950 ± 2.494
150.938 ± 0.4410.955 ± 0.4441.001 ± 0.4561.856 ± 0.6814.345 ± 1.901
161.394 ± 0.5731.436 ± 0.5791.587 ± 0.6202.723 ± 1.0946.387 ± 2.963
* Number of replicates (n) = 4; PM, particulate matter; and TSP, total suspended particles. Bold letters at 7 WOA represent the decrease in PM concentration, while bold letters at 16 WOA represent the highest PM concentration during pullet rearing.
Disclaimer/Publisher’s Note: The statements, opinions and data contained in all publications are solely those of the individual author(s) and contributor(s) and not of MDPI and/or the editor(s). MDPI and/or the editor(s) disclaim responsibility for any injury to people or property resulting from any ideas, methods, instructions or products referred to in the content.

