Article

Mechanosynthesis, Structure and Photoluminescent Properties of the Pr3+ Doped LiNbO3, LiNbO3:Mg, LiTaO3 Nanopowders

1
Department of Semiconductor Electronics, Lviv Polytechnic National University, 12 Bandery Str., 79013 Lviv, Ukraine
2
Scientific Research Company ‘Electron-Carat’, 202 Stryjska St., 79031 Lviv, Ukraine
3
Institute for Sorption and Problems of Endoecology, NASU, 13 Gen. Naumov St., 03164 Kyiv, Ukraine
4
Institute for Energy Research and Physical Technologies, Clausthal University of Technology, 19B Am Stollen, 38640 Goslar, Germany
5
Department of Sensory and Semiconductor Electronics, Ivan Franko National University of Lviv, 107 Tarnavskogo Str., 79017 Lviv, Ukraine
6
G.V. Kurdyumov Institute of Metal Physics NASU, 36 Acad. Vernadsky Bvd., 03142 Kyiv, Ukraine
*
Author to whom correspondence should be addressed.
Powders 2023, 2(3), 562-577; https://doi.org/10.3390/powders2030035
Submission received: 17 April 2023 / Revised: 1 July 2023 / Accepted: 18 July 2023 / Published: 21 July 2023
(This article belongs to the Special Issue Feature Papers in Powders 2023)

Abstract

:
In the current work, nanocrystalline powders with different compositions, namely Li0.98Pr0.02NbO3, Li0.93Pr0.02Mg0.05NbO3 and Li0.98Pr0.02TaO3 were synthesized for the first time using the method of high-energy ball milling of the starting materials (Li2CO3, Nb2O5, Ta2O5, MgO, Pr6O11), followed by high-temperature annealing. XRD data analysis confirmed the absence of parasitic phases in the obtained nanocrystalline compounds. The estimated particle sizes ranged from 20 to 80 nm. From the obtained nanopowders, ceramic samples were prepared using specially developed equipment, which allowed for pressing at elevated temperatures with a simultaneous application of a constant electric field. The obtained photoluminescence spectra exhibit characteristic features of Pr3+ ions in the crystal structure of LiNbO3 and LiTaO3 and are most efficiently excited by UV light. Samples pressed with an electric field application show higher intensity of photoluminescence. Investigations of the temperature dependence of electrical conductivity of the Li0.98Pr0.02NbO3 sample, pressed with the application of an electric field, indicate that the conductivity mechanism is similar to that of LiNbO3 single crystals and, at high temperatures, is attributed to the lithium conduction mechanism.

1. Introduction

Lithium niobate (LiNbO3, LN) and lithium tantalate (LiTaO3, LT) single crystals doped with Pr3+ ions (LN:Pr, LT:Pr) have attracted the researcher’s attention since the 1990s [1,2]. The Pr3+-doping of LN and LT allows to create effective oxide phosphors that emit light in the red region of the spectrum [3]. Further, the unique physical and chemical properties of LiNbO3 crystals make it possible to produce multifunctional active elements for optoelectronic devices and sensors. In this context, recent years’ results concerning piezoluminescence in LN:Pr and LT:Pr are of particular interest, for example, for creating pressure sensors [4,5]. Further, doped nanomaterials can be used as nanoscale fillers in glasses, polymers and liquids to modify their optical, electrophysical or magnetic properties. One recent example of such an application is the creation of a relatively stable colloid of lithium niobate nanoparticles [6]. Further, recent research on up-conversion luminescence of erbium and ytterbium-doped lithium niobate nanoparticles has shown temperature dependence that holds promise for applications in thermometry [7]. Moreover, the luminescent properties of praseodymium in other ferroelectric niobates also attracted attention as promising sensor materials [8,9,10,11,12]. The strong intensity of mechano- and photoluminescence was observed by authors [3] in congruent LN:Pr single crystals grown by Czochralski technique as well as in LN congruent crystals, co-doped with Pr and Mg. Further, the study of the mechanoluminescent and photoluminescent properties of LiNbO3:Pr and LiTaO3:Pr, prepared in form of micropowders using solid-phase synthesis from a mixture of the corresponding starting oxides and lithium carbonate was performed in [4]. To the best of our knowledge, nanocrystalline powders of LiNbO3 and LiTaO3 doped with Pr ions have not yet been synthesized and studied. However, they may be of practical importance as luminescent materials. Further, the investigations of nanopowder properties are often performed for samples, which are pressed and prepared as ceramics. However, for materials that exhibit ferroelectric properties (LN and LT), questions arise: will the polarization of individual particles influence the pressing processes, and how might the properties of the material, particularly its luminescent properties, change if the pressing process is performed at elevated temperatures and with simultaneous application of an electric field?
This work is focused on the study of LiNbO3, LiNbO3:Mg and LiTaO3 nanopowders doped with Pr3+ ions, which were obtained with the mechanosynthesis technique (high-energy ball milling and subsequent high-temperature annealing). Ceramic samples were prepared using specially designed equipment for pressing at elevated temperatures with a simultaneous application of an electric field in order to investigate the crystal structure, photoluminescence and electrophysical properties of obtained LN:Pr, LN:Mg,Pr and LT:Pr ceramic samples.

2. Materials and Methods

The mixed LN:Pr, LN:Mg, Pr and LT:Pr nanopowders were obtained with high-energy ball milling of Li2CO3, Nb2O5, Ta2O5, MgO, Pr6O11 powder mixtures (Alfa Aesar, purity 4N, Heysham, UK) taken in mass ratios corresponding to stoichiometric compositions. The milling was performed using the planetary ball mill (Pulverisette-7, Fritsch, Germany). The synthesis conditions were described elsewhere [13,14,15]. Thermal treatment of powders and pressed samples was carried out in air using a Nabertherm LHT 04/17 furnace (Lilienthal, Germany).
Phase compositions of obtained nanocrystalline powders were studied with the XRD analysis using the modernized DRON-3M diffractometer (Lviv, Ukraine).
Experimental pressing equipment and process will be described below (Section 3.2). In the experiments, a laboratory press, which could provide a force of 10 tons, was used.
The photoluminescence (PL) and photoluminescence excitation (PLE) spectra were studied using a SOLAR CM 2203 spectrofluorometer (Minsk, Belarus).
The temperature dependence of electrical conductivity was determined with impedance measurements in the frequency range from 1 Hz to 1 MHz. For this purpose, a phase impedance gain analyzer (Solartron 1260, Ametek Scientific Instruments, Hampshire, UK) was used. The measurements were performed on LN:Pr pressed pellet with thickness of 1.3 mm and diameter of 10 mm. Platinum electrodes (6 mm in diameter) were deposited on both sides of the sample using screen printing (print ink: Ferro Corporation, No. 6412 0410). Subsequently, the sample was annealed at 1000 °C for 30 min to ensure the electrodes adhesion.

3. Results

3.1. Synthesis and XRD Analysis of Nanopowders

In our previous studies [13,14,15], the technological advantages were shown for obtaining lithium niobate and lithium tantalate nanopowders with a mechanosynthesis technique compared to the wet chemistry method—a smaller number of operations, no need to use hazardous chemicals or a protective gas environment, high pressures, etc. In the present study, the nanopowders with nominal compositions Li0.98Pr0.02NbO3 (denoted as LN:Pr), Li0.93Mg0.05Pr0.02NbO3 (LN:Mg,Pr), Li0.98Pr0.02TaO3 (LT:Pr) were obtained with high-energy ball milling and subsequent annealing of the corresponding powders mixtures (Li2CO3, Nb2O5, Ta2O5, MgO, Pr6O11) taken in mass ratios corresponding to stoichiometric compositions.
The masses of the starting components are presented in Table 1.
The starting components were loaded into the mill chamber with a volume of 200 mL in an air environment. Zirconium dioxide balls with a diameter of 5 mm and a total weight of 91.5 g were used as working bodies. The ratio of the mass of balls to the mass of reagents was in the range of 8.0–8.4. The optimal modes, established in [13], were used for the milling process: the rotation speed was 600 rpm and the time of mechanical treatment for each composition was 15 h. There were three cycles of 5 h each with intermediate “loosening” of the partially compressed reaction mixture and removing gases (primarily CO2). Within each cycle, a reverse was applied every 30 min.
Mechanical processing of reagents ensures the activation of the surface of the particles. Still, it does not lead to the final synthesis of the crystalline nanopowder of the desired composition. The XRD pattern of LiNbO3:Pr powder only after grinding is shown in Figure 1 as an example and compared to the reference XRD pattern of LN. The results indicate the formation of a mostly amorphous precursor, the partial formation of the lithium niobate perovskite phase, and the partial decomposition of lithium carbonate.
Therefore, the next stage of preparation of LN:Pr, LT:Pr and LN:Mg,Pr nanopowders involves heat treatment of the precursors obtained after milling at 700 °C for 5 h. The heating rate was 300 °C/h, and cooling took place together with the furnace after its power was turned off. After the annealing procedure, the phase composition of the nanopowders was again studied, and the related XRD patterns are shown in Figure 2. The XRD analysis of the synthesized compounds indicates the absence of parasitic phases.
The average grain size of crystallites, which were evaluated from angular dependences of the Bragg’s maxima peak broadening, is about 20–80 nm. The LaB6 external standard was used as a correction of instrumental broadening.

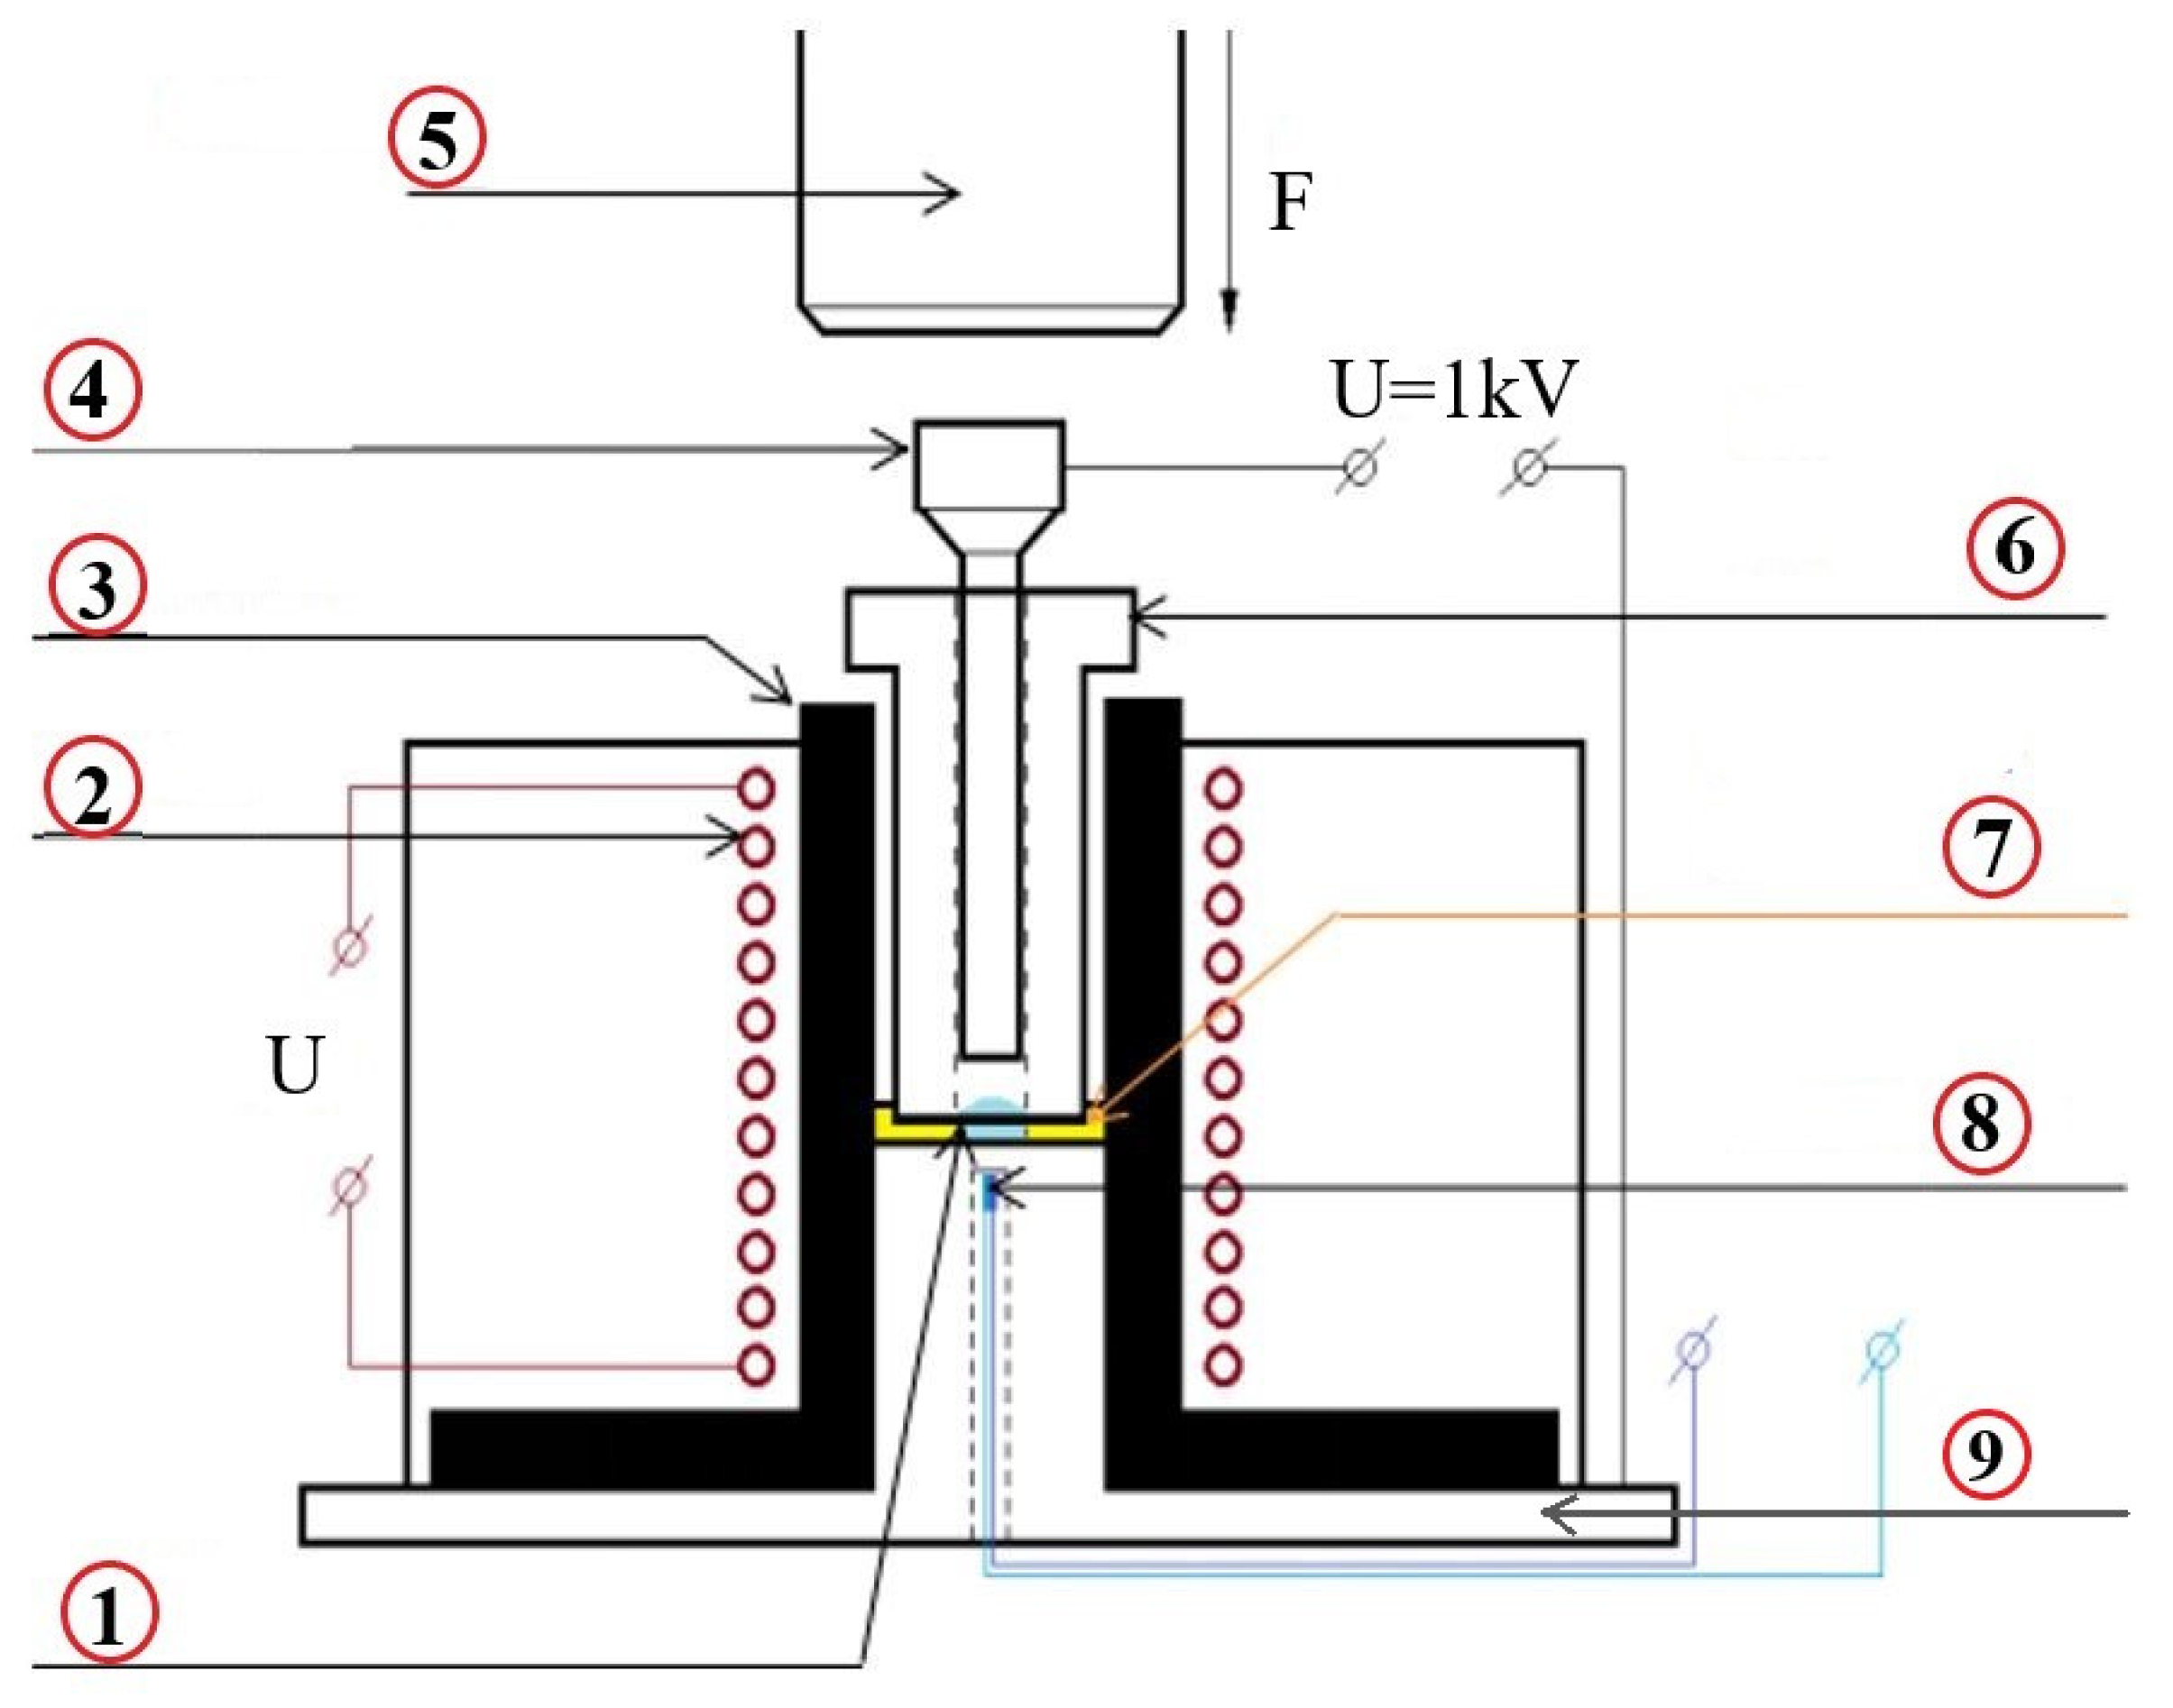
3.2. Samples Pressing

It is not always convenient to deal with the material in the nanopowder form for the practical use or for the study of physical properties. This, in particular, is related to luminescence studies when it is advisable to perform measurements on the most compacted samples.
Therefore, one of the tasks of this work was to develop special equipment for pressing pellets from nanopowders and to obtain ceramic samples for measurements.
The literature [16,17,18,19,20,21,22,23,24,25,26,27,28,29,30] was reviewed before starting the development and manufacturing of the equipment. These works concerned the preparation and study of ceramics from various niobate and tantalate powders. The results of this review are presented in Table 2.
As follows from the above data, the tantalum-containing ceramic samples were obtained and studied only in [24,27,28]. In addition, the nanopowder obtained by the sol-gel method was used as the starting material for pressing in only one work. The lithium niobate-based ceramics activated by rare earth ions Yb and Ho were also investigated. In most of the examined sources, polyvinyl alcohol was used during pressing for better particle agglomeration, which eventually burned out of the pressed samples during annealing at 500–700 °C. In different works, the values of applied pressures varied from 3 to 980 MPa. As a rule, the pressed samples were annealed at 900–1200 °C for 1–6 h in an oxidizing atmosphere (air or flowing oxygen).
It should be noted that the tablet hot pressing with the simultaneous application of electric field along with the heating of the sample was not considered in the studied works [11,12,16,17,18,19,20,21,22,23,24,25,26,27,28]. However, such an approach could have a positive influence in the case of ferroelectric materials pressing. The high temperature and electric field can contribute to greater compactness of the samples and at least partial ordering of the polar particles. Therefore, equipment for pressing nanopowders in an external electric field with the possibility of simultaneous heating was designed and manufactured for this work. The scheme of equipment for pressing nanopowders is shown in Figure 3.
The developed equipment allows us to study the photoluminescent properties of nanocrystalline LN:Pr and LT:Pr obtained by mechanosynthesis. Moreover, it provides an opportunity to study the influence of the pressing conditions on ceramic samples and their luminescent properties. For comparison purposes, the pressing was performed in two modes:
  • with simultaneous heating and application of an electric field;
  • without heating and without applying an electric field.
The first mode needs for the determination of optimal ratios between the pressure, temperature and the applied voltage to the sample. This is due to the danger of electrical breakdown with increased pressure and temperature. A current limit was set for the high-voltage converter, which should not exceed 3 mA at a voltage of 1 kV. The voltage of 1 kV was applied to the samples in all the experiments. Therefore, it was investigated how the electric current changes during heating at different pressures.
Since the amount of the obtained LN:Pr, LN:Mg,Pr, LT:Pr nanopowders was limited, the pressing experiments were firstly performed on LN micropowder of stoichiometric composition as synthesized by the solid-phase reaction. This approach assumes that the general patterns of electric current dependence on pressure and temperature should be similar in the case of pressing nanopowder and micropowder.
The sample pressing with simultaneous heating and application of the electric field was carried out in the following sequence:
  • powder loading in the amount of 0.4 g;
  • voltage application of 1 kV;
  • pressure application;
  • start of the heating.
The heater was switched off after the current reached a value of 3 mA at a certain temperature. The sample was kept under the pressure and electric field for 15 min after reaching the specified temperature. After that, the heating of the furnace was turned off and cooled to room temperature along with the entire system. At room temperature, the high voltage was turned off, and the pressure was stopped.
The temperature dependencies of the current for different fixed pressures during the pressing of nanopowders are shown in Figure 4.
As can be seen from this figure, the current maxima are observed in the temperature range of 30–100 °C, regardless of the applied pressure. Such peaks were present in all of the pressing experiments of LN:Pr, LN:Mg,Pr, LT:Pr nanopowders with simultaneous heating and application of an electric field. Similar peaks were also observed during pressing of LN micropowders, which was initially performed for system testing purposes. It should be noted, however, that we did not conduct repeated experiments to study the temperature dependence of the current in already pressed samples. We also did not study the temperature dependence of the current in nanopowders without applying pressure.
Observed peaks in the range of 30–100 °C are attributed to the loss of the moisture adsorbed by the powders during storage. This assumption can be supported by the fact that the temperature position of the current peaks does not change with the applied pressure. Further, the electrical conductivity of nanopowders is activated at much lower temperatures with increasing pressure. Therefore, the energy position of the levels, if they were inherent in the compound itself and could participate in conductivity of lithium niobate or lithium tantalate, should also change under the influence of pressure, which is not observed. Moreover, the study of the temperature dependence of the electrical conductivity in single crystalline lithium niobate and lithium tantalate, performed in [29], did not reveal any extreme peculiarities in the temperature range of 290–450 K.
Further increase of the temperature leads to an exponential increase in the current, and the temperature, at which the current begins to increase, depends significantly on the applied pressure (see Figure 4). Based on the obtained results and the information given in Table 2, the following pressing conditions were chosen for LN:Pr, LN:Mg,Pr, LT:Pr nanopowders:
  • powder mass—0.4 g;
  • pressure—190 MPa;
  • voltage—1 kV;
  • temperature—200 °C.
An increase in the pressure above 190 MPa with simultaneous heating can cause an electrical breakdown of the pressed sample. Therefore, the proposed choice can be considered optimal for the configuration used in our study.
As an example, the temperature dependence of the current in the LN:Pr sample is presented in Figure 5.
For pressing without the application of temperature and an electrical field, the mass of powders was 0.4 g, the pressure was 190 MPa and the pressing time was 15 min. In both modes, the thickness of the pressed sample was about 1.5 mm. Note that no binder materials were used during such pressing.
Manufacturing of ceramic tablets involves their post-pressing and high-temperature annealing, and in our case, it was performed at 600 °C for 6 h in the air. The chosen temperature was not enough to obtain very dense ceramics. However, this mode was selected for the following reasons. The main task of the work was to investigate the luminescence of LN:Pr, LN:Mg, Pr and LT:Pr nanopowders. In addition, another task was to investigate whether the luminescent properties of the studied samples are influenced by the electrical ordering of ferroelectric nanoparticles.
Therefore, the samples must be manufactured under the closest possible conditions for correct comparison of properties. It should also be noted that the transition from the ferroelectric phase to the paraelectric one in LN occurs in the temperature range of 1100–1200 °C while in LT—at temperatures above 600 °C. Consequently, the samples were annealed at 600 °C with an aim not to destroy the possible ordered state achieved by pressing with an electric field. Therefore, three tablets with the compositions of Li0.98Pr0.02NbO3, Li0.93Pr0.02Mg0.05NbO3 and Li0.98Pr0.02TaO3 were fabricated from structurally single-phase nanopowders with simultaneous heating and application of an electric field. Another three discs with the same compositions were prepared with no voltage or temperature applied. As an example, the picture of the LiNbO3:Pr sample prepared for luminescence studies is shown as an example in Figure 6.

3.3. Photoluminescence and Photoluminescence Excitation Spectra

The photoluminescence and its excitation were studied in the red spectral region, similarly to the previously published investigations (e.g., [4,5]).
The excitation spectra monitored at 623 nm and the spectrum of luminescence excited at 270 nm of LN:Pr ceramic samples are presented in Figure 7. The spectra of samples obtained in two modes (during heating with the application of an electric field and without the influence of these factors) are given for comparison.
In contrast to LN:Pr, the “red” luminescence in LT:Pr samples has a lower intensity, and its excitation bands at 240 nm and 290 nm are shifted toward shorter wavelengths (Figure 8).
Note that the red luminescence in all the studied samples could be excited not only in the ultraviolet range, but also in the bands of intracenter absorption of Pr3+ ions as well, but with lower efficiency. These bands in the region of 430–510 nm appear to be more pronounced in LT:Pr samples compared to LN:Pr (Figure 8). The luminescence and its excitation of LT:Pr is more intense in samples pressed with simultaneous temperature and electric field influence, as we observed in other samples.

3.4. Electrical Conductivity

The studies of electrical conductivity as a function of temperature were performed on an LN:Pr ceramic sample, obtained by pressing the corresponding nanopowder with the electric field applied. The impedance spectra of LN:Pr are shown for 500 and 600 °C in form of Nyquist diagram in Figure 9. At 500 °C, the impedance data shows a slightly depressed single arc semicircle. Such a depression could be attributed to the non-ideal capacitance of the samples, which corresponds to low values of the CPE exponent, obtained from fitting of Rb-CPE equivalent circuit model to experimental data. This exponent value at 500 °C equals 0.81 and slightly decreases with the temperature increase. Impedance spectra at 600 °C reveal the existence of linear region of Z’’(Z’) dependence, which follows the semicircle intercept at lower frequencies. At this temperature, the impedance of the samples has been additionally measured down to 0.01 Hz in order to examine the low frequency region of the ρ’’(ρ’) dependence in more detail. However, no changes in the line slope were observed. According to [30], such peculiarity at low frequencies can be attributed to the electrode effect, which is typical for an ionic conductor—mobile charge carriers in form of ions are blocking the metal-sample interface.
On the other hand, a similar behavior of Z’’(Z´) dependence at low frequencies observed in [31] for polycrystalline lithium niobate samples at temperatures above 550 °C was associated with the grain boundaries’ conduction mechanism.
The electrical conductivity of LN:Pr specimen is shown in Figure 10 in the form of Arrhenius plots and will be discussed in the subsequent section. The LN:Pr specimen was initially pressed at a temperature of 200 °C

4. Discussion

4.1. Photoluminescence

The dominant red emission in LN:Pr specimen is caused by the transition 1D23H4 between the levels of the Pr3+ ion [1,9,10,11,12]. As shown in Figure 7, the red luminescence excitation spectra are dominated by two broad bands with maxima near 258 and 345 nm. In [4], the shape of the excitation spectra of red luminescence in LiNbO3:Pr3+ micropowders was studied depending on the degree of deviation of their composition from stoichiometry, and it was shown that the band with a maximum near 250 nm had the highest intensity in stoichiometric samples. Therefore, it can be assumed that the samples studied in present work have stoichiometric or very close to stoichiometric composition. Further, the photoluminescence studies of nominally undoped and magnesium-doped lithium niobate crystals [32,33,34,35] as well as the studies of photoluminescence in LN:Pr3+ micropowders of various compositions [4] allow us to assume that the luminescence excitation band with a maximum near 258 nm is associated with the formation of electron-hole pairs near regular niobium octahedra. The band near 345 nm is attributed to the formation of such pairs near the formed octahedra, in which lithium is replaced by niobium and, in our case, possibly also by praseodymium. The red luminescence itself results from the relaxation of Pr3+ ions excited by the recombination of electron-hole pairs. The obtained results of the luminescence spectra also agree with the other literature data obtained for LN:Pr micropowders [4].
It is also worth paying attention to how the relative intensity of photoluminescence and its excitation spectra changes depending on the pressing method of ceramic samples: the luminescence of LN:Pr ceramic samples pressed during heating in the presence of an electric field shows about 30% higher intensity compared to samples that were pressed without the influence of additional factors. This could be attributed to the higher ordering of ferroelectric nanoparticles pressed in an electric field.
The luminescence and excitation spectra for LiNbO3:Mg,Pr ceramic samples (pressed both in an electric field during heating and without it) are similar to those observed in LN:Pr samples. However, the luminescence intensity of LiNbO3:Mg,Pr was almost 10 times lower than that of LN:Pr. At the same time, the obtained results are not consistent with the literature data for LN:Mg,Pr single crystals [3,36,37]. According to [3,36], the appearance of magnesium in LiNbO3:Pr crystals of congruent composition is one of the reasons for increasing the intensity and duration of luminescence in the red region of the spectrum. However, the opposite result was observed for our samples. We note that the nanocrystalline powders obtained in the present study have a chemical composition close to stoichiometric one, and it could potentially explain the observed inconsistencies. In addition, one of the reasons for the difference between the results in this work and the previously published data [3,36,37] may be the difference in the technology employed for obtaining LN:Mg,Pr samples. Currently, we are unaware of any comparative studies of the luminescent properties performed on LN:Pr and LN:Mg,Pr single crystals, micropowders and nanopowders.
The results of the photoluminescence studies of LT:Pr nanocrystalline samples are consistent with the literature data for LiTaO3:Pr micropowders [5]. The position of maxima and relative intensity are summarized in Table 3; Table 4 to compare the similarities and differences between the photoluminescence spectra of Pr and its excitation in LN, LN:Mg and LT nanopowders pressed under different conditions.
As it can be seen from the Table 3, the highest level of luminescence and its excitation are observed for LN:Pr nanopowders pressed during heating in an electric field.
The maxima of Pr photoluminescence in LN and LN:Mg nanopowders are observed close to λ = 622 nm in all the studied samples of this type. For LT nanopowders, this maximum is located at λ = 620 nm. The UV excitation spectra of Pr3+ ions in LN and LN:Mg powders are also similar while these maxima are noticeably shifted towards higher energies in LT specimens.

4.2. Conductivity

The obtained values of electrical conductivity (Figure 10) are generally consistent with the values obtained previously for single crystalline lithium niobate and lithium tantalate [25,33,34]. The conductivity of LN:Pr specimen increases linearly in the Arrhenius presentation (see Figure 10), indicating that it is governed by a single thermally activated process. An analysis of the literature suggests that the ionic conduction mechanism with lithium vacancies as a main charge carrier determines the conductivity at elevated temperatures [25,29,33,34,35,36,37,38]. The lithium vacancy model suggests that compensation of N b L i 4 defects occurs due to lithium vacancies. The niobium ions in the position of lithium are considered to be those point defects that participate in the processes of the capture of charge carriers and changes in the optical and electrophysical properties of LN [38]. Consequently, the activation energy, EA, could be determined using the relation:
σ = σ 0 T e E A k T
where σ0, T, EA and k represent the pre-exponential constant, absolute temperature, activation energy and the Boltzmann constant, respectively.
The activation energy obtained for LN:Pr is equal to (1.00 ± 0.05) eV. In general, this value is in a good agreement with the values, obtained previously for polycrystalline lithium niobate and/or lithium tantalate as well as for LiNb1−xTaxO3 nanopowders [14,15,39,40,41,42], ranging from 0.88 eV to 1.09 eV. Such a wide range of activation energies may be related to their strong dependence on the grain size of the samples or as well as preparation method.

5. Conclusions

Single-phase nanopowders with nominal compositions of Li0.98Pr0.02NbO3, Li0.93Mg0.05Pr0.02NbO3 and Li0.98Pr0.02TaO3 with particle sizes of 20–80 nm were obtained for the first time by high-energy milling with subsequent annealing. The absence of parasitic phases in the obtained compounds was confirmed by the XRD analysis. The pressing equipment was developed to obtain ceramic samples suitable for luminescence studies. The pressing procedure was performed in two modes: during heating with the application of an electric field and without additional factors. The studies of the photoluminescence of praseodymium ions and their excitation were carried out. It should be noted that the method of sample preparation significantly affected the sample properties. The samples pressed with the temperature and electric field show higher relative photoluminescence intensity, which could possibly be attributed to the higher ordering of ferroelectric nanoparticles in an electric field during pressing. The excitation of praseodymium ions most effectively occurs due to the recombination of electron-hole pairs formed during light absorption in the UV range. The luminescence spectra and their excitation coincide in shape and spectral position with the data for LN:Pr and LT:Pr single crystals and micropowders. At the same time, there are discrepancies in the observed luminescence intensity of nanopowders with available data for single crystals and micropowders. Such differences may be attributed to varying degrees of the chemical composition deviation from stoichiometry as well as the peculiarities of synthesis technologies. Finally, the electrical conductivity of LN:Pr sample was determined up to 670 °C in air. The dominating transport mechanism was attributed to the lithium ions migration via lithium vacancies as found in single crystalline LN.
The obtained nanopowders are of significant interest primarily as persistence luminescent materials as well as materials capable of exhibiting mechanoluminescence. This opens up prospects for their use in sensing applications (e.g., pressure, temperature, etc.). Furthermore, the relative simplicity of the nanopowders synthesis technology offers possibilities for significant cost reduction compared, for example, to obtaining a range of crystals of different compositions using the Czochralski technique. Additionally, the obtained nanocrystalline single-phase materials can serve as a raw material for obtaining corresponding thin film materials or even single crystals.

Author Contributions

Conceptualization, D.S.; methodology, V.S., S.H. and I.I.S.; formal analysis, S.H., V.H. and A.L. (Andriy Luchechko); investigation, A.L. (Andriy Luchechko), A.L. (Andrey Lakhnik), V.H. and U.Y.; resources, V.S.; writing—original draft preparation, D.S. and U.Y.; writing—review and editing, L.V., V.S., I.I.S., S.U. and Y.S.; visualization, S.H. and U.Y.; supervision, Y.S. All authors have read and agreed to the published version of the manuscript.

Funding

Research grants from the Bundesministerium für Bildung und Forschung (BMBF, Federal Ministry of Education and research, FKZ: 01DK20009) and Ministry of Education and Science of Ukraine (M/48-2020) in frames of the joint German–Ukrainian project ‘Nanocrystalline piezoelectric compounds LiNb1−xTaxO3 for high-temperature applications’ supported this work. Further, the work was partially supported by the Polish National Science Center (grant No. 2019/33/B/ST8/02142) and by the Ukrainian Ministry of Education and Science (project DB/MODUS no. 0121U107736). L. Vasylechko, A. Luchechko, V. Hreb and S. Ubizskii acknowledge the support of the National Research Foundation of Ukraine under grant no. 2020.02/0373 “Crystalline phosphors’ engineering for biomedical applications, energy saving lighting and contactless thermometry.

Institutional Review Board Statement

Not applicable.

Informed Consent Statement

Not applicable.

Data Availability Statement

The data presented in this study are available on request from the corresponding author.

Acknowledgments

The authors from Clausthal University of Technology acknowledge the support of the Energie-Forschungszentrum Niedersachsen, Goslar, Germany.

Conflicts of Interest

The authors declare no conflict of interest.

References

  1. Lorenze, A.; Bausa, L.E.; Garcia Sole, J. Optical spectroscopy of Pr3+ ions in LiNbO3. Phys. Rev. B 1995, 51, 16643–16650. [Google Scholar] [CrossRef] [PubMed]
  2. Ryba-Romanowski, W.; Sokólska, I.; Gołab, S.; Łukasiewicz, T. Photoluminescence of LiTaO3:Pr. Appl. Phys. Lett. 1997, 70, 686–687. [Google Scholar] [CrossRef]
  3. Lin, S.; Xiong, C.; Ma, D.; Li, H.; Long, S.; Wang, B. Persistent luminescence found in Mg2+ and Pr3+ co-doped LiNbO3 single crystal. J. Mater. Chem. C 2018, 6, 10067–10072. [Google Scholar] [CrossRef]
  4. Tu, D.; Xu, C.-N.; Yoshida, A.; Fujihala, M.; Hirotsu, J.; Zheng, X.-G. LiNbO3:Pr3+: A multipiezo material with simultaneous piezoelectricity and sensitive piezoluminescence. Adv. Mater. 2017, 29, 1606914. [Google Scholar] [CrossRef]
  5. Qiu, G.; Ye, H.; Wang, X.; Fang, H.; Li, Y.; Yao, X. Intense piezoluminescence in LiTaO3 phosphors doped with Pr3+ ions. Ceram. Int. 2019, 45, 8553–8560. [Google Scholar] [CrossRef]
  6. Liang, A.; Hu, R.; Li, G.; Jiang, X.; Zheng, L.; Zeng, J.; Wang, X. Intense mechanoluminescence, thermoluminescence and photoluminescence in Pr3+ doped K0.02Na0.98NbO3 ferroelectric phosphor. J. Lumin. 2022, 247, 118866. [Google Scholar] [CrossRef]
  7. Gaeeni, M.R.; Bakouei, A.; Ghamsari, M.S. Highly Stable Colloidal Lithium Niobate Nanocrystals with Strong Violet and Blue Emission. Inorg. Chem. 2002, 61, 12886–12894. [Google Scholar] [CrossRef]
  8. Tong, X.; Zhou, X.; Tang, X.; Min, Y.; Li, X.; Wang, W.; Qian, Y. Upconversion luminescence and optical temperature-sensing properties of LiNbO3:Yb3+/Er3+ nanoparticles. Cryst. Eng. Commun. 2022, 24, 1407–1412. [Google Scholar] [CrossRef]
  9. Jamalaiah, B.C.; Madhu, N.; Reddy, A.S.N.; Gawas, P.; Nutalapati, V. Structural and optical analysis of YAl3(BO3)4: Pr3+ phosphors for lighting applications. Optik 2022, 68, 169744. [Google Scholar] [CrossRef]
  10. Denisenko, Y.G.; Atuchin, V.V.; Molokeev, M.S.; Sedykh, A.E.; Khritokhin, N.A.; Aleksandrovsky, A.S.; Oreshonkov, A.S.; Shestakov, N.P.; Adichtchev, S.V.; Pugachev, A.M.; et al. Exploration of the Crystal Structure and Thermal and Spectroscopic Properties of Monoclinic Praseodymium Sulfate Pr2(SO4)3. Molecules 2022, 27, 3966. [Google Scholar] [CrossRef]
  11. Zhang, Q.; Luo, L.; Gong, J.; Du, P.; Li, W.; Yu, G. Photoluminescence, thermoluminescence and reversible photoluminescence modulation of multifunctional optical materials Pr3+ doped KxNa1-xNbO3 ferroelectric ceramics. J. Eur. Ceram. Soc. 2020, 40, 3946–3955. [Google Scholar] [CrossRef]
  12. Soler-Carracedo, K.; Zheng, T.; Runowski, M.; Luo, L.; Martín, I.R. Pr3+-doped perovskite niobate ceramics towards improving performance of optical temperature sensor by second harmonic generation (SHG) combined with lanthanide luminescence. Ceram. Int. 2023, 49, 14177–14182. [Google Scholar] [CrossRef]
  13. Khalameida, S.; Sydorchuk, V.; Leboda, R.; Skubiszewska-Zięba, J.; Zazhigalov, V. Preparation of nano-dispersed lithium niobate by mechanochemical route. J. Therm. Anal. Calorim. 2014, 115, 579–586. [Google Scholar] [CrossRef]
  14. Buryy, O.; Vasylechko, L.; Sydorchuk, V.; Lakhnik, A.; Suhak, Y.; Wlodarczyk, D.; Hurskyj, S.; Yakhnevych, U.; Zhydachevskyy, Y.; Sugak, D.; et al. Crystal structure, Raman spectra and electrical conductivity of LiNb1 − xTaxO3 nanopowders obtained with high-energy ball milling. J. Nano- Electron. Phys. 2021, 13, 02038. [Google Scholar] [CrossRef]
  15. Vasylechko, L.; Sydorchuk, V.; Lakhnik, A.; Suhak, Y.; Wlodarczyk, D.; Hurskyy, S.; Yakhnevych, U.; Zhydachevskyy, Y.; Sugak, D.; Syvorotka, I.; et al. Investigations of LiNb1-xTaxO3 nanopowders obtained with mechanochemical method. Crystals 2021, 11, 755. [Google Scholar] [CrossRef]
  16. El Bachiri, A.; Bennani, F.; Bousselamti, M. Dielectric and electrical properties of LiNbO3 ceramics. J. Asian Ceram. Soc. 2016, 4, 46–54. [Google Scholar] [CrossRef] [Green Version]
  17. Zhang, X.; Qi, X.; Wang, Y.; Zhong, R. Preparation and Electrical Properties of (1-x)LiNbO3-xBiYbO3 Ceramics. In Proceedings of the 2015 International Conference on Material Science and Applications (icmsa-15), Suzhou, China, 13–14 June 2015. [Google Scholar]
  18. Puyôo-Castaings, N.; Françoise, D.; Jean, R. Elaboration of LiNbO3 ceramics from sol–gel process powders. J. Mater. Res. 2011, 3, 557–560. [Google Scholar] [CrossRef]
  19. Fujii, I.; Hirai, K.; Imai, T.; Wada, T. Fabrication of [Li0.05(K0.5Na0.5)0.95]NbO3 transparent ceramics using conventional sintering technique. J. Ceram. Soc. Jpn. 2019, 127, 905–911. [Google Scholar] [CrossRef]
  20. Jaya Prakash, B.; Buddhudu, S. Synthesis and analysis of LiNbO3 ceramic powders by co-precipitation method. Indian J. Pure Appl. Phys. 2012, 50, 320–324. [Google Scholar]
  21. Sumang, R.; Sutamma, F.; Chootin, S.; Bongkarn, T. Influence of Firing Temperatures on Crystal Structure and Microstructure of LiNbO3 Ceramics. Integr. Ferroelectr. 2013, 149, 1–8. [Google Scholar] [CrossRef]
  22. Tumuluri, A.; Raju, J. Luminescence of LiNbO3 polycrystalline ceramics: Effect of Sc2O3 and Lu2O3 doping. Ceram. Int. 2014, 40, 3371–3377. [Google Scholar] [CrossRef]
  23. Niewiadomski, A.; Kajewski, D.; Kania, A.; Balin, K.; Miga, S.; Pawlik, M.; Koperski, J. Microstructure and characterization of Ag1−xLixNbO3 ceramics. Ceram. Int. 2016, 42, 4445–4451. [Google Scholar] [CrossRef]
  24. Smiga, W.; Garbarz-Glos, B. Studies of the influence of uniaxial pressure on the electric behaviour of Li0.015Na0.985NbO3 ceramics. Ukr. J. Phys. Opt. 2012, 13, 27–33. [Google Scholar] [CrossRef] [Green Version]
  25. Fadil, F.Z.; Aillerie, M.; Lamcharfi, T.; Abdi, F. Synthesis and characterization of holmium doped lithium niobate powders. Ceram. Int. 2011, 37, 2281–2285. [Google Scholar] [CrossRef]
  26. Barik, R.; Satpathy, S.K.; Behera, B.; Biswal, S.K.; Mohapatra, R.K. Synthesis and Spectral Characterizations of Nano-Sized Lithium Niobate (LiNbO3) Ceramic. Micro Nanosyst. 2020, 12, 81–86. [Google Scholar] [CrossRef]
  27. Bah, M.; Giovannelli, F.; Schoenstein, F.; Brosseau, C.; Deschamps, J.-R.; Dorvaux, F.; Haumesser, L.; Le Clezio, E.; Monot-Laffez, I. Ultrasonic transducers based on undoped lead-free (K0.5Na0.5)NbO3 ceramics. Ultrasonics 2015, 63, 23–30. [Google Scholar] [CrossRef]
  28. Aleshina, L.A.; Palatnikov, M.N.; Shcherbanich, Y.I.; Feklistova, E.P.; Shcherbina, O.B. Influence of ultrafast quenching on the structure of Li0.12Na0.88TayNb1−yO3 ceramics obtained by solid-phase synthesis. Tech. Phys. 2017, 3, 401–407. (In Russian) [Google Scholar] [CrossRef] [Green Version]
  29. Yatsenko, A.V.; Palatnikov, M.N.; Sidorov, N.V.; Pritulenko, A.S.; Evdokimov, S.V. Specific features of electrical conductivity of LiTaO3 and LiNbO3 crystals in the temperature range 290–450 K. Phys. Solid State 2015, 57, 1547–1550. [Google Scholar] [CrossRef]
  30. Chen, R.H.; Chen, L.-F.; Chia, C.-T. Impedance spectroscopic studies on congruent LiNbO3 single crystal. J. Phys. Condens. Matter 2007, 19, 086225. [Google Scholar] [CrossRef]
  31. Lanfredi, S.M.; Rodrigues, A.C. Impedance spectroscopy study of the electrical conductivity and dielectric constant of polycrystalline lithium niobate. J. Appl. Phys. 1999, 86, 2215–2219. [Google Scholar] [CrossRef]
  32. Krol, D.M.; Blasse, G.; Powell, R.C. The influence of the Li/Nb ratio on the luminescence properties of LiNbO3. J. Chem. Phys. 1980, 73, 163–166. [Google Scholar] [CrossRef]
  33. Emond, M.H.J.; Wiegel, M.; Blasse, G.; Feigelson, R. Luminescence of stoichiometric lithium niobate crystals. Mater. Res. Bull. 1993, 28, 1025–1028. [Google Scholar] [CrossRef]
  34. Klose, F.; Wöhlecke, M.; Kapphan, S. UV-excited luminescence of LiNbO3 and LiNbO3:Mg. Ferroelectrics 1989, 92, 181–187. [Google Scholar] [CrossRef]
  35. Sugak, D.; Luchechko, A. Luminescent properties of as-grown and vacuum annealed LiNbO3 single crystals. Solid State Phenom. 2013, 200, 199–202. [Google Scholar] [CrossRef]
  36. Long, S.W.; Yang, M.M.; Ma, D.C.; Zhu, Y.Z.; Lin, S.P.; Wang, B. Enhanced red emissions and higher quenching temperature based on the intervalence charge transfer in Pr3+ doped LiNbO3 with Mg2+ incorporation. Opt. Mater. Express 2019, 9, 1062–1071. [Google Scholar] [CrossRef]
  37. Yang, C.; Tu, X.; Wang, S.; Xiong, K.; Chen, Y.; Zheng, Y.; Shi, E. Growth and properties of Pr3+ doped LiNbO3 crystal with Mg2+ incorporation: A potential material for quasi-parametric chirped pulse amplification. Opt. Mater. 2020, 105, 109893. [Google Scholar] [CrossRef]
  38. Shirmer, O.F.; Trumann, O.; Woehlecke, M. Defects in LiNbO3—Experimental aspects. J. Phys. Chem. Solids 1991, 5, 185–200. [Google Scholar] [CrossRef]
  39. Huanosta, A.; West, A.R. The electrical properties of ferroelectric LiTaO3 and its solid solutions. J. Appl. Phys. 1987, 61, 5386–5391. [Google Scholar] [CrossRef]
  40. Suhak, Y.; Roshchupkin, D.; Redkin, B.; Kabir, A.; Jerliu, B.; Ganschow, S.; Fritze, H. Correlation of Electrical Properties and Acoustic Loss in Single Crystalline Lithium Niobate-Tantalate Solid Solutions at Elevated Temperatures. Crystals 2021, 11, 398. [Google Scholar] [CrossRef]
  41. Efremov, V.V.; Shcherbina, O.B.; Palatnikov, M.N.; Masloboeva, S.M. Comparative investigation of electrophysical characteristics of ceramic and single crystal LiNbO3. J. Phys. Conf. Ser. 2020, 1658, 012010. [Google Scholar] [CrossRef]
  42. Masoud, M.; Heitjans, P. Impedance Spectroscopy Study of Li Ion Dynamics in Single Crystal, Microcrystalline, Nanocrystalline and Amorphous LiNbO3. Defect Diffus. Forum 2005, 237–240, 1016–1021. [Google Scholar] [CrossRef]
Figure 1. XRD patterns of lithium niobate (a) and the precursor obtained after milling a mixture of powders of lithium carbonate, niobium pentoxide and praseodymium oxide (b).
Powders 02 00035 g001
Figure 2. XRD pattern of LN:Pr, LN:Pr, Mg and LT:Pr nanopowders obtained by the mechanosynthesis and annealing.
Powders 02 00035 g002
Figure 3. Scheme of equipment for pressing nanopowders in an external electric field with the possibility of simultaneous heating (1—sample; 2—furnace (heater); 3—basalt construction; 4—punch; 5—press piston; 6—hub; 7—ceramic gasket; 8—thermocouple; 9—base of the press (platform)).
Powders 02 00035 g003
Figure 4. The temperature dependence of current in the LN sample at different pressures and 1kV electric field (for the sake of clarity, only every third data point is shown).
Powders 02 00035 g004
Figure 5. The temperature dependence of current with applied pressure of 190 MPa for LN:Pr.
Powders 02 00035 g005
Figure 6. Ceramic sample LiNbO3:Pr.
Powders 02 00035 g006
Figure 7. The photoluminescence and photoluminescence excitation spectra of LiNbO3:Pr.
Powders 02 00035 g007
Figure 8. The photoluminescence and excitation spectra of LiTaO3:Pr.
Powders 02 00035 g008
Figure 9. Impedance spectra of LN:Pr pressed specimen at 500 °C and 600 °C.
Powders 02 00035 g009
Figure 10. Electrical conductivity of LN:Pr specimen as a function of temperature.
Powders 02 00035 g010
Table 1. Masses of reagents Li2CO3, Nb2O5, Ta2O5, Pr6O11 and MgO, calculated to obtain compounds Li0.98Pr0.02NbO3; Li0.93Pr0.02Mg0.05NbO3; Li0.98Pr0.02TaO3.
CompositionLabel Mass, g
Li2CO3Nb2O5Ta2O5Pr6O11MgO
Li0.98Pr0.02NbO3LN:Pr2.4058.8290.226
Li0.93Pr0.02Mg0.05NbO3LN:Pr,Mg2.278.7790.2250.133
Li0.98Pr0.02TaO3LT:Pr1.5189.2610.143
Table 2. Conditions for obtaining ceramic samples according to the literature data.
CompositionThe Preparation Method of the PowderBinderPressurePressure Converted into Mass for a Press Mold Ø = 10 mmSizeHeat Treatment ConditionsRef.
Li1−xNb1+x/5O3 (x = 0, 0.025, 0.045, 0.075),mechanosynthesis2500 barmp = 2 tØ = 13 mm,
h = 1 mm
1000 °C 4 h;
rate 100 °C/h
[16]
(1−x)LiNbO3-xBiYbO3
(x = 0, 0.01, 0.02, 0.03, 0.04, 0.05, 0.06) density 97%+
Solid phase synthesis5 wt% PVA4 MPamp = 32 kgØ = 10 mm,
h = 2 mm
evaporation of PVA: 500 °C 2 h, annealing—1000 °C 2 h in air[17]
LiNbO3sol-gel2 t/cm2mp = 1572 kgØ = 8 mm,
h = 2 mm
1000 °C/1075 °C/1100 °C 1 h;
rate 3000 °C/h
[18]
[Li0.05(K0.5Na0.5)0.95]NbO3Solid phase synthesis1 wt% PVA40–200 MPamp = 560–1600 kgØ = 10 mmevaporation of PVA: 700 °C 2h,
annealing: 1150 °C 15 h in flowing oxygen; rate—150 °C.
- coated with [Li0.05(K0.5Na0.5)0.95]NbO3 powder in a closed Al2O3 crucible before treatment.
[19]
LiNbO3 ceramic powderCoprecipitated[20]
LiNbO3Solid phase synthesis2 wt% PVA80 MPamp = 641 kgØ = 15 mm900–1025 °C 2 h[21]
LiNbO3: Sc2O3, Lu2O3mechanosynthesisPVAØ = 12 mmevaporation of PVA: 500 °C,
annealing: 1125 °C 2 h; 600 °C/h
[22]
Ag1−xLixNbO3, x = 0.01, 0.02, 0.03, 0.04, 0.05, 0.06, 0.08, 0.1Solid phase synthesis AgNbO3—850 °C 3 h, LiNbO3–650 °C 3 h, (→grinding, mixing → 1040 °C, h)—twice → 1100 °C (x = 0) ÷ 1050 °C (x = 0.1) 3 h[23]
Li0.015Na0.985NbO3Solid phase synthesis15 MPamp = 120 kg1160 °C 4 h[24]
LiNbO3:Ho powderCeramic powder processing methodPVA
Mixing, drying at 60 °C, 24 h→10 min grinding
10 t/cm2mp = 7.9 tannealing of acetate: 600 °C 1 h, annealing: 1000 °C 6 h; 300 °C/h[25]
LiNbO3 nanoceramicsSolid phase synthesisPVA3 MPamp = 24 kt1050 °C 4 h in air[26]
K0.5Na0.5NbO3Solid phase synthesisPVA150 MPamp = 1.2 tØ = 13 mm,
h = 1.5 mm
1120 °C 10 h[27]
Li0.12Na0.88TayNb1−yO3Solid phase synthesisPVA700–1500 kg/cm2mp = 550–1180 kgevaporation of PVA: 350–400 °C 1 h, annealing: 1250–1380 °C; 200–300 °C/h[28]
(KxNa1−x)0.997Pr0.003NbO3
x = 0, 0.1, 0.2, 0.3, 0.4, 0.5
Solid phase synthesis5 wt% PVAØ =10 mm–grinding of initial carbonates and oxides; –annealing → 850 °C, 5 h;
– repeated grinding → pressing →annealing → 1175–1195 °C, 4 h.
[11,12]
Table 3. The maxima position and relative intensity of the Pr luminescence excitation spectra at a wavelength of λ = 623 nm in LN:Pr, LN:Mg,Pr and LT:Pr nanopowders.
Composition and Pressing ConditionsWavelength, nmIntensity Maxima, a.u.
LiNbO3:Pr
with/without electric field
257/2598.472/6.055
342/3471.78/1.556
LiNbO3:Pr, Mg
with/without electric field
259/2641.131/0.491
347/3550.209/0.093
LiTaO3:Pr
with/without electric field
242/2404.713/3.913
290/2911.543/1.158
Table 4. The position of the photoluminescence maxima of praseodymium and its relative intensity in LN:Pr, LN:Mg,Pr and LT:Pr nanopowders.
Composition and Pressing Conditionsλex = 250 nmλex = 270 nmλex = 290 nmλex = 350 nm
LN:Pr
with electric field
λmax = 622 nm
Imax = 1.197
λmax = 622 nm
Imax = 0.304
LN:Pr
without electric field
λmax = 622 hm
Imax = 0.873
λmax = 622 nm
Imax = 0.282
LN:Pr, Mg
with electric field
λmax = 622 nm
Imax = 0.138
λmax = 622 nm
Imax = 0.033
LN:Pr, Mg
without electric field
λmax = 622 nm
Imax = 0.056
λmax = 622 nm
Imax = 0.013
LT:Pr
with electric field
λmax = 620 nm
Imax = 0.687
λmax = 620 nm
Imax = 0.237
LT:Pr
without electric field
λmax = 620 nm
Imax = 0.521
λmax = 620 nm
Imax = 0.19
Disclaimer/Publisher’s Note: The statements, opinions and data contained in all publications are solely those of the individual author(s) and contributor(s) and not of MDPI and/or the editor(s). MDPI and/or the editor(s) disclaim responsibility for any injury to people or property resulting from any ideas, methods, instructions or products referred to in the content.

