Article

Mechanochemical Synthesis and DC Electrical Conductivity of PANI-Based MWCNT Containing Nanocomposites with Te0 and Bi2Te3 Thermoelectric Nanophase

by
Anna V. Zhmurova
*,
Galina F. Prozorova
and
Marina V. Zvereva
A.E. Favorsky Irkutsk Institute of Chemistry, Siberian Branch of Russian Academy of Sciences, Favorsky 1, 664033 Irkutsk, Russia
*
Author to whom correspondence should be addressed.
Powders 2023, 2(3), 540-561; https://doi.org/10.3390/powders2030034
Submission received: 19 March 2023 / Revised: 19 May 2023 / Accepted: 9 June 2023 / Published: 14 July 2023
(This article belongs to the Special Issue Particle Technologies)

Abstract

:
Nowadays, the search for the coupled polymer nanocomposite thermoelectrics that exhibit a high value of thermoelectric figure of merit (ZT) and similar behaviour of physical properties for the use as legs of thermoelectric cells is a current challenge. The direct current (DC) conductivity is one of the three important components of thermoelectric figure of merit. The aim of this study was to obtain PANI-based nanothermoelectrics with Te0 and Bi2Te3 nanoparticles and MWCNT by mechanochemical methodology and to investigate the dependency of their DC electrical conductivity on temperature in the 298–353 K range using the Arrhenius and Mott’s variable range hopping (VRH) models. Inorganic Te0 and Bi2Te3 nanoparticles were pre-synthesized by the available and environmentally friendly method using a commercial tellurium powder. The samples obtained were characterized by X-ray diffractometry (XRD), IR and UV-Vis spectroscopy. The XRD study of ES-PANI/Te0 (4.4 wt% Te0) and ES-PANI/Bi2Te3 (2.9 wt% Bi2Te3) nanocomposites found that the nanoparticle average size was 32 nm and 17 nm, respectively. The DC conductivity study of the samples with different nanophase content (2.1, 4.4, 10.2 wt% Te0, 1.5, 2.9, 7.3 wt% Bi2Te3, 1.5 wt% MWCNT) by the two points measurement method reveals the following: (a) the presence of inorganic nanophase reduces the conductivity compared to the matrix, (b) the addition of MWCNT in ES-PANI increases its electrical conductivity, (c) the conductivity of ES-PANI/Te0 as well as ES-PANI/Bi2Te3 nanocomposite rises with the increasing inorganic nanophase content, (d) the observed increase in the electrical conductivity of MWCNT-based nanocomposites with increasing inorganic nanophase content is interrupted by a characteristic area of decrease in its value at average values of inorganic nanoparticles content (at Te0 content of 4.4 wt%, at Bi2Te3 content of 2.9 wt%), (e) a similar DC conductivity behaviour in ES-PANI/Te0—ES-PANI/Bi2Te3 and ES-PANI/Te0-MWCNT—ES-PANI/Bi2Te3-MWCNT nanocomposite pairs is observed.

1. Introduction

Nowadays, one of the promising directions in the search for new highly efficient (high ZT) thermoelectrics applicable in thermoelectric cells is the synthesis of coupled organic-inorganic systems in the form of polymeric nanocomposites with p- and n-type electric conductivity. Their undisputed advantages are high electrical conductivity combined with low thermal conductivity, mechanical flexibility as well as their high environmental friendliness and accessibility due to the variety of synthesis methods and the potential of modern chemical technology [1,2,3]. Compared to inorganic thermoelectrics, polymer-based systems despite a lower value of figure of merit offer advantages such as simplicity, environmental friendliness, low cost, low thermal conductivity, light weight, mechanical flexibility, etc. At the same time, in polymer nanocomposites, the relatively high Seebeck coefficient and low thermal conductivity are ensured by the optimal selection of the nature of the inorganic nanophase, as well as its interface surfaces with the polymer matrix, respectively. The conductive polymer matrix is capable of providing high electrical conductivity sufficient for thermoelectric applications.
In all the variety of thermoelectrics derived from conducting polymers, PANI-based organo-inorganic systems should be singled out as a separate group [4]. PANI successfully used in the development of energy conversion devices [5], batteries [6], sensors [7], electrochromic devices [8]. Widespread interest towards applying this heteropolyarylene [9] is due to the simplicity and accessibility of its synthesis, its stability to environmental conditions, its ability to enter into both acid-base and redox interactions, and its ability to change its physicochemical properties depending on the acidity of the medium, the degree of oxidation of the polymer main chain [9,10]. In addition, doped PANI has a high electrical conductivity as it is a conductive polyconjugated polymer [11]. At present, large values of the thermoelectric power factor and the figure of merit for PANI-based thermoelectrics are achieved by approaches such as molecular self-assembly, interface engineering, and inorganic incorporation [4]. In the inorganic incorporation approach, the formation of inorganic thermoelectrics (Bi2Te3, PbTe, Sb2Te3 and others) in PANI nanophase is preferable due to their inherently high Seebeck coefficient value. The combination in a PANI-based organic-inorganic nanocomposite of high PANI electrical conductivity and high Seebeck coefficient yields increased values of the thermoelectric power factor, e.g., for PANI/Te nanocomposites [12]. According to the interface engineering approach, carbon nanostructures are introduced into PANI-based organic-inorganic nanocomposites. The occurrence of π-π interactions at the PANI-CNT interfaces leads to an increase in charge carrier mobility and electrical conductivity. At the same time, the energy filtering effect generated from the energy offset between the interfaces of the components is possible [3,4,13]. As a result of this offset, the interfacial energy barrier can only allow charge carriers with high mobility to pass. Any of these phenomena can lead to an increase in the thermoelectric power factor, as observed, for example, for PANI/SWCNT/Te nanocomposites [14], PANI/MWCNT/Te [15]. It should be noted that the power factor of PANI-based organo-inorganic nanocomposites is not high enough; for the most successful samples it is 100–200 µWm−1 K−2 [1,4].
Currently, the synthesis of PANI-based organo-inorganic thermoelectrics is conducted by incorporating pre-synthesized nanoparticles into the PANI polymer matrix. Examples of successful incorporation of PbTe [16], Bi2S3 [2], Bi2Se3 [17], Bi2Te3 [18,19], Te [12,14,15] and other nanoparticles into PANI-based thermoelectric nanocomposites have been reported in the literature. The direct incorporation of nanoparticles into the PANI polymer matrix is achieved by in situ interface polymerisation [16], in situ polymerisation [14,19], mechanical mixing [18], ultrasonic co-treatment of PANI, nanoparticles [2,12], and MWCNT [15] dissolved in m-cresol. It should be noted that the above methods for the synthesis of PANI-based thermoelectric nanocomposites are often based on the use of special apparatus or provision of stringent synthesis conditions (ultra-low or ultra-high temperatures, long synthesis time) as well as the application of toxic and environmentally unfriendly substances such as TeO2 [16], NaBH4 [18], ethylene glycol [12], Na2TeO3 [14], m-cresol [2,12,15], etc. In our opinion, these disadvantages can be avoided by applying the previously developed simple environmentally friendly method of producing elemental tellurium nanoparticles Te0 or Bi2Te3 using commercially available powder bulk tellurium as a tellurizing agent at the stage of nanoparticle synthesis. Previously, we have successfully demonstrated the possibility of using commercial chalcogenide powders for the synthesis of elemental chalcogenide nanoparticles S0, Se0, Te0, as well as the nanoparticles of some chalcogenides (Ag2Se, Bi2Te3, ZnTe, SeS2) stabilized by natural polymer matrices [20,21,22]. At the same time, the most available and environmentally friendly method for the synthesis of thermoelectric hybrid organic-inorganic nanocomposites PANI/nanophase (Te0 or Bi2Te3) themselves is mechanochemical activation of pre-produced and purified PANI and Te0 and Bi2Te3 nanoparticles. Mechanochemical activation is in general one of the most common methods for transforming the structure of chemical substances due to its simplicity and accessibility. Due to low cost, easy processability, environmentally friendly, reduced solvent consumption, accessibility of novel structures, and the avoidance of problems posed by low monomer solubility and fast precipitation, as well as adherence to the principles of green chemistry, the mechanical activation method has currently gained considerable research attention and great prospects for practical application [23,24,25,26,27]. In spite of this fact, the data on mechanochemical synthesis of polymer nanocomposites, in particular, nanothermoelectrics, including PANI-based systems, are extremely insufficient in the scientific literature, and the available works present a sharp decrease in the power factor of the prepared composites [18,28].
One of the two quantities needed to estimate the power factor of a thermoelectric material, along with the Seebeck coefficient, is the electrical conductivity. The study of the temperature dependence of electrical conductivity, on the one hand, gives an opportunity to estimate the power factor in a specific temperature range in perspective. Today, it is possible to find information about the different nature of the temperature dependence of the DC electric conductivity of PANI-based systems. A decrease from 120 to 20 S/cm in the temperature range of 40–210 °C was observed for the PANI/Te 70 wt% nanocomposite [12] and a decrease from 80 to 10 S/cm was observed in the temperature range of 300–475 °C for PANI/Bi2S3 40 wt% [2]. An increase in electrical conductivity (27–30 S/cm) in the temperature range of 300–475 °C was shown for PANI/Bi2Se3 30 wt% [17]. The dependence of the electrical conductivity on the percentage of inorganic nanophase content is of great importance. Thus, increasing Bi2S3 content in PANI/Bi2S3 nanocomposite at T = 300 K from 40 to 90 wt% leads to a conductivity decrease from 80 to 5 S/cm [2]. Increasing Te content from 10 to 70 wt% in PANI-Te nanocomposite leads to a conductivity increase from 60 to 100 S/cm, whereas further increasing Te content up to 90% leads to a conductivity decrease up to 20 S/cm [12]. The highest power factor value at room temperature corresponded to the sample with the highest electrical conductivity: 110 [12], 0.8 [2], 30 µWm−1 K−2 [17]. On the other hand, the dependence σ d c vs. T, allows us to estimate the prevailing conduction mechanism of charge carriers in the thermoelectric material under study, using the models proposed earlier. To investigate the mechanism of electrical conductivity in polymer nanocomposites, the Arrhenius model and the Mott variable range hopping (VRH) model are most commonly used. Although both models are valid for conductivity experiments in the low temperature region (T < 300 K) [29], these models are also used for measurements under mid temperature conditions [30,31,32,33]. Depending on the experimental data, two models can be applied at the same time [31,32,33].
The paper reveals the first stage of thermoelectric properties study of novel mechanochemically produced coupled (p- and n-type electrical conductivity) ES-PANI-based MWCNT-containing nanocomposites with PEG-stabilized Te0 and Bi2Te3 nanophase. The investigation of temperature dependence of the nanocomposite DC electrical conductivity in the 298–353 K range was carried out using Arrhenius and VRH models.

2. Experimental Section

2.1. Materials

Aniline (Sigma-Aldrich, Burlington, MA, USA) was purified under vacuum in an inert atmosphere before use. Sodium persulfate (Sigma-Aldrich, Burlington, MA, USA), HCl (Sigma-Tek, Khimki, MSK region, Russia), bismuth nitrate (Reahim, MSK, MSK region, Russia), tellurium powder (Thermo Fisher, Kandel, Rhineland-Palatinate, Germany), ethanol (Reahim, MSK, MSK region, Russia), and MWCNT (Tanfeng Tech. Inc., Suzhou, Jiangsu Province, China) were used without additional purification. A dialysis bag (Scienova GmbH, Jena, Germany) with a pore diameter of 3.5 kDa was used to dialyze the ES-PANI samples.

2.2. Synthesis Techniques

2.2.1. Synthesis of ES-PANI

To synthesize the ES-PANI 4.56 mL of freshly distilled aniline was added to 50 mL of 1 M HCl solution. The resulting mixture was thermostatted at 5 °C for 30 min. After that, 20 mL of 2.4 M aqueous Na2S2O8 solution was added slowly dropwise and continuously stirred. The reaction was performed in an ice bath (at 3–5 °C) for 6 h. The colour of the solution changed from colourless, first to purple, and then to emerald green. After this time, the reaction medium containing the ES-PANI polymer was dialyzed against distilled water for 12 h, then the mixture was precipitated in a 4-fold excess of ethanol. The precipitate, which was an amorphous powder of dark green colour (ES-PANI), was separated by filtration on a Schott filter followed by multiple washing with water and alcohol and air-drying at room temperature until constant weight. Yield: 92%. Detected: C 58.68%; H 4.76%; N 10.90%, no ash.

2.2.2. Synthesis of PEG-Stabilized Te0 Nanoparticles

In a three-neck flask equipped with a thermometer and a reflux condenser 0.23 g NaOH was placed, 0.5 mL N2H4·H2O was added, and the temperature of the reaction medium was increased to 70 °C under constant stirring. After that, the flask was flushed with argon. To the reaction mixture, 0.48 g of elemental tellurium powder was added. The mixture was incubated for 30 min under intensive stirring and in an argon atmosphere until the tellurium had completely dissolved. The resulting mixture had a maroon–red colouring and contained Te2− ions. Next, 0.65 g of PEG-400 was added to the resulting mixture and stirred for another 20 min. PEG-stabilized Te0 nanoparticles were separated from the solution by centrifugation at 4000 rpm for 7 min with repeated washing of the precipitate with ethanol to neutral pH values. The resulting precipitate was air dried at room temperature to constant weight. The yield of tellurium nanoparticles was 46%.

2.2.3. Synthesis of PEG-Stabilized Bi2Te3 Nanoparticles

In a three-neck flask equipped with a thermometer and a reflux condenser 0.23 g NaOH was placed, 0.5 mL N2H4·H2O was added, and the temperature of the reaction medium was increased to 70 °C under constant stirring. After that, the flask with the reaction mixture was flushed with argon. Then 0.48 g of elemental powder tellurium was added to the mixture. It was kept for 30 min under intensive stirring and in an argon atmosphere until the tellurium was completely dissolved. The resulting mixture had a maroon–red colouring and contained Te2− ions. Next, 3 mL of bismuth nitrate (BiNO3)3∙5H2O solution in ethylene glycol (1.24 g in 3 mL) and 1 mL of PEG-400 were added to the resulting mixture to peg the formed Bi2Te3 nanoparticles. The reaction mixture was stirred in an argon atmosphere for 20 min at room temperature, followed by separation of the formed Bi2Te3 nanoparticles by centrifugation at 4000 rpm for 7 min and repeatedly washing the precipitate with ethanol to neutral pH values. The resulting precipitate was air dried at room temperature to constant weight. The yield of bismuth telluride nanoparticles was 52%.

2.2.4. Mechanochemical Synthesis of PANI-Te0 Nanocomposite

A 400.0 mg sample of ES-PANI and 20, 50, or 100 mg of PEG-stabilized Te0 nanoparticles was placed in an ML-1 ball mill (NPEF Ekon, Russia) (working chamber material—titanium; milling speed of 250 rpm was applied) and treated for 60 min. The mechanochemical processing produced 409, 442 or 481 mg of ES-PANI/Te0 composite using 20, 50, or 100 mg of PEG-stabilized Te0 nanoparticles, correspondingly. The yield was 96–98%. Found, % ES-PANI/Te0 (2.1%): C, 65.73; H, 4.41; Te, 2.1; N, 11.93; O, 14.4. ES-PANI/Te0 (4.36%): C, 65.09; H, 4.38; Te, 4.36; N, 11.93; O, 14.56. ES-PANI/Te0 (10.21%): C, 61.82; H, 4.32; Te, 10.21; N, 9.53; O, 14.89.

2.2.5. Mechanochemical Synthesis of PANI-Bi2Te3 Nanocomposite

The ES-PANI sample weighing 400.0 mg and 20, 50, or 100 mg of Bi2Te3 powder was placed in ML-1 ball mill (NPEF Ekon, MSK, MSK region, Russia) (working chamber material—titanium; milling speed of 250 rpm was applied) and treated for 60 min. The mechanochemical treatment resulted in 414, 434 or 491 mg of ES-PANI/Bi2Te3 composite, using 20, 50, or 100 mg of PEG-stabilized Bi2Te3 nanoparticles, respectively. The yield was 96–98%. Findings, %: ES-PANI/Bi2Te3 (1.48%): C, 65.62; H, 4.41; Te, 1.26; Bi, 0.22; N, 13.32; O, 14.55. ES-PANI/Bi2Te3 (2.92%): C, 64.26; H, 4.38; Te, 2.23; Bi, 0.69; N, 12.42; O, 14.76. ES-PANI/Bi2Te3 (7.34%): C, 60.58; H, 4.32; Te, 5.50; Bi, 1.84; N, 11.02; O, 15.00.

2.2.6. MWCNT-Doping of ES-PANI-Based Nanocomposites

The 200 mg of ES-PANI-based nanocomposites (ES-PANI/Te0 and ES-PANI/Bi2Te3) or the initial sample of ES-PANI and 3 mg of MWCNT were placed in an ML-1 ball mill (NPEF Ekon, Russia) (working chamber material—titanium; milling speed of 250 rpm was applied) and processed for 60 min. The mechanochemical processing resulted in 182–194 mg of MWCNT-doped ES-PANI-based nanocomposites using 200 mg of ES-PANI/Te0 or ES-PANI/Bi2Te3 nanocomposites. The yield was 90.0–95.6%.

2.3. Characterization Methods and Equipment

2.3.1. Elemental Analysis

The elemental composition was determined by X-ray energy dispersive microanalysis using a Hitachi TM 3000 electron scanning microscope with an SDD XFlash 430-4 X-ray detector and a Thermo Scientific Flash 2000 CHNS analyser.

2.3.2. IR Spectroscopy

Infrared spectra (IR spectra) were recorded in KBr in the 4000–400 cm1 frequency range on a Varian Resolutions Pro device. Before the measurement, an 800 mg sample of KBr was milled and thoroughly mixed with a 4 mg sample of the sample to be analysed, then the mixture was pressed into a 0.93–0.94 mm thick tablet on a Dezimalpresse DP 36 press.

2.3.3. X-ray Diffractometry

XRD was performed on a Bruker D8 ADVANCE diffractometer equipped with a Hebbel mirror, with Cu radiation in the locked coupled mode, with an exposure of 1 s for phase analysis and 3 s for estimation of the cell parameter and coherent scattering region size.

2.3.4. UV-Vis Spectroscopy

The UV-Vis spectra were measured on Perkin Elmer LAMBDA 950 UV-Vis spectrophotometer using the 150 mm integrating sphere.

2.3.5. Direct Current Electrical Conductivity Measurement

DC conductivity was measured by a standard E6-13A teraohmmeter using the two-probe method within a temperature range of 25–80 °C. A thermostat was used to maintain the temperature in the measuring cell. The powder samples were pressed in the form of pellets with a height of 0.2–0.6 mm and a radius of 1.5 mm. DC conductivity was calculated using the following equation:
σ = d R A
where A is the cross-section area (cm2), d is thickness of the pellet (cm), and R is the resistance of the sample (Ω).

3. Results and Discussion

3.1. Synthesis of ES-PANI

In this work, we used the approach recommended by IUPAC as a method for the synthesis of a highly conductive form of ES-PANI, which consists in the production of ES-PANI as a result of oxidative polymerization of aniline under the influence of ammonium persulfate in 1 M hydrochloric acid at room temperature and a monomer:oxidant molar ratio of 1:1.25 [34,35].

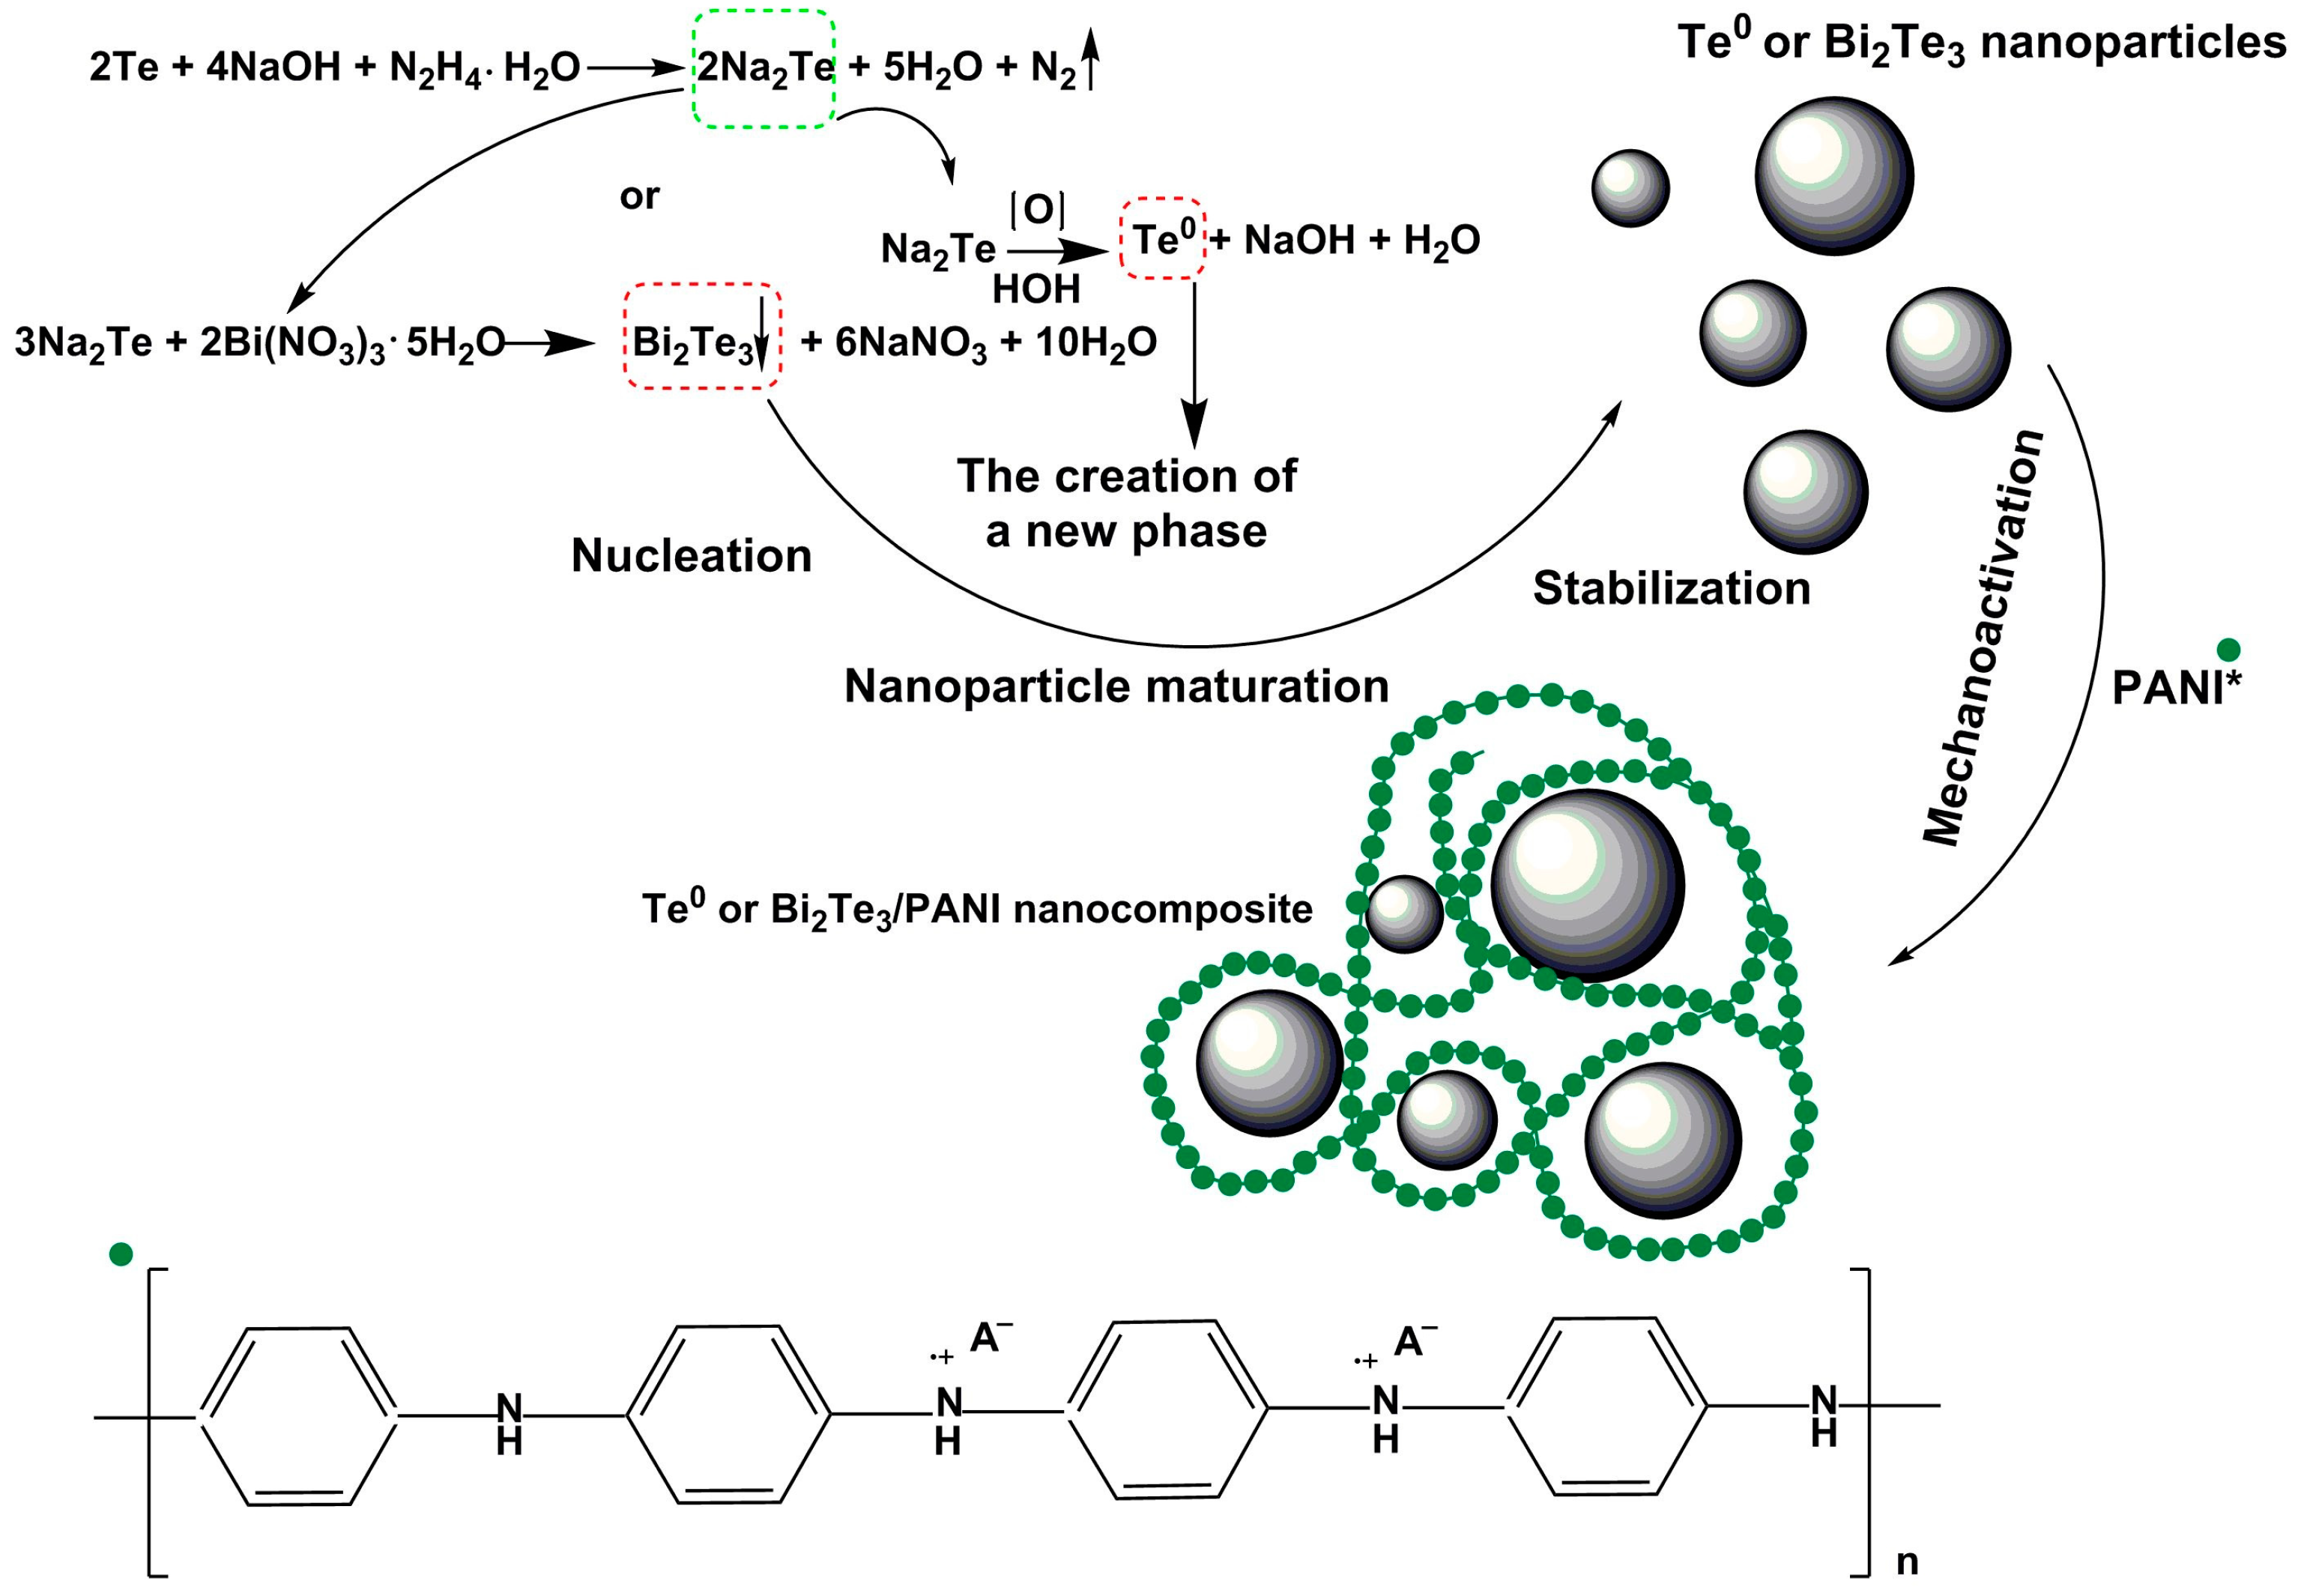
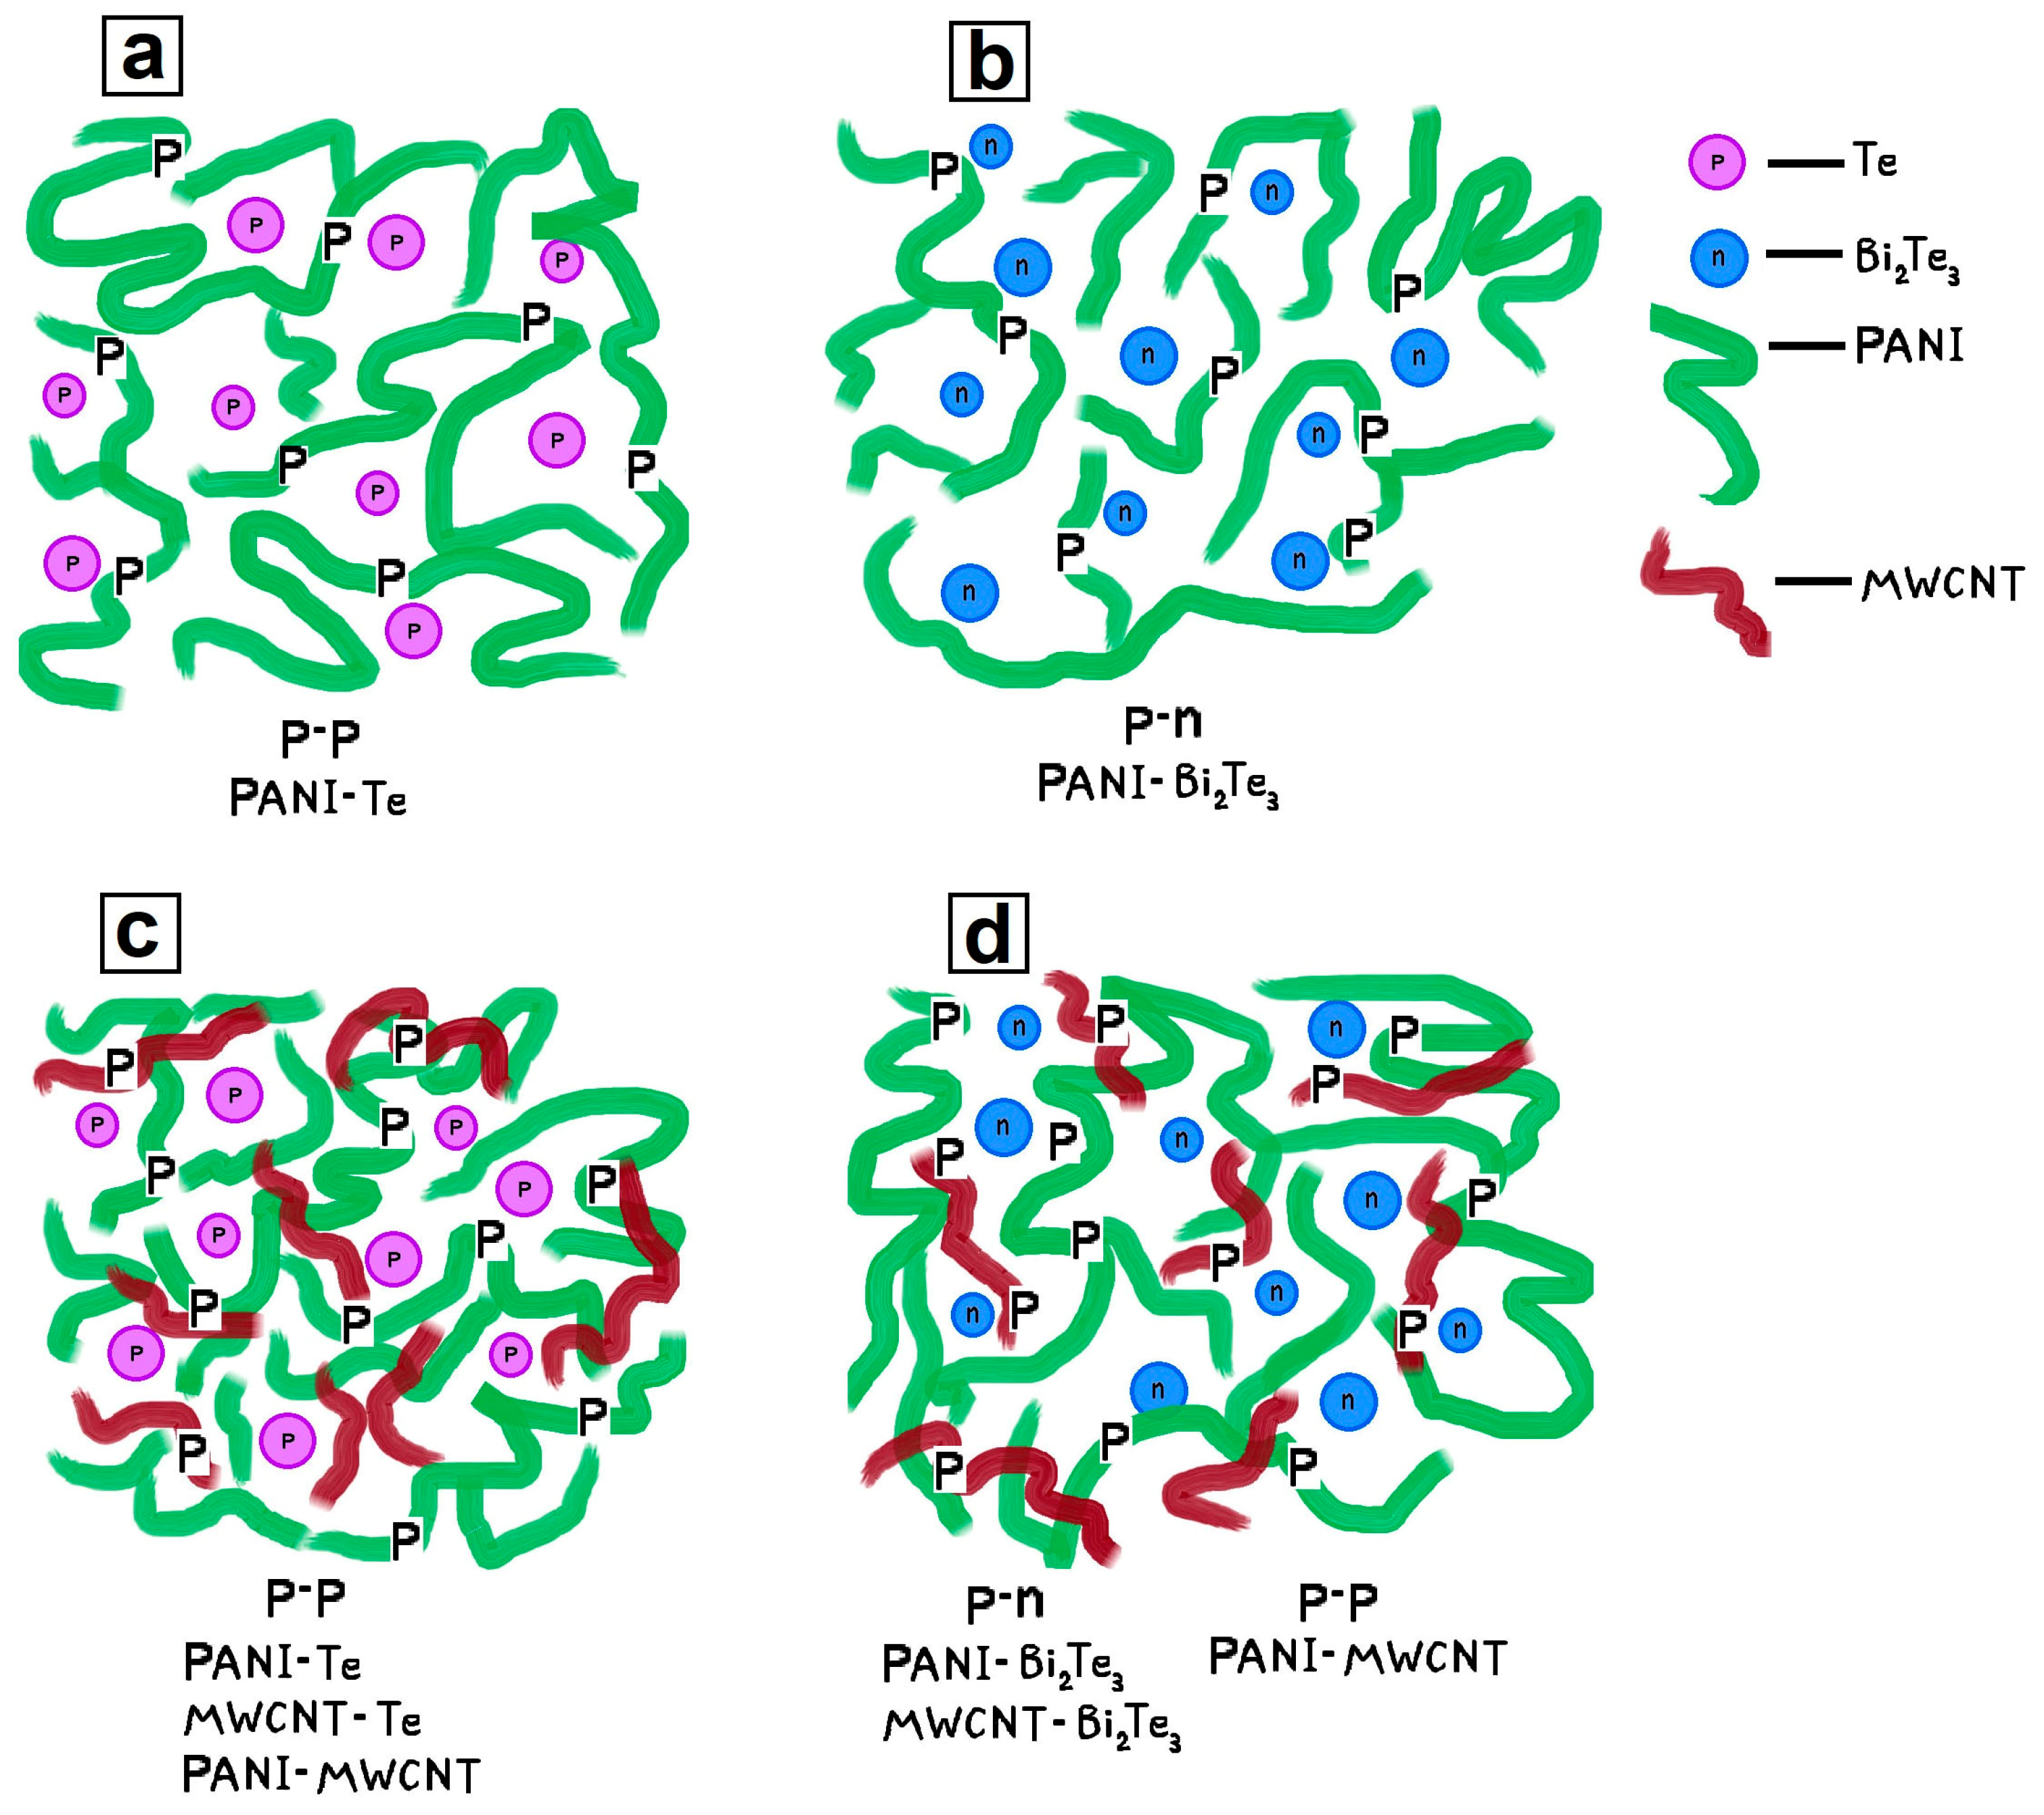
3.2. Synthesis of ES-PANI-Based Nanocomposites with Te0 and Bi2Te3 Nanoparticles

The introduction of thermoelectric additives with n- and p-type conductivity (in particular, Te0 and Bi2Te3 nanoparticles, as well as carbon nanotubes) into the ES-PANI matrix allows us to significantly modify not only its mechanical properties but also its conductive and thermoelectric properties, and also allows us to obtain modern technological materials combining the physicochemical properties of ES-PANI and its doping agents. Despite the apparent diversity of methods of synthesis of PANI-based nanocomposites, mechanoactivation is practically the only really effective way of their production due to the high risk of deprotonation or overoxidation of ES-PANI during synthesis of nanocomposites with loss of its pronounced electrically conductive properties. Thus, the environment-friendly approach to the synthesis of tellurium or bismuth telluride nanoparticles in polymeric matrices from powdered elemental tellurium through its preliminary reduction in the basic reduction system “hydrazine hydrate—base” is characterized by the introduction of highly reactive telluride anions as tellurides of alkali metals (Na, K) followed by either their oxidation to Te0 or their combination with Bi3+ ions. At the same time, alkali metal ions interact with water ions to form hydroxides with increasing pH of the reaction medium. Consequently, the introduction of an aliquot of the solution containing telluride anions for the in situ chemical synthesis of ES-PANI-based nanocomposites during the oxidative polymerization of aniline will lead to an increase in the pH of the reaction medium and a significant limitation of PANI protonation—and, consequently, the inability to obtain a highly conductive form of ES-PANI.
In addition, the presence of a high concentration of protons in the reaction medium (pH less than 2.5) will also affect the formation of nanoparticles themselves, leading to massive aggregation of the formed tellurium (or bismuth telluride) particles and obtaining materials with limited stability. Because of the factors described above, as well as the true insolubility of ES-PANI in almost all currently known solvents, the synthesis of Te0 and Bi2Te3-containing nanocomposites based on it was performed mechanochemically. Thus, mechanochemical activation of a mixture of ES-PANI and Te0 and Bi2Te3 nanoparticles previously synthesized by us from commodity elemental tellurium in the basic-reduction system “hydrazine-hydrate-NaOH” leads to the formation of an organic-inorganic composite material combining ES-PANI and Te0 or Bi2Te3 nanoparticles in its structure (Figure 1).
The mechanochemical synthesis of ES-PANI/Te0 and ES-PANI/Bi2Te3 nanocomposites was performed by mixing ES-PANI and pre-synthesized Te0 or commercial Bi2Te3 nanoparticles at ratios ranging from 1:20, to 1:8, and 1:4 in a ball mill.
The obtained composites were black amorphous water-soluble powders. Varying the quantitative ratio of the organic-inorganic phase in the obtained nanocomposites allows us to establish the influence of thermoelectric additives on the modification of the electroconductive properties of ES-PANI.

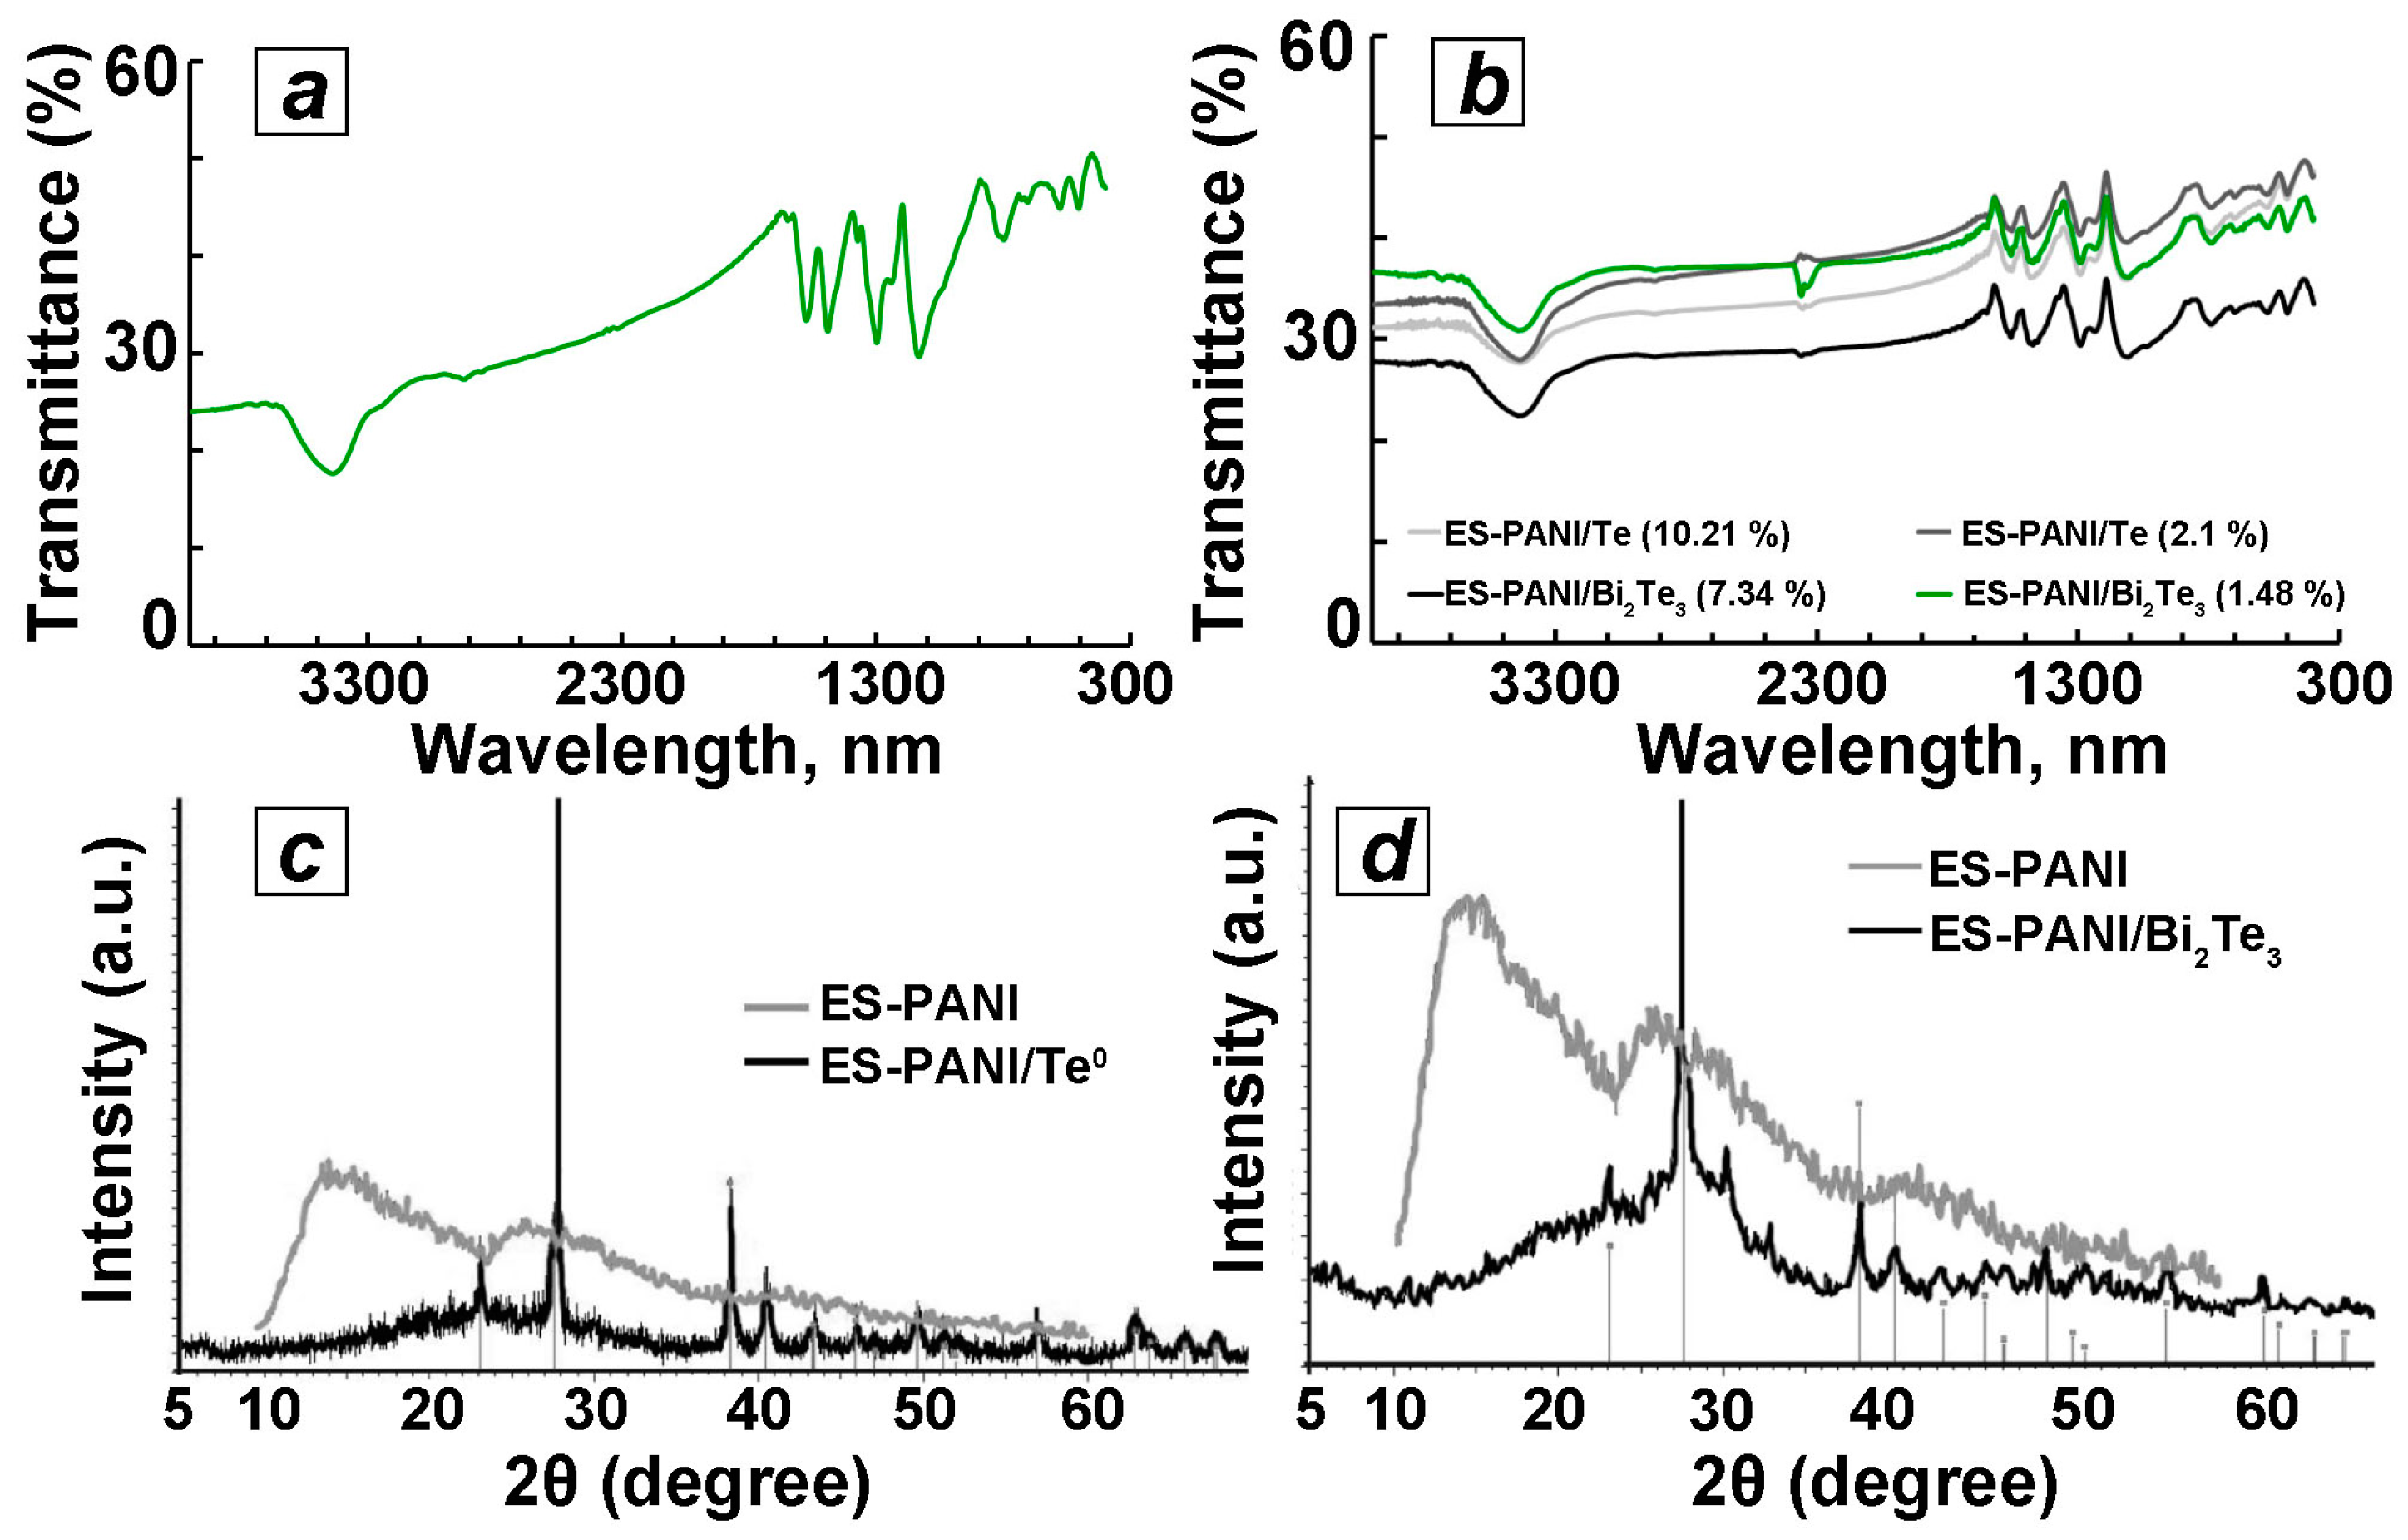
3.3. IR Spectroscopy

As shown in Figure 2a, in the IR spectrum of ES-PANI there is a characteristic absorption band at 1577 cm−1 corresponding to valent vibrations of C=C bonds of quinondiamine fragments, and the band at 1492 cm−1 corresponds to valent vibrations of C–C phenylenediamine fragments. The band at 1374 cm−1 corresponds to the vibrations of the bond of C benzene–N=C chinoid. In the region of 1299 cm−1 a band corresponding to strain vibrations of the C–N bond is observed, and the bands in the region of 1243 cm−1 and 1134 cm−1 belong to the valence vibrations of C–N+∙ polaron structures. The band in the region of 1043 cm−1 corresponds to the planar strain vibrations of the C–H benzoid rings. In the region of 818 cm−1, a band corresponding to the out-of-plane deformation oscillations of the C–H benzoid rings is observed [36]. The IR spectra of the obtained composites are characterized by the presence of bands identical to those present in the spectrum of the initial ES-PANI, indicating that the polymer structure of ES-PANI was preserved after a 60-min mechanochemical activation in the presence of inorganic phase Te0 and Bi2Te3 additives (Figure 2b).
Thus, the IR spectra of nanocomposites contain a characteristic band in the region of 1540–1580 cm−1 corresponding to the valent vibrations of C=C bonds of quinondiamine fragments. In the region of 1449–1453 cm−1 there is a band corresponding to the valent vibrations of C–C bonds of phenylenediamine fragments. The band at 1367 cm−1 corresponds to the vibrations of the bond of Sbenzene–N=Cchinoid. In the region of 1280 cm−1 a band corresponding to stretching vibrations of the C–N bond is observed, and the band in the region of 1208–1218 cm−1 belongs to the valence vibrations of C–N+ polaron structures. The band in the region of 1080–1090 cm−1 corresponds to the planar stretching vibrations of the C–H benzoid rings. In the region of 770 cm−1, a band corresponding to extraplanar deformation vibrations of C–H benzoid rings is observed [36]. The intensity ratio of the above bands also corresponds to those in the original ES-PANI sample.

3.4. XRD Analysis

According to the X-ray diffraction analysis, the obtained composites have two-phase amorphous-crystalline structure. Their diffractograms are characterized by the presence of halo amorphous ES-PANI phase, as well as a number of reflexes corresponding to the crystal phase of Te0 or Bi2Te3 nanoparticles (Figure 2c,d). Thus, the ES-PANI/Te0 nanocomposite sample contains a number of high-intensity reflexes in the 2θ region of the 23.05°, 27.55°, 38.33°, 40.45°, 43.32°, 45.88°, 49.69°, 56.87°, 63.75°, and 65.9°, which can be referred to (100), (101), (102), (110), (003), (200), (201), (202), (113), and (210) crystal planes of Te0 hexagonal crystal lattice, respectively (Figure 2c) [37]. The average size of Te0 nanocrystallites in the ES-PANI/Te0 nanocomposite (4.4 wt% Te0) calculated by the Scherrer formula is 32 nm. The X-ray diffraction pattern of the ES-PANI/Bi2Te3 nanocomposite is also characterized by the presence of an ES-PANI amorphous phase halo as well as a number of reflexes of different intensities corresponding to (101), (015), (1010), (110), (0015), (205), (0210) and (1115) planes of the rhombohedral crystal lattice of bismuth telluride, which in turn correlate well with the diffraction pattern of standard samples of bismuth telluride (JCPDS 15-0863) (Figure 2d) [38]. The average size of Bi2Te3 crystallites in ES-PANI/Bi2Te3 (2.9 wt% Bi2Te3) nanocomposite calculated by Scherrer formula is 17 nm.

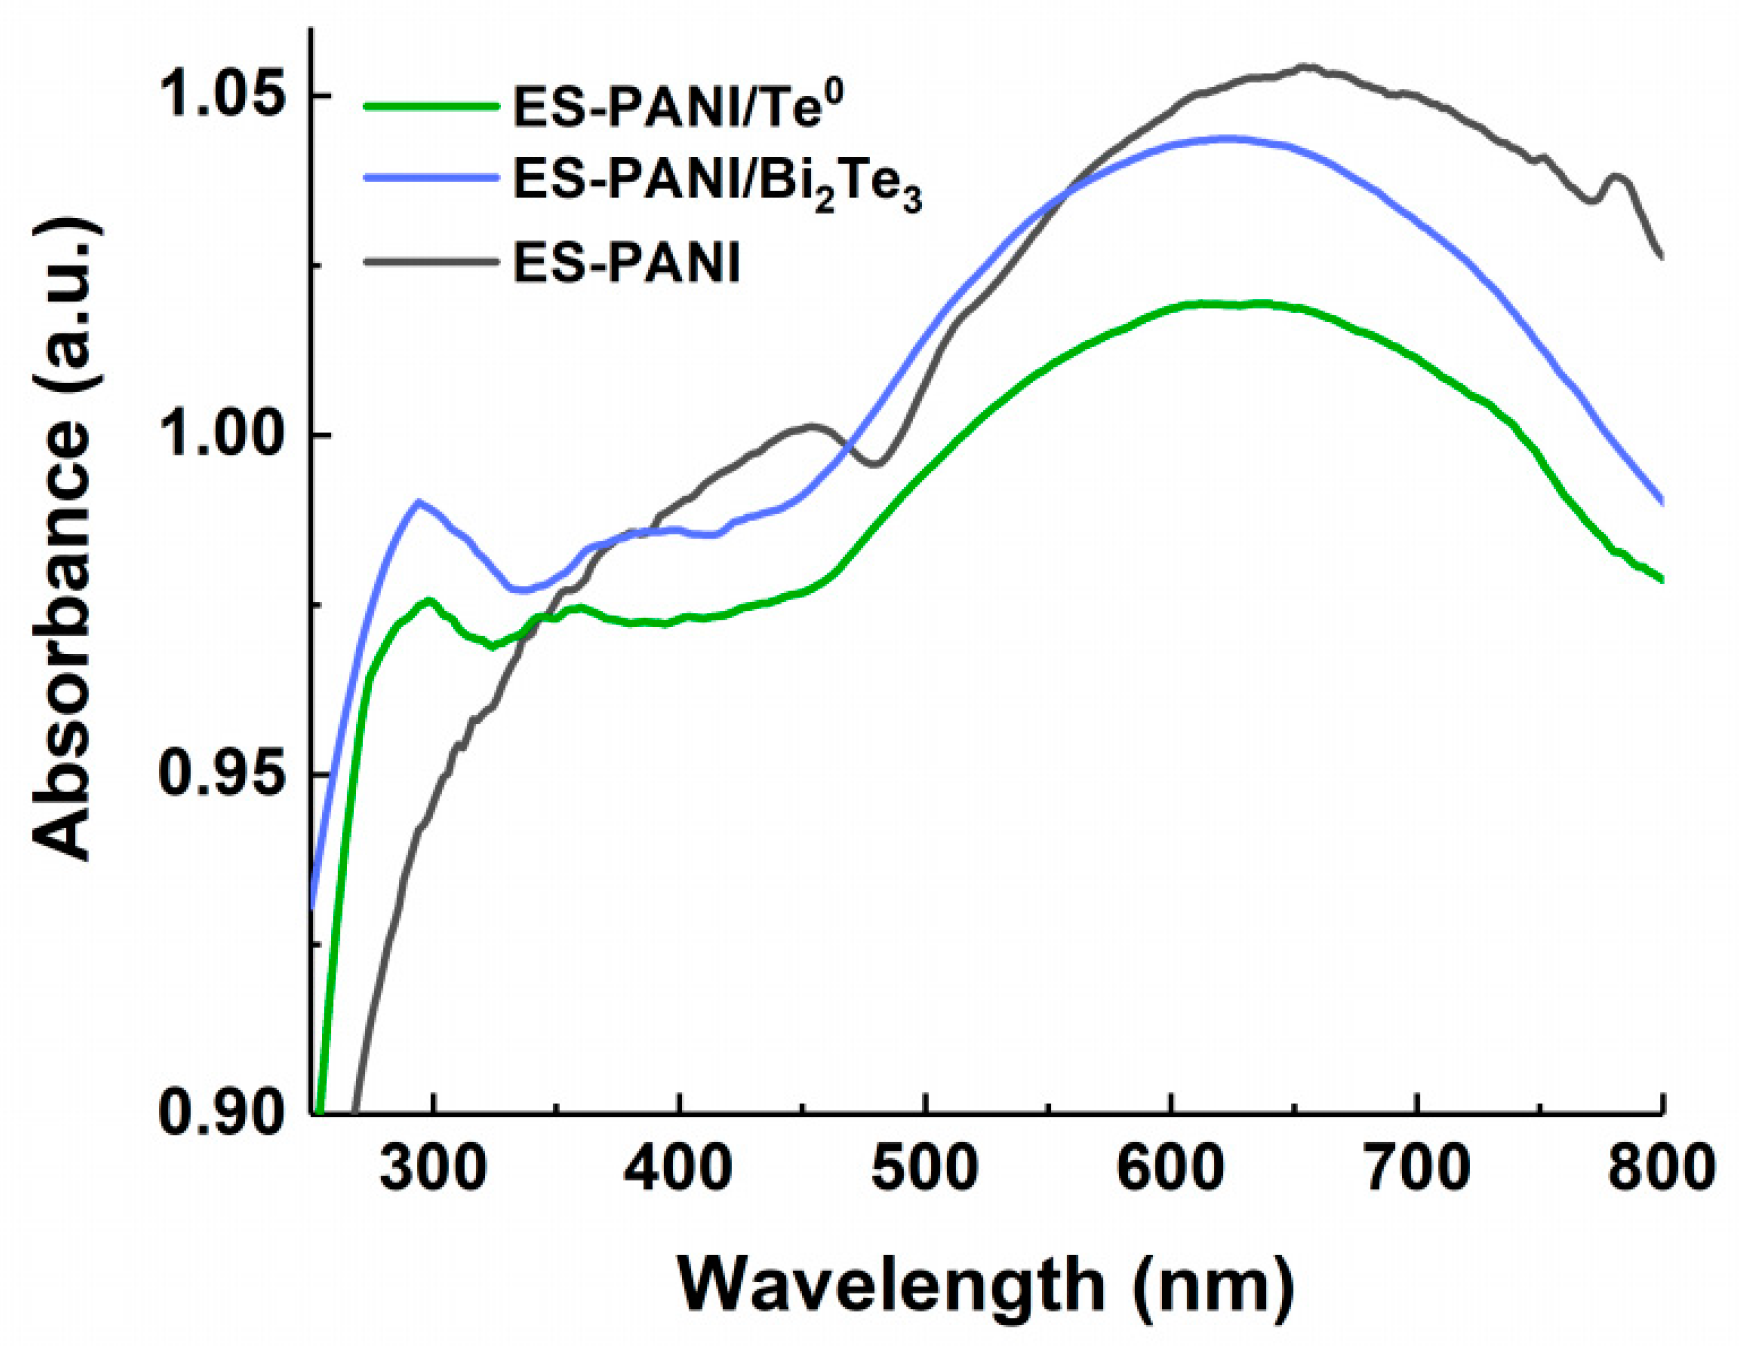
3.5. UV-Vis Spectroscopy

The UV-Vis absorption spectra of ES-PANI reveal two broad bands at 350–450 and at 654 nm (Figure 3).
The presence of these bands in the optical absorption spectrum of pure PANI is mentioned in the literature [39,40]. The first absorption band is related with π→π* transition of the benzenoid units as well as the second one which is associated with n→π* transition between the benzenoid ring to the quinoid ring. Figure 3 shows that the presence of an inorganic nanophase in ES-PANI/Te0 and ES-PANI/Bi2Te3 nanocomposites leads to 31 nm hypsochromic shift of absorption band at 654 nm for pure ES-PANI (absorption band at 623 nm for both types of nanocomposites), a hypsochromic shift of the band maximum at 453 nm by 67 nm for ES-PANI/Bi2Te3 nanocomposite (absorption band at 386 nm) and by 98 nm for ES-PANI/Te0 nanocomposite (absorption band at 355 nm), as well as the formation of an absorption band at 294 nm for ES-PANI/Bi2Te3 and at 297 nm for ES-PANI/Te0.

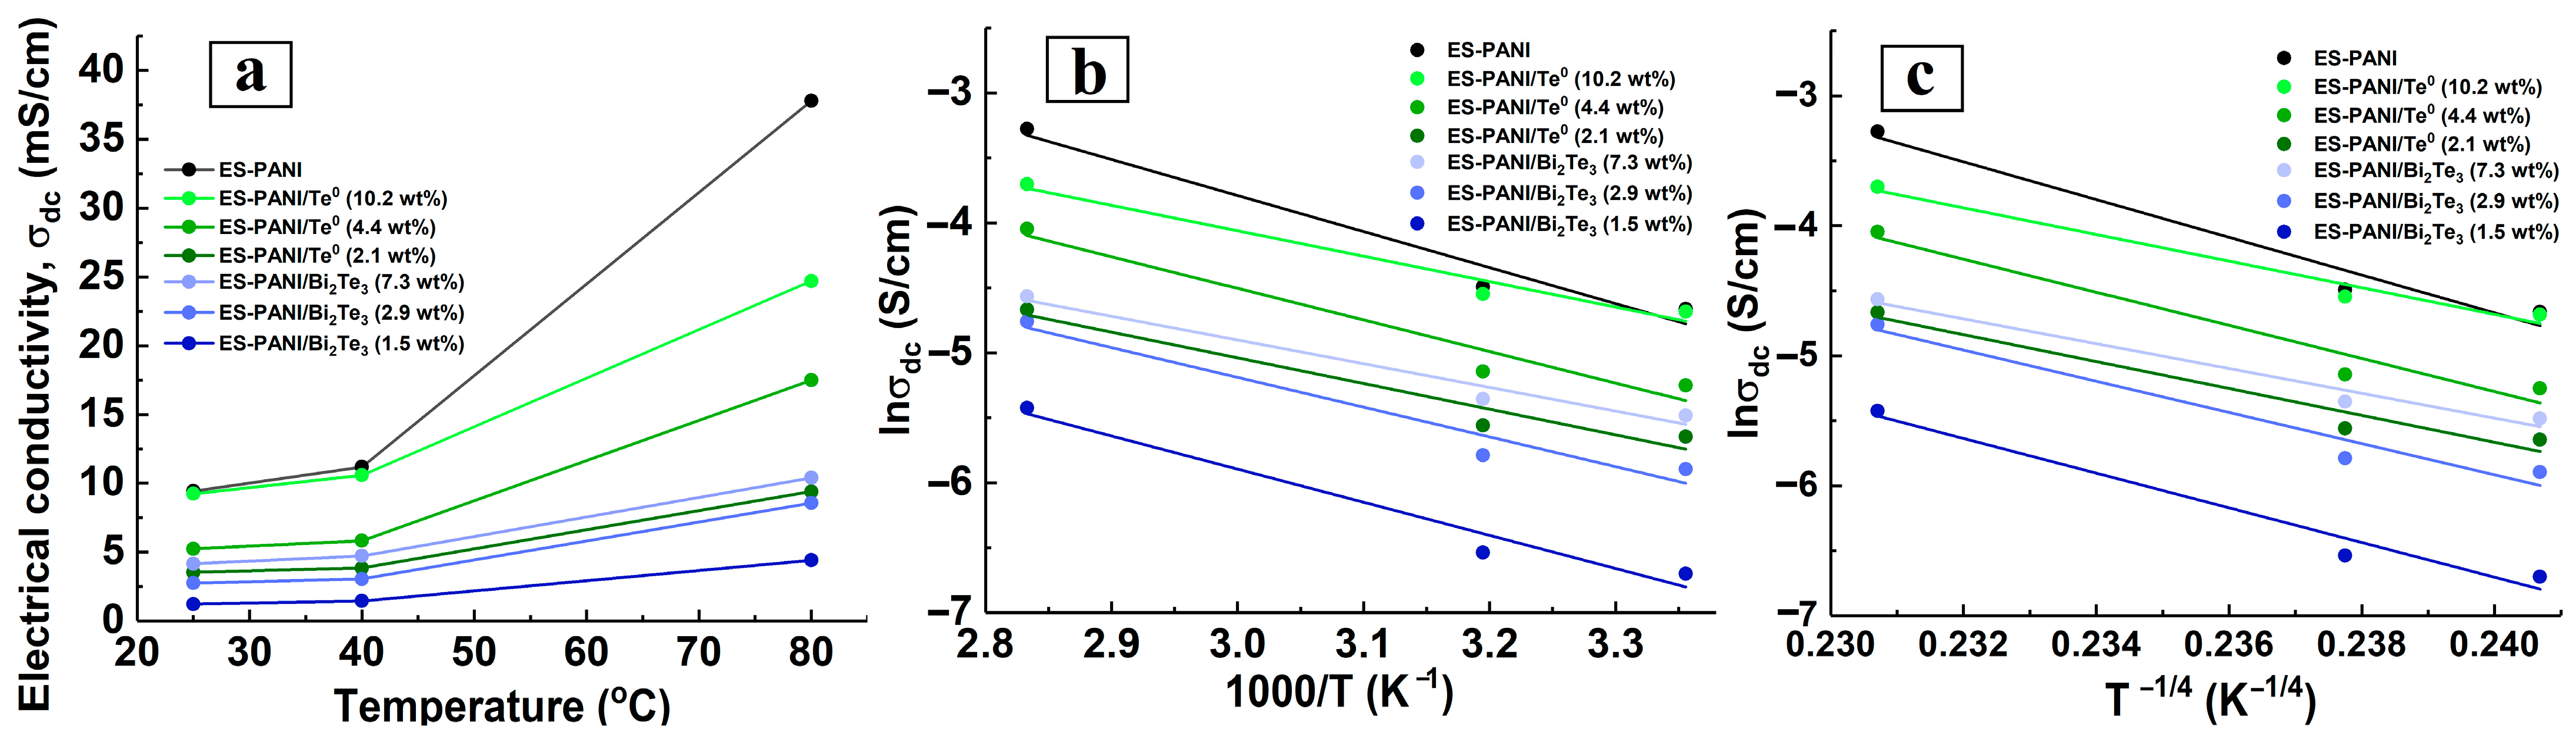
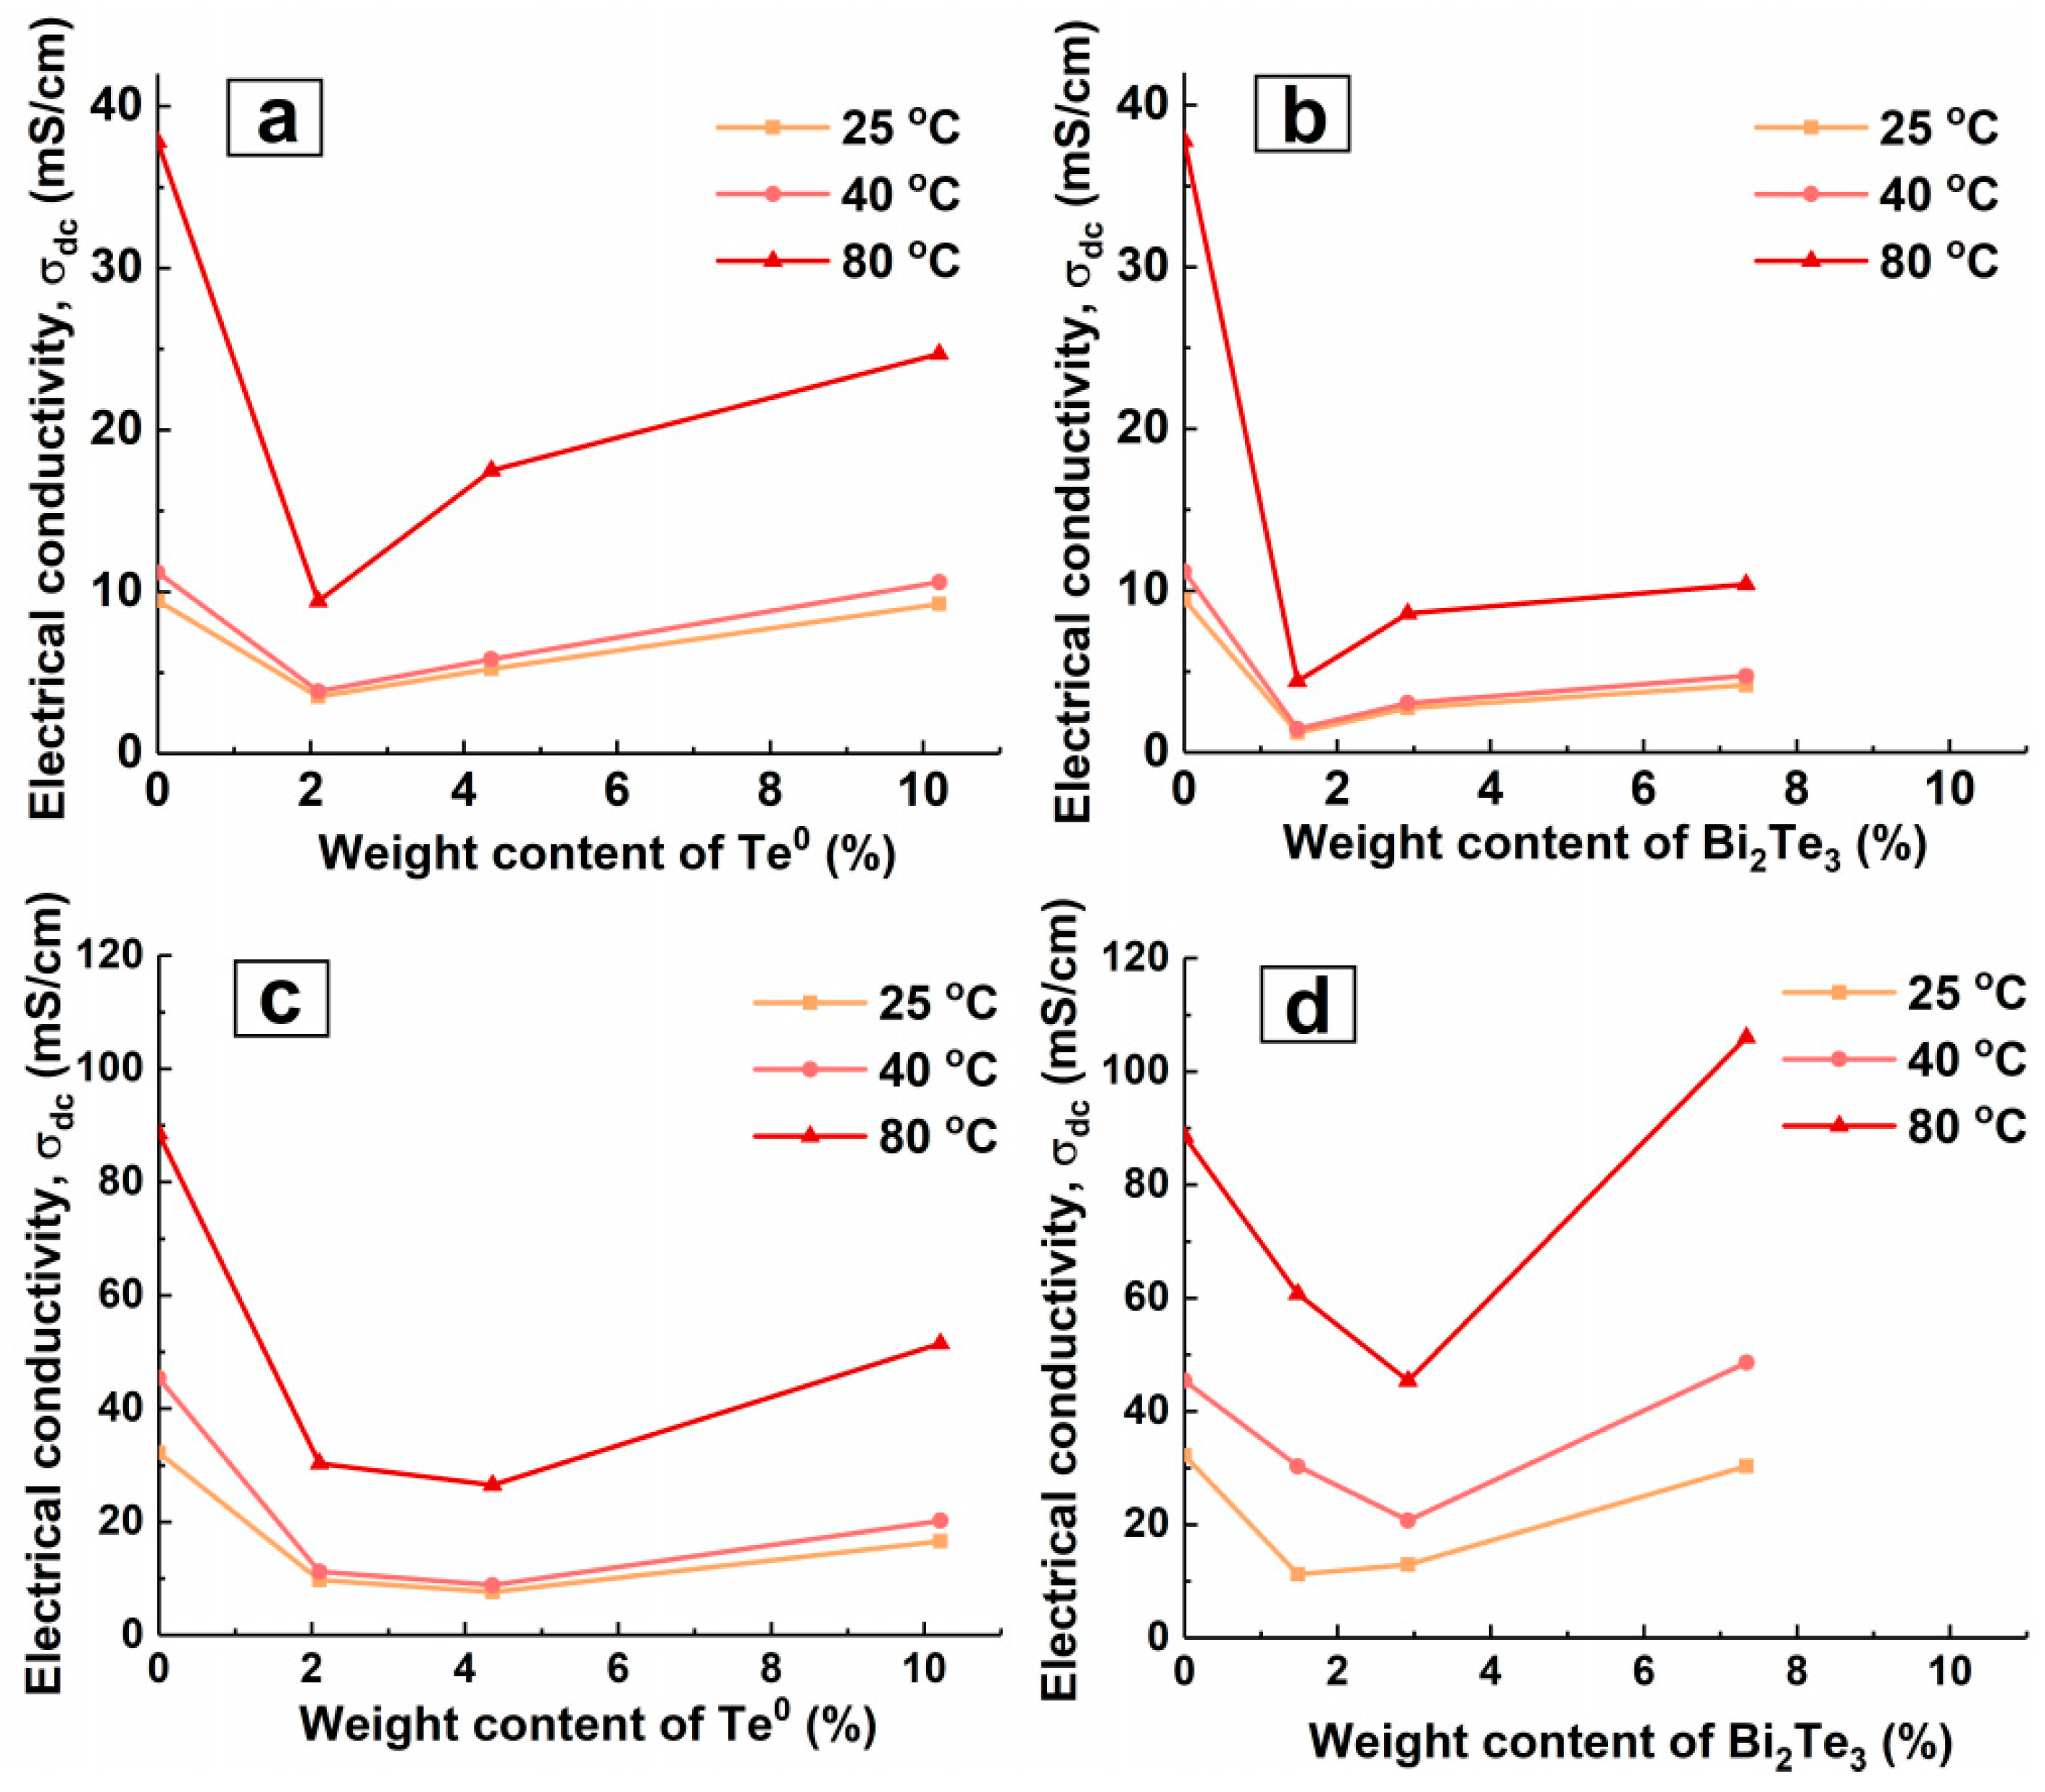
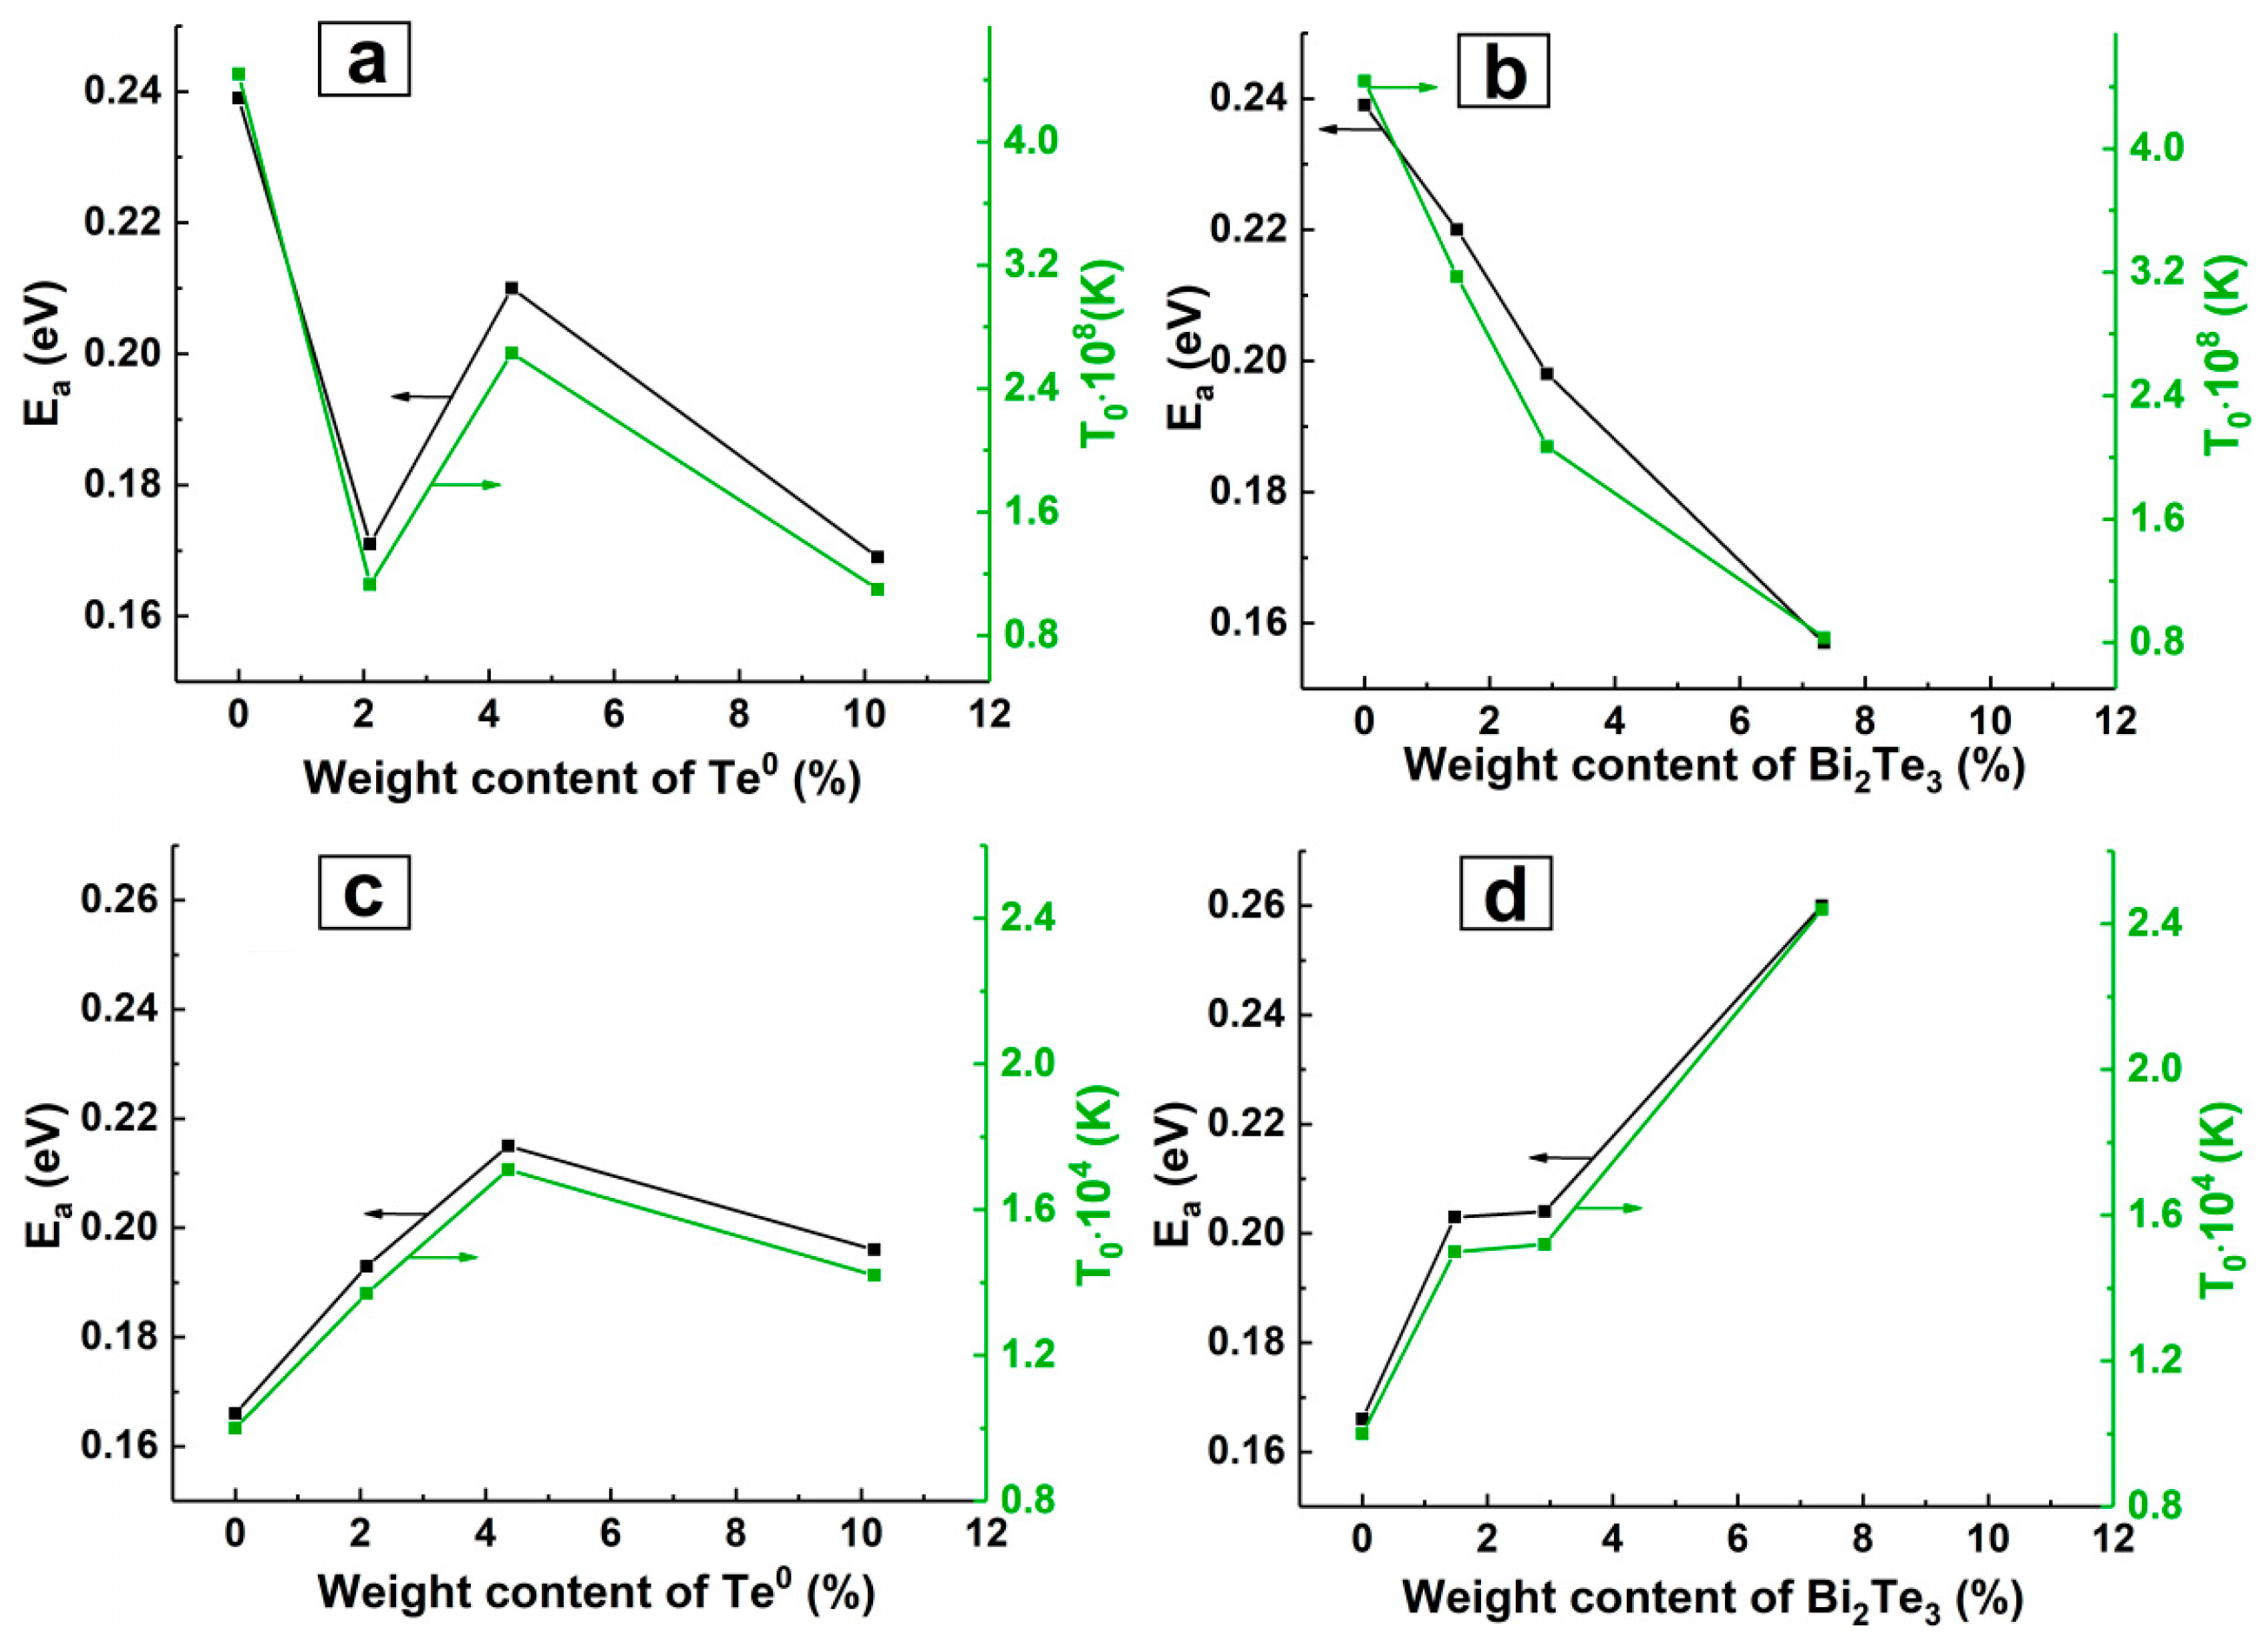
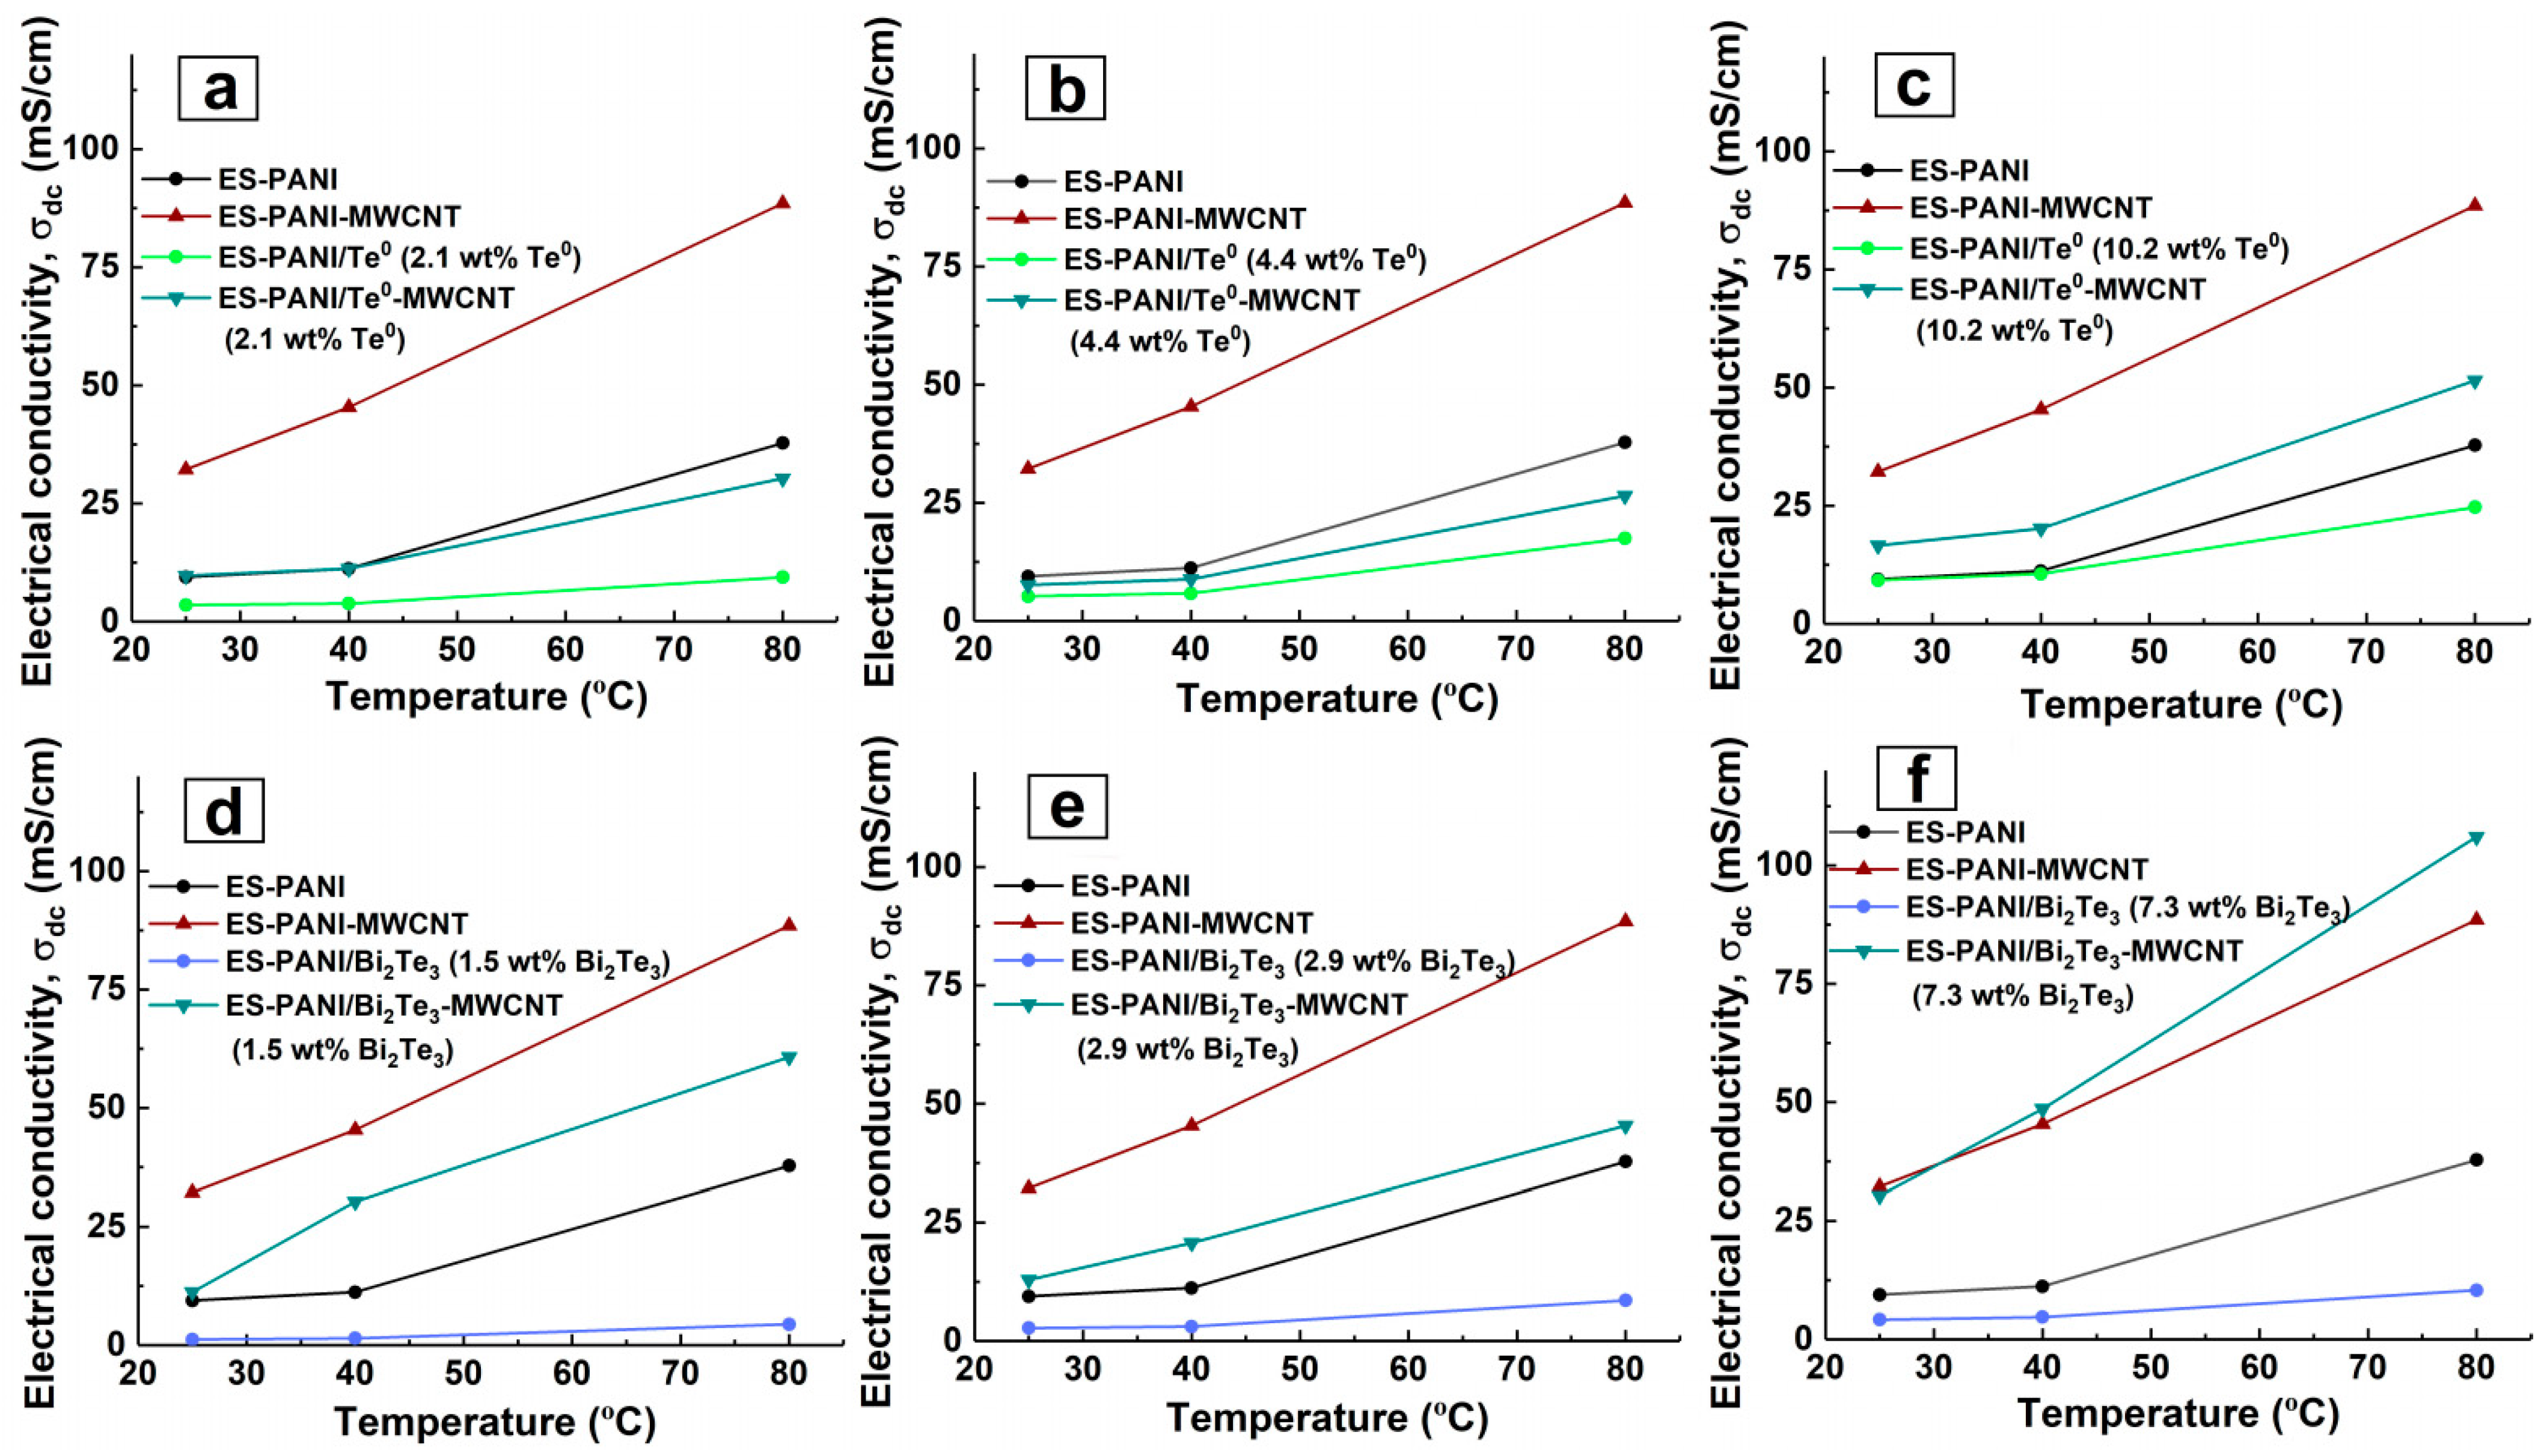
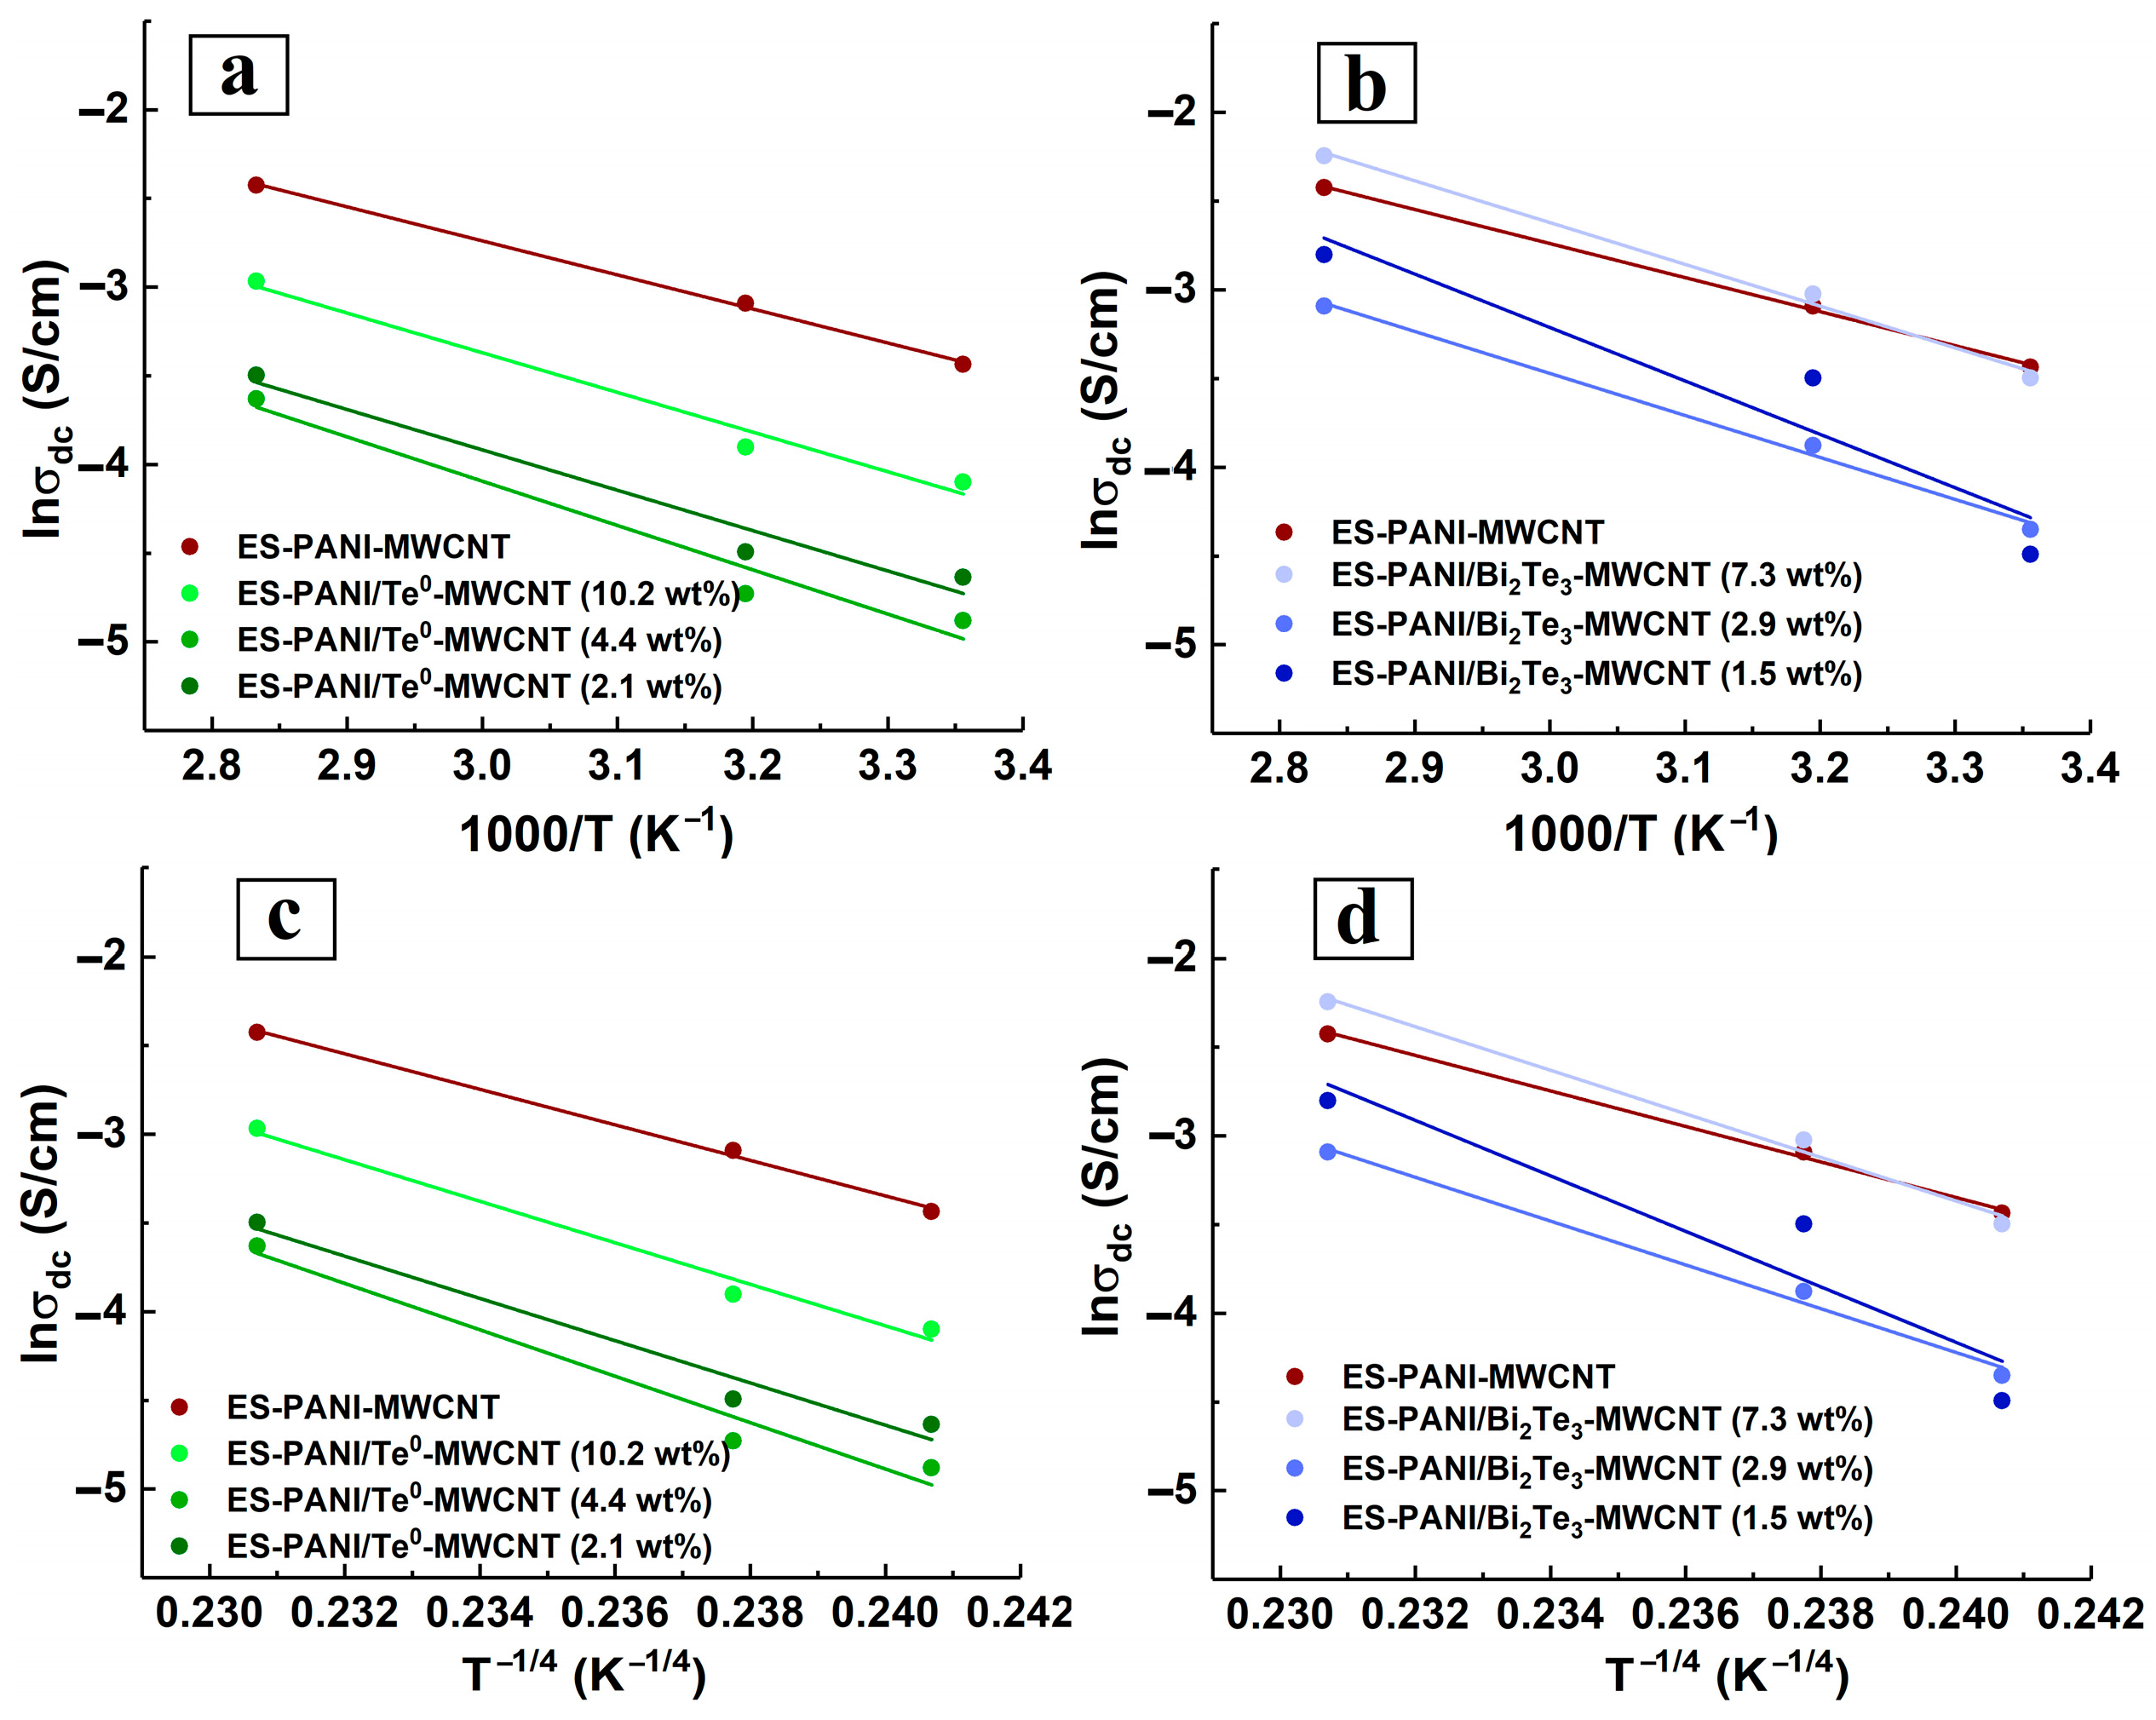
3.6. DC Electrical Conductivity

The study of conductivity is a complex task, since the measured temperature dependence of conductivity shows the result of the combined action of different conductivity mechanisms. The electrical conductivity of a composite is largely determined by the structure of its components, the degree of structural ordering of the composite and nature of the interfaces formed. In the nanocomposites under study, nanophase-matrix interfaces are formed in the presence of PEG, which acts as a nanoparticle shell. PEG is successfully used as a steric stabilizer of nanoparticles [41]. This polymer in the liquid state at 25 °C has an electrical conductivity of 1.9 μS/cm [42]. PEG enhances the conductivity of electrolytes [43] as well as of conductive polymers and systems [44]. Figure 4a demonstrates the dependence of direct current electrical conductivity on temperature for ES-PANI, ES-PANI/Te0, and ES-PANI/Bi2Te3.
The PEG present in the nanocomposite interfaces affects the conductivity behaviour and does not isolate the transport of the charge carriers. The extent and nature of the effect of PEG on electrical conductivity is the subject of further investigation. The observed values and the exponential growth of the electrical conductivity of PANI and nanocomposites with increasing temperature reveals the presence of semiconducting properties of the investigated samples [45]. ES-PANI has the highest conductivity value (Figure 4a). The existing variety of synthesis routes and, in particular, the doping of PANI results in a range of conductivity values. The electrical conductivity of synthesized ES-PANI has an intermediate value, as large values (1200–1800 [46], 6–8 S/cm [20]) as well as smaller ones (0.25 [47], 0.05–0.1 [48], 3.26 × 10⁻⁴ S/cm [49]) have been reported in the literature. With the rise in temperature, the electrical conductivity of the matrix increased by a factor of 1.2 when heating from 25 to 40 °C, and by a factor of 4 when heating from 40 to 80 °C. The addition of a semiconductor nanophase to the PANI matrix leads to a reduction of the electrical conductivity over the whole considered temperature range (Figure 4a and Figure 5a,b), which has been observed previously, for example in PANI-Mn3O4 nanocomposites [49]. This reduction is explained by the fact that the addition of PEG-stabilized nanoparticles into ES-PANI, due to the formation of organo-inorganic interface surfaces, prevents the transport of charge carriers as they move from one preferred location to another. Increasing the inorganic nanophase content in ES-PANI/Te0, ES-PANI/Bi2Te3 nanocomposites leads to increasing electrical conductivity (Figure 5a,b). A similar dependence has been observed previously, e.g., in PPy-Te nanocomposites [50]. The reason for this is that with growing inorganic nanophase content in the nanocomposite, the proportion of crystalline inclusion regions increases, i.e., the degree of ordering in the system becomes higher. Thus, two competing processes of inorganic-organic interface-assisted conductivity reduction (compared to PANI) and conductivity rise by increasing the degree of ordering in the system are observed in the investigated nanocomposites. The second process, according to Figure 5a,b can be considered more efficient.
Note that for samples with a semiconductor nanophase of different nature (Te0 and Bi2Te3) and the same organic-to-inorganic mass ratio, the difference in conductivity values increases with rising mass ratio (from 1:20 to 1:4) the higher the temperature. With increasing temperature, the difference of conductivity values of samples with a semiconductor nanophase of a different nature (Te0 and Bi2Te3) and the same organic-to-inorganic mass ratio at 25 °C increases from 2.3 × 10⁻³ (mass ratio 1:20) to 5.1 × 10⁻³ S/cm (1:4 mass ratio); at 40 °C from 2.4 × 10⁻³ (1:20 mass ratio) to 5.9 × 10⁻³ S/cm (1:4 mass ratio); and at 80 °C from 5.0 × 10⁻³ (1:20 mass ratio) to 14.3 × 10⁻³ S/cm (1:4 mass ratio). For samples with equal mass ratio, a higher value of electrical conductivity is observed for ES-PANI/Te0 nanocomposites. This is due to the difference in structure and properties of Te0 and Bi2Te3 and their interactions with the matrix. Higher conductivity values as well as its more active growth with increasing temperature are observed for ES-PANI/Te0 nanocomposites, probably because of the coincidence of nanophase and matrix conductivity types (p-type of electrical conductivity). It is known from literature data that PANI, Te [2,51], MWCNT [52] have p-type conductivity whereas Bi2Te3 exhibits n-type conductivity [2,51]. Due to a complex system of interfaces, the ES-PANI/Te0 nanocomposite can be considered to have probabilistically arranged organic-inorganic p-p junctions (Figure 6a). At the same time, the ES-PANI/Bi2Te3 nanocomposite can be represented as a system of stochastically arranged organic-inorganic n-p and p-n junctions (Figure 6b).
When the ES-PANI/Bi2Te3 nanocomposite is connected to the potential difference, both regions of successful transport of charge carriers arise in it, because for p-n junctions the applied voltage will be direct. Regions of practically no conductivity arise, because for n-p junctions the connected voltage will be inverse; a charge carrier depleted barrier layer will form at the n-p interface. The mismatch between the conductivity types of the matrix and nanophase is thus an additional barrier for charge carriers; their mobility is reduced, and the electrical conductivity is lower than it would be under more favourable conditions, as is observed for the ES-PANI/Bi2Te3 nanocomposite.
The temperature dependence of conductivity allows the mechanism of conductivity to be determined [29]. Most of the proposed models describe electrical conductivity at low temperature (up to 300 K). However, the Arrhenius model, for example, is also used for measurements made at temperatures above room temperature. In [31,52,53,54,55] this model is used to describe the temperature dependence of electrical conductivity of PANI-Se, PVA-Gd2O3, PVA-TiO2, PVA-HgS nanocomposites at mid temperature range. The Arrhenius model is stated:
σ d c = σ 0 e E a k B T
where σ 0 is the pre-exponential factor, k B denotes the Boltzmann constant and E a is an empirical coefficient characterizing the behaviour of conductivity as a function of temperature under experimental conditions, also called the activation energy of conductivity.
The value of activation energy E a and the pre-exponential factor σ 0 of nanocomposites have been calculated from Figure 4b data and are given in Table 1.
According to the Arrhenius model [33], lower activation energies correspond to higher conductivities. In the case of nanocomposites, the nanoparticle content has a significant influence on the electrical conductivity. If the nanophase content is low, the particles are separated by a significant layer of matrix polymer, there is mainly a matrix–particle interaction in the absence of direct particle–particle interaction. The particle–matrix interface can become a trap for the charge carrier, leading to an increase in activation energy. As the nanoparticle content increases, the distance between them is reduced, particle–particle interaction is enhanced, and charge migration is enhanced due to the lengthened interface route and the increased amount of semiconductor nanophase. This leads to a reduction in the activation energy of conduction [56]. This is fully illustrated in Table 1 and Figure 4a for the ES-PANI/Bi2Te3 samples. As the percentage of inorganic nanophase increases, the electrical conductivity increases, and the activation energy and pre-exponential factor decrease. According to Figure 4a, similar conductivity behaviour is observed for the ES-PANI/Te0 nanocomposites. However, it can be noted from Table 1 that there is no decrease in activation energy with decreasing Te content. The values of the coefficient of determination for ES-PANI/Te0 are noticeably lower compared to the data for ES-PANI/Bi2Te3 nanocomposites. Perhaps, a better fit of the measured data to the linear relationship in the Arrhenius plot in Figure 4 could have been obtained with more temperature values involved in the measurements. On the other hand, it is possible that the Arrhenius model is not well suited to describe the DC electrical conductivity on temperature dependence of ES-PANI/Te0 nanocomposites. The activation energies obtained in Table 1 are of the same order of magnitude as those calculated by the authors [57].
ES-PANI has the highest values of the Arrhenius model parameters and, according to Figure 4a, this polymer has the highest value of electrical conductivity. According to the scientific literature, the polymer matrix, both semiconductor [31,32,33] and dielectric [54], had the highest activation energy value compared to the nanocomposites based on it. In [31,32,58] the high activation energy of the polymer-matrix corresponded to its lowest DC conductivity as compared to the PANI-CaTiO3, PPy-MCO, PVA-HgS nanocomposites, respectively. In ref. [33] the PPy-ZCO nanocomposites had both higher and lower conductivity values compared to the PPy matrix, which had the highest activation energy. The authors of ref. [54] showed that the PVA matrix had the highest electrical conductivity, while having the highest activation energy compared to the PVA-Gd2O3 nanocomposites. Since the activation energy of conductivity is a parameter characterizing transport of carriers in a sample. Therefore, based on our data and data [31,32,33,54], we can conclude that inclusion of the inorganic nanophase in the nanocomposite changes the character of transport of carriers, and matrices are characterized by high values of activation energy.
The conductivity behaviour was also investigated using Mott’s variable range hopping (VRH) model [29]. This model has been developed to estimate the low-temperature conductivity in highly disordered systems with localized states (in non-crystalline media doped with semiconductors and amorphous semiconductors). According to [30,31,32,33] this model also applies at mid-temperature investigations. The conductivity in the VRH model is described by the equation:
σ = σ 0 e x p T 0 T 1 γ
where σ 0 is the pre-exponential factor, T 0 denotes Mott’s characteristic temperature, γ = d + 1 is a value related to the system dimensionality, and d presents the system dimensionality. For a three-dimensional conducting system (d = 3) the pre-exponential factor σ 0 and the characteristic temperature T 0 can be determined from the ln( σ d c ) vs. T−1/4 dependence (Figure 4c). The results of characteristic temperature and pre-exponential factor calculations are shown in Table 2.
The characteristic Mott temperature T 0 can be expressed as:
T 0 = 18 α 3 k B N E F
where k B is the Boltzmann constant, N E F is the density of states at Fermi level, and α is the coefficient of exponential decay of the localized state; it is the inverse of electron wave function localization length.
Knowledge of the T 0 values makes it possible to determine other important characteristic parameters of Mott’s VRH mechanism. They are average hopping distance (RH) and average hopping energy (W) [32,59,60].
Average hopping distance and average hopping energy can be expressed as equations, respectively:
R H = 9 8 π α k B T N E F 1 4
W = 3 4 π R 3 N E F
Assuming that α s = 0.96 nm [60], N E F , RH and W were calculated at T = 300 K and shown in Table 2. The calculated values of the VRH model parameters are in good agreement with the literature data. Thus, the RH and W parameters are of the same order of magnitude as the values obtained earlier for PANI-NiO [61] and PANI-MWCNT nanocomposites [62]. The parameters T 0 , RH, N E F are of the same order of magnitude as those calculated for the PPy-zinc cobalt oxide nanocomposite [33].
It is known that T 0 is inversely proportional to the localization length of the charge carrier, i.e., the greater T 0 the stronger the scattering of the charge carriers and the greater the resistance [63]. T 0 is a disorder measure in a disordered system. The VRH model best describes the conductivity behaviour of ES-PANI/Bi2Te3 nanocomposites. With increasing inorganic nanophase content in these nanocomposites, their electrical conductivity increases. At the same time the values T 0 and σ 0 which characterize the effective energy barrier between the localized states decrease, the value of N E F increases, and the mean hopping distance RH and its energy W decrease. Since E a and T 0 parameters characterize the energy barrier between localized states, their dependence on nanoparticle content has the same character (Figure 7a,b).
The decrease in the calculated E a and T 0 values for ES-PANI/Bi2Te3 nanocomposites corresponds to an increase in electrical conductivity with rising inorganic nanophase content (Figure 7b). The obtained values of E a and T 0 parameters for ES-PANI/Te0 nanocomposites are not linearly dependent on wt% Te0 content. For ES-PANI/Te0 nanocomposite with 2.1 wt% Te0 the values of E a and T 0 are not consistent with the corresponding experimental data on the temperature dependence of conductivity (Figure 7a). The applied conductivity models are probably not suitable for this nanocomposite. The corresponding value of the coefficient of determination has the lowest value (Table 1).
Figure 5 and Figure 8 reveal some trends in the conductivity behaviour of ES-PANI-MWCNT, ES-PANI/Te0-MWCNT, and ES-PANI/Bi2Te3-MWCNT nanocomposites due to the presence of MWCNT as a nanocomposite component.
The first particularity is that the electrical conductivity of MWCNT-containing nanocomposites is greater than that of pure ES-PANI, ES-PANI/Te0, ES-PANI/Bi2Te3. It should also be noted that the electrical conductivity of nanocomposites with large contents has overcome peculiar limits: ES-PANI conductivity in the case of ES-PANI/Te0-MWCNT nanocomposites and ES-PANI-MWCNT conductivity in the case of ES-PANI/Bi2Te3-MWCNT. The increase in MWCNT containing nanocomposites’ electrical conductivity is probably caused by an increase in charge carrier mobility either due to π-π interactions at the PANI-CNT interfaces or the appearance of the energy filtering effect generated from the energy offset between the interfaces of the components [4,15,64].
The second particularity is that whereas ES-PANI/Te0 nanocomposites have on average a higher electrical conductivity than ES-PANI/Bi2Te3, ES-PANI/Te0-MWCNT nanocomposite has, on the contrary, on average a lower electrical conductivity than ES-PANI/Bi2Te3-MWCNT. In ternary nanocomposites, a complex system of interfaces is formed, in which two types of junctions such as p-p (PANI-MWCNT or PANI-Te) and p-n junctions (PANI-Bi2Te3, MWCNT-Bi2Te3) are predominantly possible. The increase in conductivity of the ES-PANI/Te0-MWCNT nanocomposite, as compared to the ES-PANI/Te0 nanocomposite, is caused by the fact that along with organic-inorganic p-p junctions organic-organic p-p junctions act in the nanocomposite. The occurrence of π-π interactions between PANI and MWCNT enhance the electrical conductivity of the nanocomposite. Due to these interactions between PANI and MWCNT, greater electrical conductivity of ES-PANI/Bi2Te3-MWCNT nanocomposites compared to ES-PANI/Bi2Te3 nanocomposites is observed. At the same time, the electrical conductivity of ES-PANI/Bi2Te3-MWCNT nanocomposites is noticeably higher than that of ES-PANI/Te0-MWCNT nanocomposites. This can be explained by the fact that in the competition between different types of transport of charge carriers in MWCNT-containing nanocomposites, the charge carrier movement provided by the presence of successful transport regions formed by PANI-Bi2Te3 p-n junctions seems to prevail over the effect of organic-inorganic p-p PANI-Te junctions.
The third characteristic feature of electrical conductivity of ES-PANI/Te0-MWCNT and ES-PANI/Bi2Te3-MWCNT nanocomposites is its other dependence on the inorganic nanophase content than that of ES-PANI/Te0 and ES-PANI/Bi2Te3 nanocomposites. Figure 5c,d show that we observed an interesting effect of relative DC conductivity reduction for ES-PANI/Bi2Te3-MWCNT and ES-PANI/Te0-MWCNT nanocomposites at some intermediate values of the investigated inorganic nanophase content range (4.4 wt% Te0, 2.9 wt% Bi2Te3). It should be noted that this effect is independent on temperature. It also does not rely on the weight content of MWCNT in the samples because a constant value of 1.5 wt% was applied when creating the nanocomposites. The results show that the effect is directly related to the inorganic nanophase content (and hence the nanoparticle size) in the composite and to the presence of MWCNT in the composite, as an increase in electrical conductivity is observed in the absence of MWCNT (Figure 5a,b). The observed decrease in DC conductivity can be explained either by probability in nanocomposite sampling or by a change in the structure of the conductive routes. On the one hand, since each of ES-PANI/Te0-MWCNT or ES-PANI/Bi2Te3-MWCNT type of nanocomposite is a disordered system, there is a possibility that in a particular sample the components of the nanocomposite can be unevenly arranged. Therefore, in ES-PANI/Bi2Te3-MWCNT nanocomposites the number of p-n junctions may be low, while the number of locking n-p junctions will be sufficient. In this case, charge carrier transport is ensured mostly by PANI-MWCNT interfaces, and the electrical conductivity of nanocomposite is relatively low. In the case of the ES-PANI/Te0-MWCNT nanocomposite, unevenly distributed components can lead to reduced conductivity due to fewer organic-organic p-p junctions. On the other hand, it is possible that nanocomposites contain a fraction of nanoparticles of a certain size that cannot be detected by XRD. Such nanoparticles are capable of penetrating an MWCNT. Therefore, the structure of the conductive routes in these disordered systems may change. Nanoparticles trapped by nanotubes do not participate in the transport because it is energetically advantageous for the charge carriers located on the nanotube to travel along the nanotube surface to its tip, instead of traversing the energy barrier of the MWCNT-Te0 or MWCNT-Bi2Te3 interface between the nanotube and the trapped nanoparticle. The fraction of nanoparticles trapped by nanotubes and the degree of its effect on the electrical conductivity differ in nanocomposites with different contents of inorganic nanophase. In general, nanoparticles of smaller size are formed in nanocomposites with lower inorganic nanophase weight content. Their influence is not as strong, and even in the presence of nanoparticles in the trapped state, there is no reduction in DC conductivity. It is likely that the large nanoparticles formed at the highest inorganic content, due to their size, are unable to penetrate the nanotube—and there is no reduction in electrical conductivity either. In nanocomposites with a medium semiconductor content, medium-sized nanoparticles are formed which, due to their size, are already capable of influencing transport routes. However, the fraction of medium-sized nanoparticles trapped by nanotubes is not involved in charge carrier transport. This leads to a number reduction of organic-inorganic p-p junctions in ES-PANI/Te0-MWCNT and n-p (and p-n) junctions in ES-PANI/Bi2Te3-MWCNT nanocomposites. A reduction in the total number of MWCNT-inorganic nanophase interfaces results in the transport provided by PANI-Te or PANI-Bi2Te3 and PANI-MWCNT interfaces, and hence a decrease in the electrical conductivity value is observed. We assume that there is a region of inorganic nanophase content at which the effect is possible. Finding out the limits of this region for each type of nanocomposite is the subject of our further research. For ES-PANI-MWCNT, ES-PANI/Te0-MWCNT, ES-PANI/Bi2Te3-MWCNT nanocomposites, the Arrhenius and VRH model parameters were calculated (Figure 9). The results are presented in Table 3 and Table 4.
The dependence of the calculated E a and T 0 values on the inorganic nanophase content is shown in Figure 7c,d. As can be seen from Figure 5c and Figure 7c, E a and T 0 determined for the ES-PANI/Te0-MWCNT nanocomposite as parameters characterizing the height of the energy barrier correspond to the experimental dependence of electrical conductivity on the inorganic nanophase content. For ES-PANI/Te0-MWCNT nanocomposites both conductivity models describe the observed conductivity behaviour quite accurately. In contrast, the applied conductivity models for describing the conductivity behaviour of ES-PANI/Bi2Te3-MWCNT nanocomposites are not suitable because the calculated dependence of the parameters E a and T 0 on the inorganic nanophase (Figure 7d) does not fit the experimental data (Figure 5d).

4. Conclusions

The DC electrical conductivity study presented in this paper is the first step in investigating the properties of novel thermoelectric nanocomposites of the PANI/inorganic nanophase-MWCNT type, obtained by mechanochemical synthesis. ES-PANI and also PEG-stabilized Te0 and Bi2Te3 nanoparticles were synthesized beforehand. ES-PANI/Te0 and ES-PANI/Bi2Te3 nanocomposites of three different inorganic nanophase weight contents—as well as MWCNT doped composites on their base (ES-PANI/Te0-MWCNT and ES-PANI/Bi2Te3-MWCNT)—were successfully created via mechanochemical synthesis with the purpose to produce coupled polymer-based nanothermoelectrics for potential application in thermoelectric element. All the samples were characterized by elemental analysis, IR spectroscopy, XRD and UV-Vis spectroscopy.
Nanocomposites with properties that exhibit similar behaviour (in particular DC conductivity) are preferred as companion materials for use in thermoelectric cells. The results obtained by investigating the temperature dependence of the DC electrical conductivity of PANI and its nanocomposites with Te0 and Bi2Te3 nanoparticles showed that all the samples had semiconducting properties. The ES-PANI/Te0, ES-PANI/Bi2Te3 nanocomposites exhibited relatively close electrical conductivity values. As the inorganic nanophase content increased, their electrical conductivity grew. The incorporation of MWCNT into the nanocomposites provided an increased value of electrical conductivity compared to ES-PANI/Te0, ES-PANI/Bi2Te3 nanocomposites. Close conductivity values were observed for ES-PANI/Te0-MWCNT and PANI/Bi2Te3-MWCNT nanocomposites. The electrical conductivity behaviour for these nanocomposites was also uniform. It was found that the decrease in electrical conductivity was detected at the inorganic nanophase content of 4.4 wt% for the ES-PANI/Te0-MWCNT nanocomposite and 2.9 wt% for the ES-PANI/Bi2Te3-MWCNT one. The study of the temperature dependence of conductivity using Arrhenius and VRH models showed that both models best describe the conductivity behaviour in ES-PANI/Bi2Te3 and PANI/Te0-MWCNT nanocomposites.
Thus, for the nanocomposites under study, it is possible to set the value of their electrical conductivity at the synthesis stage. A properly selected value of the electrical conductivity of the nanocomposite can ensure a low value of its thermal conductivity, which, given a suitable value of the Seebeck coefficient determined by the nature of the inorganic nanoparticles, leads to a polymer nanocomposite with a synthesis-controlled thermoelectric figure of merit.

Author Contributions

Conceptualization, A.V.Z. and M.V.Z.; methodology, A.V.Z., M.V.Z. and G.F.P.; software, A.V.Z. and M.V.Z.; validation, A.V.Z., M.V.Z. and G.F.P.; formal analysis, A.V.Z., M.V.Z. and G.F.P.; investigation, A.V.Z., M.V.Z. and G.F.P.; resources, A.V.Z. and M.V.Z.; data curation, M.V.Z.; writing—original draft preparation, M.V.Z. and A.V.Z.; writing—review and editing, M.V.Z. and A.V.Z.; visualization, M.V.Z. and A.V.Z.; supervision, M.V.Z.; project administration, M.V.Z. and A.V.Z.; funding acquisition, A.V.Z. All authors have read and agreed to the published version of the manuscript.

Funding

This research was funded by a grant № 2022-05 from the A.E. Favorsky Irkutsk Institute of Chemistry, Siberian Branch, Russian Academy of Sciences.

Institutional Review Board Statement

Not applicable.

Informed Consent Statement

Not applicable.

Data Availability Statement

The data presented in this study are available from the corresponding author upon request.

Acknowledgments

The authors wish to thank the Baikal Analytical Centre (Irkutsk Institute of Chemistry of the Siberian Branch of the Russian Academy of Sciences).

Conflicts of Interest

The authors declare no conflict of interest.

Abbreviations

DCdirect current
ES-PANIpolyaniline emeraldine salt
MWCNTmulti-walled carbon nanotube
PANIpolyaniline
PEGpoly(ethylene glycol)
PPypolypyrrole
VRH modelMott’s Variable range hopping model
ZTthermoelectric figure of merit

References

  1. Li, J.; Huckleby, A.B.; Zhang, M. Polymer-based thermoelectric materials: A review of power factor improving strategies. J. Mater. 2022, 8, 204–220. [Google Scholar] [CrossRef]
  2. Wang, Y.; Liu, G.; Ming, S.; Yu, C.; Deng, Y. Flexible thermopower generation over broad temperature range by PANI/nanorod hybrid-based p-n couples. J. Mater. Chem. A 2019, 7, 1718–1724. [Google Scholar] [CrossRef]
  3. Nandihalli, N.; Liu, C.J.; Mori, T. Polymer based thermoelectric nanocomposite materials and devices: Fabrication and characteristics. Nano Energy. 2020, 78, 105186. [Google Scholar] [CrossRef]
  4. Liu, S.; Li, H.; Li, P.; Liu, Y.; He, C. Recent Advances in Polyaniline-Based Thermoelectric Composites. CCS Chem. 2021, 3, 2547–2560. [Google Scholar] [CrossRef]
  5. Beygisangchin, M.; Rashid, S.A.; Shafie, S.; Sadrolhosseini, A.R.; Lim, H.N. Preparations, Properties, and Applications of Polyaniline and Polyaniline Thin Films—A Review. Polymers 2021, 13, 2003. [Google Scholar] [CrossRef] [PubMed]
  6. Chulkin, P.; Lapkowski, M. An Insight into Ionic Conductivity of Polyaniline Thin Films. Materials 2020, 13, 2877. [Google Scholar] [CrossRef] [PubMed]
  7. Al-Haidary, N.; Al-Mokaram, A.M.; Hussein, F.M.; Ismail, A.H. Development of polyaniline for sensor applications: A review. J. Phys. Conf. Ser. 2021, 1853, 012062. [Google Scholar] [CrossRef]
  8. Zhang, L.; Wang, B.; Li, L.; Xu, G.; Dou, S.; Zhang, X.; Chen, X.; Zhao, J.; Zhang, K.; Li, Y. Further understanding of the mechanisms of electrochromic devices with variable infrared emissivity based on polyaniline conducting polymers. J. Mater. Chem. C 2019, 7, 9878–9891. [Google Scholar] [CrossRef]
  9. Canales, M.; Torras, J.; Fabregat, G.; Meneguzzi, A.; Aleman, C. Polyaniline emeraldine salt in the amorphous solid state: Polaron versus bipolaron. J. Phys. Chem. B 2014, 118, 11552–11562. [Google Scholar] [CrossRef]
  10. Sanches, E.A.; Soares, J.C.; Iost, R.M.; Marangoni, V.S.; Trovati, G.; Batista, T.; Mafud, A.C.; Zucolotto, V.; Mascarenhas, Y.P. Structural Characterization of Emeraldine-Salt Polyaniline/Gold Nanoparticles Complexes. J. Nanomater. 2011, 2011, 697071. [Google Scholar] [CrossRef] [Green Version]
  11. Gilhotra, C.; Chander, M. A review: Conducting polyaniline polymer. AIP Conf. Proc. 2019, 2142, 150008. [Google Scholar] [CrossRef]
  12. Wang, Y.; Zhang, S.M.; Deng, Y. Flexible low-grade energy utilization devices based on high-performance thermoelectric polyaniline/tellurium nanorod hybrid films. J. Mater. Chem. A. 2016, 4, 3554–3559. [Google Scholar] [CrossRef]
  13. Nandihalli, N. Imprints of interfaces in thermoelectric materials. Crit. Rev. Solid State 2023, 48, 361–410. [Google Scholar] [CrossRef]
  14. Wang, L.; Yao, Q.; Shi, W.; Qu, S.; Chen, L. Engineering Carrier Scattering at the Interfaces in Polyaniline Based Nanocomposites for High Thermoelectric Performances. Mater. Chem. Front. 2017, 1, 741–748. [Google Scholar] [CrossRef]
  15. Wang, Y.; Yu, C.; Sheng, M.; Song, S.; Deng, Y. Individual Adjustment of Electrical Conductivity and Thermopower Enabled by Multiple Interfaces in Polyaniline-Based Ternary Hybrid Nanomaterials for High Thermoelectric Performances. Adv. Mater. Interfaces 2018, 5, 1701168. [Google Scholar] [CrossRef]
  16. Wang, Y.Y.; Cai, K.F.; Yin, J.L.; An, B.J.; Du, Y.; Yao, X. In situ fabrication and thermoelectric properties of PbTe—Polyaniline composite nanostructures. J. Nanopart. Res. 2011, 13, 533–539. [Google Scholar] [CrossRef]
  17. Mitra, M.; Kulsi, C.; Kargupta, K.; Ganguly, S.; Banerjee, D. Composite of polyaniline-bismuth selenide with enhanced thermoelectric performance. J. Appl. Polym. Sci. 2019, 135, 46887. [Google Scholar] [CrossRef]
  18. Li, Y.; Zhao, Q.; Wang, Y.-G.; Bi, K. Synthesis and characterization of Bi2Te3/polyaniline composites. Mat. Sci. Semiconduct. Proc. 2011, 14, 219–222. [Google Scholar] [CrossRef]
  19. Chatterjee, K.; Mitra, M.; Kargupta, K.; Ganguly, S.; Banerjee, D. Synthesis, characterization and enhanced thermoelectric performance of structurally ordered cable-like novel polyaniline-bismuth telluride nanocomposite. Nanotechnology 2013, 24, 215703. [Google Scholar] [CrossRef]
  20. Lesnichaya, M.V.; Zhmurova, A.V.; Sapozhnikov, A.N. Synthesis and Characterization of Water-Soluble Arabinogalactan-Stabilized Bismuth Telluride Nanoparticles. Russ. J. Gen. Chem. 2021, 91, 1379–1386. [Google Scholar] [CrossRef]
  21. Lesnichaya, M.V.; Zhmurova, A.V. Synthesis, structure, and spectral properties of ZnTe-containing nanocomposites based on arabinogalactan. Russ. J. Gen. Chem. 2022, 92, 1995–2004. [Google Scholar] [CrossRef]
  22. Sosedova, L.M.; Rukavishnikov, V.S.; Sukhov, B.G.; Borovskii, G.B.; Titov, E.A.; Novikov, M.A.; Vokina, V.A.; Yakimova, N.L.; Lesnichaya, M.V.; Kon’kova, T.V.; et al. Synthesis of Chalcogen-Containing Nanocomposites of Selenium and Tellurium with Arabinogalactan and a Study of Their Toxic and Antimicrobial Properties. Nanotechnol. Russ. 2018, 13, 290–294. [Google Scholar] [CrossRef]
  23. Cuccu, F.; De Luca, L.; Delogu, F.; Colacino, E.; Solin, N.; Mocci, R.; Porcheddu, A. Mechanochemistry: New Tools to Navigate the Uncharted Territory of “Impossible” Reactions. ChemSusChem 2022, 15, e202200362. [Google Scholar] [CrossRef] [PubMed]
  24. Nandihalli, N.; Gregory, D.H.; Mori, T. Energy-Saving Pathways for Thermoelectric Nanomaterial Synthesis: Hydrothermal/Solvothermal, Microwave-Assisted, Solution-Based, and Powder Processing. Adv. Sci. 2022, 9, 2106052. [Google Scholar] [CrossRef]
  25. Krusenbaum, A.; Grätz, S.; Tigineh, G.T.; Borchardt, L.; Kim, J.G. The mechanochemical synthesis of polymers. Chem. Soc. Rev. 2022, 51, 2873–2905. [Google Scholar] [CrossRef]
  26. Liu, X.; Li, Y.; Zeng, L.; Li, X.; Chen, N.; Bai, S.; He, H.; Wang, Q.; Zhang, C. A Review on Mechanochemistry: Approaching Advanced Energy Materials with Greener Force. Adv. Mater. 2022, in press. [CrossRef]
  27. Joy, J.; Krishnamoorthy, A.; Tanna, A.; Kamathe, V.; Nagar, R.; Srinivasan, S. Recent Developments on the Synthesis of Nanocomposite Materials via Ball Milling Approach for Energy Storage Applications. Appl. Sci. 2022, 12, 9312. [Google Scholar] [CrossRef]
  28. Zhao, X.B.; Hu, S.H.; Zhao, M.J.; Zhu, T.J. Thermoelectric properties of Bi0.5Sb1.5Te3/polyaniline hybrids prepared by mechanical blending. Mater. Lett. 2002, 52, 147–149. [Google Scholar] [CrossRef]
  29. Mott, N.F.; Davis, E.A. Electronic Process in Non-Crystalline Materials, 2nd ed.; Clarendon Press: Oxford, UK, 1979. [Google Scholar]
  30. Reda, S.M.; Al-Ghannam, S.M. Synthesis and Electrical Properties of Polyaniline Composite with Silver Nanoparticles. Adv. Mater. Phys. Chem. 2012, 2, 75–81. [Google Scholar] [CrossRef] [Green Version]
  31. Sutar, R.A.; Kumari, L.; Murugendrappa, M.V. Investigation of temperature-dependent conduction mechanism in MnCo2O4/polypyrrole nanocomposites by three-dimensional variable range hopping (3D-VRH) and band-conduction model. J. Appl. Phys. 2021, 130, 015112. [Google Scholar] [CrossRef]
  32. Bibi, A.; Shakoor, A.; Niaz, N.A.; Haider, S.; Akhtar, M.S. Electrical transport properties and thermoelectric power studies of polyaniline-CaTiO3 composites. Polym. Bull. 2022, in press. [CrossRef]
  33. Sutar, R.A.; Kumari, L.; Malalkere, M.V. Three-Dimensional Variable Range Hopping and Thermally Activated Conduction Mechanism of Polypyrrole/Zinc Cobalt Oxide Nanocomposites. J. Phys. Chem. C 2020, 124, 21772–21781. [Google Scholar] [CrossRef]
  34. Majeed, A.H.; Mohammed, L.A.; Hammoodi, O.G.; Sehgal, S.; Alheety, M.A.; Saxena, K.K.; Dadoosh, S.A.; Mohammed, I.K.; Jasim, M.M.; Salmaan, N.U. A Review on Polyaniline: Synthesis, Properties, Nanocomposites, and Electrochemical Applications. Int. J. Polym. Sci. 2022, 2022, 9047554. [Google Scholar] [CrossRef]
  35. Babel, V.; Hiran, B.L. A review on polyaniline composites: Synthesis, characterization, and applications. Polym. Compos. 2021, 42, 3142–3157. [Google Scholar] [CrossRef]
  36. Trchova, M.; Stejskal, J. Polyaniline: The infrared spectroscopy of conducting polymer nanotubes (IUPAC Technical Report). Pure App. Chem. 2011, 83, 1803–1817. [Google Scholar] [CrossRef]
  37. Manikandan, M.; Dhanuskodi, S.; Maheswari, N.; Muralidharan, G.; Revathi, C.; Rajendra Kumar, R.T.; Mohan Rao, G. High performance supercapacitor and non-enzymatic hydrogen peroxide sensor based on tellurium nanoparticles. Sens. Bio-Sens. Res. 2017, 13, 40–48. [Google Scholar] [CrossRef]
  38. Mamur, M.; Bhuiyan, M.R.A.; Korkmaz, F.; Nil, M. A review on bismuth telluride (Bi2Te3) nanostructure for thermoelectric applications. Renew. Sustain. Energy Rev. 2018, 82, 4159–4169. [Google Scholar] [CrossRef]
  39. Mandal, G.; Choudhary, R.B. MnO2 integrated emeraldine polyaniline (PANI-MnO2) nanocomposites with inflated opto-electricaltraitsas ETLs for OLED applications. Mater. Sci. Semiconduct. Proc. 2020, 151, 107000. [Google Scholar] [CrossRef]
  40. Rahim, M.; Shah, A.-U.-H.A.; Bilal, S.; Rahim, I.; Ullah, R. Highly Efficient Humidity Sensor Based on Sulfuric Acid Doped Polyaniline-Copper Oxide Composites. Iran. J. Sci. Technol. A. 2021, 45, 1981–1991. [Google Scholar] [CrossRef]
  41. Suk, J.S.; Xu, Q.; Kim, N.; Hanes, J.; Ensign, L.M. PEGylation as a strategy for improving nanoparticle-based drug and gene delivery. Adv. Drug Delivery Rev. 2016, 99, 28–51. [Google Scholar] [CrossRef] [Green Version]
  42. Chereches, M.; Bejan, D.; Chereches, E.I.; Alexandru, A.; Minea, A.A. An experimental study on electrical conductivity of several oxide nanoparticle enhanced PEG 400 fluid. Int. J. Thermophys. 2021, 42, 104. [Google Scholar] [CrossRef]
  43. Ahmed, H.T.; Jalal, V.J.; Tahir, D.A.; Mohamad, A.H.; Abdullah, O.G. Effect of PEG as a plasticizer on the electrical and optical properties of polymer blend electrolyte MC-CH-LiBF4 based films. Results Phys. 2019, 15, 102735. [Google Scholar] [CrossRef]
  44. Huang, K.; Yu, H.; Xie, M.; Liu, S.; Wu, F. Effects of poly (ethylene glycol)-grafted graphene on the electrical properties of poly (lactic acid) nanocomposites. RSC Adv. 2019, 9, 10599–10605. [Google Scholar] [CrossRef]
  45. Kireev, P.S. Physics of Semiconductors; Vysshaya Shkola: Moscow, Russia, 1975. [Google Scholar]
  46. Shalini, V.; Navaneethan, M.; Harish, S.; Archana, J.; Ponnusamy, S.; Ikeda, H.; Hayakawa, Y. Design and fabrication of PANI/GO nanocomposite for enhanced room-temperature thermoelectric application. Appl. Surf. Sci. 2019, 493, 1350–1360. [Google Scholar] [CrossRef]
  47. Debnath, A.; Deb, K.; Sarkar, K.; Saha, B. Improved Thermoelectric Performance in TiO2 Incorporated Polyaniline: A Polymer-Based Hybrid Material for Thermoelectric Generators. J. Electron. Mater. 2020, 49, 5028–5036. [Google Scholar] [CrossRef]
  48. Ponnuswamy, V.; Ashokan, S.; Jayamurugan, P.; Karthikeyani, D.; Rao, S.Y.V. Optical, thermal and morphological properties of PANI/P2O5 composites. Optik 2015, 126, 19–23. [Google Scholar] [CrossRef]
  49. Shambharkar, B.H.; Umare, S.S.; Rathod, R.C. Synthesis and Characterization of Polyaniline–Mn3O4 Nanocomposite: Electrical Conductivity and Magnetic Studies. Trans. Indian Inst. Met. 2014, 67, 827–834. [Google Scholar] [CrossRef]
  50. Debnath, A.; Deb, K.; Sarkar, K.; Saha, B. Low Interfacial Energy Barrier and Improved Thermoelectric Performance in Te-Incorporated Polypyrrole. J. Phys. Chem. C 2021, 125, 168–177. [Google Scholar] [CrossRef]
  51. Li, C.; Jiang, F.; Liu, C.; Wang, W.; Li, X.; Wang, T.; Xu, J. A simple thermoelectric device based on inorganic/organic composite thin film for energy harvesting. Chem. Eng. J. 2017, 320, 201–210. [Google Scholar] [CrossRef]
  52. Tsai, J.T.H.; Chiao, Y.T.; Zhang, Y.; Milne, W.I. Electric conduction improvement of well-structured multi-walled carbon nanotubes. In Proceedings of the TENCON 2010–2010 IEEE Region 10 Conference, Fukuoka, Japan, 21–24 November 2010; pp. 963–965. [Google Scholar] [CrossRef]
  53. Shumaila; Lakshmi, G.B.V.S.; Alam, M.; Siddiqui, A.M.; Zulfequar, M.; Husain, M. Synthesis and characterization of Se doped polyaniline. Curr. Appl. Phys. 2011, 11, 217–222. [Google Scholar] [CrossRef]
  54. Madhuri, S.N.; Murugendrappa, M.V.; Rukmani, K. Conduction and relaxation mechanisms in gadolinium oxide nanoparticle doped polyvinyl alcohol films. Mater. Today Commun. 2020, 23, 100942. [Google Scholar] [CrossRef]
  55. Morad, I.; Ali, H.E.; Wasfy, M.H.; Mansour, A.F.; El-Desoky, M.M. Effect of the biphase TiO2 nanoparticles on the dielectric and polaronic transport properties of PVA nanocomposite: Structure analysis and conduction mechanism. Vacuum 2020, 181, 109735. [Google Scholar] [CrossRef]
  56. Manika, G.C.; Psarras, G.C. SrTiO3/Epoxy Nanodielectrics as Bulk Energy Storage and Harvesting Systems: The Role of Conductivity. ACS Appl. Energy Mater. 2020, 3, 831–842. [Google Scholar] [CrossRef] [Green Version]
  57. Shanthala, V.S.; Shobha Devi, S.N.; Murugendrappa, M.V. Synthesis, characterization and DC conductivity studies of polypyrrole/copper zinc iron oxide nanocomposites. J. Asian Ceram. Soc. 2017, 5, 227–234. [Google Scholar] [CrossRef] [Green Version]
  58. Abdullah, O.G.; Salman, Y.A.K.; Saleem, S.A. Electrical conductivity and dielectric characteristics of in situ prepared PVA/HgS nanocomposite films. J. Mater. Sci. Mater. El. 2016, 27, 3591–3598. [Google Scholar] [CrossRef]
  59. Bibi, A.; Shakoor, A. Charge transport mechanism in dodecylbenzenesulfonic acid doped polyaniline/carbon black composites. Polym. Polym. Compos. 2021, 29 (Suppl. S9), S1044–S1051. [Google Scholar] [CrossRef]
  60. Imani, A.; Farzi, G. Low temperature process of electronic charge transport mechanism in PANi/MWCNT nanocomposites: Tubular morphology. J. Mater. Sci. Mater. Electron. 2017, 28, 10684–10692. [Google Scholar] [CrossRef]
  61. Nandapure, B.I.; Kondawar, S.B.; Salunkhe, M.Y.; Nandapure, A.I. Magnetic and transport properties of conducting polyaniline/nickel oxide nanocomposites. Adv. Mater. Lett. 2013, 4, 134–140. [Google Scholar] [CrossRef]
  62. Zafar, S.; Rizvi, T.Z. Study of Structural, Thermal and Electrical Properties of Functionalized Multiwalled Carbon Nanotubes-Polyaniline Composites. Polym. Sci. Ser. B 2022, 64, 573–580. [Google Scholar] [CrossRef]
  63. Gu, H.; Huang, Y.; Zhang, X.; Wang, Q.; Zhu, J.; Shao, L.; Haldolaarachchige, N.; Young, D.P.; Wei, S.; Guo, Z. Magnetoresistive polyaniline-magnetite nanocomposites with negative dielectrical properties. Polymer 2012, 53, 801–809. [Google Scholar] [CrossRef]
  64. Kshirsagar, A.S.; Hiragond, C.; Dey, A.; More, P.V.; Khanna, P.K. Band Engineered I/III/V–VI Binary Metal Selenide/MWCNT/PANI Nanocomposites for Potential Room Temperature Thermoelectric Applications. ACS Appl. Energy Mater. 2019, 2, 2680–2691. [Google Scholar] [CrossRef]
Figure 1. Scheme of mechanochemical synthesis of ES-PANI-based Te0 and Bi2Te3 nanocomposites.
Powders 02 00034 g001
Figure 2. IR spectra of the studied samples: (a) ES-PANI; (b) Te0 and Bi2Te3-containing composites based on ES-PANI obtained by mechanochemical method with different contents of inorganic phase and XRD patterns for (c) ES-PANI/Te0 (4.4 wt% Te0) and (d) ES-PANI/Bi2Te3 (2.9 wt% Bi2Te3) nanocomposites.
Powders 02 00034 g002
Figure 3. UV-Vis spectra of ES-PANI, ES-PANI/Te0 (10.2 wt% Te0) and ES-PANI/Bi2Te3 (7.3 wt% Bi2Te3).
Powders 02 00034 g003
Figure 4. (a) Direct current electrical conductivity dependence on temperature, (b) Arrhenius plot, (c) VRH plot for ES-PANI, ES-PANI/Te0 (2.1, 4.4, 10.2 wt% Te0) and ES-PANI/Bi2Te3 (1.5, 2.9, 7.3 wt% Bi2Te3).
Powders 02 00034 g004
Figure 5. Effect of inorganic nanophase weight content on DC conductivity for (a) ES-PANI/Te0, (b) ES-PANI/Bi2Te3, (c) ES-PANI/Te0-MWCNT, (d) ES-PANI/Bi2Te3-MWCNT nanocomposites (1.5 wt% MWCNT).
Powders 02 00034 g005
Figure 6. The p-p and p-n (n-p) junctions occurring in (a) ES-PANI/Te0, (b) ES-PANI/Bi2Te3, (c) ES-PANI/Te0-MWCNT, (d) ES-PANI/Bi2Te3-MWCNT nanocomposites.
Powders 02 00034 g006
Figure 7. Dependence of E a and T 0 on inorganic nanophase content for (a) ES-PANI/Te0, (b) ES-PANI/Bi2Te3, (c) ES-PANI/Te0-MWCNT, (d) ES-PANI/Bi2Te3-MWCNT.
Powders 02 00034 g007
Figure 8. DC electrical conductivity dependence on temperature for (af) ES-PANI, ES-PANI-MWCNT, (ac) ES-PANI/Te0, ES-PANI/Te0-MWCNT, (df) ES-PANI/Bi2Te3, ES-PANI/Bi2Te3-MWCNT nanocomposites with different weight content of inorganic nanophase (1.5 wt% MWCNT).
Powders 02 00034 g008
Figure 9. Arrhenius plot for (a) ES-PANI-MWCNT and ES-PANI/Te0-MWCNT, (b) ES-PANI-MWCNT and ES-PANI-Bi2Te3-MWCNT nanocomposites (1.5 wt% MWCNT) with different inorganic nanophase content; VRH plot for (c) ES-PANI-MWCNT and ES-PANI/Te0-MWCNT, (d) ES-PANI-MWCNT and ES-PANI-Bi2Te3-MWCNT nanocomposites (1.5 wt% MWCNT) with different inorganic nanophase content.
Powders 02 00034 g009
Table 1. Arrhenius model parameters for ES-PANI and ES-PANI-based nanocomposites. Note: E a : activation energy; σ 0 : pre-exponential factor; R2: determination coefficient.
Sample E a (eV) σ 0 (S/cm) R2
ES-PANI0.23992.760.9637
ES-PANI/Te0
(2.1 wt% Te0)
0.1712.440.9503
ES-PANI/Te0
(4.4 wt% Te0)
0.21016.280.9502
ES-PANI/Te0
(10.2 wt% Te0)
0.169 6.11 0.9691
ES-PANI/Bi2Te3
(1.5 wt% Bi2Te3)
0.2205.750.9657
ES-PANI/Bi2Te3
(2.9 wt% Bi2Te3)
0.1985.370.9524
ES-PANI/Bi2Te3
(7.3 wt% Bi2Te3)
0.157 1.77 0.9696
Table 2. Mott’s VRH model parameters for PANI and PANI-based nanocomposites. Note: T 0 : characteristic temperature; σ 0 : pre-exponential factor; R2: determination coefficient; N(EF): density of states at Fermi level; RH: average hopping distance, W: average hopping energy.
Sample T 0 (K) σ 0 (S/cm) R2N(EF) (eV−1 cm−3)
T = 300 K
RH (cm)
T = 300 K
W (eV)
T = 300 K
ES-PANI4.44 × 1081.28 × 10130.96890.53 × 101810.26 × 10−70.23
ES-PANI/Te0
(2.1 wt% Te0)
1.13 × 1082.14 × 1080.95642.09 × 10188.93 × 10−70.16
ES-PANI/Te0
(4.4 wt% Te0)
2.63 × 1089.53 × 10100.95640.90 × 101810.10 × 10−70.20
ES-PANI/Te0
(10.2 wt% Te0)
1.10 × 1084.39 × 1080.97402.15 × 10188.87 × 10−70.16
ES-PANI/Bi2Te3
(1.5 wt% Bi2Te3)
3.17 × 1081.14 × 10110.97080.75 × 101810.16 × 10−70.21
ES-PANI/Bi2Te3
(2.9 wt% Bi2Te3)
2.07 × 1088.56 × 1090.95841.14 × 101810.39 × 10−70.19
ES-PANI/Bi2Te3
(7.3 wt% Bi2Te3)
0.83 × 1083.75 × 1070.97442.85 × 10188.27 × 10−70.15
Table 3. Arrhenius model parameters for ES-PANI-MWCNT, ES-PANI/Te0-MWCNT, ES-PANI/Bi2Te3-MWCNT nanocomposites (1.5 wt% MWCNT). Note: E a : activation energy; σ 0 : pre-exponential factor; R2: determination coefficient.
Sample E a (eV) σ 0 (S/cm) R2
ES-PANI-MWCNT0.16620.410.9987
ES-PANI/Te0-MWCNT
(2.1 wt% Te0)
0.19618.360.9648
ES-PANI/Te0-MWCNT
(4.4 wt% Te0)
0.21529.960.9629
ES-PANI/Te0-MWCNT
(10.2 wt% Te0)
0.19328.220.9800
ES-PANI/Bi2Te3-MWCNT
(1.5 wt% Bi2Te3)
0.260336.370.9005
ES-PANI/Bi2Te3-MWCNT
(2.9 wt% Bi2Te3)
0.20437.640.9942
ES-PANI/Bi2Te3-MWCNT
(7.3 wt% Bi2Te3)
0.20384.770.9940
Table 4. Mott’s VRH model parameters for ES-PANI-MWCNT, ES-PANI/Te0-MWCNT, ES-PANI/Bi2Te3-MWCNT nanocomposites (1.5 wt% MWCNT). Note: T 0 : characteristic temperature; σ 0 : pre-exponential factor; R2: determination coefficient; N(EF): the density of states at Fermi level; RH: average hopping distance; W: the average hopping energy.
Sample T 0 (K) σ 0 (S/cm) R2N(EF) (eV−1 cm−3)
T = 300 K
RH (cm)
T = 300 K
W (eV)
T = 300 K
ES-PANI-MWCNT1.00 × 1049.58 × 1080.99752.36 × 10228.66 × 10−81.55 × 10⁻²
ES-PANI/Te0-MWCNT
(2.1 wt% Te0)
1.42 × 1042.52 × 10100.96991.66 × 10229.46 × 10−81.70 × 10⁻²
ES-PANI/Te0-MWCNT
(4.4 wt% Te0)
1.71 × 1043.23 × 10110.96821.38 × 10229.91 × 10−81.78 × 10⁻²
ES-PANI/Te0-MWCNT
(10.2 wt% Te0)
1.37 × 1042.65 × 1010 0.98381.72 × 10229.37 × 10−81.68 × 10⁻²
ES-PANI/Bi2Te3-MWCNT
(1.5 wt% Bi2Te3)
2.44 × 1043.13 × 10140.86160.97 × 102210.83 × 10−81.94 × 10⁻²
ES-PANI/Bi2Te3-MWCNT
(2.9 wt% Bi2Te3)
1.52 × 1041.07 × 10110.99181.55 × 10229.62 × 10−81.73 × 10⁻²
ES-PANI/Bi2Te3-MWCNT
(7.3 wt% Bi2Te3)
1.50 × 10⁴ 2.16 × 10¹¹ 0.9915 1.57 × 10229.59 × 10−81.72 × 10⁻²
Disclaimer/Publisher’s Note: The statements, opinions and data contained in all publications are solely those of the individual author(s) and contributor(s) and not of MDPI and/or the editor(s). MDPI and/or the editor(s) disclaim responsibility for any injury to people or property resulting from any ideas, methods, instructions or products referred to in the content.

