Article

Comparison Link Function from Summer Rainfall Network in Amazon Basin

by
C. Arturo Sánchez P.
1,
Alan J. P. Calheiros
1,
Sâmia R. Garcia
2,* and
Elbert E. N. Macau
2
1
National Institute for Space Research (INPE), São José dos Campos, São Paulo 12227-010, Brazil
2
Federal University of São Paulo (UNIFESP), São José dos Campos, São Paulo 09972-270, Brazil
*
Author to whom correspondence should be addressed.
Meteorology 2023, 2(4), 530-546; https://doi.org/10.3390/meteorology2040030
Submission received: 15 October 2023 / Revised: 23 November 2023 / Accepted: 11 December 2023 / Published: 13 December 2023
(This article belongs to the Special Issue Early Career Scientists' (ECS) Contributions to Meteorology (2023))

Abstract

:
The Amazon Basin is the largest rainforest in the world, and studying the rainfall in this region is crucial for understanding the functioning of the entire rainforest ecosystem and its role in regulating the regional and global climate. This work is part of the application of complex networks, which refer to a network modeled by graphs and are characterized by their high versatility, as well as the extraction of key information from the system under study. The main objective of this article is to examine the precipitation system in the Amazon basin during the austral summer. The networks are defined by nodes and connections, where each node represents a precipitation time series, while the connections can be represented by different similarity functions. For this study, three rainfall networks were created, which differ based on the correlation function used (Pearson, Spearman, and Kendall). By comparing these networks, we can identify the most effective method for analyzing the data and gain a better understanding of rainfall’s spatial structure, thereby enhancing our knowledge of its impact on different Amazon basin regions. The results reveal the presence of three important regions in the Amazon basin. Two areas were identified in the northeast and northwest, showing incursions of warm and humid winds from the oceans and favoring the occurrence of large mesoscale systems, such as squall lines. Additionally, the eastern part of the central Andes may indicate an outflow region from the basin with winds directed toward subtropical latitudes. The networks showed a high level of activity and participation in the center of the Amazon basin and east of the Andes. Regarding information transmission, the betweenness centrality identified the main pathways within a basin, and some of these are directly related to certain rivers, such as the Amazon, Purus, and Madeira. Indicating the relationship between rainfall and the presence of water bodies. Finally, it suggests that the Spearman and Kendall correlation produced the most promising results. Although they showed similar spatial patterns, the major difference was found in the identification of communities, this is due to the meridional differences in the network’s response. Overall, these findings highlight the importance of carefully selecting appropriate techniques and methods when analyzing complex networks.

1. Introduction

Rainfall is crucial for human development, supporting agriculture, water supply, hydroelectric energy generation, and other industrial and economic activities. The availability, intensity, and distribution of rainfall directly influence the resilience and sustainability of society at large. Understanding the dynamics of precipitation systems becomes even more critical when it comes to assessing the potential for extreme events and comprehending their origins, development, and potential impacts. This knowledge is crucial for predicting and mitigating adverse effects like extreme rainfall events. Extreme events, serving as natural responses to atmospheric disturbances, have a vital function in regulating Earth’s climate through various physical and thermodynamic mechanisms [1,2]. Therefore, the investigation of atmospheric mechanisms and their influence on precipitation is crucial, especially in regions where multiple such mechanisms are present, as is the case in South America. One notable region is the Amazon Basin, renowned for its immense biodiversity, ecological significance, and crucial role in global climate regulation [3]. This tropical rainforest generates a substantial portion of the world’s oxygen and absorbs significant amounts of carbon dioxide, thereby mitigating the impact of climate change [4,5]. Through evapotranspiration, the Amazon Basin significantly contributes to local and regional precipitation patterns. Preserving this vital ecosystem is intrinsically linked to maintaining rainfall patterns, with cascading effects on the surrounding regions.
Given the importance of the Amazon Basin, this study employed complex networks as the method to analyze rainfall. A complex network is a powerful mathematical and computational tool based on graph theory, utilized for studying complex systems. In this context, a network is a representation of interconnected elements, often referred to as nodes, with links or edges connecting them. Nodes symbolize individual entities, while links describe the relationships, interactions, or connections between them. It is crucial to note that not every network qualifies as a complex network; rather, complex networks exhibit specific non-trivial statistical and topological properties absent in simple networks [6].
Due to their high application versatility, we could find complex networks in various disciplines. In Meteorology, the nodes normally represent a time series of different variables like geopotential height 500 hPa [7,8], moisture flux [9], rainfall [10,11,12], drought [13], extreme rainfall [14,15,16], sea level pressure [17], sea surface temperature [8,18,19] and wind components [20], and others [21,22]. In relation to the connections between nodes (edges), we can use different similarity functions, which may vary depending on the analysis objectives and the nature of the data. For example, Pearson correlation coefficient [10], cross-correlation [23,24], Spearman’s rank correlation [9], Kendall’s rank correlation [17], mutual information [25], event synchronization [26], reconstructed vectors in the phase space [12], and time warp edit distance [27]. Each of these similarity functions offers a unique perspective on the relationships between nodes and can provide relevant information about climate dynamics and patterns in the network. Complex networks have yielded significant results, particularly in understanding atmospheric teleconnections [14,28,29] and monsoon systems [16,26,30,31]. By examining the system’s behavior and the transmission of information in response to disturbances, complex networks provide valuable insights associated with its connections [20,32]. Additionally, the identification of groups that exhibit similar behaviors and possess strong internal links [33,34,35]. There are also different studies of complex networks applied to obtain a better understanding of the precipitating system [14,36].
The main objective of this work is to compare three networks constructed from daily summer rainfall data in the Amazon Basin. The networks are defined by different correlation functions (Pearson, Spearman, and Kendall) employed to establish connections between the nodes. The aim is to conduct a comparative analysis of the results. Finally, in addition to extracting key information about the precipitation patterns in the Amazon Basin, we could determine which of these networks yielded the most robust results by comparing the index and communities. Analyzing these aspects allows us to understand how each network represents precipitation dynamics. These insights can prove valuable in various fields, including meteorological modeling, hydrology, weather/climate forecasting, and the identification of suitable areas for installing new rain gauges. This paper is structured as follows: Section 2.1 introduces the study area, Section 2.2 presents the dataset used in this work, and Section 2.3 outlines the method employed for network construction, similarity functions, measures, correction, and analysis. Section 3 contains the study’s results, and finally, Section 4 is dedicated to the conclusion.

2. Materials and Methods
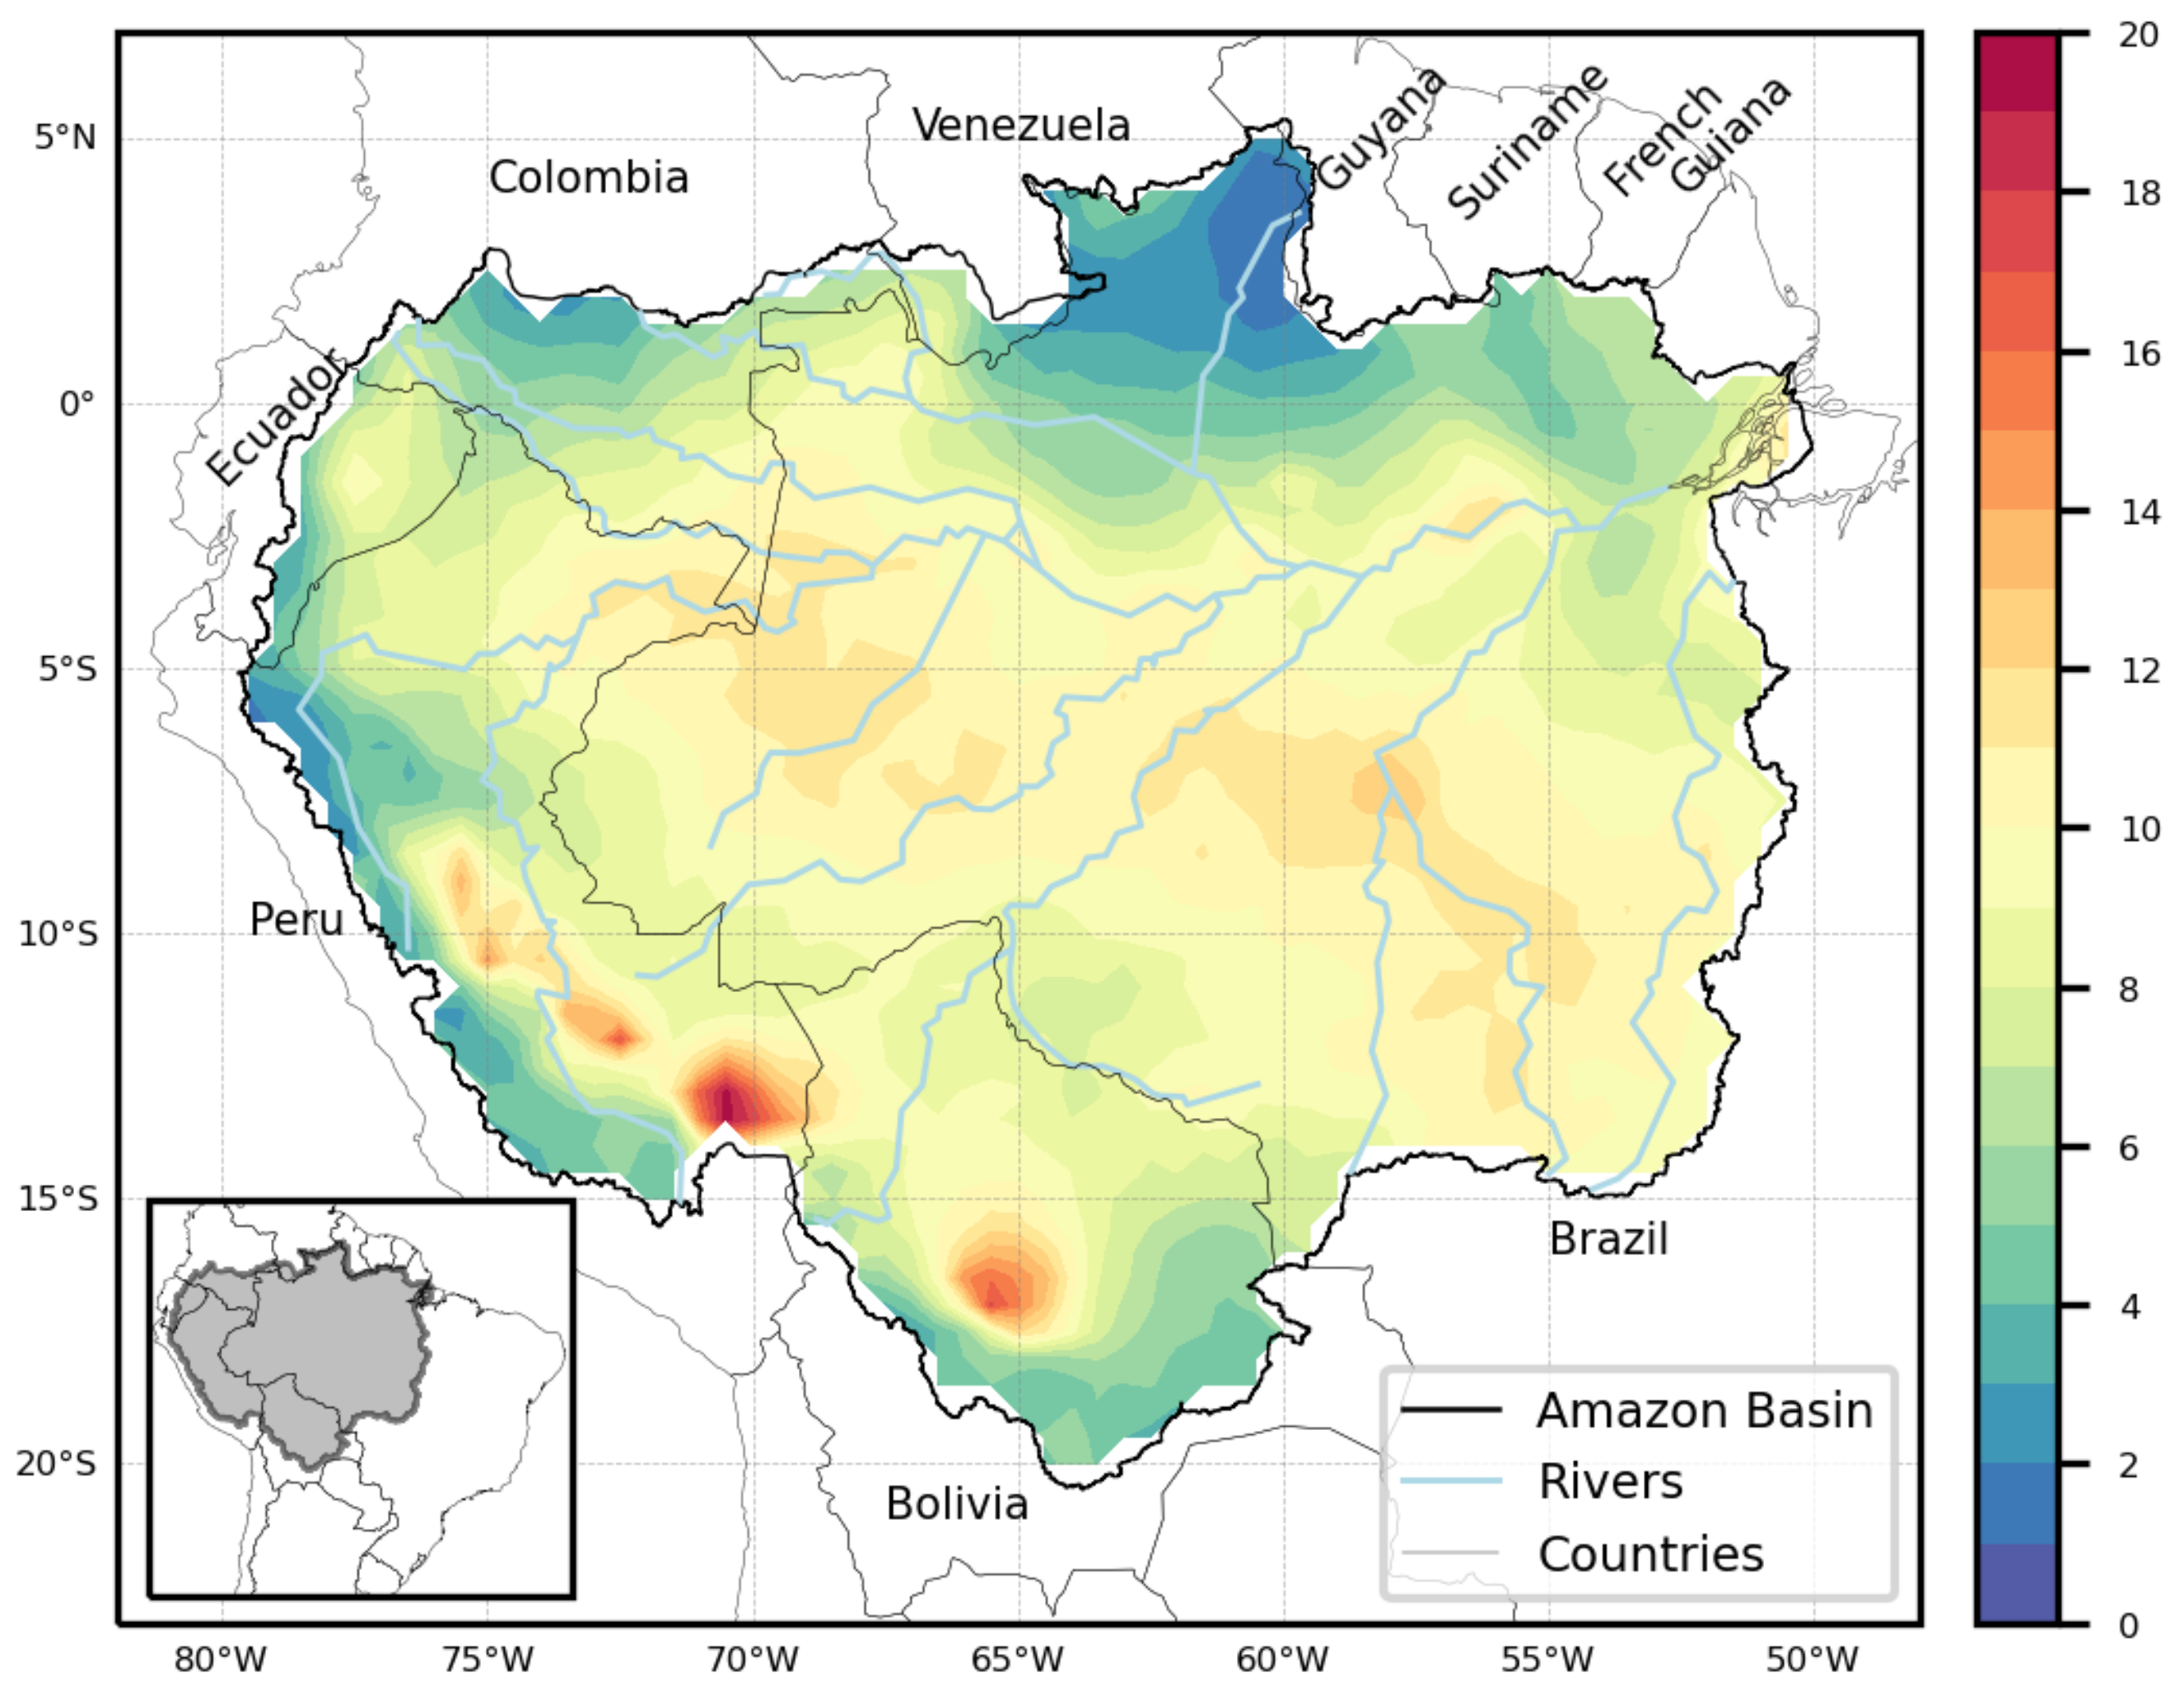
2.1. Study Region

The Amazon Basin (Figure 1) is known as the largest tropical forest and hydrological system in the world [37]. This region, encompassing approximately 6 million km 2 , extends over parts of Bolivia, Brazil, Colombia, Ecuador, Guyana, Peru, Suriname, and Venezuela. It is renowned for being an indispensable source of heat exchange with the atmosphere, particularly due to the high rate of evapotranspiration and providing humidity, which creates favorable conditions for the formation of tropical and extratropical convective systems, playing a crucial role in regional circulation [38,39,40,41]. The Amazon Basin also exhibits similarities with oceanic convection [42] and holds significant importance in various aspects, such as global/regional climate regulation, modulation of the hydrological cycle, and water purification [43,44,45].

2.2. Data

The Integrated Multi-satellitE Retrievals for GPM (IMERG) is a product resulting from the combination of the Tropical Rainfall Measuring Mission (TRMM) and the Global Precipitation Measurement Mission (GPM). It plays a crucial role in the analysis and retrieval of precipitation data, offering valuable information about rainfall patterns and distribution on a global scale [46]. We used the Final Precipitation L3 daily product from IMERG, where the rainfall rate in this product is represented in millimeters per day (mm/day), and it has a native spatial resolution of 0.1 . However, for computational limits, the spatial resolution was downgraded to 0.5 . For this work, the non-rainfall day is defined as any value below 1 mm/day [47,48]. The data period used is from December 2000 through February 2021, using only the austral summer months (December, January, and February).

2.3. Networks Construction

A functional climate network is composed of a set of nodes that represent a time series of a specific climatic variable (temperature, rainfall, pressure, wind component, etc.) and are embedded on the Earth’s surface position (latitude, longitude) and the presence or absence of connection between nodes, called edges [49]. In this study, each node in the network is represented by a daily summer rainfall series (mm/day) associated with latitude and longitude coordinates corresponding to each point on the 0.5 spatial IMERG grid. The Pearson, Spearman, and Kendall correlations used to define the three precipitation networks are commutative, indicating that the correlation between nodes i and j is the same as between j and i. As a result, undirected networks were obtained, allowing the identification of differences within these networks.

2.3.1. Similarity Functions

The rainfall networks were constructed using daily precipitation time series. We created three different networks using Pearson, Spearman, and Kendall correlations, because the comparison of the results allows us to assess how each metric responds to the dynamics of precipitation. Therefore, sensitivity analysis helps in identifying which correlation function is more robust or suitable for capturing patterns present in the rainfall data. By evaluating the performance of these correlation functions, we gain insights into their strengths and limitations, enabling us to make informed decisions about the most appropriate metric for our study and improve the reliability and interpretability of our results.
The Pearson correlation coefficient, also known simply as Pearson correlation, is a statistical measure that evaluates the linear relationship between two continuous variables and is widely used to assess the strength and direction of this relationship. This metric is defined as follows:
r = ( X i X ¯ ) ( Y i Y ¯ ) ( X i X ¯ ) 2 ( Y i Y ¯ ) 2
where X i and Y i are the individual values of variables X and Y, respectively, while X ¯ e Y ¯ are the means of each series. It should be noted that Pearson correlation is a parametric technique. This means that it assumes a specific distribution for the variables involved, in this case, a normal distribution. Applying Pearson correlation to data that does not follow a normal distribution can compromise the interpretation and introduce artificial bias into the results. In the case of rainfall times series, this often does not follow a normal distribution, which can lead to an inadequate interpretation. To address this issue, the methodology proposed by Ciemer et al. [11] was used. It allows for reducing artificial bias and obtaining a more accurate estimate of the Pearson correlation between variables such as precipitation.
Spearman’s correlation or Spearman’s rho, is a non-parametric statistical measure for assessing the linear relationship between two variables. Spearman’s rho considers the monotonic relationship between variables, meaning that one variable consistently increases or decreases with the other regardless of the shape of the relationship. Similar to Pearson’s correlation, Spearman has a range from −1 to 1, and is defined as follows:
r s = 1 i = 1 t ( a i b i ) 2 n ( n 2 1 )
where a i and b i are the ranks of x e y, respectively, while n is the number of observations. This correlation is based on the ranking of the variables, as each variable is individually ranked and then the differences between these rankings are calculated to capture non-linear relationships.
Kendall’s correlation is also a non-parametric statistical measure used to assess the relationship between two ordinal variables. Similar to Spearman’s correlation, Kendall’s correlation is based on the ranks of the observations for each variable. This measures the agreement between the rankings of the two variables, indicating whether the observations tend to have a consistent order between the variables. Kendall’s correlation does not assume any specific functional relationship between the variables, making it suitable for capturing non-linear and monotonic relationships. Kendall’s correlation is computed based on the number of concordant and discordant pairs, which are defined according to the following conditions. A pair is considered concordant if x i > x j and y i > y j or x i < x j and y i < y j . A pair is considered discordant if x i > x j and y i < y j or x i < x j and y i > y j . Otherwise, the pair is neither concordant nor discordant. Kendall’s correlation coefficient is defined as:
τ k = N C N D n ( n 1 ) / 2
where N C and N D are the numbers of concordant and discordant pairs, respectively, while n is the number of observations. Like Pearson and Spearman, Kendall’s correlation ranges from −1 to 1, where +1 indicates a perfect concordance between the rankings, −1 indicates a perfect discordance, and 0 represents no concordance.

2.3.2. Adjacency Matrix

Once the similarity functions for the rainfall networks have been defined, the next step is to calculate the connections between all pairs of vertices, resulting in an N × N connectivity matrix. After calculating the correlations between all possible vertex combinations, a threshold was set to define the strongest connections. This threshold defined as the minimum link value (MLV) was determined using the 98th percentile of the connections [50], and this criterion was applied to all networks. Values equal to or above this MLV are classified as 1, while values below are classified as 0. Thus, the resulting network contains only the strongest connections (2% of the total). It is important to note that self-loops, represented by the main diagonal of the adjacency matrix, are excluded.

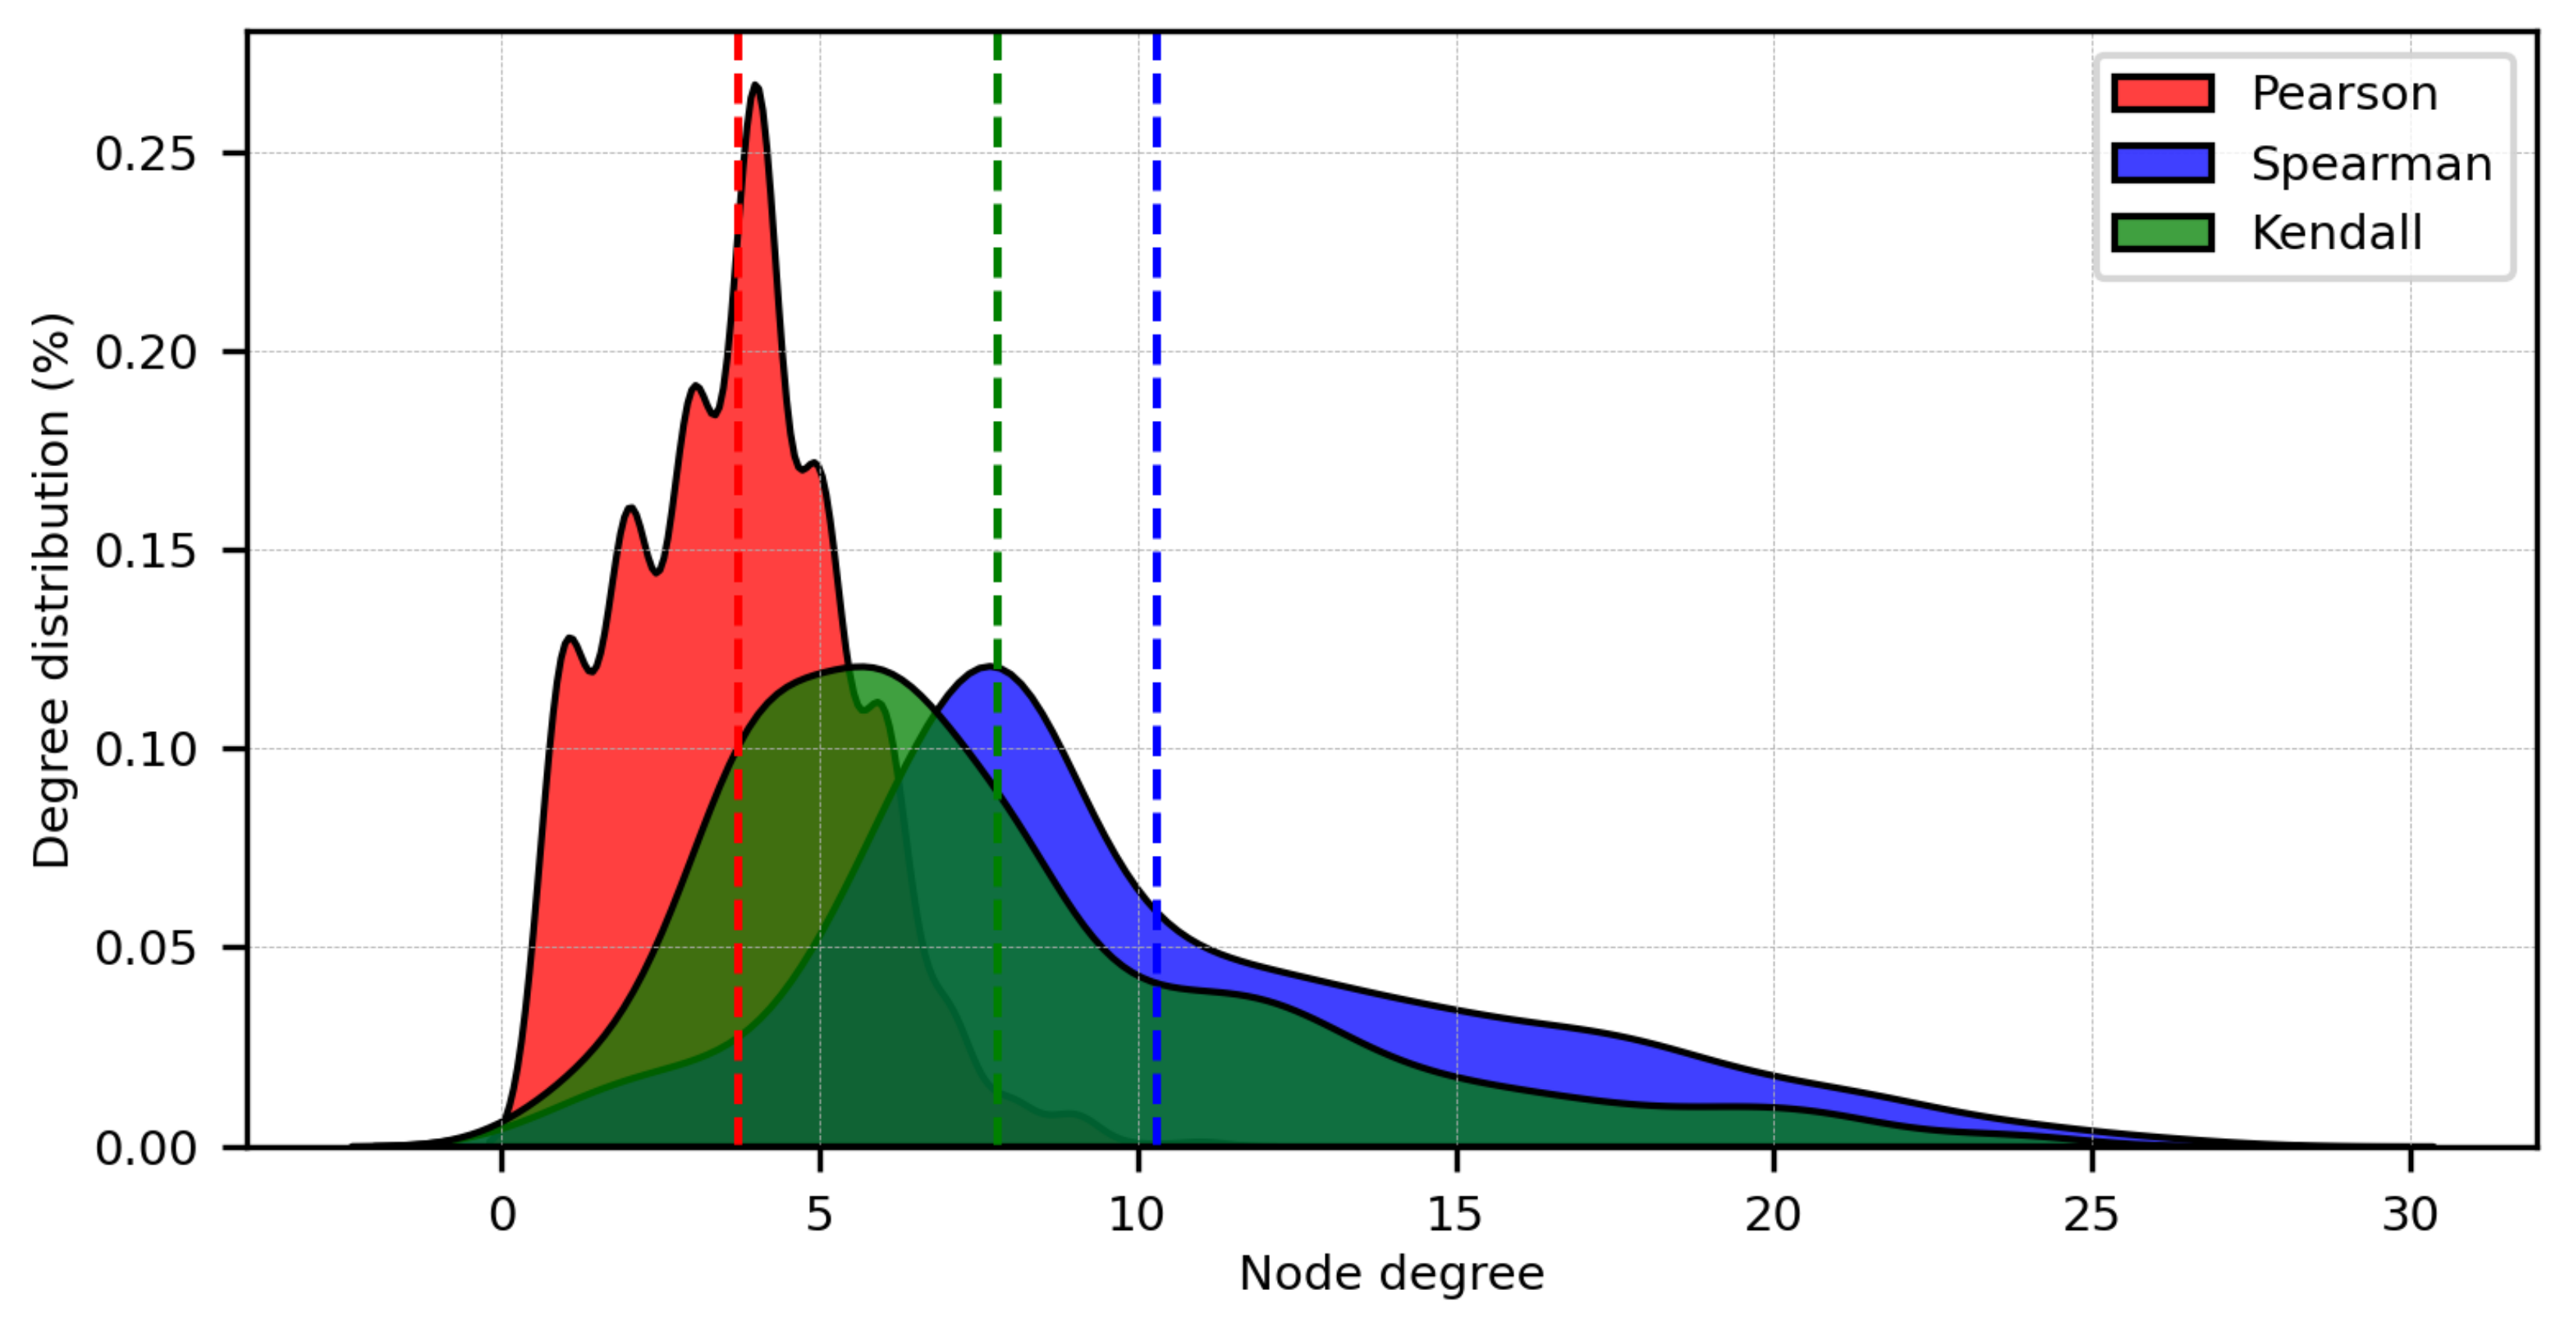
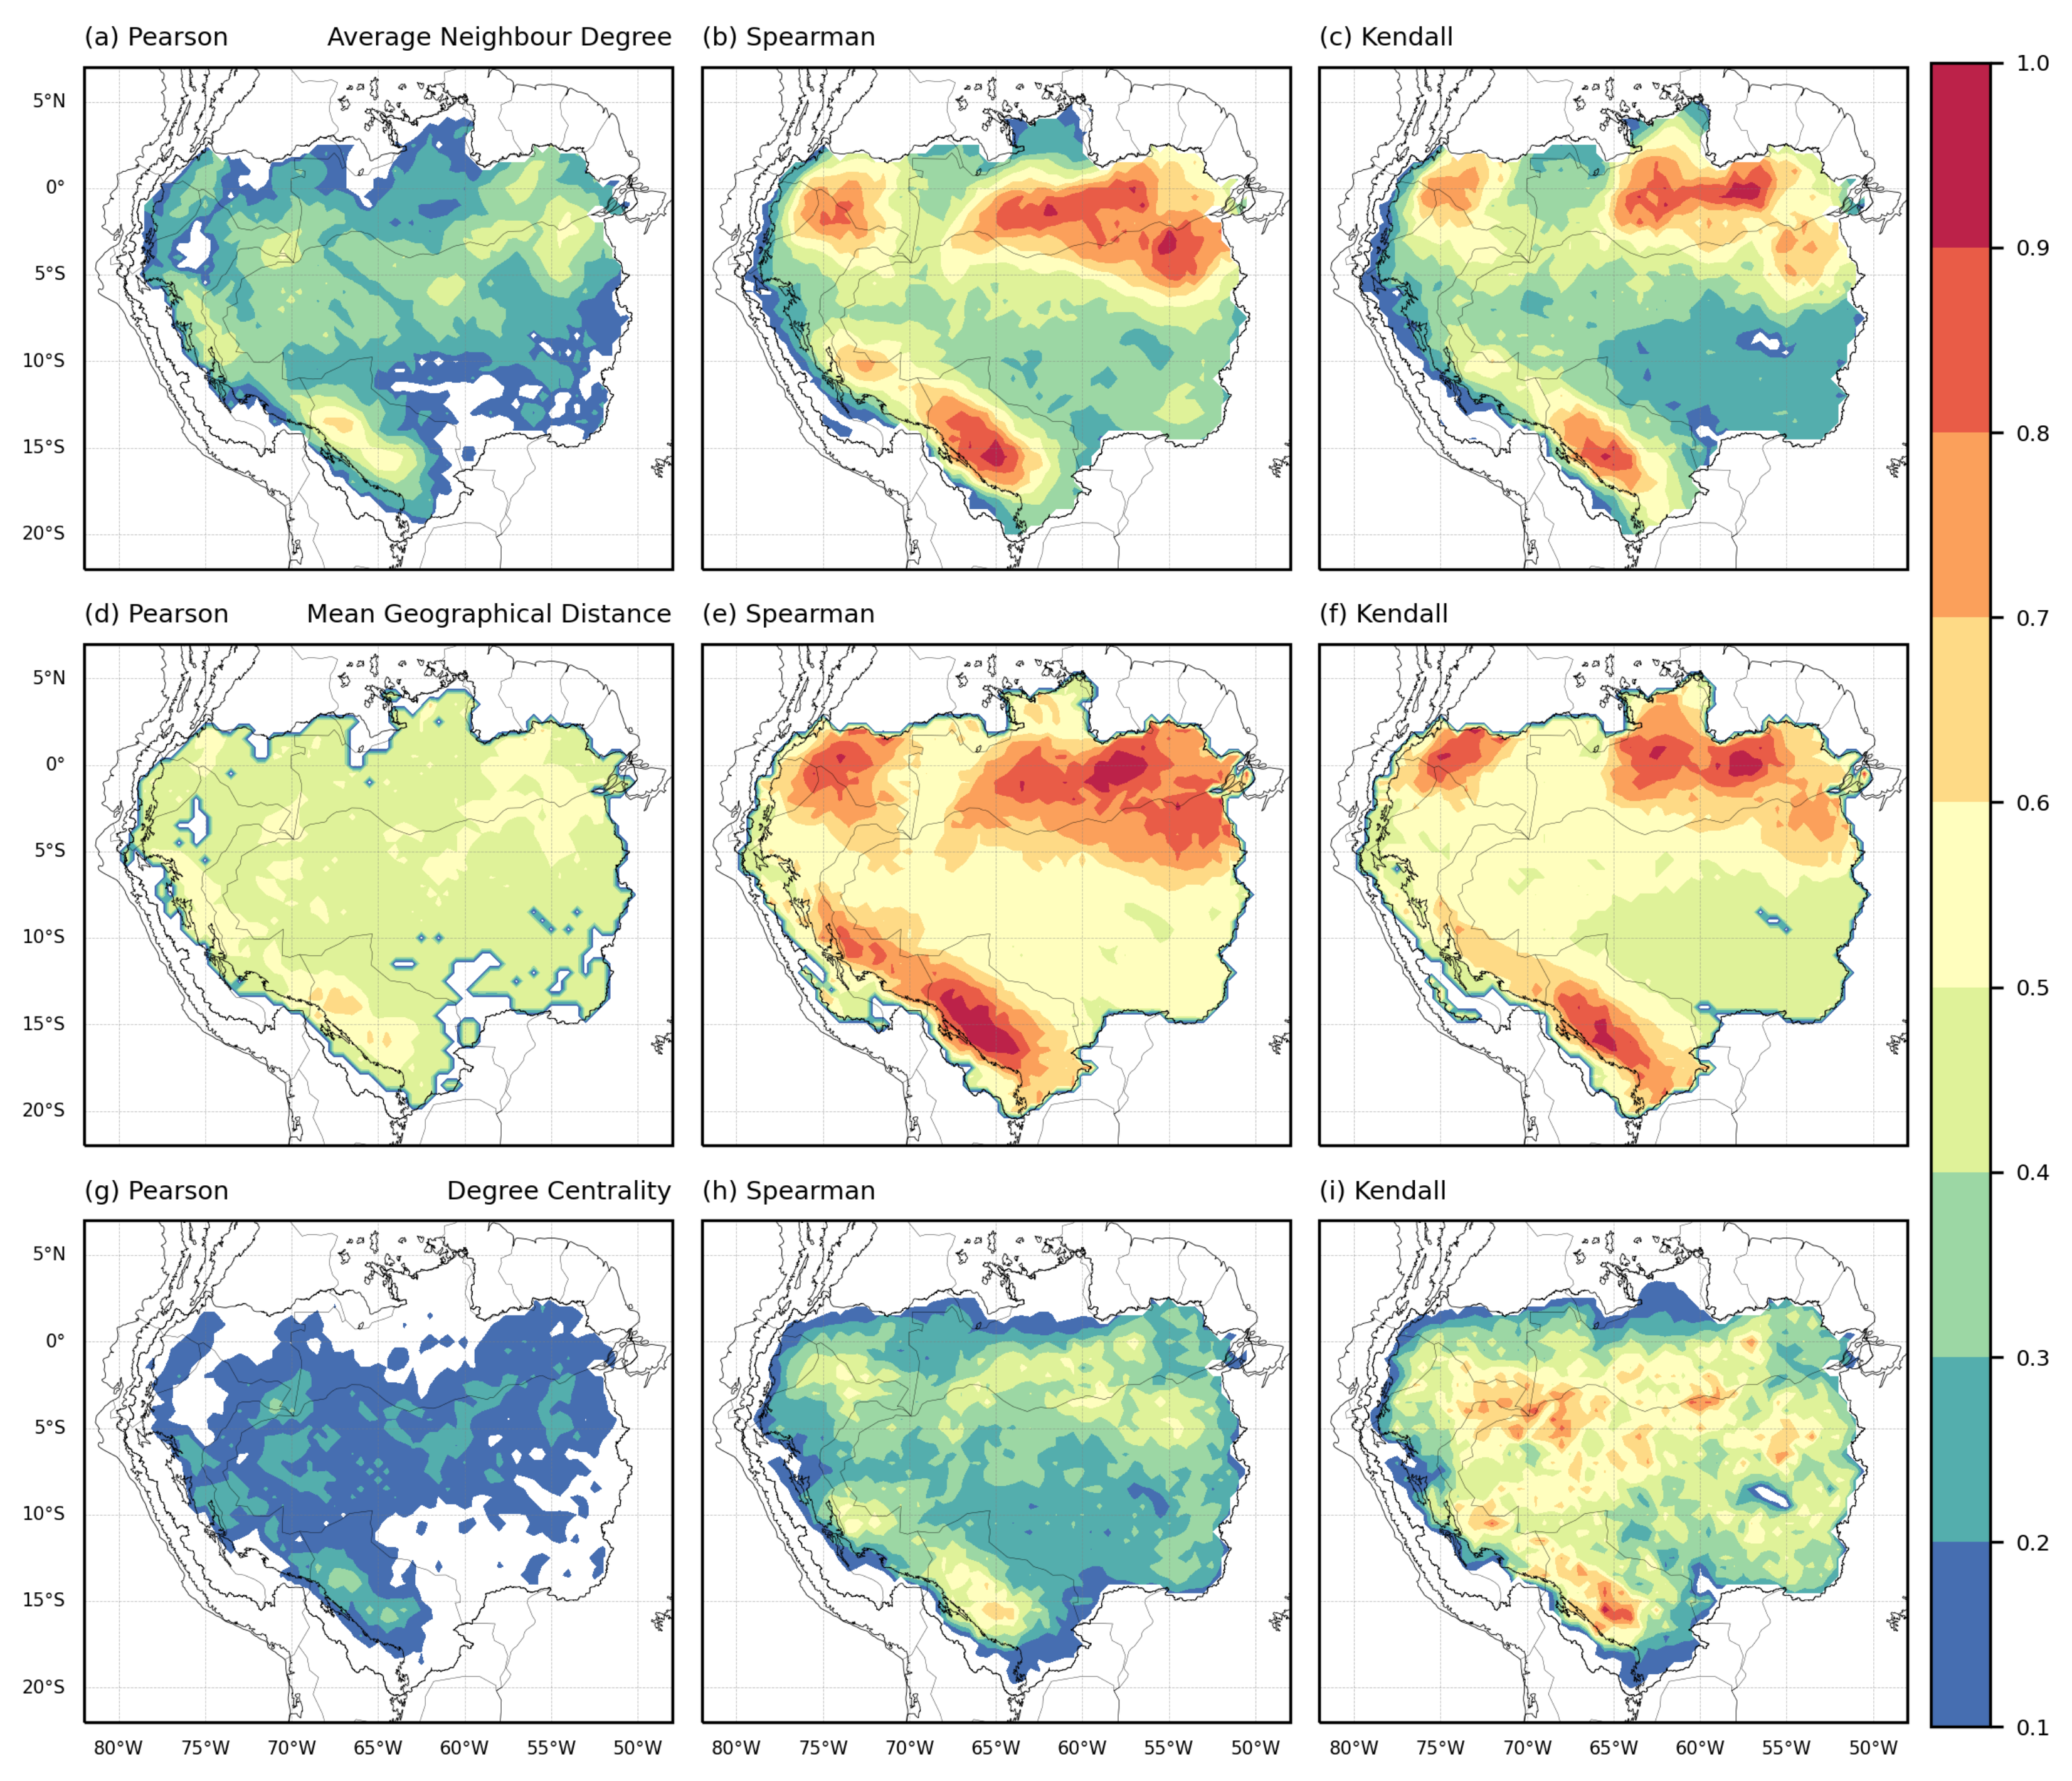
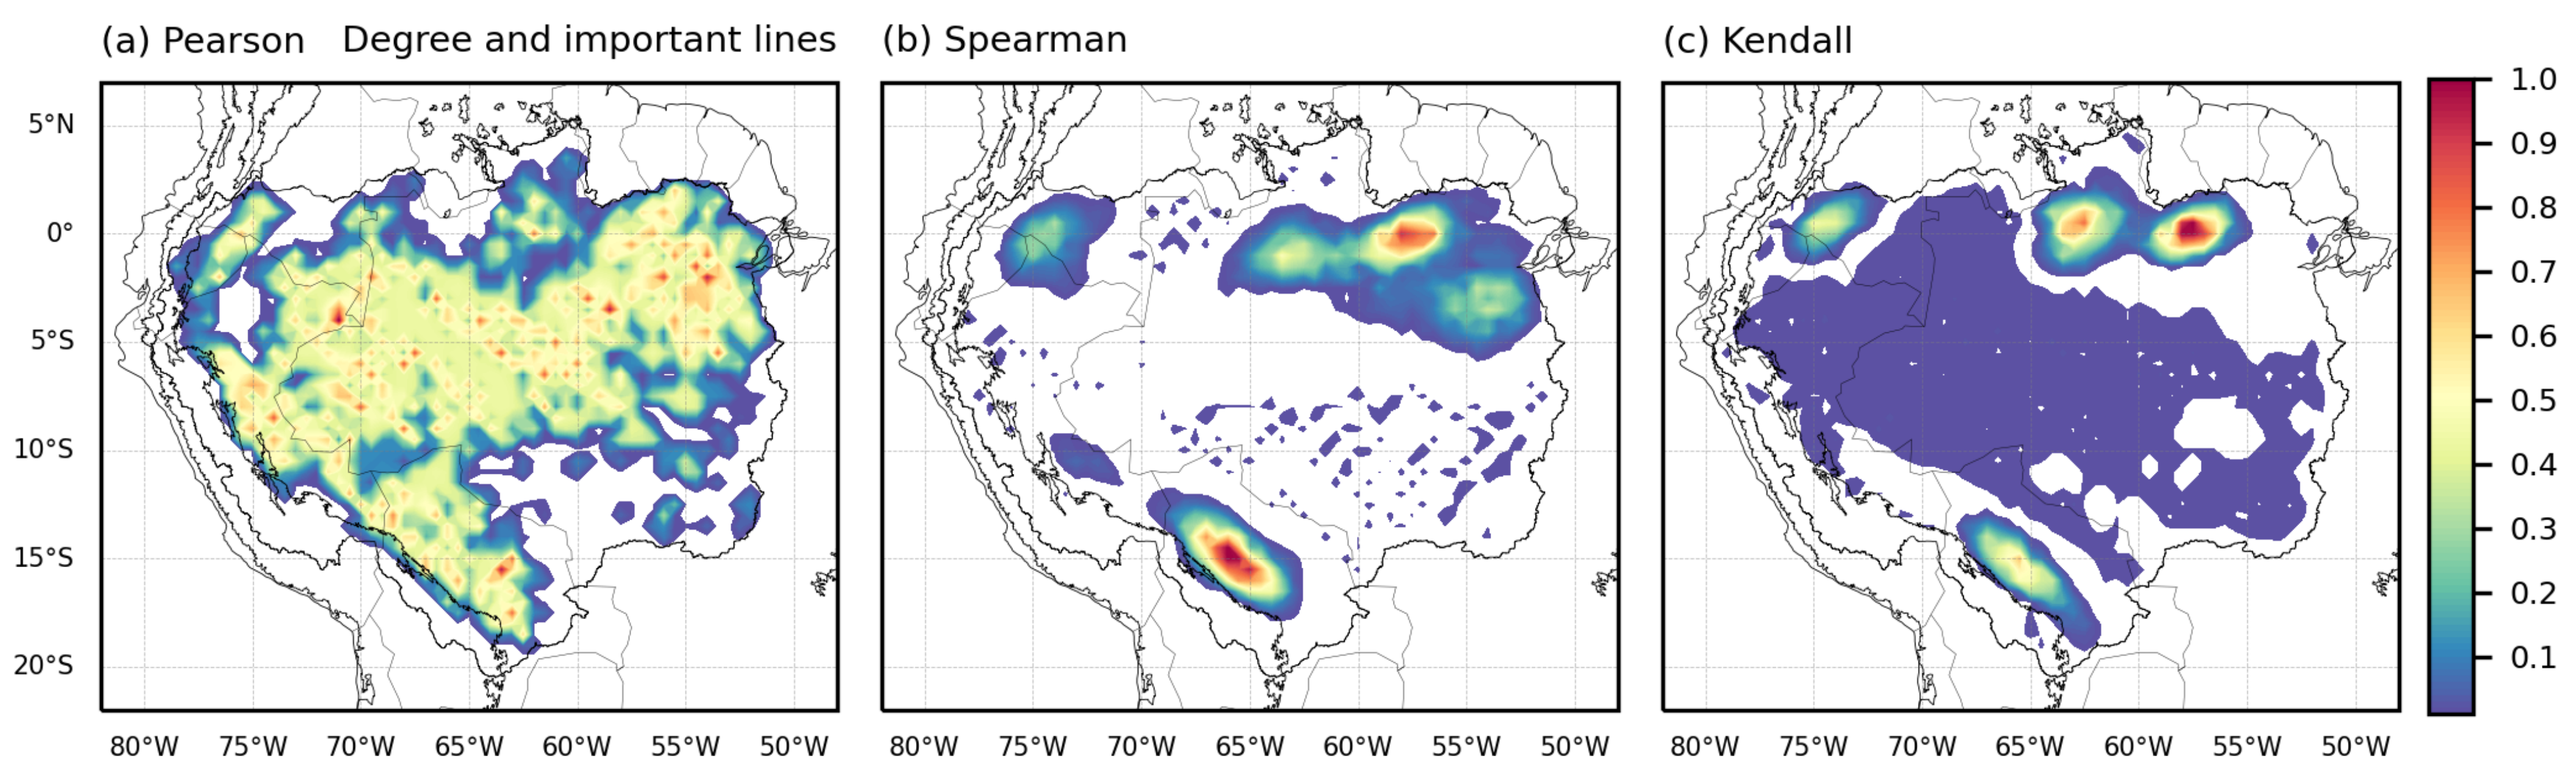
2.3.3. Network Measures

Some indices provide relevant information about the system of interest. In this study, the following indices were applied: The Average Neighbor Degree (AND), which indicates the average degree of the neighbors of a given vertex [51]. This measure provides information about the connectivity of a node’s neighbors and helps to understand the neighborhood structure. This measure gives an idea of how the neighboring nodes of a particular node are connected to each other nodes. Another index used was the Mean Geographical Distance (MGD), which refers to the average physical distance between a node and its neighbors, taking into account their geographic locations. In some cases, geographic distance can play a significant role in network connectivity or influence the relationships between nodes [50,52]. MGD can be utilized to analyze spatial patterns or identify potential regions, indicating areas with local or regional influences. The third index used was the Degree Centrality (DC), which indicates the importance of a node based on the number of links it has [53]. In other words, DC measures how central or influential a node is within the network, taking into account its degree, which is the number of links connected to it. The higher the DC value of a node, the more important it is in terms of connections within the network. A node with a high DC has a large number of links, indicating that it plays a crucial role in communication and information transfer within the network. The Degree value and the Importance of Lines (DIL) index provide information about the participation or importance of nodes, taking into account their degree and the importance of the links they participate in [54]. It identifies highly participatory vertices in terms of network activity. The DIL allows us to understand the vertex participation in terms of its degree and the number of triangles in which the node participates, providing information about the overall structure and dynamics of the network, including the identification of influential nodes and critical connections for information propagation. The last index used was the Betweenness Centrality (BC), an important centrality metric due to the information it provides. BC is defined as the proportion of shortest paths that pass through a particular node compared to the total number of shortest paths in the network [50]. BC indicates the ability of a node to act as an intermediary in the transmission of information or flow of resources through the network. This metric is valuable for identifying the most participatory paths and bridges that connect different parts of the network. By calculating the betweenness centrality of each node, we can identify those nodes that act as key intermediaries in the flow of information between other nodes in the network.

2.3.4. Community Identification

Typically, a network can be composed of subgroups with a high degree of internal connectivity that exhibit distinct behaviors compared to the rest of the nodes in the network. These subgroups are known as communities. Communities often have different characteristics and provide important information about the dynamics of the network. There are different methods to identify communities [33]. However, in this study, we applied one of the most commonly used methods, the Greedy Modularity Maximization [55]. This method is based on the application of modularity ( Q ) [56,57]. Modularity is a measure that evaluates the community structure in the network and quantifies how well the network is divided into distinct communities. This means that vertices within each community are densely connected to each other, while there are fewer connections between communities. Higher values of modularity indicate a more pronounced community structure.

2.3.5. Surrogates

The mechanisms that influence climate and weather are not limited by political boundaries or artificial divisions of study areas. These restrictions can affect connections and have an influence on centrality measures, also known as spatial embedding. To correct this effect, we create 100 sets of artificial daily rainfall series from the Fourier transform, called surrogates [58]. These surrogates are artificially generated data designed to preserve specific properties or statistical characteristics of the original data series. Within these networks, spatially corrected indices were calculated, and their average values were determined. Subsequently, these values were divided by the corresponding values from the original measurements, resulting in the corrected indices. The index values were normalized to fall within the [0, 1] range after correction.

2.3.6. Cohen’s d Value

After defining the rainfall networks, the analysis begins by examining the differences in the degree distribution. This involves applying Cohen’s d value, which quantifies the comparison between distributions [59]. The value represents the standardized difference between the means of two distinct groups, indicating the number of standard deviations between them.

3. Results

This section presents the results obtained from the three networks. Figure 1 shows the limits of the Amazon basin as well as the mean daily summer rainfall. The areas with the highest rainfall values in the region, located east of the central Andes, are known as the Peruvian and Bolivian precipitation hotspots [60].
The degree of a node represents the number of edges connected to that node and also provides information regarding its importance or potential influence on the network. Figure 2 illustrates the degree distribution. In this figure, it can be observed the notable difference between Pearson with the other two networks. Pearson exhibits a scarcity of vertices with high degrees, reaching a maximum of 11, while Spearman and Kendall continue to show probabilities of degrees exceeding 10, with maximum degrees of 27 and 25, respectively.
The distributions show that the Pearson network has a much lower mean than that of Spearman and Kendall but with a much higher probability of occurrence. This indicates that Pearson has much lower degrees than the other two networks but values close to its average occur much more frequently. In this way, Pearson exhibits a more fragmented network with low variability in connectivity. In the case of Spearman and Kendall, they exhibit similar distributions, with Spearman showing higher mean and maximum values. These distributions yield a Cohen’s d value equal to 0.52 but are not considered significantly equal based on a Kolmogorov–Smirnov test.
Meanwhile, Pearson presents a Cohen’s d value equal to 1.73 with Spearman and 1.181 with Kendall. Therefore, the three networks demonstrate different degree distributions. This highlights that, according to Cohen’s d value, the Spearman and Kendall distributions are closer compared to Pearson.
The results of different indexes are presented in Figure 3. These encompass components for the normalized AND, MGD, and DC. These indexes enable us to identify central and influential regions in terms of their connections. We can observe that the three networks exhibit similar spatial structures, with the biggest difference being presented in Pearson. Specifically, in the northern regions, both Spearman and Kendall show well-defined regions, while Pearson exhibits lower connectivity.
Comparing the structure of Pearson with Spearman and Kendall, it can be noted that Pearson underestimates or minimizes the activity of the northern region, mainly the northeast of the basin, but shows a signal near the mouth of the Amazon River (Figure 3a). These lower connectivity values in the northern region indicate weaker connections between neighboring nodes. In the case of Spearman and Kendall, well-defined regions with dense neighborhoods are observable (Figure 3b,c,e,f). These indexes reveal the presence of two regions in the north of the Amazon basin and one region to the southeast of the central Andes. Pearson also indicates this spatial distribution but in a more generalized way, as it fails to adequately highlight the specific regions pointed out by Spearman and Kendall.
The more common region between the three networks is the eastern Andes, where they all show a similar spatial pattern, particularly above the Bolivian hotspot. This similarity can be attributed to the intense precipitation in the region and the predominantly southward direction of low-level flow caused by the presence of the Andes. As a result, a well-defined behavior is observed in this region across all networks. It is important to note that although Spearman and Kendall show a high degree of similarity in AND, they exhibit a noticeable meridional difference (north-south), particularly over the northern part of the Amazon basin. For MGD, The maximum distances recorded were 90 km, 95 km, and 105 km for Pearson, Spearman, and Kendall, respectively. These results reflect another fact that the Pearson network has shorter connections, indicating a bit lower distance connections compared to the other two networks. The Spearman network has longer connections, which may be related to its identification of active regions with larger areas.
The DC results show that the Kendall network provided the highest values, mainly distributed over and south of the Amazon River, as well as east of the central Andes (Figure 3g–i).
As for Pearson and Spearman, they maintain almost the same spatial distribution as the AND and MGD indices. These results indicate how Spearman and Kendall are able to identify well-defined regions associated with higher activity within the Amazon Basin, whereas Pearson provides a more generalized response.
In Figure 4, it can be observed that the Pearson network highlights areas with medium DIL values in the major part of the basin. In contrast, the results of Spearman and Kendall show a notable difference as they do not exhibit an almost spatially homogeneous DIL distribution, where both networks indicate three well-defined regions. Instead, they show the presence of distinct regions in the north and southeast of the basin. However, all three networks reveal areas related to the spatial structure of moisture transport. Spearman and Kendall’s networks particularly emphasize the entry and exit regions of the moisture flow [61].
Three main regions are identified for Spearman and Kendall. The first region, located in the northeast of the basin, extends from the mouth of the Amazon River and covers a larger spatial extent. The second region, located in the northwest, is the smallest. These regions are associated with the influx of warm and humid air from the Tropical Atlantic Ocean, which contributes significantly to positive moisture divergence [62,63,64]. These regions to the north of the basin are also related to an intensification of the ascending branches of the Hadley and Walker circulations [65]. The third region is situated in the southwest of the basin, specifically east of the Andes. This region can be considered as a sink of the Amazon basin, where winds travel from the eastern part of the central Andes towards the extratropics of the continent [40,41,66].
The results suggest that these three regions have a concentration of nodes with higher degrees, indicating that they are more active or influential areas within the rainfall Amazon networks.
Therefore, the two northern areas would be related to rainfall over the central region of the basin, while the third region in the southeast could be interpreted as a response to the flow coming from the central region. The spatial distribution of rainfall displayed in previous results is closely related to the presence of the South American Monsoon System (SAMS). This distribution pattern is more evidenced by the Spearman and Kendall networks, which is consistent with other studies that have investigated the dynamics of the SAMS in the region [20,40,41,66].
In addition to analyzing the importance of individual vertices, it is also relevant to investigate the existence of predominant paths that are frequently used in information transmission. This analysis is conducted using the BC. The results of BC are presented in Figure 5, where the three networks exhibit more common paths for information transmission in the basin. These systems begin with the arrival of east winds at lower levels, which provide moisture and promote convective activity, resulting in increased rainfall in the region [67]. As convection produces more precipitation, evapotranspiration increases the humidity of the atmosphere at low levels, while easterly winds carry moisture towards the Andes [68,69]. This phenomenon explains the high BC values observed in the central part of the Amazon basin. Additionally, when these precipitating systems from the North Atlantic Ocean reach land, they provide high BC values near the mouth of the Amazon River in the northeast region of the basin [50]. This observation is directly related to the previous results of DIL, as shown in Figure 4.
It is evident that Pearson exhibits higher values of BC focused in the south center of the region, mainly between the Purus and Madeira rivers, while Spearman and Kendall show a more distributed response. This suggests that Spearman and Kendall have paths covering a larger area of the Amazon basin, displaying a broader distribution. This, in turn, implies that Spearman and Kendall appear to form much more interconnected networks, indicating a greater number of nodes participating in the transmission of information. The three networks show a significant response of BC in the south region of the Amazon River, indicating a major activity of rainfall. As mentioned by Anselmo et al. [70], the authors suggest that during the austral summer, the most intense rainfall activity is primarily observed south of the Amazon River. This pattern is associated with high levels of surface water elevation in the rivers over the central and west-central of the basin [71].
The networks also exhibit a good response to the presence of the Andes, displaying a well-defined path. This is evident from the high BC values observed to the east of the central Andes, which indicate the strong influence of orographic rainfall processes in the region [40,41,72]. Pearson exhibits low BC values in the eastern part of the basin localized in the northeast of Mato Grosso (52.5 W–57.5 W and 10 S–15 S), while Spearman and Kendall show a moderate BC activity over this region. This region is known for the presence of mesoscale convective systems, where these events are propagated westward [70].
Furthermore, it can be observed that certain BC values are elevated around rivers, suggesting a potential response to the influence of water bodies on precipitation. This interaction between river, land, and precipitation is recognized as the breeze effect. This phenomenon is notably associated with an increased incidence of rainfall events during the morning and nighttime hours in the rivers and their vicinity [73,74,75], with a subsequent decrease observed in the afternoon [76,77]. This phenomenon is influenced by temperature disparities between land and water, which create air circulation patterns that result in cloud formation and subsequent rainfall. Essentially, in the early morning hours, the temperature of the river surface tends to be higher than that of the land surface, initiating upward air movement over the water and subsidence over the land. This convective effect enhances rainfall over the river surface.
From this response of BC in the presence of rivers, we can identify that rivers within the Amazon basin exhibit the highest BC values. The three networks show different regions with better responses between the BC and rivers. For instance, the Amazon River exhibits a good response to BC values in the three networks. Pearson and Kendall reveal a pronounced association of BC with the Purus, Madeira, and Juruá rivers. Kendall also demonstrates more BC activity to the north of the Negro river, suggesting that this network assigns greater importance to this particular region.
Spearman indicates a strong relationship with Purus, Madeira, and Marañón rivers. Notably, Spearman exhibits a pattern where the behavior of BC aligns more closely with the rivers. To assess the response of BC activity over rivers, two groups of nodes were defined based on whether they were located on a river or not, considering only BC values greater than the 50th percentile. The results are presented in Figure 6. It is evident that all networks illustrate how nodes with river presence (represented by boxes with dark colors) exhibit higher mean and median BC values compared to nodes without river presence (represented by boxes with light colors). These results demonstrate how all three networks are capable of producing outcomes associated with the presence of rivers, with more pronounced results in the Spearman and Kendall.
The BC in the networks highlights the common paths of precipitating events. Spearman, in particular, demonstrates a more pronounced relationship between the BC and river presence, whereas Pearson focuses more on the center of the basin. Kendall also exhibits a parallel-river behavior but tends to follow a more traverse-river path. Beyond the boxplot results in Figure 6, it becomes evident that Spearman better captures the association with river locations, particularly in relation to the land-river breeze effect. It is important to note that not all information transport processes can be exclusively linked to rivers. Precipitation events in these regions are also influenced by large-scale circulation and thermodynamic processes at different atmospheric levels, especially in connection to mesoscale convective events. Further studies using additional variables to represent these processes are still necessary.
Figure 7 illustrates the results of community identification. In the northeastern part of the Amazon basin, Pearson identified three distinct communities (PE1, PE3, and PE5), while the Spearman and Kendall networks each identified one community (SP3 and KE1, respectively). In the northwest region, Pearson identified communities PE2 and PE4, while Spearman identified SP2 and SP4, and Kendall identified KE2. Regarding the eastern Andes, the Pearson network divided this region into two distinct communities.
In the north of the central Andes, one community (PE11) is identified, while the other community encompasses the Peruvian and Bolivian precipitation hotspots (PE13). This division into two communities may be attributed to the linear response of Pearson or to the artificial bias [11], influenced by the high rainfall values, which are characteristic of these two regions, leading to a higher degree of local connectivity. In contrast, Spearman and Kendall identified only one community in this region (SP7 and KE6, respectively).
Spearman and Kendall’s networks exhibit a similar spatial distribution of communities, particularly in the northeast (SP1, SP3, and KE1), southeast (SP5 and KE4), and east (SP7 and KE6) of the Amazon basin. It is interesting to note that SP1 is included within the KE1 community. This is because the region defined by SP1 exhibits very low mean rainfall values (this can be observed in Figure 1). This indicates that Spearman has a greater sensitivity to the precipitation regime (intensity) and is able to identify this region as a separate community within the network. However, differences arise in the northwest region, where Spearman presents a large community to the southeast (SP4), while Kendall divides this region into two communities, one directly representative of the north (KE2) and the second defines much of the center of the Amazon basin (KE3). The analysis of rainfall communities emphasizes the distinctions between networks. As expected, Pearson tends to generate smaller communities, reflecting the network’s lower degree of connectivity. This characteristic is particularly noticeable in the eastern Andes. In contrast, Spearman and Kendall identify a well-known corridor of the low-level jet stream (SP7 and KE6), producing a community that better represents the local dynamics.
Based on the preceding results, we observe similar behaviors in Spearman and Kendall. However, to further analyze the distinctions between these two networks, Figure 8 illustrates the differences in normalized indices. Positive values indicate a predominance of the Spearman, while negative values indicate stronger indices from the Kendall. Figure 8a reveals that Kendall displays higher values at the extremes in the north and south of the basin, while Figure 8b shows this only in the north. This observation may be attributed to the specific characteristics of these regions, such as the lower average rainfall amounts highlighted in the Amazon basin. As mentioned earlier, Spearman exhibits higher sensitivity to rainfall regimes compared to Kendall, and this difference is noticeable in the region defined by 60 W–65 W and 5 N–0 (north of Roraima State). In Figure 7, this region is identified as part of the blue community for Kendall (KE1), indicating a low rainfall rate within the community associated with moisture influx from the North Atlantic. However, Spearman excludes this region from the community associated with moisture influx (SP3). This distinction in community assignment underscores the contrasting responses of the networks, with Spearman showing a response of AND and DIL more towards the south. It is evident that the Spearman network exhibits higher AND values across most of the Amazon basin, indicating superior connectivity in this region. These findings suggest that Spearman tends to create a more connected and integrated network.
Finally, Figure 8c illustrates differences in BC, with Kendall displaying higher values in the south center of the basin. In contrast, Spearman shows higher values with more predominance of the Amazon and Purus rivers. For the east of central Andes, both networks show a well-defined path in this region, but Spearman exhibits higher BC values than Kendall.

4. Conclusions

The primary objective of this article is to assess the distinctions among three daily rainfall networks in the Amazon basin, employing three distinct correlation metrics. Our aim is to extract meaningful information about the precipitation system in the region and identify the correlation metric that produces the most suitable results.
In order to obtain accurate results using Pearson, the rainfall series must follow a normal distribution. However, it is well-known that rainfall data does not often exhibit this characteristic. To address this issue, the criterion proposed by Ciemer et al. [11] was applied. The results show how Pearson correlation has certain limitations due to its linear nature. The linear relationship measured by Pearson may not fully capture the complexity of the interactions between nodes. As a result, areas with high connectivity and strong interactions between regions may be underestimated or not fully identified, leading to a more fragmented network.
Spearman and Kendall, on the other hand, identify three crucial regions situated in the northwest, northeast, and south of the basin. The northwest region serves as an entry point for moisture from the northern part of South America, coupled with contributions from the Pacific Ocean. The northeast region is primarily influenced by the North Tropical Atlantic, serving as the main source of warm humid air over the Amazon basin. The third identified region in the southeast of the basin represents the outflow of low-level flow toward the extratropics, characterized by the presence of Peruvian and Bolivian precipitation hotspots.
The BC results illustrate how the three rainfall networks exhibit high values, aligning with the spatial pattern of moisture transport from the central Amazon basin to the eastern Andes. Pearson demonstrates the most intense values in the south of the Amazon River, Kendall is slightly more focused on the eastern center, and Spearman presents a somewhat more homogeneous BC distribution. All three networks can capture the land-river breeze effect, as evidenced by higher means and medians of BC on nodes in the presence of rivers. Spearman exhibits the most notable differences, indicating a more accurate response to this phenomenon.
Spearman and Kendall present similar results, emphasizing a more pronounced spatial influence of the entrance and exit regions. Notably, Spearman demonstrates a better response to the importance of the northeast of the Amazon Basin and the land-river breeze effect. The more favorable outcomes observed with Spearman underscore its heightened sensitivity to rainfall regimes. By considering the ranks, Spearman can capture the underlying relationships and dependencies between variables more effectively, resulting in a higher density of connections in the network. In general, the Spearman correlation proved to be a more robust measure than the Kendall correlation.
The disparities in the spatial distribution of the indices between Pearson and the other networks can be attributed to parametric assumptions and linear response, whereas Spearman and Kendall offer a more comprehensive perspective on rainfall relationships, as they take into account nonlinear interactions and correlations between variables. The variations between these networks can be linked to their sensitivity to rainfall regimes. The presented results indicate that all three networks provide findings associated with the SAMS pattern, with Spearman and Kendall showing the most consistent outcomes. These results help identify the regions of highest activity in the basin, closely linked to the well-known moisture flow dynamics in the Amazon Basin. Finally, Spearman presented the most adequate results, followed by Kendall.
For future work, we intend to use rainfall data with higher resolutions, both spatially and temporally. For instance, an hourly network would be beneficial, considering the land-river breeze effect occurring during mornings and evenings. Additionally, the relationship between BC and the presence of rivers could be refined at higher resolutions. In other words, improved spatial resolution can lead to noticeable differences between neighboring nodes. This approach would allow us to verify the extent of the influence of resolution degradation. Simultaneously, we aim to assess the impact of resolution degradation on the network response.

Author Contributions

Conceptualization, C.A.S.P. and A.J.P.C.; methodology, C.A.S.P., A.J.P.C., S.R.G. and E.E.N.M.; investigation, C.A.S.P. and A.J.P.C.; data curation, C.A.S.P.; writing—original draft preparation, C.A.S.P.; writing—review and editing, A.J.P.C., S.R.G. and E.E.N.M.; visualization, C.A.S.P.; supervision, A.J.P.C.; All authors have read and agreed to the published version of the manuscript.

Funding

This research was conducted with the assistance of funding from Coordenação de Aperfeiçoamento de Pessoal de Nível Superior—Brasil (CAPES). Finance Code 001 and Conselho Nacional de Desenvolvimento Científico e Tecnológico (CNPq) process 438310/2018-7.

Data Availability Statement

The IMERG daily data used in this study are available in https://disc.gsfc.nasa.gov/datasets/GPM_3IMERGDF_06/summary?keywords=IMERG%20daily (accessed on 15 May 2023).

Acknowledgments

We thank NASA’s Earth Observing System Data, GPMCO, and IMERG for providing access to the data used in this study.

Conflicts of Interest

The authors declare no conflict of interest.

Abbreviations

The following abbreviations are used in this manuscript:
ANDAverage Neighbour Degree
BCBetweenness Centrality
CCCloseness Centrality
DCDegree Centrality
DILDegree and Important Lines
MGDMean Geographical distance
GPMGlobal Precipitation Measurement
IMERGIntegrated Multi-satellitE Retrievals for GPM
MLVMinimum Link Value
SAMSSouth American Monsoon System
TRMMTropical Rainfall Measuring Mission

References

  1. Liu, B.; Tan, X.; Gan, T.Y.; Chen, X.; Lin, K.; Lu, M.; Liu, Z. Global atmospheric moisture transport associated with precipitation extremes: Mechanisms and climate change impacts. Wiley Interdiscip. Rev. Water 2020, 7, e1412. [Google Scholar] [CrossRef]
  2. Yin, J.; Guo, S.; Wang, J.; Chen, J.; Zhang, Q.; Gu, L.; Yang, Y.; Tian, J.; Xiong, L.; Zhang, Y. Thermodynamic driving mechanisms for the formation of global precipitation extremes and ecohydrological effects. Sci. China Earth Sci. 2023, 66, 92–110. [Google Scholar] [CrossRef]
  3. Fearnside, P.M. The intrinsic value of Amazon biodiversity. Biodivers. Conserv. 2021, 30, 1199–1202. [Google Scholar] [CrossRef]
  4. Soares-Filho, B.; Moutinho, P.; Nepstad, D.; Anderson, A.; Rodrigues, H.; Garcia, R.; Dietzsch, L.; Merry, F.; Bowman, M.; Hissa, L.; et al. Role of Brazilian Amazon protected areas in climate change mitigation. Proc. Natl. Acad. Sci. USA 2010, 107, 10821–10826. [Google Scholar] [CrossRef]
  5. Crivelari-Costa, P.M.; Lima, M.; La Scala Jr, N.; Rossi, F.S.; Della-Silva, J.L.; Dalagnol, R.; Teodoro, P.E.; Teodoro, L.P.R.; Oliveira, G.d.; Junior, J.F.d.O.; et al. Changes in Carbon Dioxide Balance Associated with Land Use and Land Cover in Brazilian Legal Amazon Based on Remotely Sensed Imagery. Remote Sens. 2023, 15, 2780. [Google Scholar] [CrossRef]
  6. Barzel, B.; Barabási, A.L. Universality in network dynamics. Nat. Phys. 2013, 9, 673–681. [Google Scholar] [CrossRef] [PubMed]
  7. Tsonis, A.A.; Roebber, P.J. The architecture of the climate network. Phys. A Stat. Mech. Its Appl. 2004, 333, 497–504. [Google Scholar] [CrossRef]
  8. Dalelane, C.; Winderlich, K.; Walter, A. Evaluation of global teleconnections in CMIP6 climate projections using complex networks. Earth Syst. Dyn. 2023, 14, 17–37. [Google Scholar] [CrossRef]
  9. Boers, N.; Donner, R.V.; Bookhagen, B.; Kurths, J. Complex network analysis helps to identify impacts of the El Niño Southern Oscillation on moisture divergence in South America. Clim. Dyn. 2015, 45, 619–632. [Google Scholar] [CrossRef]
  10. Naufan, I.; Sivakumar, B.; Woldemeskel, F.M.; Raghavan, S.V.; Vu, M.T.; Liong, S.Y. Spatial connections in regional climate model rainfall outputs at different temporal scales: Application of network theory. J. Hydrol. 2018, 556, 1232–1243. [Google Scholar] [CrossRef]
  11. Ciemer, C.; Boers, N.; Barbosa, H.M.; Kurths, J.; Rammig, A. Temporal evolution of the spatial covariability of rainfall in South America. Clim. Dyn. 2018, 51, 371–382. [Google Scholar] [CrossRef]
  12. Deepthi, B.; Sivakumar, B. General circulation models for rainfall simulations: Performance assessment using complex networks. Atmos. Res. 2022, 278, 106333. [Google Scholar] [CrossRef]
  13. Gao, C.; Liu, L.; Zhang, S.; Xu, Y.P.; Wang, X.; Tang, X. Spatiotemporal patterns and propagation mechanism of meteorological droughts over Yangtze River Basin and Pearl River Basin based on complex network theory. Atmos. Res. 2023, 292, 106874. [Google Scholar] [CrossRef]
  14. Boers, N.; Goswami, B.; Rheinwalt, A.; Bookhagen, B.; Hoskins, B.; Kurths, J. Complex networks reveal global pattern of extreme-rainfall teleconnections. Nature 2019, 566, 373–377. [Google Scholar] [CrossRef] [PubMed]
  15. Wolf, F.; Bauer, J.; Boers, N.; Donner, R.V. Event synchrony measures for functional climate network analysis: A case study on South American rainfall dynamics. Chaos Interdiscip. J. Nonlinear Sci. 2020, 30, 033102. [Google Scholar] [CrossRef] [PubMed]
  16. Gupta, S.; Su, Z.; Boers, N.; Kurths, J.; Marwan, N.; Pappenberger, F. Interconnection between the Indian and the East Asian Summer Monsoon: Spatial synchronization patterns of extreme rainfall events. Int. J. Climatol. 2022, 43, 1034–1049. [Google Scholar] [CrossRef]
  17. Gupta, S.; Boers, N.; Pappenberger, F.; Kurths, J. Complex network approach for detecting tropical cyclones. Clim. Dyn. 2021, 57, 3355–3364. [Google Scholar] [CrossRef]
  18. Ciemer, C.; Rehm, L.; Kurths, J.; Donner, R.V.; Winkelmann, R.; Boers, N. An early-warning indicator for Amazon droughts exclusively based on tropical Atlantic sea surface temperatures. Environ. Res. Lett. 2020, 15, 094087. [Google Scholar] [CrossRef]
  19. Ekhtiari, N.; Ciemer, C.; Kirsch, C.; Donner, R.V. Coupled network analysis revealing global monthly scale co-variability patterns between sea-surface temperatures and precipitation in dependence on the ENSO state. Eur. Phys. J. Spec. Top. 2021, 230, 3019–3032. [Google Scholar] [CrossRef]
  20. Gelbrecht, M.; Boers, N.; Kurths, J. Variability of the low-level circulation of the South American Monsoon analysed with complex networks. Eur. Phys. J. Spec. Top. 2021, 230, 3101–3120. [Google Scholar] [CrossRef]
  21. Freitas, C.G.; Aquino, A.L.; Ramos, H.S.; Frery, A.C.; Rosso, O.A. A detailed characterization of complex networks using Information Theory. Sci. Rep. 2019, 9, 1–12. [Google Scholar] [CrossRef] [PubMed]
  22. Mata, A.S.d. Complex networks: A mini-review. Braz. J. Phys. 2020, 50, 658–672. [Google Scholar] [CrossRef]
  23. Tso, G.K.; Yau, K.K. Predicting electricity energy consumption: A comparison of regression analysis, decision tree and neural networks. Energy 2007, 32, 1761–1768. [Google Scholar] [CrossRef]
  24. Gozolchiani, A.; Yamasaki, K.; Gazit, O.; Havlin, S. Pattern of climate network blinking links follows El Niño events. EPL (Europhys. Lett.) 2008, 83, 28005. [Google Scholar] [CrossRef]
  25. Marwan, N.; Donges, J.F.; Zou, Y.; Donner, R.V.; Kurths, J. Complex network approach for recurrence analysis of time series. Phys. Lett. A 2009, 373, 4246–4254. [Google Scholar] [CrossRef]
  26. Cheung, K.K.; Ozturk, U. Synchronization of extreme rainfall during the Australian summer monsoon: Complex network perspectives. Chaos Interdiscip. J. Nonlinear Sci. 2020, 30, 063117. [Google Scholar] [CrossRef] [PubMed]
  27. Jamali, T.; Ghanbarian, B.; Kurths, J. Spatiotemporal analysis of extreme precipitation events in the United States at mesoscale: Complex network theory. J. Hydrol. 2023, 627, 130440. [Google Scholar] [CrossRef]
  28. Zhou, D.; Gozolchiani, A.; Ashkenazy, Y.; Havlin, S. Teleconnection paths via climate network direct link detection. Phys. Rev. Lett. 2015, 115, 268501. [Google Scholar] [CrossRef] [PubMed]
  29. Tsonis, A.A.; Swanson, K.L.; Wang, G. On the role of atmospheric teleconnections in climate. J. Clim. 2008, 21, 2990–3001. [Google Scholar] [CrossRef]
  30. Malik, N.; Bookhagen, B.; Marwan, N.; Kurths, J. Analysis of spatial and temporal extreme monsoonal rainfall over South Asia using complex networks. Clim. Dyn. 2012, 39, 971–987. [Google Scholar] [CrossRef]
  31. Rodrigues, M.A.; Garcia, S.R.; Kayano, M.T.; Calheiros, A.J.; Andreoli, R.V. Onset and demise dates of the rainy season in the South American monsoon region: A cluster analysis result. Int. J. Climatol. 2022, 42, 1354–1368. [Google Scholar] [CrossRef]
  32. Conticello, F.; Cioffi, F.; Merz, B.; Lall, U. An event synchronization method to link heavy rainfall events and large-scale atmospheric circulation features. Int. J. Climatol. 2018, 38, 1421–1437. [Google Scholar] [CrossRef]
  33. Fortunato, S. Community detection in graphs. Phys. Rep. 2010, 486, 75–174. [Google Scholar] [CrossRef]
  34. Tsonis, A.A.; Swanson, K.L. Climate mode covariability and climate shifts. Int. J. Bifurc. Chaos 2011, 21, 3549–3556. [Google Scholar] [CrossRef]
  35. Saha, M.; Mitra, P. Identification of Indian monsoon predictors using climate network and density-based spatial clustering. Meteorol. Atmos. Phys. 2019, 131, 1301–1314. [Google Scholar] [CrossRef]
  36. Newell, F.L.; Ausprey, I.J.; Robinson, S.K. Spatiotemporal climate variability in the Andes of northern Peru: Evaluation of gridded datasets to describe cloud forest microclimate and local rainfall. Int. J. Climatol. 2022, 42, 5892–5915. [Google Scholar] [CrossRef]
  37. Almazroui, M.; Ashfaq, M.; Islam, M.N.; Rashid, I.U.; Kamil, S.; Abid, M.A.; O’Brien, E.; Ismail, M.; Reboita, M.S.; Sörensson, A.A.; et al. Assessment of CMIP6 performance and projected temperature and precipitation changes over South America. Earth Syst. Environ. 2021, 5, 155–183. [Google Scholar] [CrossRef]
  38. Haylock, M.R.; Peterson, T.C.; Alves, L.M.; Ambrizzi, T.; Anunciação, Y.M.T.; Báez, J.; Barros, V.R.; Berlato, M.A.; Bidegain, M.; Coronel, G.; et al. Trends in total and extreme South American rainfall in 1960–2000 and links with sea surface temperature. J. Clim. 2006, 19, 1490–1512. [Google Scholar] [CrossRef]
  39. Nobre, F.S.S.; Costa, C.L.A.; de Oliveira, D.L.; Cabral, D.A.; Nobre, G.C.; Caçola, P. Análise das oportunidades para o desenvolvimento motor (affordances) em ambientes domésticos no Ceará-Brasil. J. Hum. Growth Dev. 2009, 19, 9–18. [Google Scholar] [CrossRef]
  40. Montini, T.L.; Jones, C.; Carvalho, L.M. The South American low-level jet: A new climatology, variability, and changes. J. Geophys. Res. Atmos. 2019, 124, 1200–1218. [Google Scholar] [CrossRef]
  41. Jones, C. Recent changes in the South America low-level jet. NPJ Clim. Atmos. Sci. 2019, 2, 20. [Google Scholar] [CrossRef]
  42. Rasmussen, K.L.; Chaplin, M.; Zuluaga, M.; Houze Jr, R. Contribution of extreme convective storms to rainfall in South America. J. Hydrometeorol. 2016, 17, 353–367. [Google Scholar] [CrossRef]
  43. Marengo, J.A. On the hydrological cycle of the Amazon Basin: A historical review and current state-of-the-art. Rev. Bras. Meteorol. 2006, 21, 1–19. [Google Scholar]
  44. Alves, L.M.; Marengo, J.A.; Fu, R.; Bombardi, R.J. Sensitivity of Amazon regional climate to deforestation. Am. J. Clim. Chang. 2017, 6, 75–98. [Google Scholar] [CrossRef]
  45. Phillips, O.L.; Brienen, R.J. Carbon uptake by mature Amazon forests has mitigated Amazon nations’ carbon emissions. Carbon Balance Manag. 2017, 12, 1–9. [Google Scholar] [CrossRef]
  46. Huffman, G.; Bolvin, D.; Braithwaite, D.; Hsu, K.; Joyce, R.; Kidd, C.; Nelkin, E.; Sorooshian, S.; Tan, J.; Xie, P. NASA GPM Integrated Multi-satellitE Retrievals for GPM (IMERG) Algorithm Theoretical Basis Document (ATBD) Version 06. NASA/GSFC. Available online: https://gpm.nasa.gov/sites/default/files/2020-05/IMERG_ATBD_V06.3.pdf (accessed on 15 May 2023).
  47. Tan, M.L.; Santo, H. Comparison of GPM IMERG, TMPA 3B42 and PERSIANN-CDR satellite precipitation products over Malaysia. Atmos. Res. 2018, 202, 63–76. [Google Scholar] [CrossRef]
  48. Pradhan, R.K.; Markonis, Y.; Godoy, M.R.V.; Villalba-Pradas, A.; Andreadis, K.M.; Nikolopoulos, E.I.; Papalexiou, S.M.; Rahim, A.; Tapiador, F.J.; Hanel, M. Review of GPM IMERG performance: A global perspective. Remote Sens. Environ. 2022, 268, 112754. [Google Scholar] [CrossRef]
  49. Haas, M.; Goswami, B.; von Luxburg, U. Pitfalls of Climate Network Construction—A Statistical Perspective. J. Clim. 2023, 36, 3321–3342. [Google Scholar] [CrossRef]
  50. Boers, N.; Bookhagen, B.; Marwan, N.; Kurths, J.; Marengo, J. Complex networks identify spatial patterns of extreme rainfall events of the South American Monsoon System. Geophys. Res. Lett. 2013, 40, 4386–4392. [Google Scholar] [CrossRef]
  51. Barrat, A.; Barthelemy, M.; Pastor-Satorras, R.; Vespignani, A. The architecture of complex weighted networks. Proc. Natl. Acad. Sci. USA 2004, 101, 3747–3752. [Google Scholar] [CrossRef] [PubMed]
  52. Boers, N.; Bookhagen, B.; Barbosa, H.M.; Marwan, N.; Kurths, J.; Marengo, J. Prediction of extreme floods in the eastern central Andes based on a complex networks approach. Nat. Commun. 2014b, 5, 1–7. [Google Scholar] [CrossRef] [PubMed]
  53. Srinivasan, S.; Hyman, J.D.; O’Malley, D.; Karra, S.; Viswanathan, H.S.; Srinivasan, G. Machine Learning Techniques for Fractured Media; Elsevier: Maryland Heights, MO, USA, 2020; Volume 61, pp. 109–150. ISBN 978-0-12-821669-9. [Google Scholar] [CrossRef]
  54. Liu, J.; Xiong, Q.; Shi, W.; Shi, X.; Wang, K. Evaluating the importance of nodes in complex networks. Phys. A Stat. Mech. Its Appl. 2016, 452, 209–219. [Google Scholar] [CrossRef]
  55. Clauset, A.; Newman, M.E.; Moore, C. Finding community structure in very large networks. Phys. Rev. E 2004, 70, 066111. [Google Scholar] [CrossRef] [PubMed]
  56. Newman, M.E.; Girvan, M. Finding and evaluating community structure in networks. Phys. Rev. E 2004, 69, 026113. [Google Scholar] [CrossRef] [PubMed]
  57. Costa, L.d.F.; Rodrigues, F.A.; Travieso, G.; Villas Boas, P.R. Characterization of complex networks: A survey of measurements. Adv. Phys. 2007, 56, 167–242. [Google Scholar] [CrossRef]
  58. Rheinwalt, A.; Marwan, N.; Kurths, J.; Werner, P.; Gerstengarbe, F.W. Boundary Effects in Network Measures of Spatially Embedded Networks. In Proceedings of the 2012 SC Companion: High Performance Computing, Networking Storage and Analysis, Salt Lake City, UT, USA, 24–29 June 2012; pp. 500–505. [Google Scholar] [CrossRef]
  59. Baguley, T. Standardized or simple effect size: What should be reported? Br. J. Psychol. 2009, 100, 603–617. [Google Scholar] [CrossRef] [PubMed]
  60. Espinoza, J.C.; Chavez, S.; Ronchail, J.; Junquas, C.; Takahashi, K.; Lavado, W. Rainfall hotspots over the southern tropical Andes: Spatial distribution, rainfall intensity, and relations with large-scale atmospheric circulation. Water Resour. Res. 2015, 51, 3459–3475. [Google Scholar] [CrossRef]
  61. Vera, C.; Baez, J.; Douglas, M.; Emmanuel, C.B.; Marengo, J.; Meitin, J.; Nicolini, M.; Nogues-Paegle, J.; Paegle, J.; Penalba, O.; et al. The South American low-level jet experiment. Bull. Am. Meteorol. Soc. 2006, 87, 63–78. [Google Scholar] [CrossRef]
  62. Zhou, J.; Lau, K. Does a monsoon climate exist over South America? J. Clim. 1998, 11, 1020–1040. [Google Scholar] [CrossRef]
  63. Marengo, J.A. Interannual variability of surface climate in the Amazon basin. Int. J. Climatol. 1992, 12, 853–863. [Google Scholar] [CrossRef]
  64. Marengo, J.A.; Soares, W.R.; Saulo, C.; Nicolini, M. Climatology of low-level jet east of the Andes as derived from the NCEP-NCAR reanalyses temporal and spatial variability. Am. Meteorol. Soc. 2003, 17, 2261–2280. [Google Scholar] [CrossRef]
  65. Espinoza, J.C.; Marengo, J.A.; Schongart, J.; Jimenez, J.C. The new historical flood of 2021 in the Amazon River compared to major floods of the 21st century: Atmospheric features in the context of the intensification of floods. Weather Clim. Extrem. 2022, 35, 100406. [Google Scholar] [CrossRef]
  66. Marengo, J.; Liebmann, B.; Grimm, A.M.; Misra, V.; Silva Dias, P.D.; Cavalcanti, I.F.A.; Carvalho, L.M.V.; Berbery, E.H.; Ambrizzi, T.; Vera, C.S.; et al. Recent developments on the South American monsoon system. Int. J. Climatol. 2012, 32, 1–21. [Google Scholar] [CrossRef]
  67. Cohen, J.C.; Silva Dias, M.A.; Nobre, C.A. Environmental conditions associated with Amazonian squall lines: A case study. Mon. Weather Rev. 1995, 123, 3163–3174. [Google Scholar] [CrossRef]
  68. Eltahir, E.A.; Bras, R.L. Precipitation recycling. Rev. Geophys. 1996, 34, 367–378. [Google Scholar] [CrossRef]
  69. Satyamurty, P.; da Costa, C.P.W.; Manzi, A.O. Moisture source for the Amazon Basin: A study of contrasting years. Theor. Appl. Climatol. 2013, 111, 195–209. [Google Scholar] [CrossRef]
  70. Anselmo, E.M.; Machado, L.A.; Schumacher, C.; Kiladis, G.N. Amazonian mesoscale convective systems: Life cycle and propagation characteristics. Int. J. Climatol. 2021, 41, 3968–3981. [Google Scholar] [CrossRef]
  71. Fassoni-Andrade, A.C.; Fleischmann, A.S.; Papa, F.; Paiva, R.C.D.D.; Wongchuig, S.; Melack, J.M.; Moreira, A.A.; Paris, A.; Ruhoff, A.; Barbosa, C.; et al. Amazon hydrology from space: Scientific advances and future challenges. Rev. Geophys. 2021, 59, e2020RG000728. [Google Scholar] [CrossRef]
  72. Bookhagen, B.; Strecker, M.R. Orographic barriers, high-resolution TRMM rainfall, and relief variations along the eastern Andes. Geophys. Res. Lett. 2008, 35, L06403. [Google Scholar] [CrossRef]
  73. Lu, L.; Denning, A.S.; da Silva-Dias, M.A.; da Silva-Dias, P.; Longo, M.; Freitas, S.R.; Saatchi, S. Mesoscale circulations and atmospheric CO2 variations in the Tapajós Region, Pará, Brazil. J. Geophys. Res. Atmos. 2005, 110, D21102. [Google Scholar] [CrossRef]
  74. RAMOS DA SILVA, R.; Gandu, A.W.; Sá, L.D.; Silva Dias, M.A. Cloud streets and land–water interactions in the Amazon. Biogeochemistry 2011, 105, 201–211. [Google Scholar] [CrossRef]
  75. Tanaka, L.d.S.; Satyamurty, P.; Machado, L.A. Diurnal variation of precipitation in central Amazon Basin. Int. J. Climatol. 2014, 34, 3574–3584. [Google Scholar] [CrossRef]
  76. Fitzjarrald, D.R.; Sakai, R.K.; Moraes, O.L.; Cosme de Oliveira, R.; Acevedo, O.C.; Czikowsky, M.J.; Beldini, T. Spatial and temporal rainfall variability near the Amazon-Tapajós confluence. J. Geophys. Res. Biogeosci. 2008, 113, G00B11. [Google Scholar] [CrossRef]
  77. Paiva, R.C.D.; Buarque, D.C.; Clarke, R.T.; Collischonn, W.; Allasia, D.G. Reduced precipitation over large water bodies in the Brazilian Amazon shown from TRMM data. Geophys. Res. Lett. 2011, 38, L04406. [Google Scholar] [CrossRef]
Figure 1. Mean daily summer rainfall (mm/day) for Amazon basin from 2000 to 2021. The thick and thin black lines represent the Amazon Basin and the country borders, respectively, while the light blue lines indicate the rivers.
Meteorology 02 00030 g001
Figure 2. Degree distribution of Pearson, Spearman, and Kendall networks. Dashed lines represent the mean of each distribution.
Meteorology 02 00030 g002
Figure 3. Normalized results using the maximum value of the respective index in relation to the three networks (Average Neighbor Degree, Mean Geographical Distance, and Degree Centrality), for Pearson (a,d,g), Spearman (b,e,h), and Kendall (c,f,i).
Meteorology 02 00030 g003
Figure 4. Normalized Degree and important lines (DIL) for (a) Pearson, (b) Spearman, and (c) Kendall networks.
Meteorology 02 00030 g004
Figure 5. Normalized Betweenness centrality (BC) for each network (ac), while (d) shows the main rivers in the Amazon basin, represented by the black lines.
Meteorology 02 00030 g005
Figure 6. Boxplot of Betweenness centrality using only values greater than or equal to the respective network median (50th percentile). The dark and light boxplot colors represent the node groups with and without the presence of rivers, respectively.
Meteorology 02 00030 g006
Figure 7. Daily summer rainfall communities identified for (a) Pearson, (b) Spearman, and (c) Kendall networks.
Meteorology 02 00030 g007
Figure 8. Difference of normalized indices between Spearman and Kendall for (a) Average neighbor degree, (b) Degree and important lines, and (c) Betweenness centrality.
Meteorology 02 00030 g008
Disclaimer/Publisher’s Note: The statements, opinions and data contained in all publications are solely those of the individual author(s) and contributor(s) and not of MDPI and/or the editor(s). MDPI and/or the editor(s) disclaim responsibility for any injury to people or property resulting from any ideas, methods, instructions or products referred to in the content.

