

The Relationships between Adverse Weather, Traffic Mobility, and Driver Behavior


Abstract
:1. Introduction
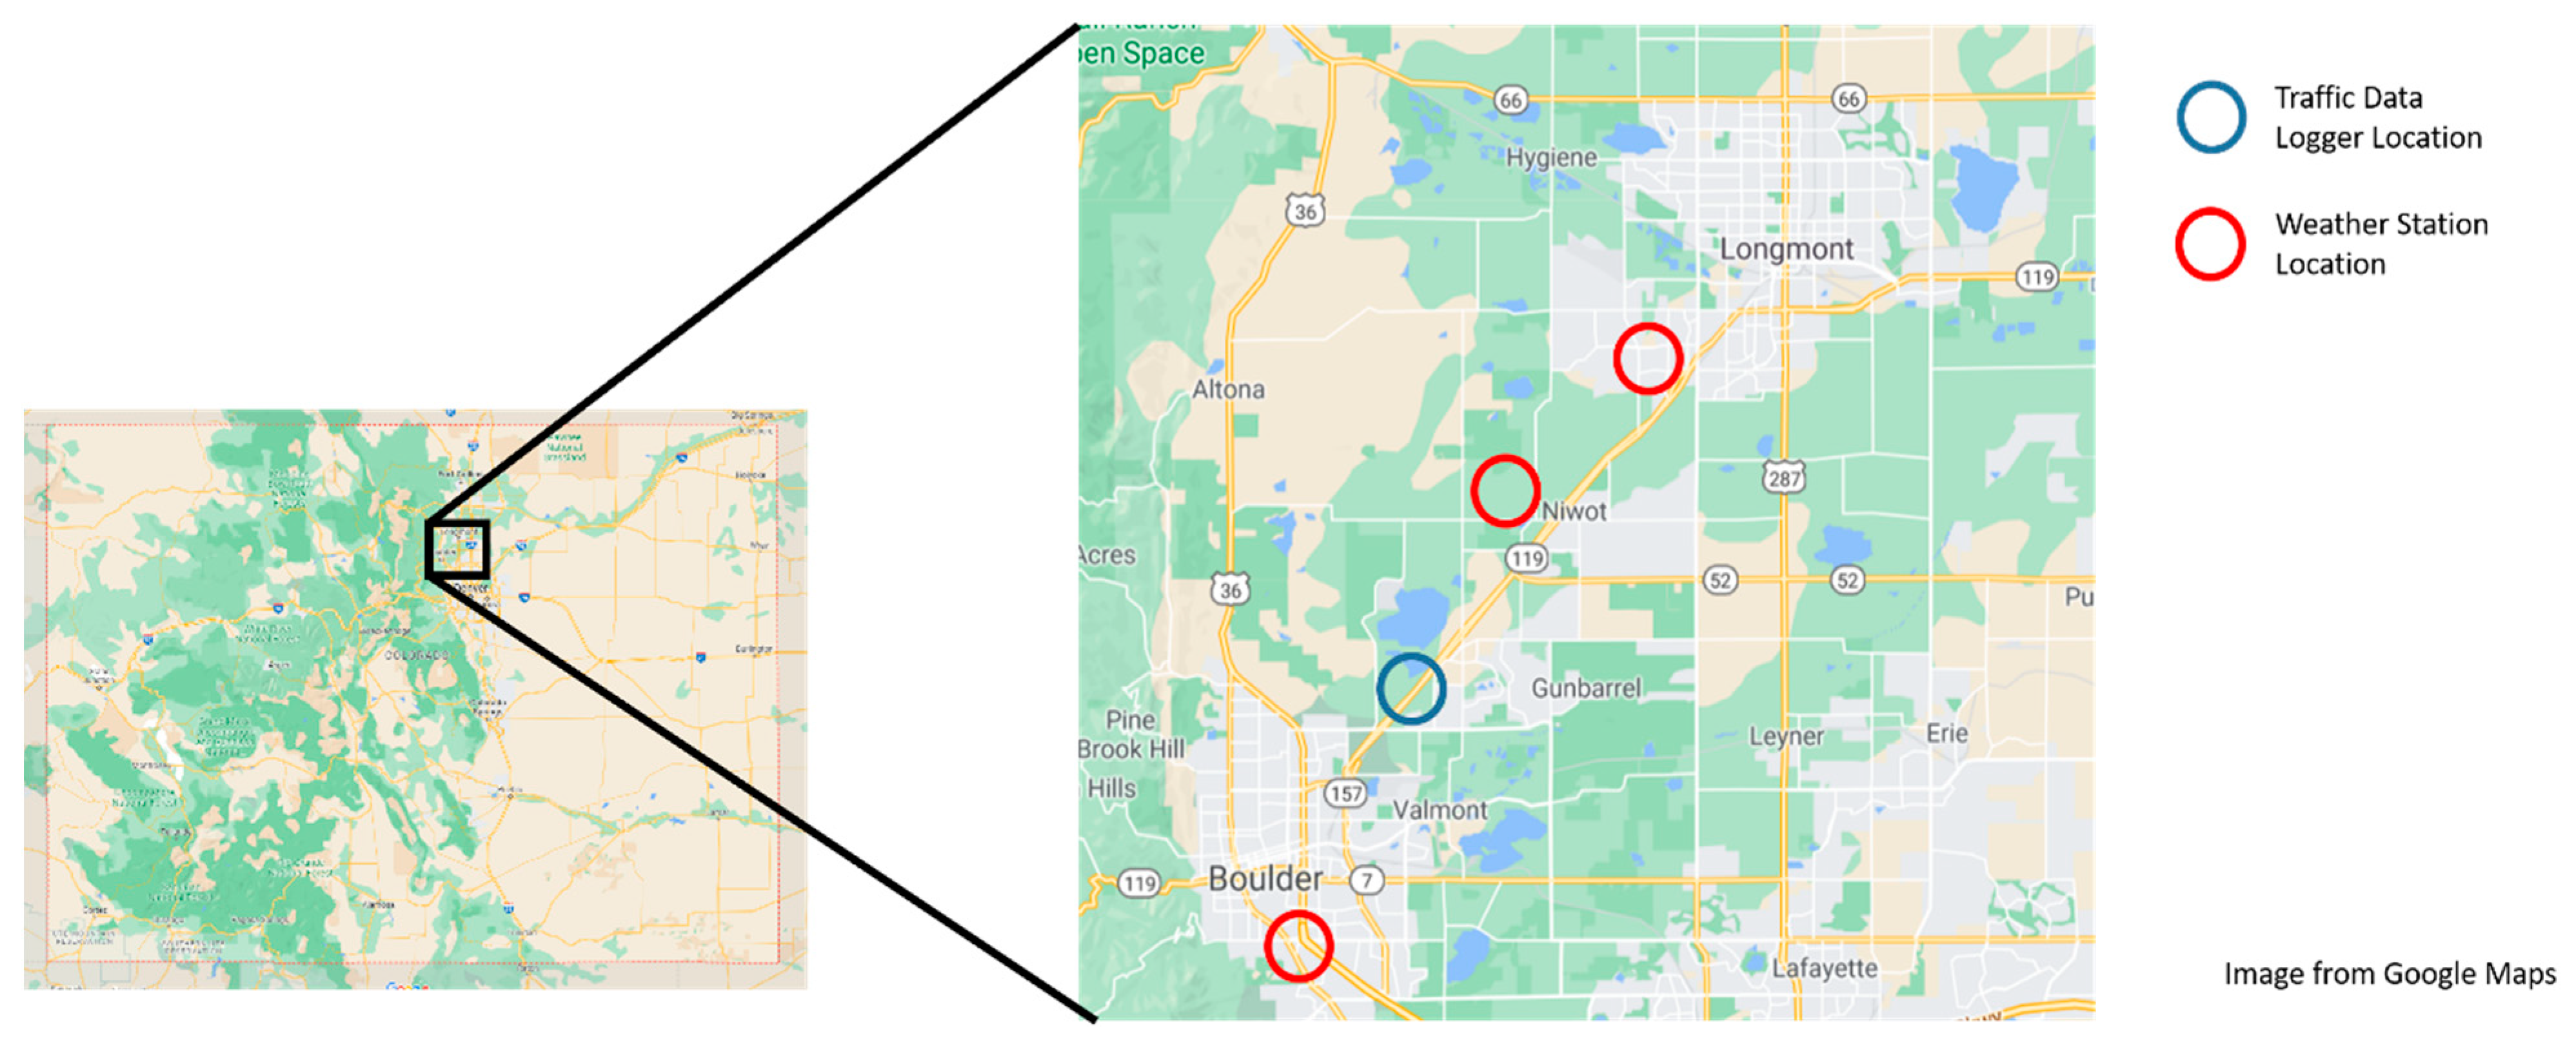
2. Methods and Data
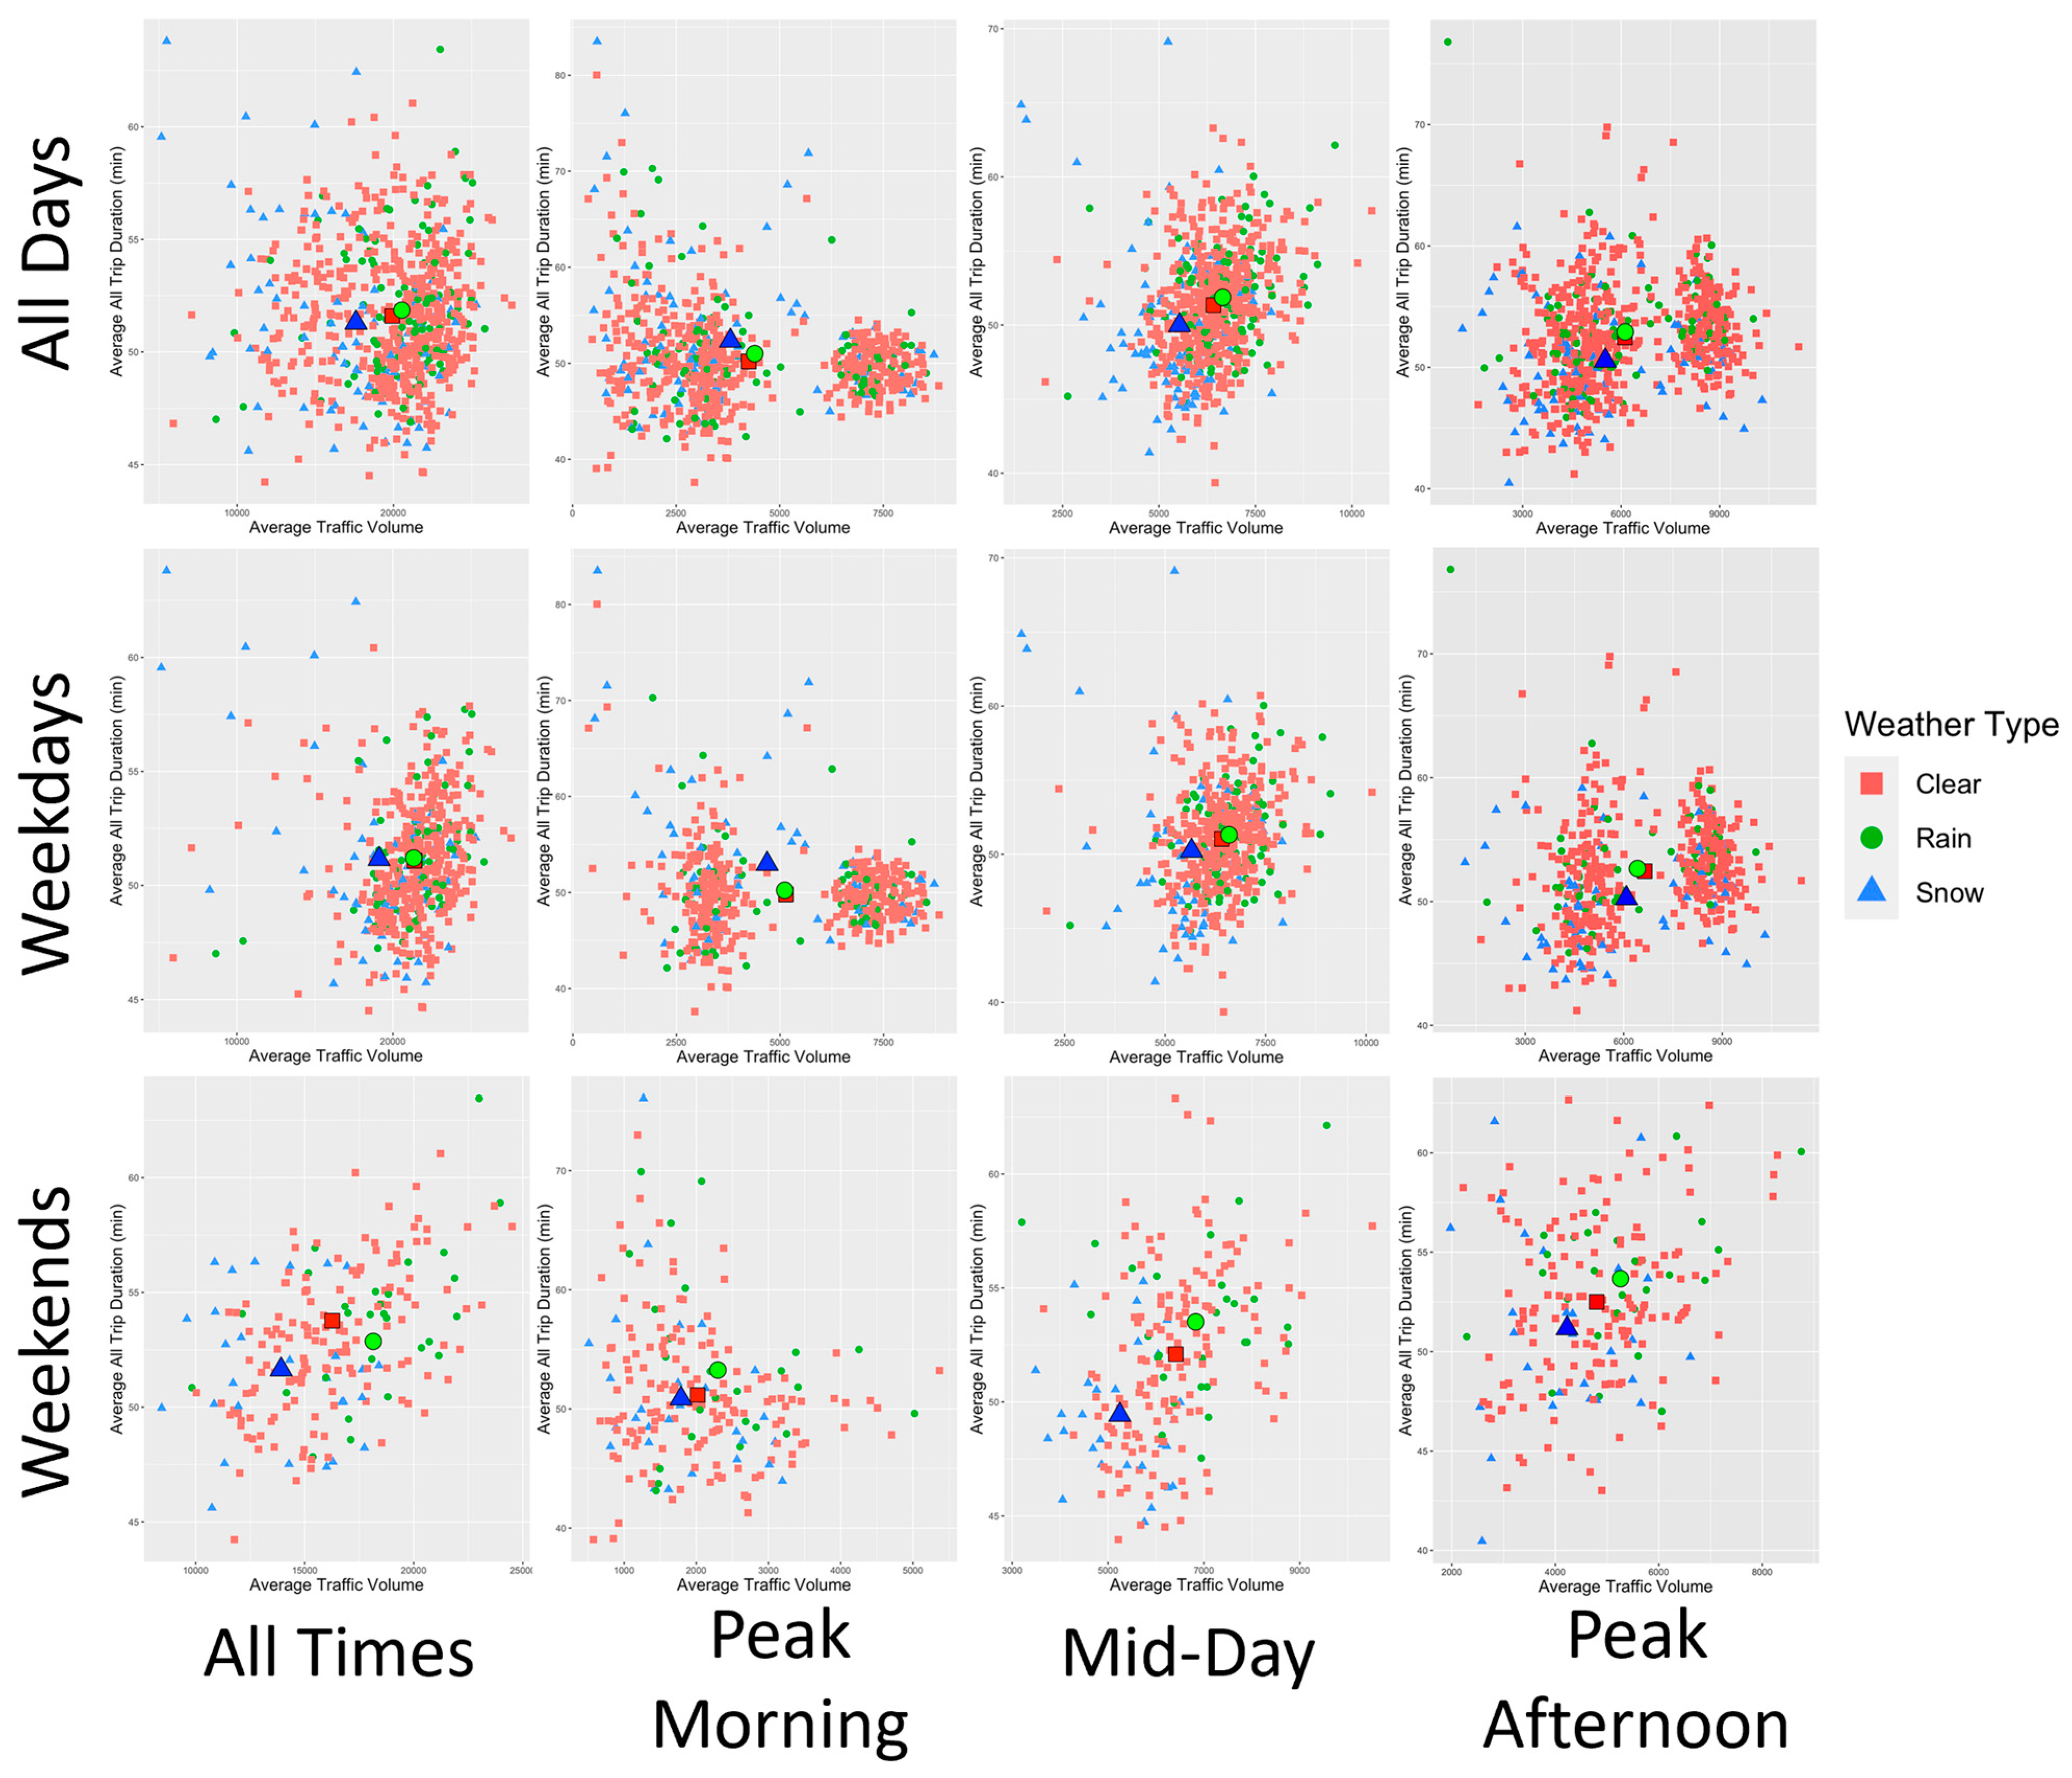
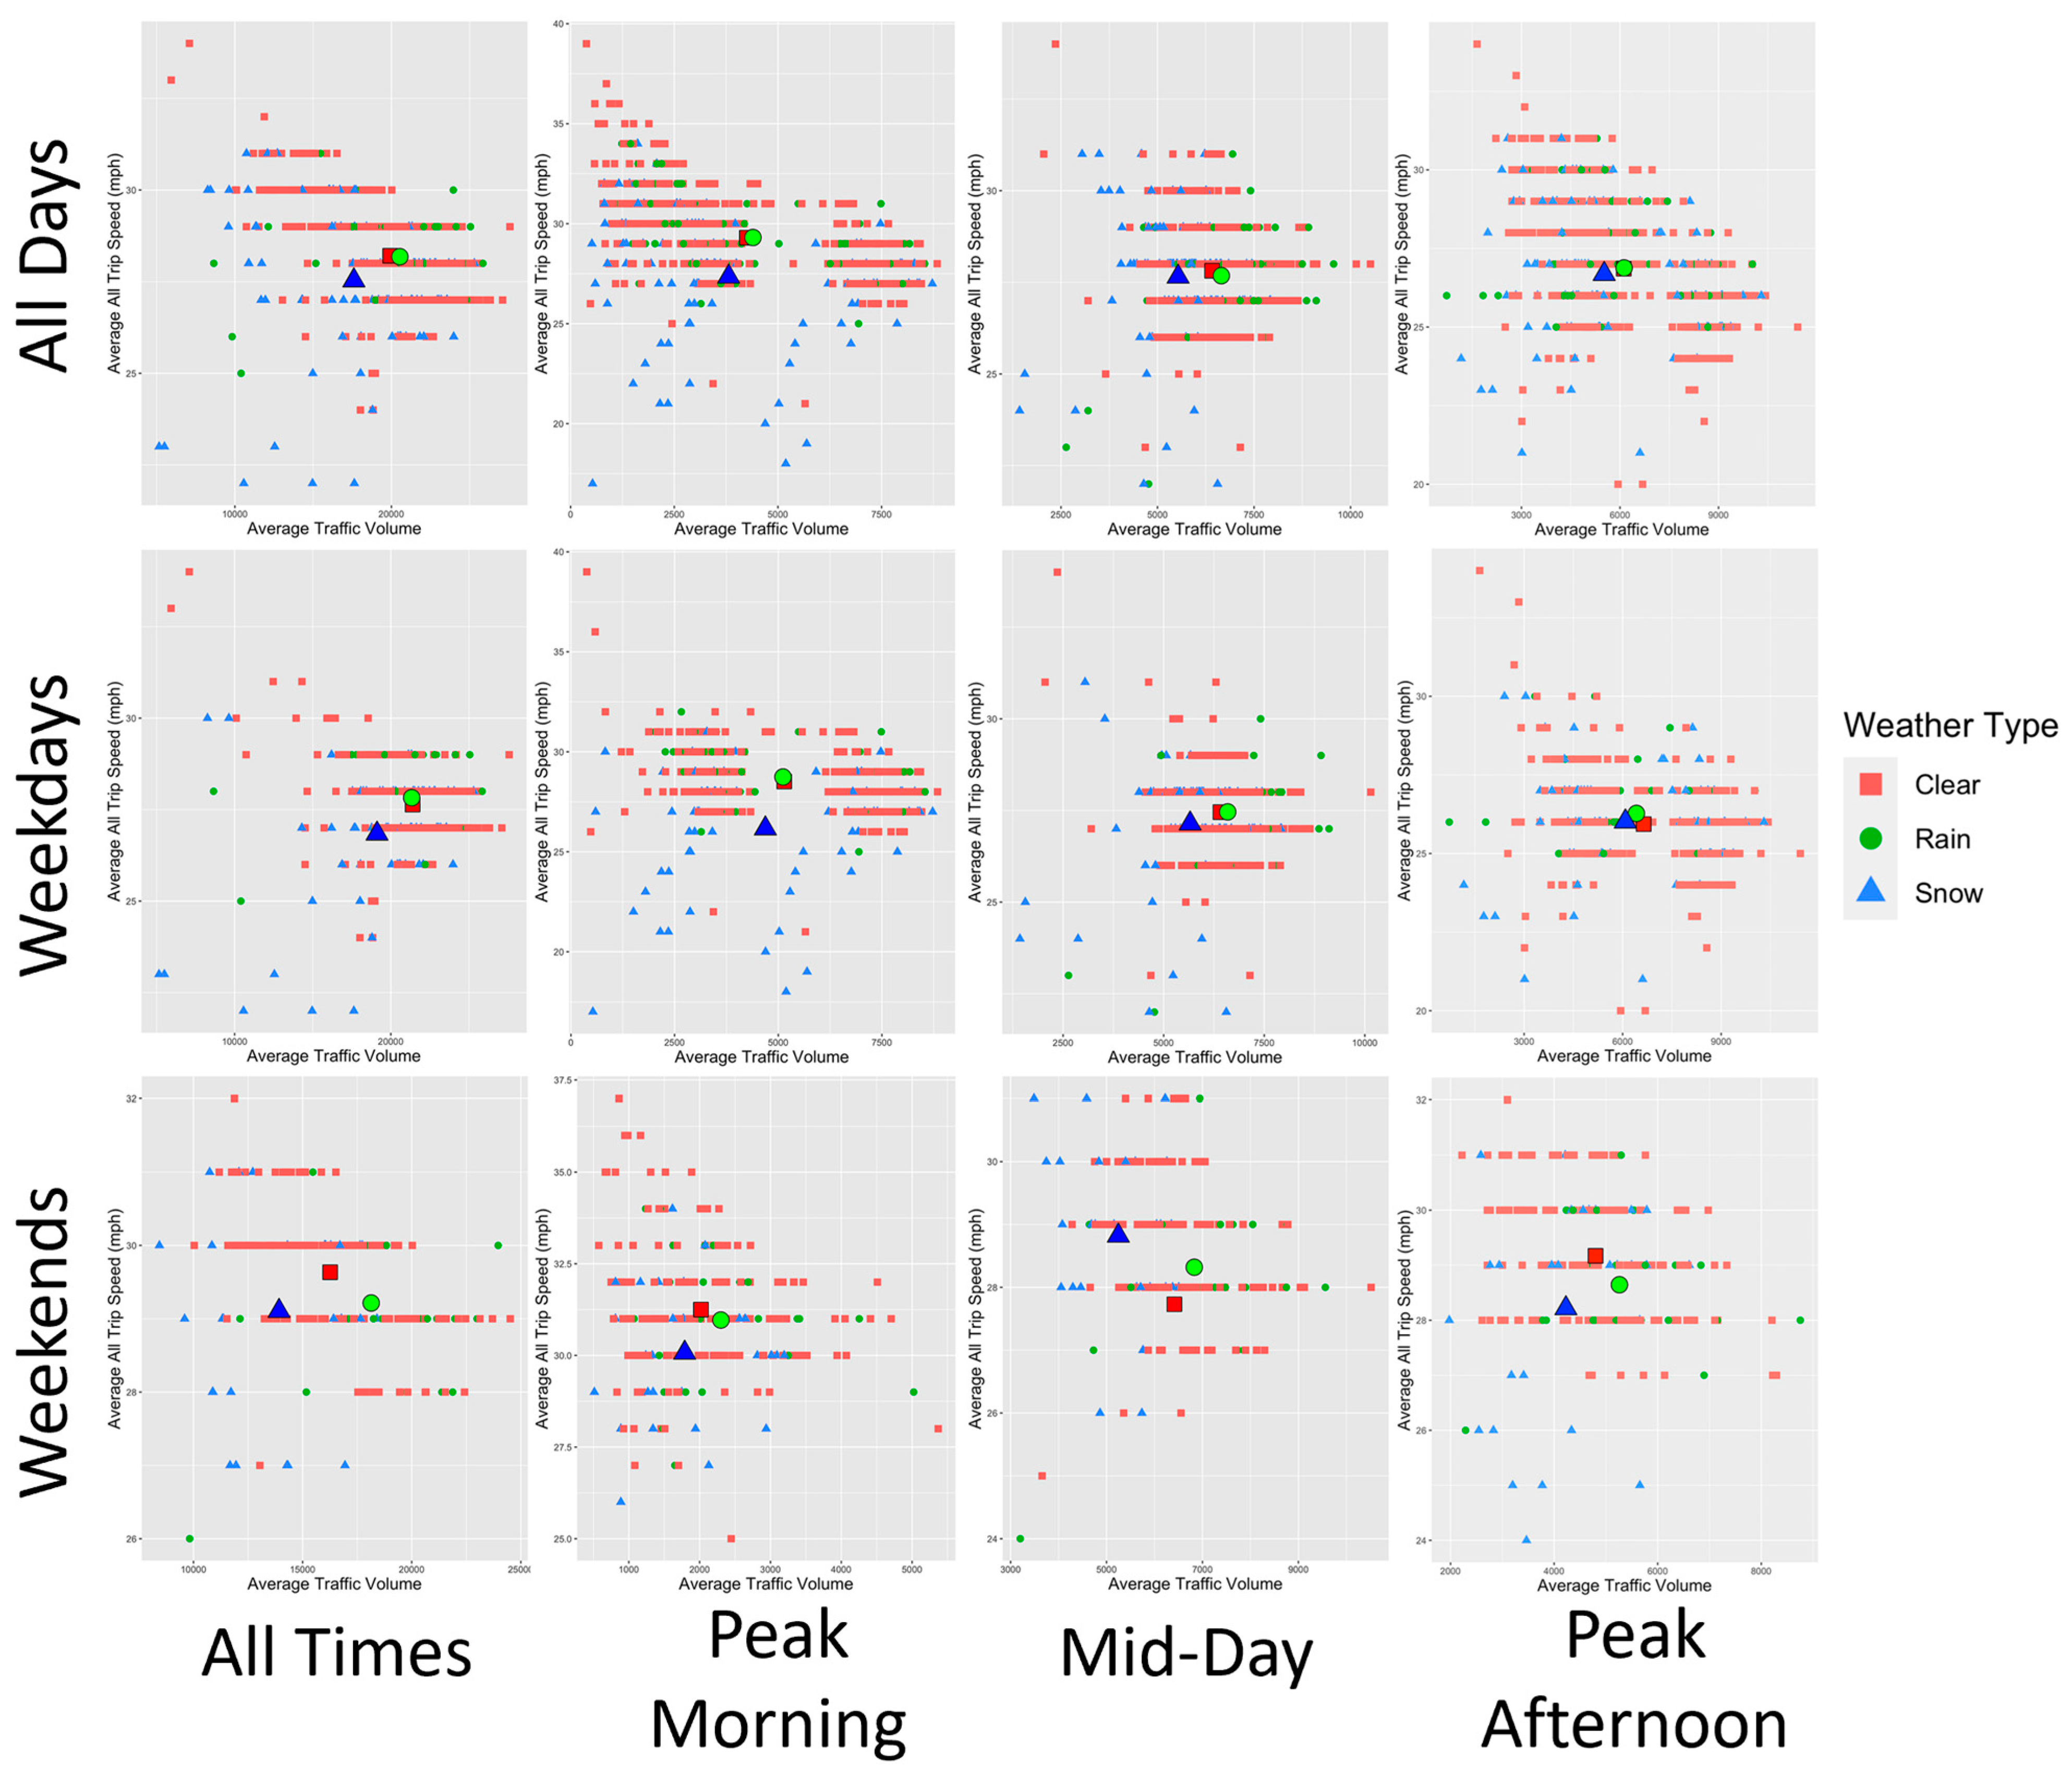
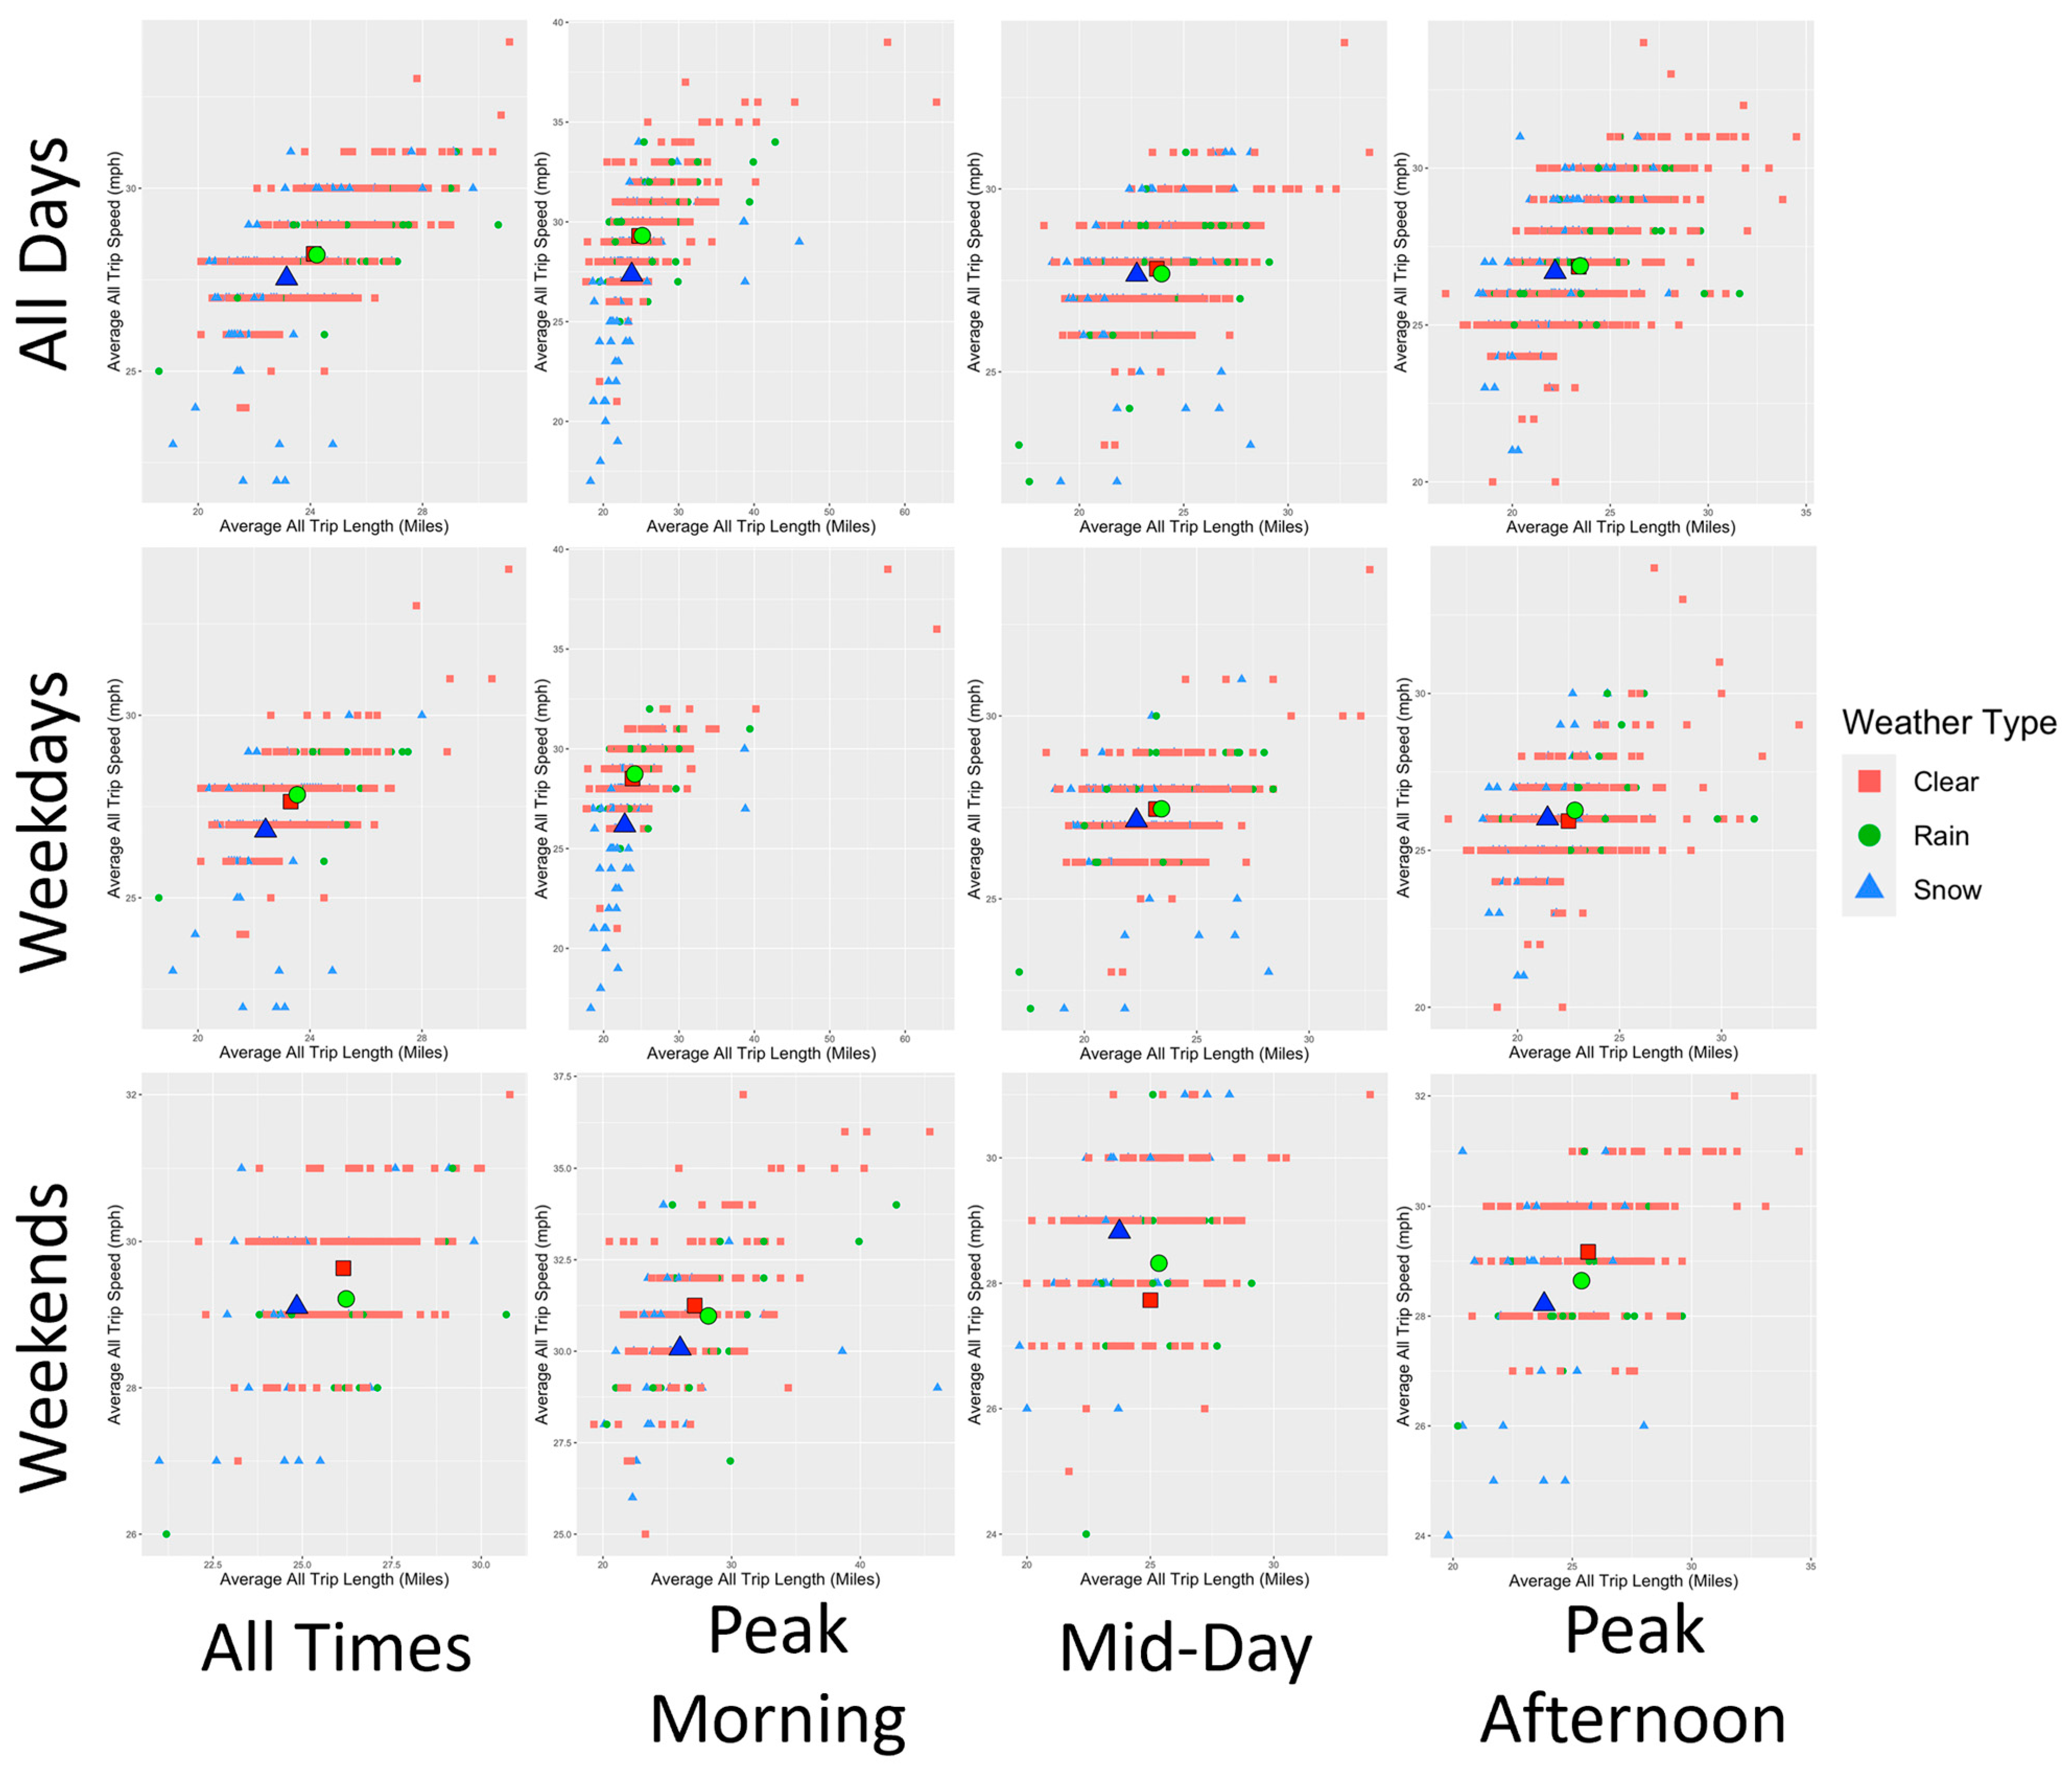
3. Results and Discussion
4. Summary and Conclusions
Author Contributions
Funding
Data Availability Statement
Acknowledgments
Conflicts of Interest
References
- FHWA. How Do Weather Events Impact Roads? 2021. Available online: https://ops.fhwa.dot.gov/weather/q1_roadimpact.htm (accessed on 19 July 2021).
- Black, A.W.; Villarini, G.; Mote, T.L. Effects of Rainfall on Vehicle Crashes in Six U.S. States. Weather Clim. Soc. 2017, 9, 53–70. [Google Scholar] [CrossRef]
- Jaroszweski, D.; McNamara, T. The influence of rainfall on road accidents in urban areas: A weather radar approach. Travel Behav. Soc. 2014, 1, 15–21. [Google Scholar] [CrossRef]
- Andrey, J.; Hambly, D.; Mills, B.; Afrin, S. Insights into driver adaptation to inclement weather in Canada. J. Transp. Geogr. 2013, 28, 192–203. [Google Scholar] [CrossRef]
- Andrey, J.; Mills, B.; Leahy, M.; Suggett, J. Weather as a chronic hazard for road transportation in Canadian cities. Nat. Hazards 2003, 28, 319–343. [Google Scholar] [CrossRef]
- Bergel-Hayat, R.; Debbarh, M.; Antoniou, C.; Yannis, G. Explaining the road accident risk: Weather effects. Accid. Anal. Prev. 2013, 60, 456–465. [Google Scholar] [CrossRef] [PubMed]
- Andrey, J. Long-term trends in weather-related crash risks. J. Transp. Geogr. 2010, 18, 247–258. [Google Scholar] [CrossRef]
- Brijs, T.; Karlis, D.; Wets, G. Studying the effect of weather conditions on daily crash counts using a discrete time-series model. Accid. Anal. Prev. 2008, 40, 1180–1190. [Google Scholar] [CrossRef] [PubMed]
- Keay, K.; Simmonds, I. The association of rainfall and other weather variables with road traffic volume in Melbourne, Australia. Accid. Anal. Prev. 2005, 37, 109–124. [Google Scholar] [CrossRef]
- Eisenberg, D. The mixed effect of precipitation on traffic crashes. Accid. Anal. Prev. 2004, 36, 637–647. [Google Scholar] [CrossRef]
- Andreescu, M.; Frost, D.B. Weather and traffic accidents in Montreal, Canada. Clim. Res. 1998, 9, 225–230. [Google Scholar] [CrossRef]
- Levine, N.; Kim, K.E.; Nitz, L.H. Daily fluctuations in Honolulu motor vehicle accidents. Accid. Anal. Prev. 1995, 27, 785–796. [Google Scholar] [CrossRef]
- Andrey, J.; Yagar, S. A temporal analysis of rain-related crash risk. Accid. Anal. Prev. 1993, 4, 465–472. [Google Scholar] [CrossRef] [PubMed]
- Brodsky, H.; Hakkert, A.S. Risk of a road accident in rainy weather. Accid. Anal. Prev. 1988, 20, 161–176. [Google Scholar] [CrossRef] [PubMed]
- Sherretz, L.A.; Farhar, B.C. An analysis of the relationship between rainfall and the occurrence of traffic accidents. J. Appl. Meteorol. 1978, 17, 711–715. [Google Scholar] [CrossRef]
- Call, D.A.; Flynt, G.A. The impact of snowfall on crashes, traffic volume, and revenue on the New York State Thruway. Weather Clim. Soc. 2022, 14, 131–141. [Google Scholar] [CrossRef]
- Call, D.A.; Medina, R.M.; Black, A.W. Causes of weather-related crashes in Salt Lake County, Utah. Prof. Geogr. 2019, 71, 253–264. [Google Scholar] [CrossRef]
- Black, A.W.; Mote, T.L. Characteristics of winter-precipitation-related transportation fatalities in the United States. Weather Clim. Soc. 2015, 7, 133–145. [Google Scholar] [CrossRef]
- Black, A.W.; Mote, T.L. Effects of winter precipitation on automobile collisions, injuries, and fatalities in the United States. J. Transp. Geogr. 2015, 48, 165–175. [Google Scholar] [CrossRef]
- Mills, B.N.; Andrey, J.; Hambly, D. Analysis of precipitation-related motor vehicle collision and injury risk using insurance and police record information for Winnipeg, Canada. J. Saf. Res. 2011, 42, 383–390. [Google Scholar] [CrossRef]
- Eisenberg, D.; Warner, K.E. Effects of snowfalls on motor vehicle collisions, injuries, and fatalities. Am. J. Public Health 2005, 95, 120–125. [Google Scholar] [CrossRef] [PubMed]
- Barjenbruch, K.; Werner, C.M.; Graham, R.; Oppermann, C.; Blackwelder, G.; Williams, J.; Merrill, G.; Jensen, S.; Connolly, J. Drivers’ awareness of and response to two significant winter storms impacting a metropolitan area in the Intermountain West: Implications for improving traffic flow in inclement weather. Weather Clim. Soc. 2016, 8, 475–491. [Google Scholar] [CrossRef]
- Hanbali, R.M.; Kuemmel, D.A. Traffic volume reductions due to winter storm conditions. Transp. Res. Rec. 1993, 1387, 159–164. Available online: https://trid.trb.org/view/379645 (accessed on 29 August 2023).
- Knapp, K.K.; Smithson, L.D. Winter storm event volume impact analysis using multiple-source archived monitoring data. Transp. Res. Rec. 2000, 1700, 10–16. [Google Scholar] [CrossRef]
- Cools, M.; Moon, E.; Wets, G. Assessing the Impact of Weather on Traffic Intensity. Weather Climate Soc. 2010, 2, 60–68. [Google Scholar] [CrossRef]
- Roh, H.-J.; Yasanthi, R.G.N. Modelling traffic volume reduction as a function of winter weather factors for a cold region highway. Cold Reg. Eng. 2023, 37, 06022004. [Google Scholar] [CrossRef]
- Roh, H.-J. Data-driven sustainability validation of winter traffic model through spatial transferability of the model’s parameters between functionally homogeneous and heterogeneous highway segments. Transp. Eng. Part A Syst. 2023, 149, 04022147. [Google Scholar] [CrossRef]
- Edwards, J.B. Speed adjustment of motorway commuter traffic to inclement weather. Transp. Res. 1999, 2, 1–14. [Google Scholar] [CrossRef]
- Gwyther, H.; Holland, C. The effect of age, gender, and attitudes on self-regulation in driving. Accid. Anal. Prev. 2012, 45, 19–28. [Google Scholar] [CrossRef]
- Underwood, G. Visual attention and the transition from novice to advanced driver. Ergonomics 2007, 50, 1235–1249. [Google Scholar] [CrossRef] [PubMed]
- Crundall, D.E.; Underwood, G. Effects of experience and processing demands on visual information acquisition in drivers. Ergonomics 1998, 41, 448–458. [Google Scholar] [CrossRef]
- Khattak, A.J.; Palma, A.D. The impact of adverse weather conditions on the propensity to change travel decisions: A survey of Brussels commuters. Transp. Res. Part A Policy Pract. 1997, 31, 181–203. [Google Scholar] [CrossRef]
- Cools, M.; Moons, E.; Creemers, L.; Wets, G. Changes in travel behavior in response to weather conditions: Do type of weather and trip purpose matter? Transp. Res. Rec. 2010, 2157, 22–28. [Google Scholar] [CrossRef]
- Bocker, L.; Dijst, M.; Prillwitz, J. Impact of everyday weather on individual daily travel behaviors in perspective: A literature review. Transp. Rev. 2013, 33, 71–91. [Google Scholar] [CrossRef]
- Fu, X.; Lam, W.H.K.; Meng, Q. Modelling impacts of adverse weather conditions on activity-travel pattern scheduling in multi-modal transit networks. Transp. B Transp. Dyn. 2014, 2, 151–167. [Google Scholar] [CrossRef]
- Singhal, A.; Kamga, C.; Yazici, A. Impact of weather on urban transit ridership. Transp. Res. Part A Policy Pract. 2014, 69, 379–391. [Google Scholar] [CrossRef]
- Liu, C.; Susilo, Y.O.; Karlstrom, A. Weather variability and travel behaviour—What we know and what we do not know. Transp. Rev. 2017, 37, 715–741. [Google Scholar] [CrossRef]
- NCEI. Climate Data Online Search. 2021. Available online: https://www.ncdc.noaa.gov/cdo-web/search (accessed on 19 July 2021).
- StreetLight Data. StreetLight Data: Big Data For Mobility. 2021. Available online: https://www.streetlightdata.com/ (accessed on 19 July 2021).
- Praharaj, S. Data predictive approach to estimate nuisance flooding impacts on roadway networks: A Norfolk, Virginia case study. In Transportation Research Circular Number E-C265, Transportation Resilience 2019, Proceedings of the 2nd International Conference on Resilience to Natural Hazards and Extreme Weather Events, Washington, DC, USA, 13–15 November 2019; Transportation Research Board: Washington, DC, USA, 2020. [Google Scholar]
- Lee, K.; Sener, I.N. Emerging data for pedestrian and bicycle monitoring: Sources and applications. Transp. Res. Interdiscip. Perspect. 2020, 4, 100095. [Google Scholar] [CrossRef]
- Iowa Environmental Mesonet. ASOS-AWOS-METAR Data Download. 2023. Available online: https://mesonet.agron.iastate.edu/request/download.phtml (accessed on 12 June 2023).
- Black, A.W.; Villarini, G. Effects of methodological decisions on rainfall-related crash relative risk estimates. Accid. Anal. Prev. 2019, 130, 22–29. [Google Scholar] [CrossRef]
- Pisano, P.A.; Goodwin, L.C.; Rosetti, M.A. U.S. highway crashes in adverse road weather conditions. In Proceedings of the 24th Conference on Interactive Information Processing Systems, New Orleans, LA, USA, 23 January 2008; Available online: https://ams.confex.com/ams/pdfpapers/133554.pdf (accessed on 29 August 2023).


| Weather Types | Number of Days | |||
|---|---|---|---|---|
| Boulder | Niwot | Longmont | Total | |
| Clear | 263 | 256 | 249 | 768 |
| Rain | 55 | 19 | 63 | 137 |
| Snow | 46 | 40 | 40 | 126 |
| Missing | 1 | 50 | 13 | 64 |
| Day of Week | Travel Direction | Weather Type | Traffic Parameters | |||
|---|---|---|---|---|---|---|
| Volume (Number of Vehicles) | Speed (mph [km/h]) | Length (miles [km]) | Duration (min) | |||
| All Days | Eastbound | Clear | 20,850 | 28.0 (45.1) | 24.4 (39.3) | 52.7 |
| Rain | 21,593 [3.6] | 28.2 (45.4) [0.7] | 23.5 (37.8) [−3.7] | 53.0 [0.6] | ||
| Snow | 18,429 [−11.6] | 27.5 (44.2) [−1.8] | 23.5 (37.9) [−3.7] | 52.3 [−0.8] | ||
| Westbound | Clear | 19,004 | 28.4 (45.6) | 23.8 (38.3) | 50.5 | |
| Rain | 19,489 [2.6] | 28.2 (45.4) [−0.7] | 22.3 (35.9) [−6.3] | 50.7 [0.4] | ||
| Snow | 16,780 [−11.7] | 27.6 (44.4) [−2.8] | 22.8 (36.7) [−4.2] | 50.3 [−0.4] | ||
| Weekdays | Eastbound | Clear | 22,356 | 27.5 (44.2) | 23.5 (37.9) | 52.1 |
| Rain | 22,435 [0.4] | 27.8 (44.7) [1.1] | 23.9 (38.4) [1.7] | 52.3 [0.4] | ||
| Snow | 20,133 [−9.9] | 26.8 (43.1) [−2.5] | 22.7 (36.5) [−3.4] | 51.9 [−0.4] | ||
| Westbound | Clear | 20,426 | 27.8 (44.8) | 23.1 (37.2) | 50.1 | |
| Rain | 20,234 [−0.9] | 27.9 (44.9) [0.4] | 23.2 (37.4) [0.4] | 50.1 [0.0] | ||
| Snow | 18,300 [−10.4] | 26.9 (43.2) [−3.2] | 22.2 (35.7) [−3.9] | 50.4 [0.6] | ||
| Weekends | Eastbound | Clear | 17,076 | 29.6 (47.6) | 26.7 (43.0) | 54.3 |
| Rain | 19,125 [12.0] | 29.4 (47.3) [−0.7] | 26.7 (43.0) [0.0] | 54.9 [1.1] | ||
| Snow | 14,532 [−14.9] | 29.0 (46.7) [−2.0] | 25.5 (41.0) [−4.5] | 53.1 [−2.2] | ||
| Westbound | Clear | 15,440 | 29.7 (47.8) | 25.6 (41.2) | 51.5 | |
| Rain | 17,160 [11.1] | 29.1 (46.8) [−2.0] | 25.7 (41.4) [0.4] | 52.6 [2.1] | ||
| Snow | 13,307 [−13.8] | 29.2 (47.0) [−1.7] | 24.2 (38.9) [−5.5] | 50.2 [−2.5] | ||
| Day of Week | Travel Direction | Weather Type | Traffic Parameters | |||
|---|---|---|---|---|---|---|
| Volume (Number of Vehicles) | Speed (mph [km/h]) | Length (miles [km]) | Duration (min) | |||
| All Days | Eastbound | Clear | 2680 | 29.6 (47.6) | 25.5 (41.0) | 50.7 |
| Rain | 2856 [6.6] | 29.6 (47.7) [0.0] | 26.2 (42.1) [2.7] | 52.1 [2.8] | ||
| Snow | 2368 [−11.6] | 27.4 (44.1) [−7.4] | 24.6 (39.5) [−3.5] | 53.1 [4.7] | ||
| Westbound | Clear | 5823 | 29.1 (46.8) | 24.1 (38.8) | 49.7 | |
| Rain | 5938 [2.0] | 29.0 (46.6) [−0.3] | 24.2 (38.9) [0.4] | 49.9 [0.4] | ||
| Snow | 5254 [−9.8] | 27.3 (43.9) [−6.2] | 23.0 (37.0) [−4.6] | 51.6 [3.8] | ||
| Weekdays | Eastbound | Clear | 3216 | 28.8 (46.4) | 24.3 (39.1) | 49.7 |
| Rain | 3258 [1.3] | 29.1 (46.8) [1.0] | 24.8 (39.8) [2.1] | 50.6 [1.8] | ||
| Snow | 2881 [−10.4] | 26.4 (42.6) [−8.3] | 23.0 (37.0) [−5.3] | 52.7 [6.0] | ||
| Westbound | Clear | 7068 | 28.2 (45.4) | 23.4 (37.6) | 49.9 | |
| Rain | 6969 [−1.4] | 28.4 (45.7) [0.7] | 23.5 (37.8) [0.4] | 49.9 [0.0] | ||
| Snow | 6497 [−8.1] | 25.9 (41.6) [−8.2] | 22.6 (36.3) [−3.4] | 53.2 [6.6] | ||
| Weekends | Eastbound | Clear | 1336 | 31.4 (50.5) | 28.4 (45.7) | 53.1 |
| Rain | 1680 [25.7] | 31.3 (50.4) [−0.3] | 30.2 (48.7) [6.3] | 56.4 [6.2] | ||
| Snow | 1165 [−12.8] | 29.6 (47.7) [−5.7] | 28.1 (45.2) [−1.1] | 53.8 [1.3] | ||
| Westbound | Clear | 2701 | 31.1 (50.1) | 25.9 (41.6) | 49.2 | |
| Rain | 2919 [8.1] | 30.6 (49.3) [−1.6] | 26.2 (42.1) [1.2] | 50.1 [1.8] | ||
| Snow | 2412 [−10.7] | 30.5 (49.1) [−1.9] | 23.9 (38.5) [−7.7] | 47.9 [−2.6] | ||
| Day of Week | Travel Direction | Weather Type | Traffic Parameters | |||
|---|---|---|---|---|---|---|
| Volume (Number of Vehicles) | Speed (mph [km/h]) | Length (miles [km]) | Duration (min) | |||
| All Days | Eastbound | Clear | 6608 | 27.9 (44.8) | 24.0 (38.7) | 52.1 |
| Rain | 6928 [4.8] | 27.8 (44.7) [−0.4] | 24.1 (38.8) [0.4] | 52.4 [0.6] | ||
| Snow | 5739 [−13.2] | 27.6 (44.4) [−1.1] | 23.1 (37.2) [−3.7] | 50.9 [−2.3] | ||
| Westbound | Clear | 6213 | 27.8 (44.7) | 23.4 (37.6) | 50.6 | |
| Rain | 6377 [2.6] | 27.6 (44.4) [−0.7] | 23.8 (38.3) [1.7] | 51.4 [1.6] | ||
| Snow | 5326 [−14.3] | 27.7 (44.6) [−0.4] | 22.4 (36.1) [−4.3] | 49.1 [−3.0] | ||
| Weekdays | Eastbound | Clear | 6769 | 27.5 (44.2) | 23.5 (37.9) | 51.9 |
| Rain | 7013 [3.6] | 27.6 (44.5) [0.4] | 23.8 (38.2) [1.3] | 52.1 [0.4] | ||
| Snow | 5998 [−11.4] | 27.0 (43.4) [−1.8] | 22.7 (36.5) [−3.4] | 51.5 [−0.8] | ||
| Westbound | Clear | 6049 | 27.4 (44.2) | 22.8 (36.8) | 50.2 | |
| Rain | 6169 [2.0] | 27.3 (43.9) [−0.4] | 23.1 (37.2) [1.3] | 50.5 [0.6] | ||
| Snow | 5318 [−12.1] | 27.3 (44.0) [−0.4] | 22.0 (35.4) [−3.5] | 48.9 [−2.6] | ||
| Weekends | Eastbound | Clear | 6203 | 28.8 (46.4) | 25.3 (40.7) | 52.4 |
| Rain | 6675 [7.6] | 28.2 (45.4) [−2.1] | 25.1 (40.4) [−0.8] | 53.2 [1.5] | ||
| Snow | 5147 [−17.0] | 29.1 (46.8) [1.0] | 24.1 (38.8) [−4.7] | 49.5 [−5.5] | ||
| Westbound | Clear | 6625 | 26.7 (42.9) | 24.7 (39.8) | 51.8 | |
| Rain | 6982 [5.4] | 28.4 (45.8) [6.4] | 25.8 (41.4) [4.5] | 53.8 [3.9] | ||
| Snow | 5345 [−19.3] | 28.6 (46.0) [7.1] | 23.4 (37.7) [−5.3] | 49.4 [−4.6] | ||
| Day of Week | Travel Direction | Weather Type | Traffic Parameters | |||
|---|---|---|---|---|---|---|
| Volume (Number of Vehicles) | Speed (mph [km/h]) | Length (miles [km]) | Duration (min) | |||
| All Days | Eastbound | Clear | 7624 | 26.7 (42.9) | 23.5 (37.8) | 53.3 |
| Rain | 7591 [−0.4] | 26.8 (43.1) [0.4] | 23.7 (38.1) [0.9] | 53.6 [0.6] | ||
| Snow | 6898 [−9.5] | 26.5 (42.6) [−0.7] | 22.3 (35.9) [−5.1] | 51.5 [−3.4] | ||
| Westbound | Clear | 4607 | 27.1 (43.5) | 23.3 (37.5) | 51.6 | |
| Rain | 4657 [1.1] | 27.0 (43.4) [−0.4] | 23.3 (37.5) [0.0] | 52.2 [1.2] | ||
| Snow | 4139 [−10.2] | 26.9 (43.2) [−0.7] | 22.1 (35.5) [−5.2] | 49.6 [−3.9] | ||
| Weekdays | Eastbound | Clear | 8403 | 25.7 (41.3) | 22.6 (36.4) | 53.4 |
| Rain | 8147 [−3.0] | 26.1 (42.0) [1.6] | 23.0 (37.0) [1.8] | 53.6 [0.4] | ||
| Snow | 7829 [−6.8] | 25.8 (41.6) [0.4] | 21.7 (34.8) [−4.0] | 51.3 [−3.9] | ||
| Westbound | Clear | 4878 | 26.2 (42.1) | 22.4 (36.0) | 51.5 | |
| Rain | 4690 [−3.9] | 26.4 (42.5) [0.8] | 22.6 (36.4) [0.9] | 51.8 [0.6] | ||
| Snow | 4337 [−11.1] | 26.2 (42.1) [0.0] | 21.3 (34.3) [−4.9] | 49.2 [−4.5] | ||
| Weekends | Eastbound | Clear | 5673 | 29.1 (46.8) | 25.8 (41.4) | 53.1 |
| Rain | 5961 [5.1] | 28.8 (46.3) [−1.0] | 25.5 (41.1) [−1.2] | 53.9 [1.5] | ||
| Snow | 4769 [−15.9] | 28.0 (45.1) [−3.8] | 23.8 (38.3) [−7.8] | 51.8 [−2.4] | ||
| Westbound | Clear | 3928 | 29.3 (47.1) | 25.6 (41.2) | 52.0 | |
| Rain | 4561 [16.1] | 28.5 (45.9) [−2.7] | 25.3 (40.7) [−1.2] | 53.4 [2.7] | ||
| Snow | 3686 [−6.2] | 28.4 (45.8) [−3.1] | 23.8 (38.4) [−7.0] | 50.6 [−2.7] | ||
| Day of Week | Direction of Travel | Weather Type | Traffic Parameters | |||
|---|---|---|---|---|---|---|
| Volume (Number of Cars) | Home-Based Work Percentage (Volume) | Home-Based Other Percentage (Volume) | Non-Home-Based Percentage (Volume) | |||
| All Days | Eastbound | Clear | 20,850 | 18.7% (3899) | 44.7% (9320) | 36.6% (7631) |
| Rain | 21,593 | 18.5% (3995) | 43.6% (9415) | 37.9% (8184) | ||
| Snow | 18,429 | 20.3% (3741) | 44.3% (8164) | 35.4% (6524) | ||
| Westbound | Clear | 19,004 | 20.6% (3915) | 42.1% (8001) | 37.3% (7088) | |
| Rain | 19,489 | 20.9% (4073) | 40.6% (7913) | 38.6% (7523) | ||
| Snow | 16,780 | 22.5% (3776) | 42.5% (7132) | 35.0% (5873) | ||
| Weekdays | Eastbound | Clear | 22,356 | 22.9% (5120) | 39.7% (8875) | 37.4% (8361) |
| Rain | 22,435 | 22.0% (4936) | 40.0% (8974) | 38.0% (8525) | ||
| Snow | 20,133 | 25.0% (5033) | 39.0% (7852) | 36.0% (7248) | ||
| Westbound | Clear | 20,426 | 25.5% (5209) | 36.8% (7517) | 37.7% (7701) | |
| Rain | 20,234 | 25.2% (5099) | 36.6% (7406) | 38.2% (7729) | ||
| Snow | 18,300 | 28.2% (5161) | 36.5% (6680) | 35.3% (6460) | ||
| Weekends | Eastbound | Clear | 17,076 | 8.0% (1366) | 57.4% (9802) | 34.6% (5908) |
| Rain | 19,125 | 8.1% (1549) | 54.1% (10,347) | 37.9% (7248) | ||
| Snow | 14,532 | 9.6% (1395) | 56.4% (8196) | 34.0% (4941) | ||
| Westbound | Clear | 15,440 | 8.3% (1282) | 55.5% (8569) | 36.2% (5589) | |
| Rain | 17,160 | 8.1% (1390) | 52.2% (8958) | 39.7% (6813) | ||
| Snow | 13,307 | 9.5% (1264) | 56.1% (7465) | 34.4% (4578) | ||
| Day of Week | Direction of Travel | Weather Type | Traffic Parameters | |||
|---|---|---|---|---|---|---|
| Volume (Number of Cars) | Home-Based Work Percentage (Volume) | Home-Based Other Percentage (Volume) | Non-Home-Based Percentage (Volume) | |||
| All Days | Eastbound | Clear | 2680 | 29.5% (791) | 36.4% (976) | 34.0% (911) |
| Rain | 2856 | 28.7% (820) | 36.6% (1045) | 34.7% (991) | ||
| Snow | 2368 | 32.4% (767) | 35.1% (831) | 32.5% (770) | ||
| Westbound | Clear | 5823 | 35.6% (2073) | 36.2% (2108) | 28.1% (1636) | |
| Rain | 5938 | 36.3% (2155) | 33.6% (1995) | 30.0% (1781) | ||
| Snow | 5254 | 37.6% (1976) | 34.9% (1834) | 27.5% (1445) | ||
| Weekdays | Eastbound | Clear | 3216 | 37.0%(1190) | 28.1%(904) | 34.9% (1122) |
| Rain | 3258 | 34.8% (1134) | 30.6% (997) | 34.6% (1127) | ||
| Snow | 2881 | 40.2% (1158) | 28.6% (824) | 31.2% (899) | ||
| Westbound | Clear | 7068 | 44.0% (3110) | 28.3% (2000) | 27.7% (1958) | |
| Rain | 6969 | 43.0% (2997) | 28.4% (1979) | 28.7% (2000) | ||
| Snow | 6497 | 46.4% (3015) | 27.0% (1754) | 26.7% (1735) | ||
| Weekends | Eastbound | Clear | 1336 | 10.9% (146) | 57.3% (766) | 31.8% (425) |
| Rain | 1680 | 10.9% (183) | 54.1% (909) | 35.0% (588) | ||
| Snow | 1165 | 14.6% (170) | 50.0% (583) | 35.4% (412) | ||
| Westbound | Clear | 2701 | 14.7% (397) | 56.1% (1515) | 29.2% (789) | |
| Rain | 2919 | 16.8% (490) | 49.1% (1433) | 34.1% (995) | ||
| Snow | 2412 | 17.6% (425) | 53.2% (1283) | 29.2% (704) | ||
| Day of Week | Direction of Travel | Weather Type | Traffic Parameters | |||
|---|---|---|---|---|---|---|
| Volume (Number of Cars) | Home-Based Work Percentage (Volume) | Home-Based Other Percentage (Volume) | Non-Home-Based Percentage (Volume) | |||
| All Days | Eastbound | Clear | 6608 | 10.8% (714) | 40.8% (2696) | 48.5% (3205) |
| Rain | 6928 | 11.3% (783) | 39.9% (2764) | 48.8% (3381) | ||
| Snow | 5739 | 11.9% (683) | 40.8% (2342) | 47.4% (2720) | ||
| Westbound | Clear | 6213 | 11.4% (708) | 40.6% (2522) | 47.9% (2976) | |
| Rain | 6377 | 11.4% (727) | 40.0% (2551) | 48.5% (3093) | ||
| Snow | 5326 | 13.3% (708) | 42.2% (2248) | 44.5% (2370) | ||
| Weekdays | Eastbound | Clear | 6769 | 12.8% (866) | 35.6% (2410) | 51.6% (3493) |
| Rain | 7013 | 13.0% (912) | 36.4% (2553) | 50.6% (3549) | ||
| Snow | 5998 | 13.7% (822) | 35.7% (2141) | 50.6% (3035) | ||
| Westbound | Clear | 6049 | 13.8% (835) | 35.6% (2153) | 50.6% (3061) | |
| Rain | 6169 | 13.5% (833) | 36.5% (2252) | 50.0% (3085) | ||
| Snow | 5318 | 16.2% (862) | 36.6% (1946) | 47.2% (2510) | ||
| Weekends | Eastbound | Clear | 6203 | 5.6% (347) | 53.6% (3325) | 40.8% (2531) |
| Rain | 6675 | 6.4% (427) | 50.1% (3344) | 43.5% (2904) | ||
| Snow | 5147 | 7.6% (391) | 52.7% (2712) | 39.8% (2049) | ||
| Westbound | Clear | 6625 | 5.5% (364) | 53.2% (3525) | 41.3% (2736) | |
| Rain | 6982 | 5.4% (377) | 50.3% (3512) | 44.3% (3093) | ||
| Snow | 5345 | 6.7% (358) | 54.9% (2934) | 38.4% (2052) | ||
| Day of Week | Direction of Travel | Weather Type | Traffic Parameters | |||
|---|---|---|---|---|---|---|
| Volume (Number of Cars) | Home-Based Work Percentage (Volume) | Home-Based Other Percentage (Volume) | Non-Home-Based Percentage (Volume) | |||
| All Days | Eastbound | Clear | 7624 | 21.4% (1632) | 43.4% (3309) | 35.2% (2684) |
| Rain | 7591 | 20.9% (1587) | 42.4% (3219) | 36.7% (2786) | ||
| Snow | 6898 | 23.0% (1587) | 43.1% (2973) | 34.0% (2345) | ||
| Westbound | Clear | 4607 | 13.4% (617) | 46.0% (2119) | 40.6% (1870) | |
| Rain | 4657 | 13.9% (647) | 43.8% (2040) | 42.3% (1970) | ||
| Snow | 4139 | 14.9% (617) | 47.4% (1962) | 37.7% (1560) | ||
| Weekdays | Eastbound | Clear | 8403 | 27.1%(2277) | 38.0% (3193) | 34.8% (2924) |
| Rain | 8147 | 25.6% (2086) | 38.8% (3161) | 35.6% (2900) | ||
| Snow | 7829 | 29.4% (2302) | 37.1% (2905) | 33.5% (2623) | ||
| Westbound | Clear | 4878 | 16.7% (815) | 41.8% (2039) | 41.5% (2024) | |
| Rain | 4690 | 17.1% (802) | 40.8% (1914) | 42.1% (1974) | ||
| Snow | 4337 | 18.9% (820) | 42.6% (1848) | 38.5% (1670) | ||
| Weekends | Eastbound | Clear | 5673 | 7.1% (403) | 57.0% (3234) | 35.9% (2037) |
| Rain | 5961 | 7.4% (441) | 52.7% (3141) | 39.9% (2378) | ||
| Snow | 4769 | 8.2% (391) | 56.7% (2704) | 35.1% (1674) | ||
| Westbound | Clear | 3928 | 5.3% (208) | 56.6% (2223) | 38.1% (1497) | |
| Rain | 4561 | 4.8% (219) | 52.5% (2395) | 42.7% (1948) | ||
| Snow | 3686 | 5.9% (217) | 58.3% (2149) | 35.9% (1323) | ||
Disclaimer/Publisher’s Note: The statements, opinions and data contained in all publications are solely those of the individual author(s) and contributor(s) and not of MDPI and/or the editor(s). MDPI and/or the editor(s) disclaim responsibility for any injury to people or property resulting from any ideas, methods, instructions or products referred to in the content. |
© 2023 by the authors. Licensee MDPI, Basel, Switzerland. This article is an open access article distributed under the terms and conditions of the Creative Commons Attribution (CC BY) license (https://creativecommons.org/licenses/by/4.0/).
Share and Cite
Elyoussoufi, A.; Walker, C.L.; Black, A.W.; DeGirolamo, G.J. The Relationships between Adverse Weather, Traffic Mobility, and Driver Behavior. Meteorology 2023, 2, 489-508. https://doi.org/10.3390/meteorology2040028
Elyoussoufi A, Walker CL, Black AW, DeGirolamo GJ. The Relationships between Adverse Weather, Traffic Mobility, and Driver Behavior. Meteorology. 2023; 2(4):489-508. https://doi.org/10.3390/meteorology2040028
Chicago/Turabian StyleElyoussoufi, Ayman, Curtis L. Walker, Alan W. Black, and Gregory J. DeGirolamo. 2023. "The Relationships between Adverse Weather, Traffic Mobility, and Driver Behavior" Meteorology 2, no. 4: 489-508. https://doi.org/10.3390/meteorology2040028