

No City Left Behind: Building Climate Policy Bridges between the North and South


Institute of Urban Planning and Geography, Grenoble Alpes University, 38000 Grenoble, France
Meteorology 2023, 2(3), 403-420; https://doi.org/10.3390/meteorology2030024
Submission received: 19 April 2023
/
Revised: 14 August 2023
/
Accepted: 29 August 2023
/
Published: 5 September 2023
(This article belongs to the Special Issue Early Career Scientists' (ECS) Contributions to Meteorology (2023))
Abstract
:Cities are progressively heightening their climate aspirations to curtail urban carbon emissions and establish a future where economies and communities can flourish within the Earth’s ecological limits. Consequently, numerous climate initiatives are being launched to control urban carbon emissions, targeting various sectors, including transport, residential, agricultural, and energy. However, recent scientific literature underscores the disproportionate distribution of climate policies. While cities in the Global North have witnessed several initiatives to combat climate change, cities in the Global South remain uncovered and highly vulnerable to climate hazards. To address this disparity, we employed the Balanced Iterative Reducing and Clustering using the Hierarchies (BRICH) algorithm to cluster cities from diverse geographical areas that exhibit comparable socioeconomic profiles. This clustering strives to foster enhanced cooperation and collaboration among cities globally, with the goal of addressing climate change in a comprehensive manner. In summary, we identified similarities, patterns, and clusters among peer cities, enabling mutual and generalizable learning among worldwide peer-cities regarding urban climate policy exchange. This exchange occurs through three approaches: (i) inner-mutual learning, (ii) cross-mutual learning, and (iii) outer-mutual learning. Our findings mark a pivotal stride towards attaining worldwide climate objectives through a shared responsibility approach. Furthermore, they provide preliminary insights into the implementation of “urban climate policy exchange” among peer cities on a global scale.
1. Introduction
The Earth’s climate system is exceptionally intricate. To simplify this complexity and exert influence over the climate system, it is imperative for anthropogenic activities to curtail their carbon emissions into the atmosphere. This aligns with the guidance outlined in successive publications of the IPCC Reports on “Mitigation of Climate Change” [1]. Nonetheless, the effectiveness of climate mitigation actions is progressively acknowledged within the context of cities [2,3,4]. Following the COP21 in Paris, cities have emerged as a central focal point for policymakers aiming to formulate climate mitigation actions [5,6]. At the current state, cities generate 80% [7,8] of GHG emissions, of which 70% are CO2 [9,10]. However, while cities of the Global North are very well documented, cities of the Global South mitigation and adaptation profile remain fuzzy and lack generalizability [11,12].
To put the regional climate measures into perspective, it is imperative to acknowledge two key points. On the one hand, the recent IPCC Assessment Report forecasts that a significant portion of future urban population growth will transpire in developing countries, where per capita emissions are currently comparably low. Nevertheless, these emissions are projected to rise due to urbanization, infrastructure expansion, and shifts in affluence and lifestyle trends [1]. On the flip side, cities in the Global South, particularly those in Africa and Asia, bear the brunt of the impact of climate change [13]. Therefore, cities in the Global South should equally prioritize (i) proactive measures to mitigate future carbon emissions and (ii) strategies to adapt their urban dynamics to the repercussions of climate change. Unfortunately, even with the recent advancements in climate policies encompassing both mitigation and adaptation, only cities in the Global North undergo such evaluations. Meanwhile, cities in the Global South appear to be lagging behind. In order to balance the climate action equation between cities of the Global North and those of the Global South, we identify peer-cities (or twin cities: cities that share similar local dynamics profiles and can collaboratively initiate comparable policies through a process referred to as mutual learning [14,15]). This approach aims to expedite the reduction of global carbon emissions and hasten the global ecological transition.
The identification of peer cities has been a focal point of comprehensive studies across various fields of research. For instance, in examining (i) local policy optimization, Larsen et al. (2020) used a statistical method utilized by the City of Boise and the Idaho Policy Institute (IPI) to determine the set of peer cities in order to help the City Department standardize their research on comparable cities and incorporate the lessons learned from these towns into operational and policy choices across the City government [15]. (ii) Managing transport systems: Schaller (2005) studied 118 cities in the U.S. to explore primary demand factors for mobility; the author suggested that their results can be used to determine peer cities for additional comparison and analysis, and it can also be used to direct regulators in determining changes in local demand for cab service [16]. (iii) Evaluating cities’ settings: George et al. (2016) introduced the Industrial City Initiative (ICI)—300 Peer Cities Identification Tool, which measures services and amenities in cities belonging to the U.S. in order to meet the divergent and changing pattern of citizens and provide practical solutions [14]. The authors highlight that actions usually are context-specific; however, despite the cities’ contextual differences, the rise of data-related studies has shown that cities often share significant commonalities using demographic and socioeconomic data. As a result, the tool was developed by the Community Development and Policy Studies (CDPS) Division of the Federal Reserve Bank of Chicago as an instrument for policymakers and practitioners that can help in understanding how a municipality compares against other cities. (iv) Predicting and controlling crimes: Palmiotto and Janeksela (2000) used comparative research of eight crime indexes and three other composite indexes to study the criminal behavior in five U.S. peer cities [17]. (v) Exploring alternative modes of urban governance: Powell (2016) exposed several scenarios based on the geodemographic pattern; the author displayed the “best” approaches to building a geodemographic and how they can be assessed to seek new governance formulas at the urban scale [18]. (vi) Proposing water-food-energy knowledge transfer: Hachaichi and Egeiya (2023) designed a protocol to increase city-to-city cooperation and collaboration in managing essential urban resources (water–food–energy nexus) between cities of the Global North and Cities of the Global South [19], and (vii) examining the feasibility of cross-city innovation transfer: Wang and Bai (2022) examined the Australian Capital Territory’s ability to adopt a successful food waste management system created in Milan [20]. Indeed, Wang and Bai (2022) argue that cross-city policy transfers deserve more attention in the scientific literature, especially to foster urban systems innovation and ecological transition.
Despite the wide recognition of “peer-cities” methods in different disciplines and research domains. The realm of climate change appears to have overlooked the potential of this approach to drive swift systemic change and significantly reduce urban carbon emissions. It is essential to underscore that there have been endeavors to compile a catalog of climate policies [21] initiated by the Grantham Research Institute on Climate Change and the Environment, Sabin Center for Climate Change Law, New Climate Institute, and International Energy Agency [21] alongside to the review of a sample of climate policies as discussed in [21,22,23]. Nonetheless, these studies primarily concentrate on tallying climate policy instruments based on sector and measure types without necessarily advocating for the practice of policy exchange from North to South (or vice versa, North-to-North, South-to-South). Consequently, these studies are somewhat restricted in terms of embracing the “peer-cities” rationale and the application of “mutual/transfer learning approaches” that could have the potential to expedite the process of addressing climate change. Hence, our objective is to offer preliminary insights into the identification of peer cities through a data-driven approach and to initiate an understanding of the potential for climate change policy transfer.
The identification and clustering of peer cities on a global scale can enhance city-to-city comparison and cooperation in mitigating urban carbon emissions. This does not just facilitate collaboration between cities in the Global North but also expands the potential for collaboration across various combinations, including North-to-South, North-to-North, and South-to-South. A plethora of multi-scalar programs for cooperation and collaboration in mitigating urban carbon emissions have been undertaken in developed cities. On the one hand, at the city level, we find Innovate 4 Cities [24], the Global Covenant of Mayors for Climate & Energy (GCMCE) [25], the International Council for Local Environment Initiatives (ICLEI), C40, the Global Parliament of Mayors (GPM), Carbon Neutral Cities Alliance (CNCA) [26], Non-state Actor Zone for Climate Action (NAZCA), Low-Carbon Cities (LCC), Smart & Low Carbon Cities (SLCC). On the other hand, in a sectoral approach, we find, for instance, for transportation: Cities Clean Bus Declaration (CCBD), the International Union of Railways (UIC), the Low-Carbon Sustainable Rail Transport Challenge (LCSRTL), Urban Electric Mobility Vehicles Initiative (UEMI), and Declaration on Climate Leadership (CDL). Yet, cities of the Southern Hemisphere are usually discounted from such programs [27]. Herein, we aim to set boundaries and cluster global cities. This allows cities in the Southern Hemisphere with constrained financial resources and less advanced urban intelligence programs to replicate the successful climate change policies and actions implemented by their peer-developed counterparts, particularly in Africa [28], as Castan and Bulkeley (2013) emphasized that such exchange initiatives could have a positive rebound effect on the global sustainability—“experimentation, iteration, and sharing success stories will be key to this process” [29].
The novelty of this study lies in its pioneering effort to establish a climate science bridge between Northern and Southern cities (peer cities). The aim is to facilitate the reduction of urban greenhouse gas emissions by enabling cities in the Global South to replicate policies and actions from their counterparts in the Global North. This adaptation is crucial for aligning their urban dynamics with the challenges posed by climate change, encompassing both mitigation and adaptation measures. The analysis covers almost all global urban areas (24, 110 cities with their respective climate footprint expressed in tones CO2 per cap/year) and uses a Balanced Iterative Reducing and Clustering using Hierarchies (BRICH) algorithm to cluster peer cities based on their socioeconomic dynamics, regardless of their geographical location. The socioeconomic dataset is augmented with a climate policies dataset including 5452 mitigation measures and 544 adaptation measures in different sectors, including land use with 100 measures, air pollution with 170, economic development with 131, energy security with 121, energy access with 109, water with 37 and food security with 19 measures. See summary statistics Table A1 and Table A2 in Appendix A for further details.
While the utilization of similar socioeconomic profiles to enhance cities’ cooperation and collaboration in addressing climate change, this study has two main caveats:
- (1)
- The mere presence of shared socioeconomic profiles among certain cities (peer cities) does not adequately account for the presence or absence of effective climate policies. Socioeconomic profiles significantly influence policy-making processes and priorities within cities. Cities with similar socioeconomic attributes often encounter comparable challenges and limitations in implementing climate policies, such as financial constraints, resource availability, technological capacities, and political dynamics. Analyzing cities with shared socioeconomic profiles sheds light on how these commonalities affect climate policy formulation and implementation. This examination reveals patterns, trends, and potential obstacles stemming from socioeconomic factors. However, it is crucial to recognize that socioeconomic profiles alone do not fully explain effective climate policies. Political engagement, public awareness, stakeholder involvement, institutional capacity, and external pressures also hold vital roles. The study acknowledges the limitations of solely focusing on socioeconomic profiles and underscores the necessity for a comprehensive analysis incorporating multiple factors to grasp the complexity of climate policy effectiveness.
- (2)
- While having climate policies in place is crucial, the actual implementation of these policies holds even greater importance. The transfer of implementation strategies and best practices is essential, possibly surpassing the significance of policy transfer itself. Understanding how to execute climate policies effectively demands careful consideration of local contexts, institutional capabilities, political dynamics, public involvement, and other region-specific factors. Thus, a comprehensive approach extending beyond policy formulation becomes imperative. This approach should encompass tactics for enhancing capacity, involving stakeholders, establishing monitoring and evaluation mechanisms, and overcoming implementation barriers. It underscores that achieving favorable outcomes from climate policies hinges not solely on their existence but equally on the successful translation of those policies into concrete actions and measurable results.
Incorporating these considerations into future analyses will yield a more nuanced comprehension of the complexities and possibilities linked to the implementation of climate policies. This will result in a more precise and comprehensive assessment of the variables influencing the success or lack thereof in climate policy efficacy within diverse cities and countries.
2. Method and Materials
In Section 2.1, we detail the data collection and pre-processing procedures, while in Section 2.2, we elaborate on the data processing steps and the methodology employed to identify peer cities on a global scale.
2.1. Data Collection and Pre-Processing
2.1.1. Data Collection for Virtual Carbon Emissions
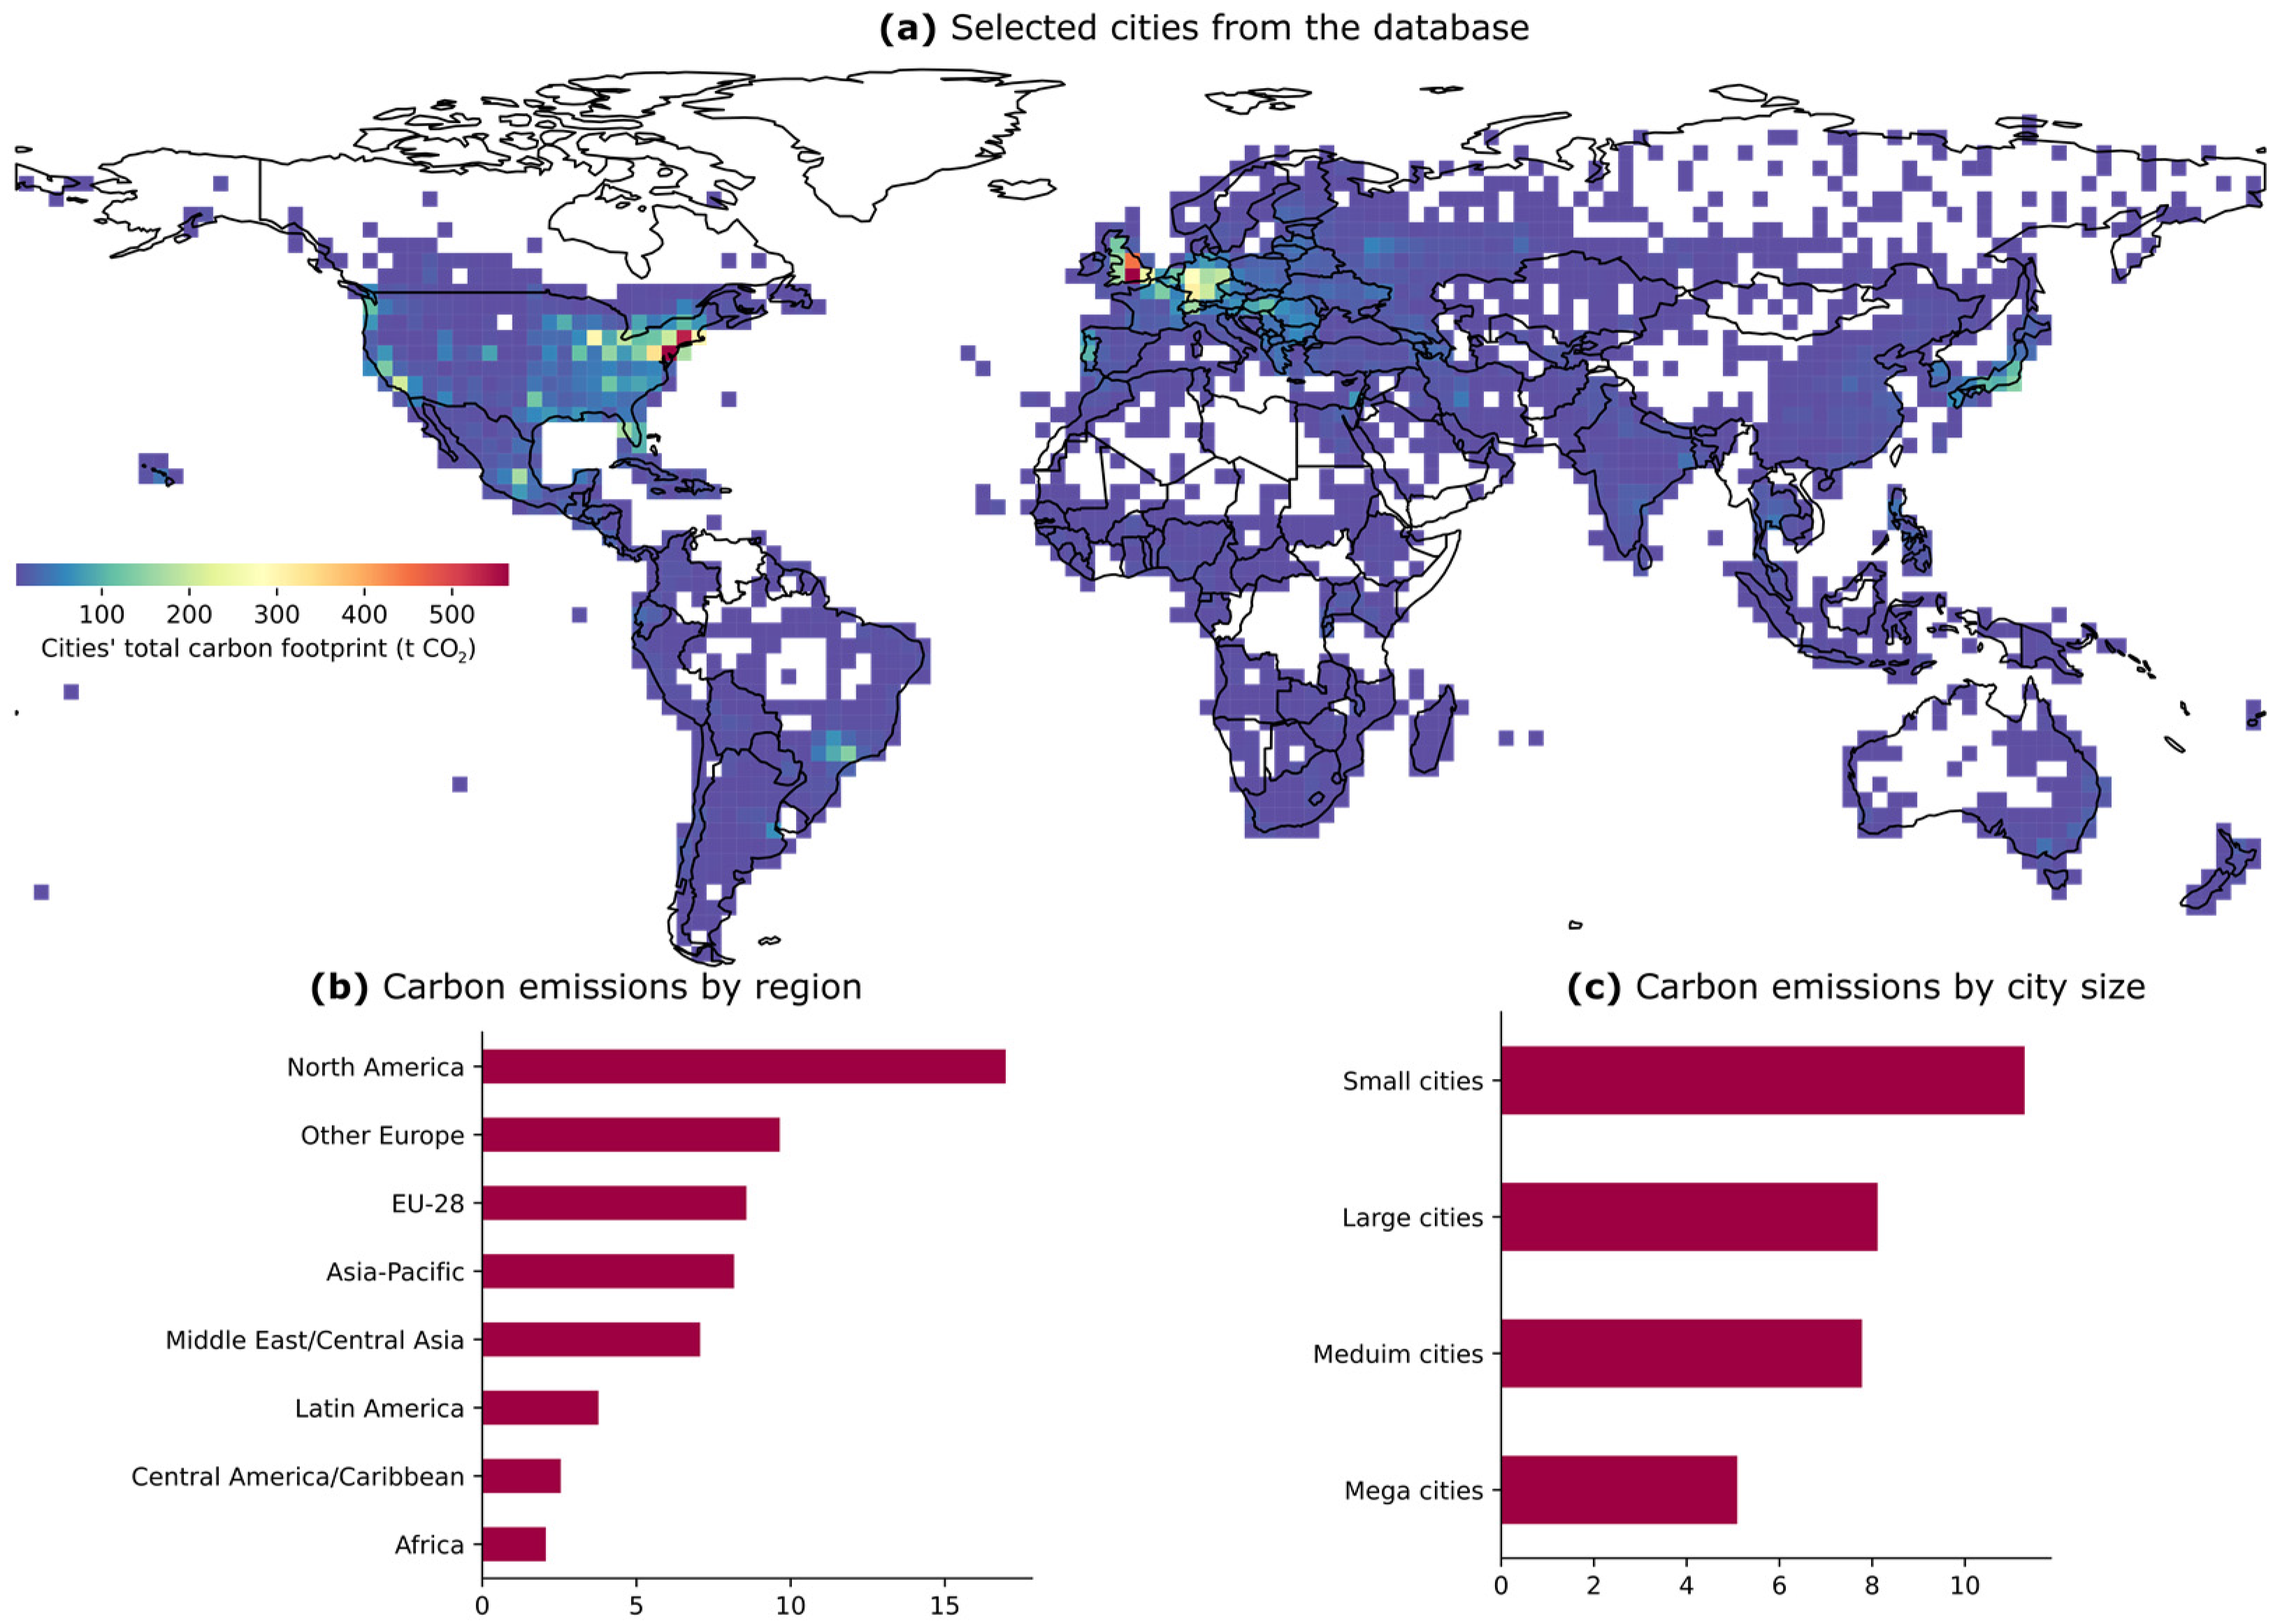
We gathered data from the most comprehensive database concerning cities’ virtual carbon emissions that covers all the regions of the globe, as published in the “Urban Climate” journal [30]. The dataset primarily comprises urban areas from North America (40%), followed by the European Union (24%), Asia-Pacific (13%), Other Europe (8%), Latin America (6.5%), Africa (5%), and Middle East/Central Asia (4%) (Figure 1). It is essential to note that the database is not entirely conclusive for the African and Latin American continents, as the reported number of urban areas may be lower than actual. Additionally, due to geopolitical circumstances in certain countries (e.g., Libya), data were unavailable. For the purpose of ensuring uniformity across all indicators and urban areas, we made the decision to omit countries that were not fully compatible (where one or more indicators contained missing values). Notice that the availability of climate data is a significant topic, as recently highlighted in the IPCC’s Sixth Assessment Report, where scientists acknowledged that “Through there has been a rapid rise in quantification and analysis of urban emissions, gaps remain in comprehensive global coverage, particularly in the Global South, and reliance on standardized frameworks and systematic data is lacking” [31]. Despite these limitations, the dataset is regarded as the most robust and comprehensive to date, encompassing cities from both the Northern and Southern hemispheres.
2.1.2. Data Collection for Urban Climate Policy
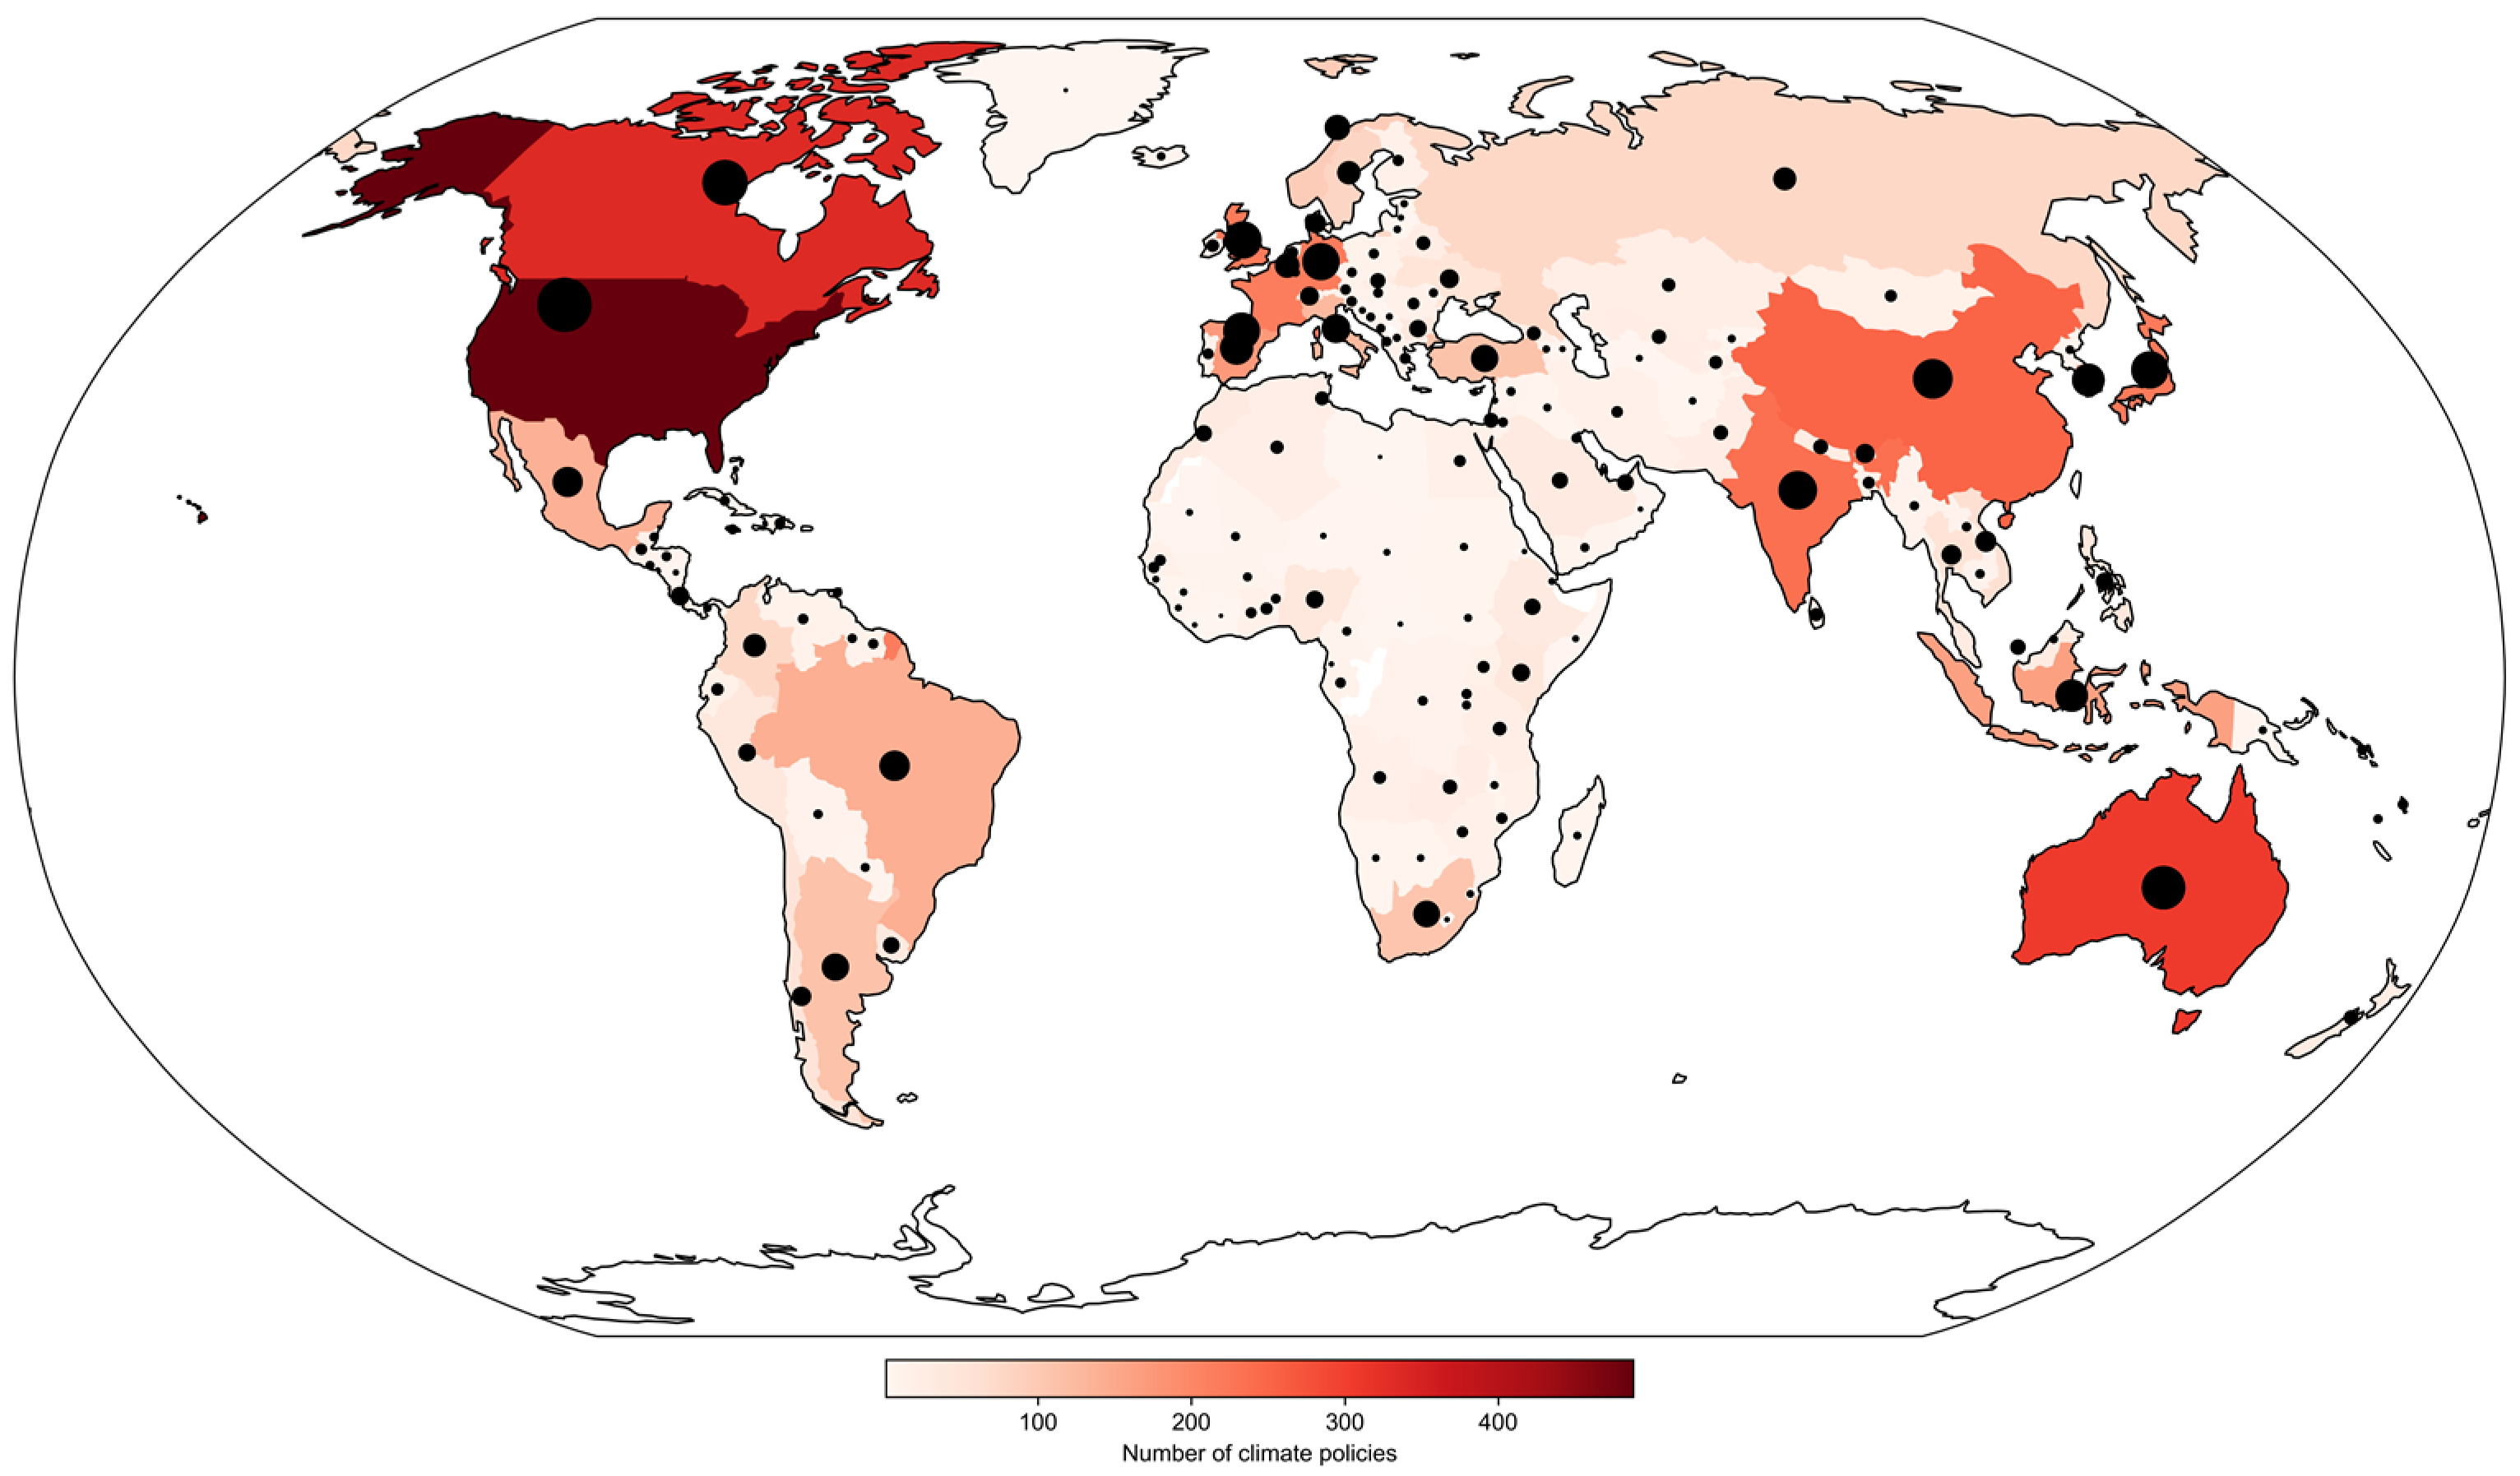
Information about climate mitigation policies executed at different levels (national, subnational, and city levels) as a component of the Intended Nationally Determined Contributions (INDCs) submitted to the UNFCCC [32] is sourced from the Climate Policy Database [33]. This database seeks to aggregate data on climate policies and evaluate them using a policy matrix that encompasses an extensive array of regulations for mitigating greenhouse gas (GHG) emissions (Figure 2). It is crucial to highlight that the analysis exclusively encompasses operational policies, omitting planned policies. The database spans 199 countries, encompassing 5363 policies at the national level, 279 at the sub-national level, and 50 at the city level, distributed across seven sectors.
2.2. Method
To identify peer cities, we used an unsupervised machine-learning algorithm to trigger peer cities worldwide. The Balanced Iterative Reducing and Clustering using Hierarchies (BRICH) algorithm was selected. BRICH is an unsupervised hierarchical clustering algorithm that is efficient with large datasets [34]. Considering the size of our database, BRICH’s advantage is its capacity to dynamically and progressively cluster multi-dimensional metric data points, striving to achieve the highest possible clustering quality. It is important to stress that the BRICH algorithm is highly efficient compared to, for instance, the Density-based spatial clustering of applications with noise (DBSCAN) [35].
The efficiency of BRICH returns to its decision algorithm that is established without analyzing all the existing clusters and data points. It takes advantage of the notion that not all data points are equally relevant and that the data space is typically not uniformly distributed [36]. Such a decision process can considerably reduce the I/O (input/output) operations and hence memory consumption computational capacity (CPU/GPU).
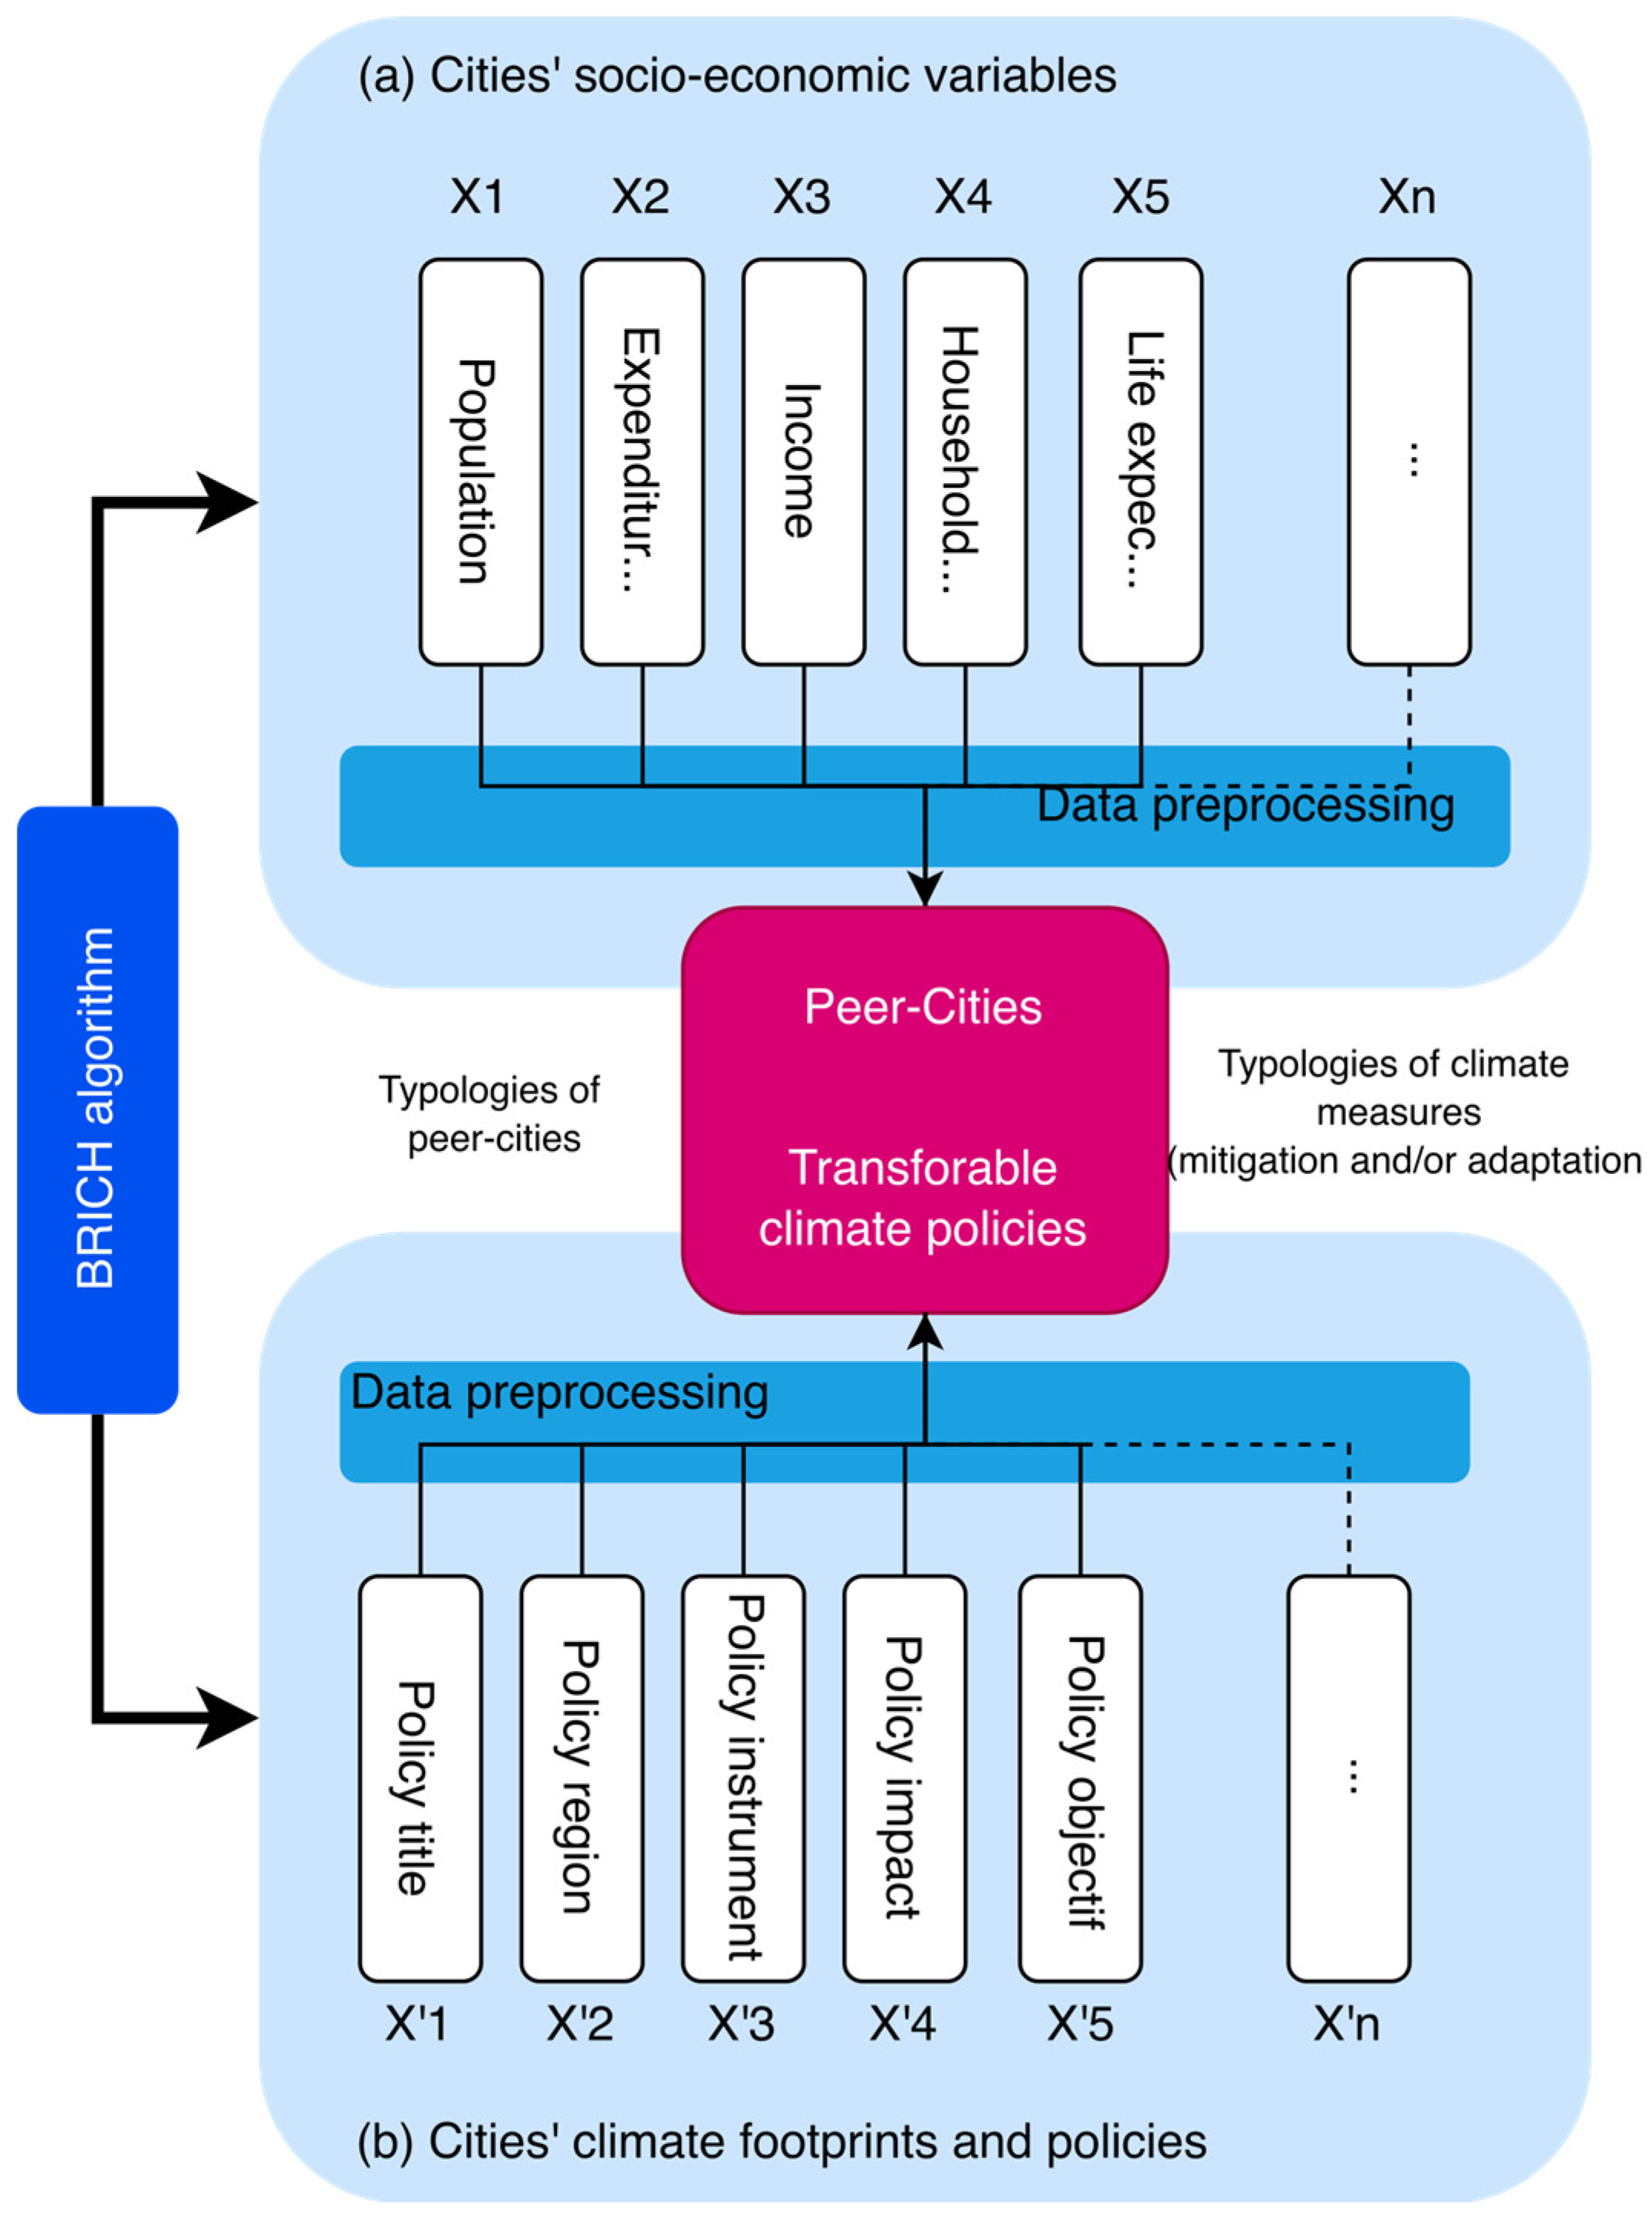
The BRICH feeds on dataset and a number of desired clusters. BRICH algorithm first performs a clustering feature tree (Equation (1)) out of the dataset. The height-balanced tree consists of the following:
where
represents the linear sum and is computed as shown in Equation (2):
represents the square sum and is computed as shown in Equation (3):
Using the Clustering Features (CF), we can compute useful statistics such as cluster centroid as shown in Equation (4):
Cluster radius as shown in Equation (5):
Cluster diameter as shown in Equation (6):
Overall, our holistic approach is summarized in the following diagram (Figure 3):
The database is available in the Electronic Supplementary Information (ESI) file (https://zenodo.org/record/8318173) for further analysis and investigation by the scientific community.
3. Results and Discussion
In Section 3.1, we present results for peer city identification, and in Section 3.2, we present major targeted sectors and associated relevant policies.
3.1. Urban Climate Clusters: Identifying Peer Cities
Peer cities are cities that share similar attributes regardless of geographical location; in our study, we identified 11 clusters of peer cities worldwide (Figure 4). The most dominant cluster (by the number of cities belonging to this cluster) is “Cluster 2” with 7693 cities. This cluster is dominated by cities from North America, with a percentage estimate of 99.6%. The second biggest cluster is “Cluster 3” with 3407 cities. This cluster is dominated by European cities (From the Union European) with a share estimated at 76%, followed by Asian Pacific cities with a share estimated at 20%, and African Cities at 3.4%. “Cluster 0” accounts for 2266 cities. This cluster is composed of Other European cities with a share of 52%, Asian Pacific cities with a share estimated at 40%, and Middle Eastern cities with a share of 4.8% (see Table A3 in Appendix A for further details for all clusters).
From a climate responsibility perspective (Table 1), Results showed that while cities belonging to “Cluster 9” are associated with the highest carbon footprint per capita, climate mitigation efforts would be more effective in Clusters 2, 6, 0, and 7 as they contain more cities with relatively higher carbon footprints.
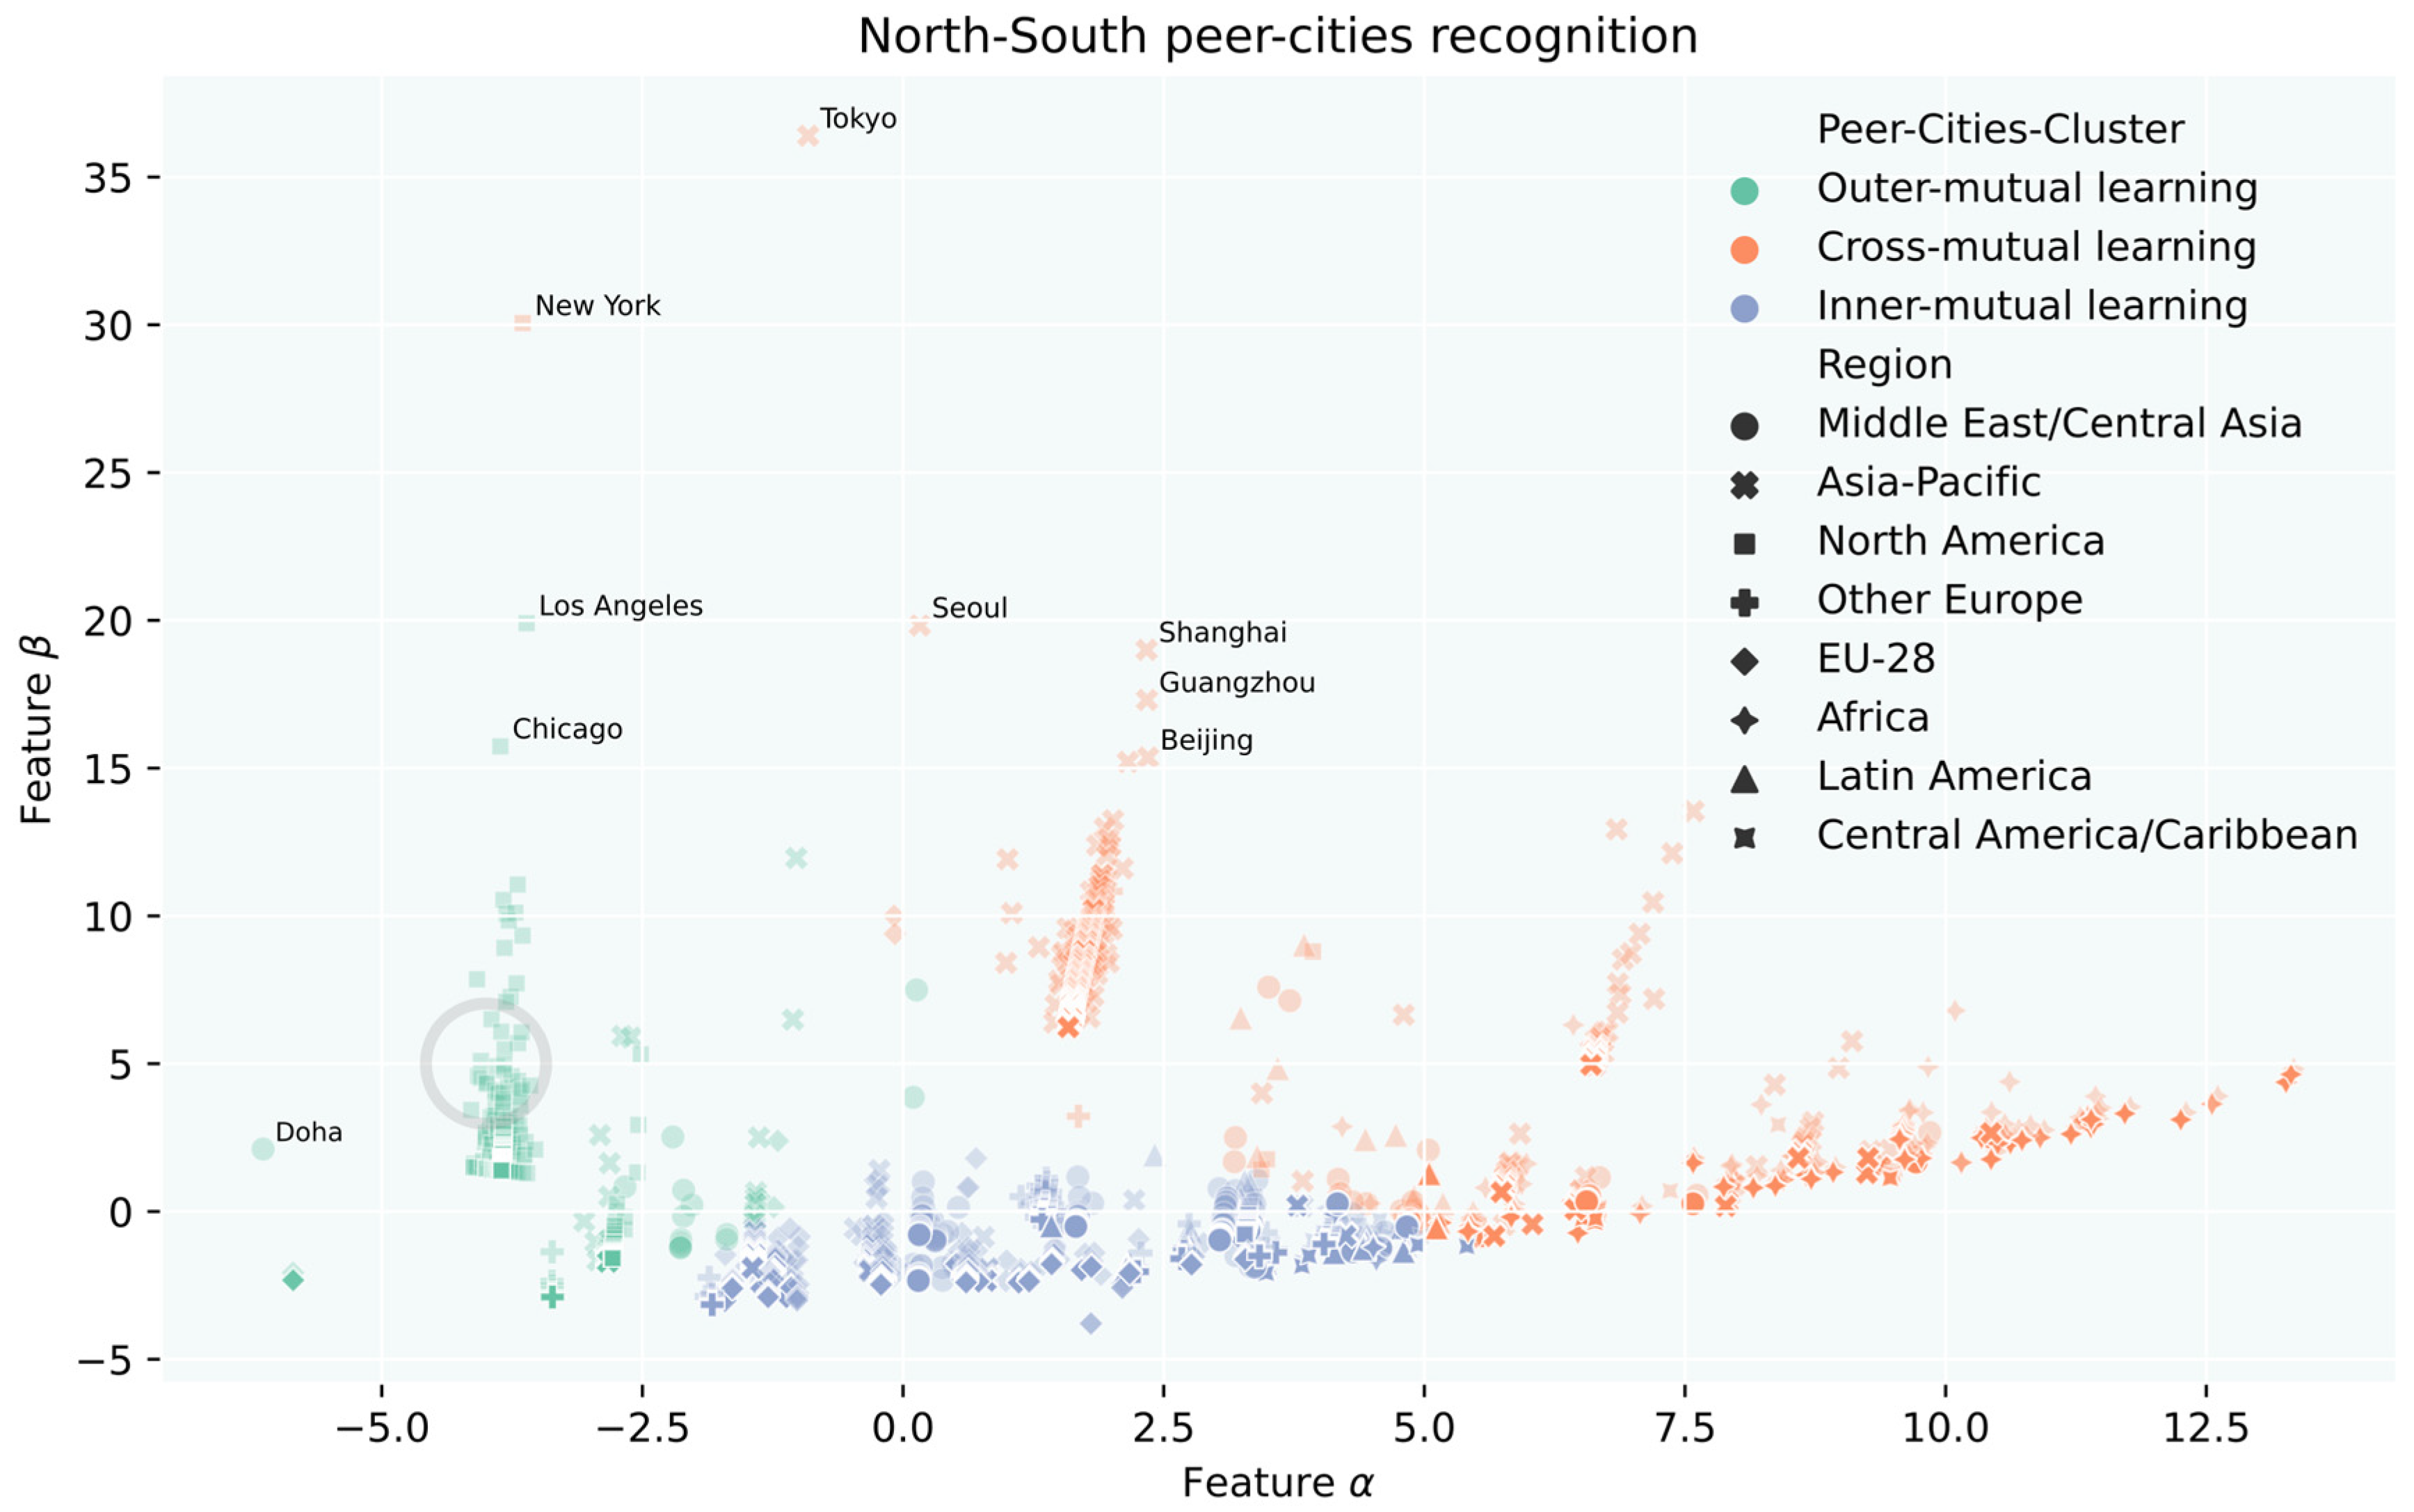
As depicted in Figure 5, we discern four predominant patterns in the identification of peer cities. Firstly, the vast majority of both large and small cities in North America exhibit similar behavior. This implies that small and large American cities can indeed be regarded as peer cities, fostering inner-mutual learning in terms of effective urban policies for curtailing greenhouse gas emissions.
Secondly, this pattern extends to small and large Asian cities, which can also engage in concurrent learning to reduce urban carbon emissions through inner-mutual learning.
Thirdly, the scenario involves small and large African cities learning from and emulating the urban climate policies of small Asian cities. This learning is influenced, to a lesser extent, by small Middle Eastern cities, a dynamic termed outer-mutual learning.
Lastly, a fourth pattern emerges where select small Asian cities, small cities within the European Union (EU-28), small Latin American cities, and medium-sized cities in the Middle East form a cluster of peer cities. These entities can establish mutual learning platforms concerning urban climate policies, constituting cross-mutual learning.
However, it is important to note that this clustering approach has limitations. It doesn’t consider the sectoral breakdown of each city’s carbon footprint by major final consumption sectors such as transport, construction, food, healthcare, education, and services. Incorporating such granular data could potentially offer a much more context-specific framework for comprehensive learning among peer cities.
Table 2 shows that outer-mutual learning cities are associated, on average, with the highest carbon footprint estimated to be 17.97 ± 1.10 t CO2 per cap/year. Followed by inner-mutual learning with 7.85 ± 2.82 t CO2 per cap/year and by cross-mutual learning with 3.53 ± 3.18 t CO2 per cap/year. Results suggest that transfer policies should focus on small cities from the outer-mutual learning and inner-mutual learning groups, as they represent a share of 97% and 95% of cities, respectively. On the other hand, for cross-mutual learning mitigation/adaptation measures, transfer should focus on medium and large cities as they represent a share of 18% and 14% but are associated with the highest climate footprint estimate to 5.45 ± 3.31 t CO2 per cap/year, and 6.79 ± 3.55 t CO2 per cap/year, respectively. Our results corroborate other studies, especially results reported in [30], where the author highlights the necessity of adding cities of the Global South to the global sustainability equation in order to rapidly cut urban carbon emissions and the study established by [12] where the author highlights the importance of carbon emissions in medium and large cities (despite of their share of the total human population). In addition, our study also recognizes the climate responsibility of cities of the Global South, as reported and highlighted in [11].
Several studies seeking to synthesize the bottom-up knowledge on climate change (in the form of policies) have already started taking place in the scientific literature, such as found in [37] that uses a meta-analysis to simulate new collaboration and coordination in increasing the urban adaptation planning across the U.S cities. In Asian cities, [38] the authors gathered the local climate actions, policymakers’ networks, and main mechanisms for exchange to other potential peer cities. While these studies are relevant, they remain limited in terms of scope as they focus only on a limited spatial frame, whether only on cities of the U.S. or Asian/European cities. We believe that tackling climate change should be via a shared responsibility approach and that no city should be left behind, whether in adaptation or mitigation measures. Henceforth, our study amplifies the scale of existing climate policies and builds rigid bridges between cities to join forces and share skills and efforts to tackle climate change holistically and in a shared responsibility paradigm.
3.2. Urban Climate Policies: Building Policy Bridges between Peer Cities
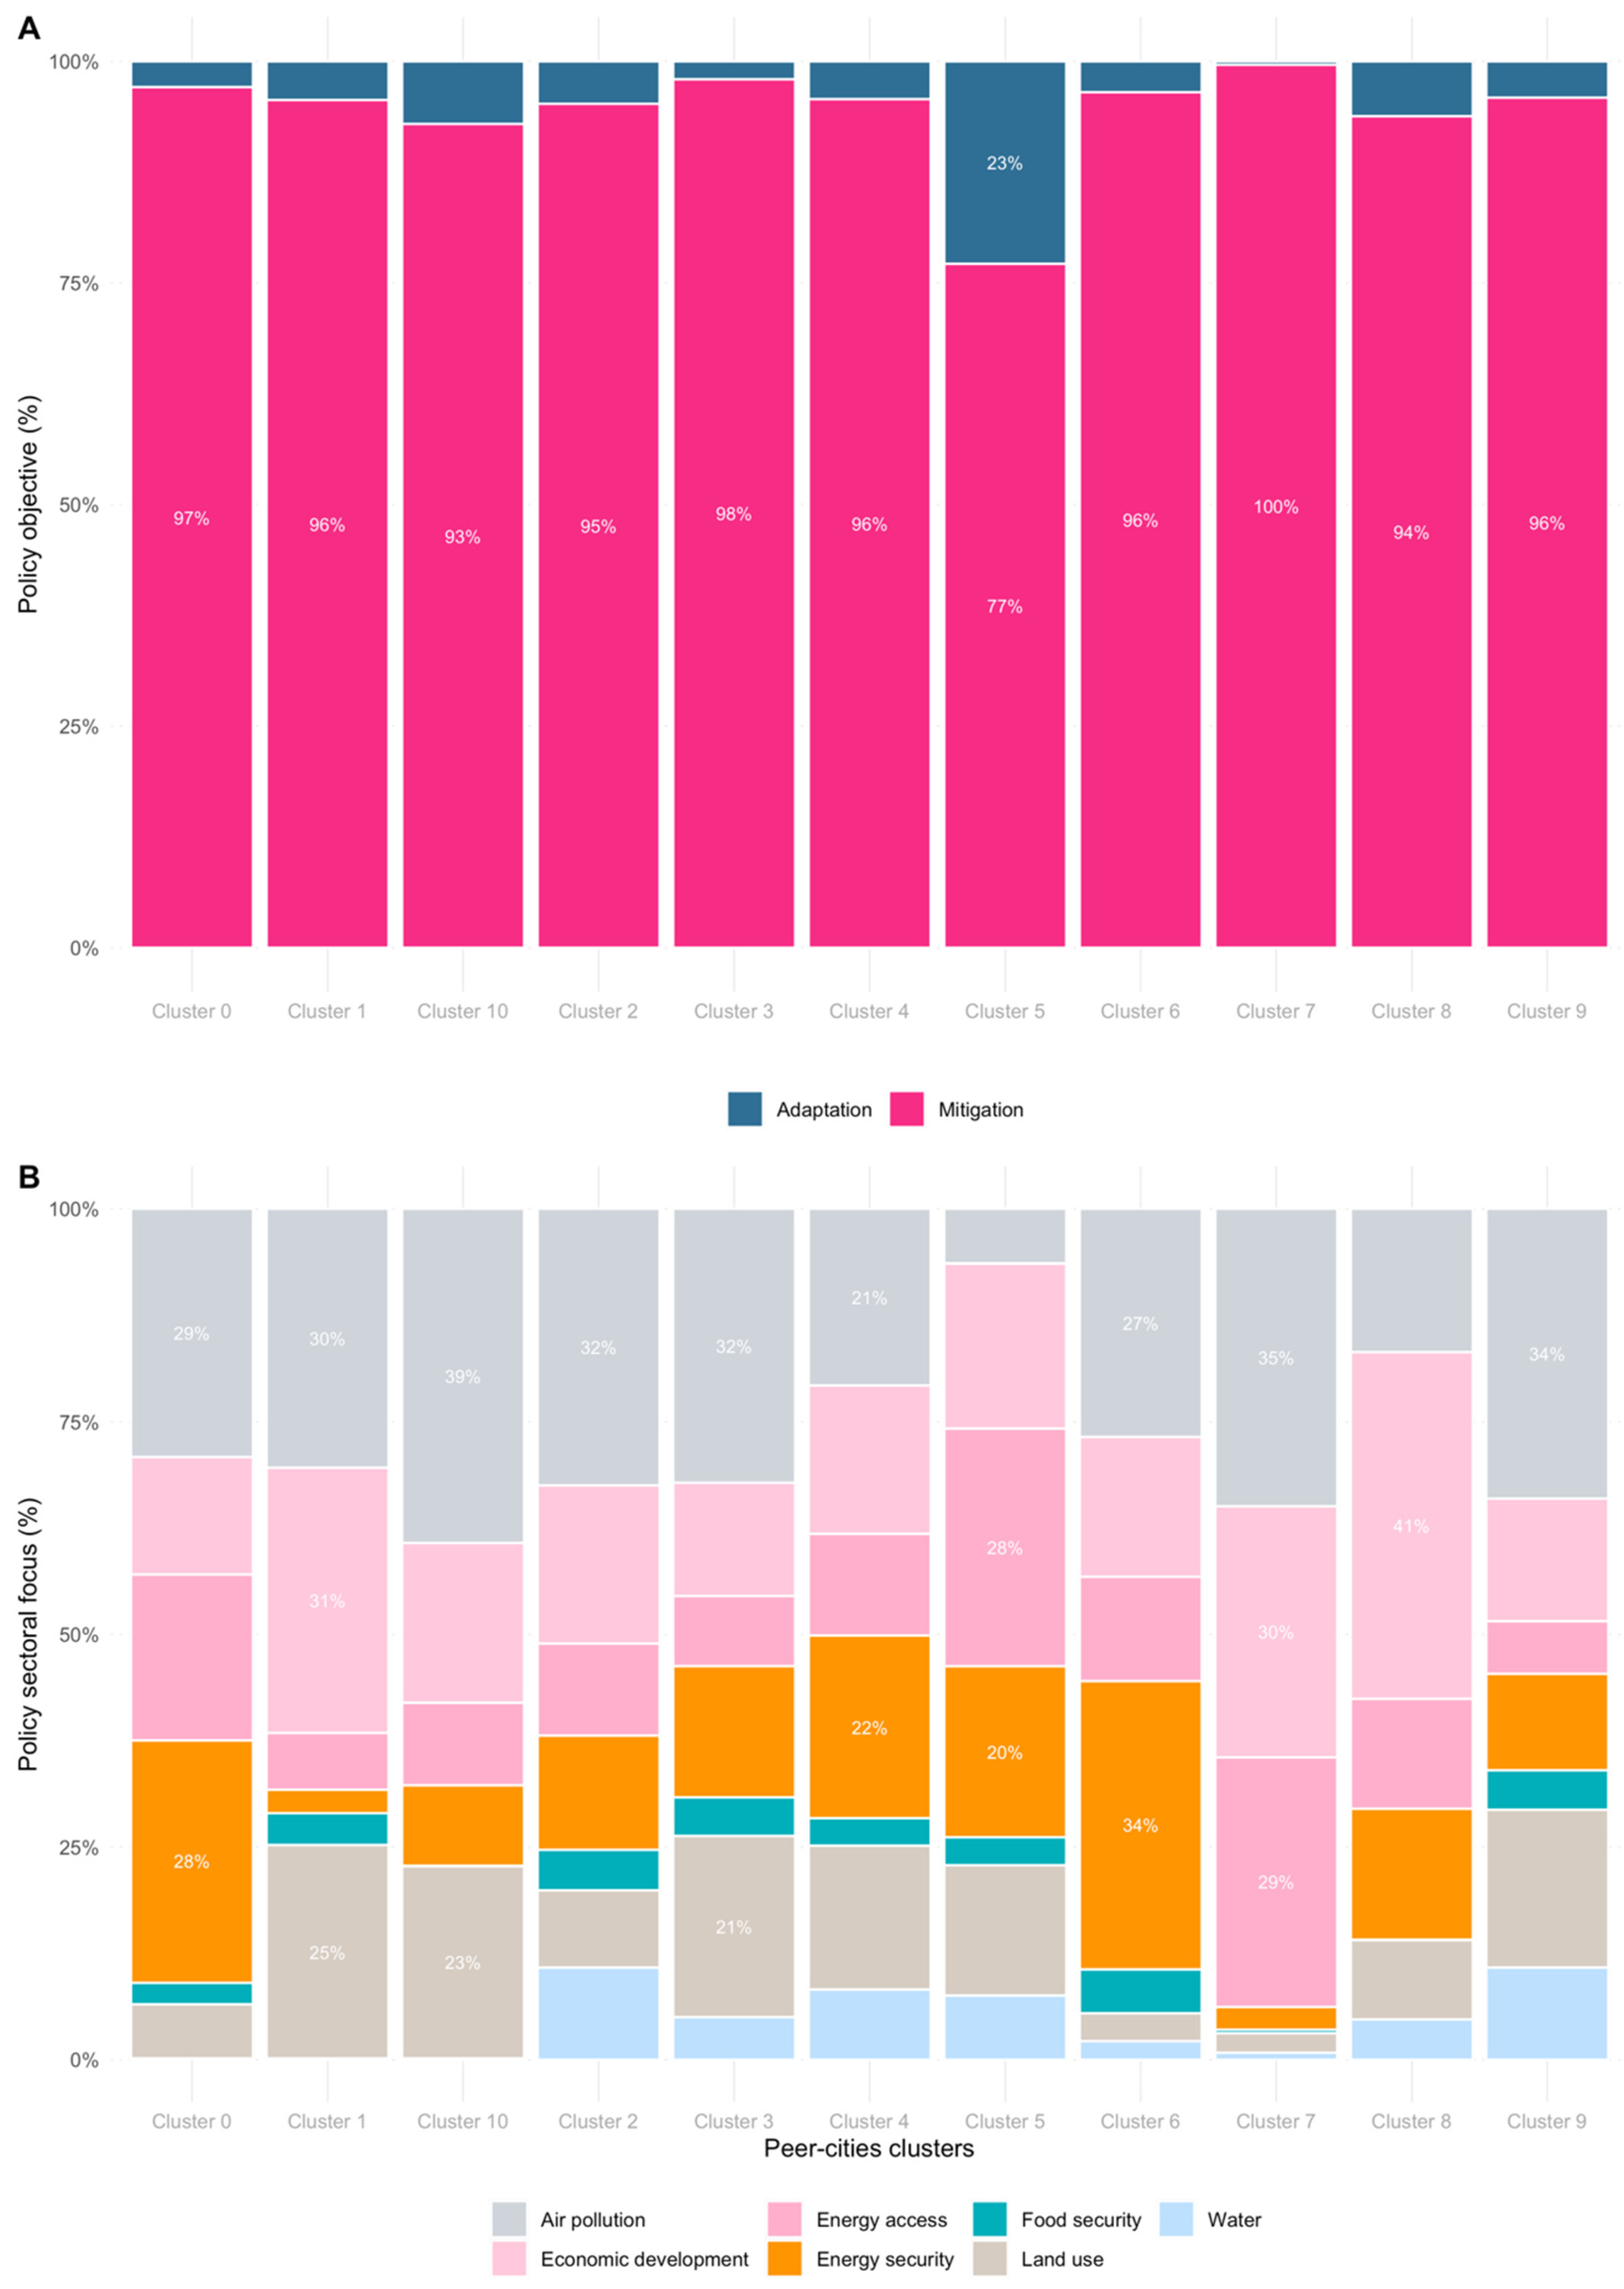
According to Figure 6, climate policy exchange is more centered around mitigation actions (cutting GHG emissions) across the different clusters and regions. Overall, mitigation actions/policies represent a share, across all cities, of 96.9%, while adaptation policy measures account for 3%—except for cities belonging to cluster 5, where they are more likely also to share adaptation measures.
From a regional perspective, and considering the database’s handicaps, African cities can exchange climate change policies from peer cities. These policies are reaggregated into 82.6% to be mitigation policies/actions and 17.3% for adaptation policies/actions. Asian-Pacific cities are also more likely to exchange mitigation policies (96.3%) and adaptation policies (3.6%). Cities belonging to the European Union (EU) should invest (99%) in mitigation policies and (1%) in adaptation strategies, as European cities are associated with a higher climate footprint per capita compared to other regions [39]. Latin American cities with the same categorical magnitudes can invest more in mitigation policies (94.5%) and climate adaptation policies (5.5%). Without exception, cities belonging to the Middle East should also invest in mitigation actions (93%) as they are considered to have the highest climate footprint [9,40,41,42]; however, they should also invest in adaptation measures (6.6%). North American cities with similar magnitudes should also invest in mitigating their carbon footprint (96%) and initiating adaptation measures to climate change impacts (4.4%). Cities belonging to Other Europe (European countries that are outside of the European Union) should also invest in the mitigation of their carbon emissions (95%) and adapting to climate impacts (4.7%). With one major exception compared to all regions, cities belonging to Central America/Caribbean have higher adaptation measures (estimated to be 27%) compared to other regions as the region is particularly vulnerable to climate change impacts in forest management [43], food security [44,45], sea level rise [46,47], adapting aquaculture [48]. However, they also have to shrink their carbon emissions via mitigation actions (73%).
Our results showed that there is a regional bias in initiating climate strategies by category (whether mitigation or adaptation measures). Table 3 shows that African cities should focus on “Economic development” (with a share estimated at 30%), followed by “Energy access” (with 23.4%). On the other hand, Asian cities should focus more on “Air pollution” policies (with a share estimate to be 31%), followed by “Economic development” policies (19%). Similarly to Asian cities, European cities and North American cities should focus more on “Air pollution” (with 26% and 37%) followed by “Energy security” with 20% and 32%, respectively. South American cities have a particular focus on “Economic development” (32%) and “Land use” policies (29%). From a sectoral perspective, on the one hand, Africa has the highest share of “Water” and “Energy access” policies compared to other continents. In the African context, Cape Town (South Africa) was known as “Day Zero” in 2018, whereby the city became the first major city to run out of fresh water [27,49,50]. On the other hand, Latin America has the highest share in terms of “economic development” [51] policies and “land use” [52]. North American cities are associated with the highest share of policies in “air pollution” [53] and “energy security” [54].
It is noteworthy that not all climate policies (mitigation or adaptation) are transferable between cities because of context-specific attributes, along with the biases and maladaptations in practices. Therefore, in order to create a robust peer cities learning process, a “transfer-learning protocol” is based on two key components: (i) Case study selection (feasibility) and (ii) Case study location (geography). Such protocol could mitigate these challenges in the context of peer learning by integrating over eight strategies, as mentioned in Figure 7. The objective of this protocol is to enhance the exchange of knowledge and experiences among cities in a more efficient and impartial manner. It ensures that the process of peer learning is transparent, inclusive, and grounded in the most current scientific research. By adopting these strategies, cities can overcome obstacles, counteract biases, and facilitate well-informed decision-making in their endeavors to mitigate and adapt to climate change.
Furthermore, contextual knowledge plays a pivotal role in crafting and executing effective policies to tackle climate challenges. It is crucial to bridge knowledge gaps among cities to ensure successful knowledge transfer and capacity enhancement. Various mechanisms and frameworks exist to facilitate this process. (1) Establishing networks and partnerships: Urban centers have the opportunity to establish networks and alliances with other cities, organizations, and academic institutions. These cooperative endeavors facilitate the exchange of knowledge, enabling cities to glean insights from one another’s experiences. Such networks can also offer access to specialized expertise and resources, thereby augmenting the efficacy of capacity-building initiatives. (2) Peer-to-peer learning platforms: Establishing platforms for peer-to-peer learning empowers cities to exchange best practices, insights from lessons learned, and inventive solutions. These platforms, which can manifest as workshops, conferences, and virtual forums, offer direct engagement and knowledge dissemination among cities grappling with comparable challenges. (3) Mentoring programs: Mentoring programs, where seasoned cities offer guidance to those less experienced, prove to be remarkably impactful. Mentors provide technical support, share their know-how, and offer tailored guidance based on the unique requirements of mentee cities. This approach facilitates focused capacity enhancement and ensures that knowledge transfer is deeply rooted in real-world practice. (4) Knowledge repositories and databases: Centralized knowledge repositories and databases hold immense value for cities in search of insights into climate policies and methodologies. These repositories encompass case studies, policy materials, research discoveries, and technical directives. Their user-friendly accessibility and consistent updates render them potent instruments for disseminating knowledge and boosting capacity development. (5) Training and education programs: Crafting targeted training and educational initiatives customized to the requirements of cities can amplify capacity-building endeavors. These programs can span various domains, including climate science, policy formulation, data interpretation, and project administration. By imparting essential expertise and knowledge, these programs empower city authorities and stakeholders to effectively implement impactful climate policies. (6) International support and funding: International organizations, governments, and funding agencies wield pivotal influence in facilitating the exchange of knowledge and enhancing capacity. They have the potential to offer financial backing, technical guidance, and specialized proficiency to bolster cities in their endeavors toward climate action. This assistance effectively bridges knowledge disparities by affording cities access to resources they might otherwise be without.
Through the enactment of these mechanisms and frameworks, cities can bridge informational divides, facilitate efficient knowledge sharing, and cultivate the essential skills to formulate and execute resilient climate policies. In collective synergy, cities can forge collaborations, mutually educate, and confront climate issues with enhanced efficiency, forging a sustainable future that benefits all.
4. Conclusions
Promoting urban carbon mitigation holds the key to stabilizing Earth’s climate system, restoring biogeological cycles, and enriching ecological services. Enhancing mutual learning between cities from the Northern and Southern hemispheres concerning climate policies, be it for mitigation or adaptation measures, is critical for curbing global urban carbon emissions. In this context, we present the inaugural endeavor in identifying climate peer cities, employing geographic, demographic, and socioeconomic data. The BRICH algorithm was employed for city clustering due to its scalable capabilities.
Overall, we provided three ways to seek mutual and generalizable learning among worldwide peer cities in terms of urban climate policy exchange: (i) inner-mutual learning, which considers only the unidirectional mutual learning from cities within a given region or host country (this seems to be less important on the global scale); (ii) outer-mutual learning, which considers the bidirectional mutual learning from cities belonging to more than one single region or host country; (iii) cross-mutual learning, which considers the multidirectional mutual learning from cities belonging to different regions and host countries across the globe. The third cluster is the most important on the global scale because utilizing such policy exchange can (i) provide an in-depth analysis of global climate policy, (ii) provide a holistic policy framework at a planetary scale, (iii) reinforce the links between the North and the South, and (iv) Enable climate change mitigation strategies in countries where there is a deficiency in the climate intelligence domain.
In forthcoming research, our plan is to develop an online dashboard featuring profiles of each city and its respective peer cities. This platform will automate the procedure for updating variables and enable the comparison of specific policy exchange levels among peer cities. Such a data-driven approach holds potential significance in achieving the objectives of limiting global warming to 2 °C. However, a significant limitation still remains, and we intend to address it in a future study. This limitation pertains to estimating the efficacy of policy transfer within each peer city cluster, prompting questions such as: Can all climate policies be effectively shared among peer cities? Is a comprehensive “climate policy exchange” protocol necessary to ensure policy adaptability between the North and the South? How can we gauge the effectiveness of climate action? To tackle these inquiries, our current study lays the groundwork by offering initial steps (data and algorithm), which can subsequently pave the way for further advancements in this field.
Funding
This research received no external funding.
Data Availability Statement
The data is available upon reasonable request from the corresponding author.
Conflicts of Interest
The author declares no conflict of interest.
Appendix A

Table A1.
Summary statistics for cities’ carbon footprints by region and city size.
| City Size | Region | Count | Mean | Std | Min | 25% | 50% | 75% | Max |
|---|---|---|---|---|---|---|---|---|---|
| Large | Africa | 46 | 1.668201 | 1.773951 | 0.001095 | 0.583514 | 1.580737 | 2.352944 | 9.5 |
| Large | Asia-Pacific | 407 | 7.926575 | 3.313403 | 0.009521 | 7 | 8.695 | 9.055265 | 28 |
| Large | Central America/Caribbean | 8 | 2.444509 | 0.980879 | 1.543836 | 1.568354 | 2.065784 | 3.522313 | 3.65151 |
| Large | EU-28 | 25 | 8.689808 | 1.75331 | 5.2 | 7.5 | 8.400077 | 10.29404 | 11.1 |
| Large | Latin America | 32 | 3.334497 | 1.092284 | 1.720759 | 2.55 | 3.172987 | 4.128888 | 6.2 |
| Large | Middle East/Central Asia | 42 | 8.926649 | 5.937517 | 0.502316 | 5.405981 | 6.857893 | 9.75 | 28.7 |
| Large | North America | 64 | 15.71238 | 6.107379 | 3.4 | 14.425 | 17.15 | 19.575 | 26.1 |
| Large | Other Europe | 19 | 10.11289 | 3.415572 | 3.7 | 7.067263 | 11.95385 | 12.4 | 13.8 |
| Meduim | Africa | 97 | 2.349386 | 1.973972 | 0.025191 | 1.048464 | 2.191583 | 2.40724 | 8.4 |
| Meduim | Asia-Pacific | 530 | 7.25611 | 3.506502 | 0.410283 | 2.853281 | 8.867161 | 8.913171 | 22.6 |
| Meduim | Central America/Caribbean | 12 | 2.052178 | 1.508632 | 0.12549 | 0.22392 | 2.428018 | 3.30226 | 4.024683 |
| Meduim | EU-28 | 93 | 8.574385 | 1.622799 | 4.5 | 7.481882 | 8.198716 | 10.15877 | 12.6 |
| Meduim | Latin America | 96 | 3.799532 | 0.815481 | 1.687338 | 2.965204 | 3.965869 | 3.994822 | 6.376739 |
| Meduim | Middle East/Central Asia | 86 | 7.728069 | 5.280795 | 0.69475 | 4.545738 | 6.640534 | 9.225 | 32.9 |
| Meduim | North America | 169 | 13.76305 | 6.339965 | 4.781958 | 4.868961 | 17.1 | 18.53311 | 22.8 |
| Meduim | Other Europe | 73 | 10.16617 | 3.198667 | 3.208334 | 7.097868 | 11.76007 | 11.9 | 17.5 |
| Mega | Africa | 2 | 0.959754 | 0.65019 | 0.5 | 0.729877 | 0.959754 | 1.189631 | 1.419508 |
| Mega | Asia-Pacific | 24 | 4.54512 | 3.335839 | 0.7 | 1.65 | 4 | 7.4 | 13 |
| Mega | EU-28 | 2 | 7.474869 | 0.318383 | 7.249739 | 7.362304 | 7.474869 | 7.587435 | 7.7 |
| Mega | Latin America | 3 | 2.533333 | 1.357694 | 1.7 | 1.75 | 1.8 | 2.95 | 4.1 |
| Mega | Middle East/Central Asia | 2 | 6.7 | 2.12132 | 5.2 | 5.95 | 6.7 | 7.45 | 8.2 |
| Mega | North America | 3 | 11.5 | 7.637408 | 2.8 | 8.7 | 14.6 | 15.85 | 17.1 |
| Mega | Other Europe | 1 | 6.9 | 6.9 | 6.9 | 6.9 | 6.9 | 6.9 | |
| Small | Africa | 1068 | 2.054795 | 2.148901 | 0.004519 | 0.661388 | 1.342449 | 2.189386 | 9.2 |
| Small | Asia-Pacific | 2249 | 8.460339 | 5.061953 | 0.233646 | 2.616635 | 11.15341 | 11.1806 | 18.8 |
| Small | Central America/Caribbean | 251 | 2.571873 | 1.204404 | 0.014604 | 2.143705 | 3.056284 | 3.301914 | 12.47965 |
| Small | EU-28 | 5717 | 8.56441 | 1.598455 | 3.701598 | 7.880875 | 8.039162 | 10.42784 | 20.54022 |
| Small | Latin America | 1419 | 3.778722 | 1.201423 | 1.409341 | 3.722414 | 3.757367 | 4.592188 | 6.139928 |
| Small | Middle East/Central Asia | 827 | 6.902887 | 3.801626 | 0.442721 | 3.982963 | 6.39759 | 9.509682 | 18.76555 |
| Small | North America | 8908 | 17.04467 | 3.672694 | 4.593807 | 18.29807 | 18.3032 | 18.30436 | 24.7 |
| Small | Other Europe | 1835 | 9.623677 | 2.92851 | 2.962979 | 6.854226 | 11.55867 | 11.56482 | 13.00869 |
Table A2.
Summary statistics for climate policies.
| Continent | Policy Objective | Count |
|---|---|---|
| Africa | Adaptation | 143 |
| Africa | Air pollution | 3 |
| Africa | Economic development | 14 |
| Africa | Energy access | 17 |
| Africa | Energy security | 8 |
| Africa | Food security | 2 |
| Africa | Land use | 12 |
| Africa | Mitigation | 450 |
| Africa | Water | 4 |
| Asia | Adaptation | 133 |
| Asia | Air pollution | 61 |
| Asia | Economic development | 56 |
| Asia | Energy access | 33 |
| Asia | Energy security | 37 |
| Asia | Food security | 7 |
| Asia | Land use | 33 |
| Asia | Mitigation | 1456 |
| Asia | Water | 19 |
| Europe | Adaptation | 56 |
| Europe | Air pollution | 23 |
| Europe | Economic development | 14 |
| Europe | Energy access | 19 |
| Europe | Energy security | 22 |
| Europe | Food security | 1 |
| Europe | Land use | 10 |
| Europe | Mitigation | 1613 |
| Europe | Water | 1 |
| North America | Adaptation | 68 |
| North America | Air pollution | 34 |
| North America | Economic development | 13 |
| North America | Energy access | 12 |
| North America | Energy security | 31 |
| North America | Food security | 1 |
| North America | Land use | 10 |
| North America | Mitigation | 939 |
| North America | Water | 4 |
| Oceania | Adaptation | 29 |
| Oceania | Air pollution | 13 |
| Oceania | Economic development | 10 |
| Oceania | Energy access | 7 |
| Oceania | Energy security | 6 |
| Oceania | Food security | 4 |
| Oceania | Land use | 4 |
| Oceania | Mitigation | 300 |
| Oceania | Water | 2 |
| South America | Adaptation | 50 |
| South America | Air pollution | 14 |
| South America | Economic development | 20 |
| South America | Energy access | 12 |
| South America | Energy security | 6 |
| South America | Food security | 1 |
| South America | Land use | 24 |
| South America | Mitigation | 398 |
Table A3.
Percentage of clusters by region.
| Cluster | Africa | Asia-Pacific | Central America/Caribbean | EU-28 | Latin America | Middle East/ Central Asia | North America | Other Europe |
|---|---|---|---|---|---|---|---|---|
| Cluster 0 | 0 | 40.3 | 0 | 1.5 | 0 | 4.9 | 0.4 | 52.9 |
| Cluster 1 | 7 | 12.2 | 7 | 0.6 | 63.5 | 9.3 | 0.2 | 0.2 |
| Cluster 2 | 0 | 0.1 | 0 | 0.1 | 0 | 0.2 | 99.6 | 0 |
| Cluster 3 | 3.4 | 20 | 0 | 76.1 | 0 | 0.4 | 0 | 0.1 |
| Cluster 4 | 0 | 2.3 | 0.1 | 59.5 | 6.7 | 22.7 | 0 | 8.7 |
| Cluster 5 | 62.4 | 14.4 | 5.8 | 0 | 12.7 | 4.7 | 0 | 0 |
| Cluster 6 | 0 | 32.8 | 0 | 0 | 0 | 4.3 | 62.5 | 0.4 |
| Cluster 7 | 0 | 0.4 | 0 | 87.9 | 0 | 4.1 | 0.2 | 7.4 |
| Cluster 8 | 17.1 | 46.8 | 8.5 | 0 | 17.1 | 6.7 | 0.1 | 3.7 |
| Cluster 9 | 0 | 9.3 | 0 | 0 | 0 | 9.3 | 81.4 | 0 |
| Cluster 10 | 1.1 | 13.3 | 0 | 12.5 | 13.7 | 2.2 | 38.6 | 18.7 |
References
- Pengue, W.; Blanco, G.; Conninck, H.; Diaz Anadon, L.; Lim, Y.; Sagar, A.; Verdolini, E.; Witajewski, J.; Tanaka, K.; Diagne, E.; et al. Climate Change 2022: Mitigation of Climate Change. Available online: https://www.ipcc.ch/report/sixth-assessment-report-working-group-3/ (accessed on 19 April 2023).
- Cheng, L.; Mi, Z.; Sudmant, A.; Coffman, D. Bigger Cities Better Climate? Results from an Analysis of Urban Areas in China. Energy Econ. 2022, 107, 105872. [Google Scholar] [CrossRef]
- Hachaichi, M. Reshaping Modern Urban Models with the Global Environmental Ceiling: What, When, How, and Why? 2022. Available online: https://www.researchgate.net/publication/359134024_Reshaping_modern_urban_models_with_the_global_environmental_ceiling_What_when_how_and_why (accessed on 19 April 2023).
- Lakanen, L.; Kumpulainen, H.; Helppi, O.; Grönman, K.; Soukka, R. Carbon Handprint Approach for Cities and Regions: A Framework to Reveal and Assess the Potential of Cities in Climate Change Mitigation. Sustainability 2022, 14, 6534. [Google Scholar] [CrossRef]
- Bai, X.; Baynes, T.M.; Webb, R.; Ryan, C.; Smith, M.H. Cities. In Transitioning to a Prosperous, Resilient and Carbon-Free Economy: A Guide for Decision-Makers; Hussey, K., Baldwin, K.G.H., Howden, M., Smith, M.H., Dawson, P.J., Eds.; Cambridge University Press: Cambridge, UK, 2021; pp. 271–300. ISBN 978-1-107-11834-8. [Google Scholar]
- Fischedick, M.; Byrne, J.; Hermwille, L.; Taminiau, J.; Luhmann, H.-J.; Stelzer, F.; Vallentin, D. Reflections on the State of Climage Change Policy: From COP21 to Cities; MIT Press: Cambridge, MA, USA, 2018; pp. 183–203. [Google Scholar]
- Kalmykova, Y.; Rosado, L.; Patrício, J. Urban Economies Resource Productivity and Decoupling: Metabolism Trends of 1996–2011 in Sweden, Stockholm, and Gothenburg. Environ. Sci. Technol. 2015, 49, 8815–8823. [Google Scholar] [CrossRef]
- Sovacool, B.K.; Brown, M.A. Twelve Metropolitan Carbon Footprints: A Preliminary Comparative Global Assessment. Energy Policy 2010, 38, 4856–4869. [Google Scholar] [CrossRef]
- Hachaichi, M.; Baouni, T. Downscaling the Planetary Boundaries (Pbs) Framework to City Scale-Level: De-Risking MENA Region’s Environment Future. Environ. Sustain. Indic. 2020, 5, 100023. [Google Scholar] [CrossRef]
- Lombardi, M.; Laiola, E.; Tricase, C.; Rana, R. Assessing the Urban Carbon Footprint: An Overview. Environ. Impact Assess. Rev. 2017, 66, 43–52. [Google Scholar] [CrossRef]
- Hachaichi, M.; Baouni, T. Virtual Carbon Emissions in the Big Cities of Middle-Income Countries. Urban Clim. 2021, 40, 100986. [Google Scholar] [CrossRef]
- Lamb, W.F.; Creutzig, F.; Callaghan, M.W.; Minx, J.C. Learning about Urban Climate Solutions from Case Studies. Nat. Clim. Chang. 2019, 9, 279–287. [Google Scholar] [CrossRef]
- Cobbinah, P.B. Urban Resilience in Climate Change Hotspot. Land Use Policy 2021, 100, 104948. [Google Scholar] [CrossRef]
- George, T.; Longworth, S.; O’Dell, M. Introducing, Understanding, and Using the ICI 300 Peer Cities Identification Tool. Population 2016, 199, 128-009. [Google Scholar]
- Larsen, B.; Hall, M.; McGinnis-Brown, L.; Moss, M.; Fry, V.C. City of Boise Peer Cities Selection 2020. 2020. Available online: https://www.boisestate.edu/sps-ipi/our-research/city-of-boise-peer-cities-selection-2020/ (accessed on 19 April 2023).
- Schaller, B. A Regression Model of the Number of Taxicabs in U.S. Cities. J. Public Transp. 2005, 8, 63–78. [Google Scholar] [CrossRef]
- Palmiotto, M.J.; Janeksela, G.M. A Comparative Study of Index Crimes in Five Peer Cities. J. Crime Justice 2000, 23, 111–123. [Google Scholar] [CrossRef]
- Powell, A. Coding Alternative Modes of Governance: Learning from Experimental ‘peer-to-Peer Cities’. In Code and the City; Routledge: Abingdon, UK, 2016; ISBN 978-1-315-68599-1. [Google Scholar]
- Hachaichi, M.; Egieya, J. Water-Food-Energy Nexus in Global Cities: Addressing Complex Urban Interdependencies. Water Resour. Manag. 2023, 37, 1811–1825. [Google Scholar] [CrossRef]
- Wang, S.; Bai, X. Compatibility in Cross-City Innovation Transfer: Importance of Existing Local Experiments. Environ. Innov. Soc. Transit. 2022, 45, 52–71. [Google Scholar] [CrossRef]
- Callaghan, M.; Vasudevan, S.; Banisch, L.; Döbbeling, N.; Edmondson, D.; Flachsland, C.; Lamb, W.; Levi, S.; Müller-Hansen, F.; Posada, E.; et al. What Is the Evidence on Climate Mitigation Policies, and to What Extent Can It Be Identified and Classified Using Machine Learning? A Machine-Learning-Assisted Systematic Map Protocol. 2022. Available online: https://assets.researchsquare.com/files/pex-1910/v1/469059ba-3218-4fb6-9993-6568bf09a98f.pdf?c=1661517519 (accessed on 19 April 2023).
- Peñasco, C.; Anadón, L.D.; Verdolini, E. Systematic Review of the Outcomes and Trade-Offs of Ten Types of Decarbonization Policy Instruments. Nat. Clim. Chang. 2021, 11, 257–265. [Google Scholar] [CrossRef]
- Fekete, H.; Kuramochi, T.; Roelfsema, M.; Elzen, M.d.; Forsell, N.; Höhne, N.; Luna, L.; Hans, F.; Sterl, S.; Olivier, J.; et al. A Review of Successful Climate Change Mitigation Policies in Major Emitting Economies and the Potential of Global Replication. Renew. Sustain. Energy Rev. 2021, 137, 110602. [Google Scholar] [CrossRef]
- Walsh, B.; Greenwalt, J.; Craig, M.; Okem, A. Findings from Innovate4cities 2021 and Update to the Global Researc H and Action Agenda; UN-Habitat: Nairobi, Kenya, 2022. [Google Scholar]
- Global Covenant of Mayors Global Covenant of Mayors for Cliamte and Energy. Available online: https://www.globalcovenantofmayors.org/ (accessed on 3 December 2022).
- Carbon Neutral Cities Alliance Urban Sustainability Directors Network. Available online: https://www.usdn.org/cnca.html (accessed on 3 December 2022).
- Steynor, A.; Leighton, M.; Kavonic, J.; Abrahams, W.; Magole, L.; Kaunda, S.; Mubaya, C.P. Learning from Climate Change Perceptions in Southern African Cities. Clim. Risk Manag. 2020, 27, 100202. [Google Scholar] [CrossRef]
- Webber, S.; Donner, S.D. Climate Service Warnings: Cautions about Commercializing Climate Science for Adaptation in the Developing World. WIREs Clim. Chang. 2017, 8, e424. [Google Scholar] [CrossRef]
- Castán Broto, V.; Bulkeley, H. A Survey of Urban Climate Change Experiments in 100 Cities. Glob. Environ. Chang. 2013, 23, 92–102. [Google Scholar] [CrossRef]
- Hachaichi, M. Cities: Allocating Climate Change Responsibilities at Planetary Scale. Urban Clim. 2022, 46, 101329. [Google Scholar] [CrossRef]
- Lwasa, S.; Seto, K.C.; Bai, X.; Blanco, H.; Gurney, K.R.; Kilkiş, S.; Lucon, O.; Murakami, J.; Pan, J.; Sharifi, A. Urban Systems and Other Settlements. IPCC 2022. Available online: https://www.ipcc.ch/report/ar6/wg3/downloads/report/IPCC_AR6_WGIII_Chapter08_SM.pdf (accessed on 19 April 2023).
- UNFCCC INDCs. Available online: https://www4.unfccc.int/sites/submissions/indc/Submission%20Pages/submissions.aspx (accessed on 27 November 2022).
- Climate Policy Database Policies|Climate Policy Database. Available online: https://climatepolicydatabase.org/policies (accessed on 27 November 2022).
- Zhang, T.; Ramakrishnan, R.; Livny, M. BIRCH: An Efficient Data Clustering Method for Very Large Databases. ACM SIGMOD Rec. 1996, 25, 103–114. [Google Scholar] [CrossRef]
- Ester, M.; Kriegel, H.-P.; Sander, J.; Xu, X. A Density-Based Algorithm for Discovering Clusters in Large Spatial Databases with Noise. In Proceedings of the KDD-96: The Second International Conference on Knowledge Discovery and Data Mining, Portland, OR, USA, 2–4 August 1996; pp. 226–231. [Google Scholar]
- Lang, A.; Schubert, E. BETULA: Numerically Stable CF-Trees for BIRCH Clustering. In Proceedings of the SISAP 2020: Similarity Search and Applications, Virtual, 30 September–2 October 2020; Satoh, S., Vadicamo, L., Zimek, A., Carrara, F., Bartolini, I., Aumüller, M., Jónsson, B.Þ., Pagh, R., Eds.; Springer International Publishing: Cham, Switzerland, 2020; pp. 281–296. [Google Scholar]
- Hughes, S. A Meta-Analysis of Urban Climate Change Adaptation Planning in the U.S. Urban Clim. 2015, 14, 17–29. [Google Scholar] [CrossRef]
- Kernaghan, S.; da Silva, J. Initiating and Sustaining Action: Experiences Building Resilience to Climate Change in Asian Cities. Urban Clim. 2014, 7, 47–63. [Google Scholar] [CrossRef]
- Bianco, V.; Cascetta, F.; Marino, A.; Nardini, S. Understanding Energy Consumption and Carbon Emissions in Europe: A Focus on Inequality Issues. Energy 2019, 170, 120–130. [Google Scholar] [CrossRef]
- El-Islem, H.M.N.; Tahar, B. The Carbon Footprint Model as a Plea for Cities towards Energy Transition: The Case of Algiers Algeria. Int. J. Energy Environ. Eng. 2019, 13, 255–262. [Google Scholar]
- Kanemoto, K.; Moran, D.; Hertwich, E.G. Mapping the Carbon Footprint of Nations. Environ. Sci. Technol. 2016, 50, 10512–10517. [Google Scholar] [CrossRef]
- Nathaniel, S.; Anyanwu, O.; Shah, M. Renewable Energy, Urbanization, and Ecological Footprint in the Middle East and North Africa Region. Environ. Sci. Pollut. Res. 2020, 27, 14601–14613. [Google Scholar] [CrossRef]
- Hagerman, S.M.; Pelai, R. Responding to Climate Change in Forest Management: Two Decades of Recommendations. Front. Ecol. Environ. 2018, 16, 579–587. [Google Scholar] [CrossRef]
- Abeldaño Zuñiga, R.A.; Lima, G.N.; González Villoria, A.M. Impact of Slow-Onset Events Related to Climate Change on Food Security in Latin America and the Caribbean. Curr. Opin. Environ. Sustain. 2021, 50, 215–224. [Google Scholar] [CrossRef]
- Lincoln Lenderking, H.; Robinson, S.; Carlson, G. Climate Change and Food Security in Caribbean Small Island Developing States: Challenges and Strategies. Int. J. Sustain. Dev. World Ecol. 2021, 28, 238–245. [Google Scholar] [CrossRef]
- Griggs, G.; Reguero, B.G. Coastal Adaptation to Climate Change and Sea-Level Rise. Water 2021, 13, 2151. [Google Scholar] [CrossRef]
- Nagy, G.J.; Gutiérrez, O.; Brugnoli, E.; Verocai, J.E.; Gómez-Erache, M.; Villamizar, A.; Olivares, I.; Azeiteiro, U.M.; Leal Filho, W.; Amaro, N. Climate Vulnerability, Impacts and Adaptation in Central and South America Coastal Areas. Reg. Stud. Mar. Sci. 2019, 29, 100683. [Google Scholar] [CrossRef]
- Froehlich, H.E.; Koehn, J.Z.; Holsman, K.K.; Halpern, B.S. Emerging Trends in Science and News of Climate Change Threats to and Adaptation of Aquaculture. Aquaculture 2022, 549, 737812. [Google Scholar] [CrossRef]
- Burls, N.J.; Blamey, R.C.; Cash, B.A.; Swenson, E.T.; Fahad, A.a.; Bopape, M.-J.M.; Straus, D.M.; Reason, C.J.C. The Cape Town “Day Zero” Drought and Hadley Cell Expansion. NPJ Clim. Atmos. Sci. 2019, 2, 27. [Google Scholar] [CrossRef]
- Muller, M. Cape Town’s Drought: Don’t Blame Climate Change. Nature 2018, 559, 174–176. [Google Scholar] [CrossRef]
- Wu, S.; Sumari, N.S.; Dong, T.; Xu, G.; Liu, Y. Characterizing Urban Expansion Combining Concentric-Ring and Grid-Based Analysis for Latin American Cities. Land 2021, 10, 444. [Google Scholar] [CrossRef]
- Duque, J.C.; Lozano-Gracia, N.; Patino, J.E.; Restrepo, P. Urban Form and Productivity: What Shapes Are Latin-American Cities? Environ. Plan. B Urban Anal. City Sci. 2022, 49, 131–150. [Google Scholar] [CrossRef]
- Lane, H.M.; Morello-Frosch, R.; Marshall, J.D.; Apte, J.S. Historical Redlining Is Associated with Present-Day Air Pollution Disparities in U.S. Cities. Environ. Sci. Technol. Lett. 2022, 9, 345–350. [Google Scholar] [CrossRef]
- Lioubimtseva, E.; Cunha, C.D. The Role of Non-Climate Data in Effective Climate Adaptation Planning: Lessons From Small French and American Cities. Sustainability 2023, 15, 1556. [Google Scholar] [CrossRef]
Figure 1.
Study spatial coverage. Number of cities distribution across the globe (data source: [30]).
Figure 1.
Study spatial coverage. Number of cities distribution across the globe (data source: [30]).

Figure 2.
Climate change policies scouted from the Climate Policy Database (data source: [33]). The size of the circles represents the number of policies.
Figure 2.
Climate change policies scouted from the Climate Policy Database (data source: [33]). The size of the circles represents the number of policies.

Figure 3.
Followed methodology to identify peer cities and recommend climate policy exchange.

Figure 4.
Regional distribution of peer city clusters.

Figure 5.
Peer-cities clusters by region. The circle inside the plot shows that clusters (of mutual learning) could intersect.
Figure 5.
Peer-cities clusters by region. The circle inside the plot shows that clusters (of mutual learning) could intersect.

Figure 6.
Peer city climate actions. (A) percentage of climate focus by policy objective (mitigation and adaptation). (B) percentage of climate policy focus by sector.
Figure 6.
Peer city climate actions. (A) percentage of climate focus by policy objective (mitigation and adaptation). (B) percentage of climate policy focus by sector.

Figure 7.
Transfer-learning protocol of climate policies key components.

Table 1.
Clusters and their characteristics in terms of the size of cities and carbon footprint.
| Cluster | City Share | Carbon (t CO2 per Capita/Year) |
|---|---|---|
| Cluster 9 | 0.2% | 23.4 ± 2.5 |
| Cluster 2 | 31.9% | 18.3 ± 0.2 |
| Cluster 6 | 4.5% | 15.6 ± 0.7 |
| Cluster 0 | 9.4% | 11.6 ± 0.4 |
| Cluster 7 | 9.3% | 10.4 ± 0.2 |
| Cluster 3 | 14.1% | 8.2 ± 0.4 |
| Cluster 4 | 6.9% | 6.7 ± 0.3 |
| Cluster 10 | 8% | 4.9 ± 0.3 |
| Cluster 1 | 5.2% | 3.7 ± 0.2 |
| Cluster 8 | 5.4% | 2.5 ± 0.3 |
| Cluster 5 | 5.1% | 1.0 ± 0.5 |
Table 2.
Peer city clusters and their characteristics.
| Peer-Cities Clusters | City Size | Share (%) | Mean (t CO2) | Std (t CO2) |
|---|---|---|---|---|
| Cross-mutual Learning | Large cities | 14.88 | 6.79 | 3.55 |
| Medium cities | 18.28 | 5.45 | 3.31 | |
| Mega cities | 1.15 | 4.85 | 3.80 | |
| Small cities | 65.67 | 2.23 | 2.02 | |
| Inner-mutual Learning | Large cities | 0.95 | 7.56 | 3.636 |
| Medium cities | 3.91 | 7.80 | 3.35 | |
| Small cities | 95.130 | 7.86 | 2.79 | |
| Outer-mutual Learning | Large cities | 0.84 | 16.94 | 4.56 |
| Medium cities | 1.39 | 18.14 | 2.58 | |
| Mega cities | 0.022 | 9.20 | 7.63 | |
| Small cities | 97.73 | 17.98 | 0.96 |
Table 3.
Policy focus by continent.
| Air Pollution | Economic Development | Energy Access | Energy Security | Food Security | Land Use | Water | |
|---|---|---|---|---|---|---|---|
| Africa | 10.5% | 29.9% | 23.4% | 10.3% | 1.4% | 14.9% | 9.6% |
| Asia | 31% | 18.9% | 7.9% | 16.8% | 3.5% | 15.3% | 6.7% |
| Europe | 26.2% | 18.1% | 19.1% | 20% | 2.8% | 13.6% | 0.2% |
| North America | 37.1% | 11.9% | 8% | 32.3% | 1.8% | 8.9% | 0.1% |
| Oceania | 31.1% | 20.4% | 15.3% | 12.8% | 7.6% | 7.6% | 5.1% |
| South America | 25.6% | 32% | 7.5% | 3.6% | 2.7% | 28.6% | 0% |
Disclaimer/Publisher’s Note: The statements, opinions and data contained in all publications are solely those of the individual author(s) and contributor(s) and not of MDPI and/or the editor(s). MDPI and/or the editor(s) disclaim responsibility for any injury to people or property resulting from any ideas, methods, instructions or products referred to in the content. |
© 2023 by the author. Licensee MDPI, Basel, Switzerland. This article is an open access article distributed under the terms and conditions of the Creative Commons Attribution (CC BY) license (https://creativecommons.org/licenses/by/4.0/).
Share and Cite
MDPI and ACS Style
Hachaichi, M. No City Left Behind: Building Climate Policy Bridges between the North and South. Meteorology 2023, 2, 403-420. https://doi.org/10.3390/meteorology2030024
AMA Style
Hachaichi M. No City Left Behind: Building Climate Policy Bridges between the North and South. Meteorology. 2023; 2(3):403-420. https://doi.org/10.3390/meteorology2030024
Chicago/Turabian StyleHachaichi, Mohamed. 2023. "No City Left Behind: Building Climate Policy Bridges between the North and South" Meteorology 2, no. 3: 403-420. https://doi.org/10.3390/meteorology2030024