

Changes in the Seasonality of Fire Activity and Fire Weather in Portugal: Is the Wildfire Season Really Longer?


1
Departamento de Meteorologia e Geofísica, Instituto Português do Mar e da Atmosfera (IPMA), Rua C do Aeroporto, 1749-077 Lisbon, Portugal
2
Institute of Contemporary History, School of Social Sciences and Humanities, NOVA University Lisbon (IHC-NOVA FCSH), Campus de Campolide, 1749-077 Lisbon, Portugal
*
Author to whom correspondence should be addressed.
Meteorology 2023, 2(1), 74-86; https://doi.org/10.3390/meteorology2010006
Submission received: 18 November 2022
/
Revised: 30 January 2023
/
Accepted: 31 January 2023
/
Published: 2 February 2023
Abstract
:The length of the fire season has not garnered much attention within the broad field of meteorological research on fire regime change. Fire weather research on the Iberian Peninsula is no exception in this case; there is no solid understanding on fire season lengthening in Portugal, although recent decades do suggest ongoing transitions. Based on a complete record of fire occurrence and burned area between 1980 and 2018, we first searched for consistent trends in the monthly distribution of fire activity. To determine day-scale changes, an exceedance date method based on annual cumulative burned area was developed. Results show an early onset of fire activity in a range of 23–50 days and no significant extension into autumn, suggesting that existing projections of the lengthening of the fire season in Portugal over the present century have been already achieved. Fire weather results show a trend in the cumulative Daily Severity Rating (DSR), with the last two decades (2000–2018) displaying an early build-up of meteorological fire danger in late spring and early summer. The detailed spatio-temporal analysis based on the daily Fire Weather Index (FWI) shows that June stands out with the largest increase (year-round) in days per month with an FWI above 38.3, the threshold above which fire conditions make suppression uncertain. This aggravated fire weather is likely sustaining early fire activity, thus contributing to a longer critical fire season.
1. Introduction
The inter-annual variability in the incidence of wildfires can be observed in the uneven distribution of fire occurrence and burned area, which are largely derived from the annual cycles of temperature and precipitation and the corresponding seasonal dynamics of the ecosystems (e.g., [1,2,3]). This close relationship between the seasonal patterns of fire and weather has long been studied and parameterized, being reflected in meteorological indices of fire danger, as is well exemplified by the Canadian Forest Fire Weather Index (FWI) system and its long- to short-memory moisture sub-indices [4,5]. Regarding the Iberian Peninsula, where Portugal is located, different burned area models largely reproduce (in the order of 2/3 or more) annual and monthly variations in burned area based solely on meteorological variables [2,6,7,8]. This research field has received increasing attention over the last decade or two in the context of noticeable changes in both climate and fire regimes (e.g., [9,10,11,12,13,14]). Recent work has discussed emerging interactions between specific weather conditions and aggravated fire behavior that had not been identified before in fire weather studies [15,16,17,18].
In this context, the increasing length of the fire season can be seen as a seasonal-scale outcome of a changing climate, as discussed early by Wotton and Flannigan [19]. Indeed, the lengthening of the fire season observed in different regions of the world can be studied as the result of ongoing climate variation [20,21,22,23,24,25], and, conversely, climate projections can include scenarios of growing fire potential and longer fire seasons [26,27]. The study of fire season length is thus based primarily on meteorological data and fire weather analysis [24] and, to a lesser extent, on historical fire activity [23].
For Portugal, a positive variation of about 35 days in the length of the fire season between the 1961–1990 and 2071–2100 periods was determined based on a regional circulation model (RCM) as input to the FWI index [28]. This study also found an increase in the number of fire season days, with high fire danger (FWI > 45) in the range of 7.5–10 days. Later, another work also suggested a lengthened fire season by comparing the same present (1961–1990) and future (2071–2100) periods based on another RCM [29]. Their monthly FWI results show important escalation in fire weather during spring (May and June) and also autumn (especially October).
Despite the relevance of these two studies, we found no assessment of fire season length based on actual fire activity in the past decades, although the extraordinary development of recent fire seasons in 2017 and 2022 in southwestern Europe suggest challenging ongoing transitions [30,31]. Therefore, the main objective of this study was to determine variations in the annual distribution of fire activity in Portugal, with a focus on the length of the fire season, and to substantiate these changes in persistent variations in fire meteorology.
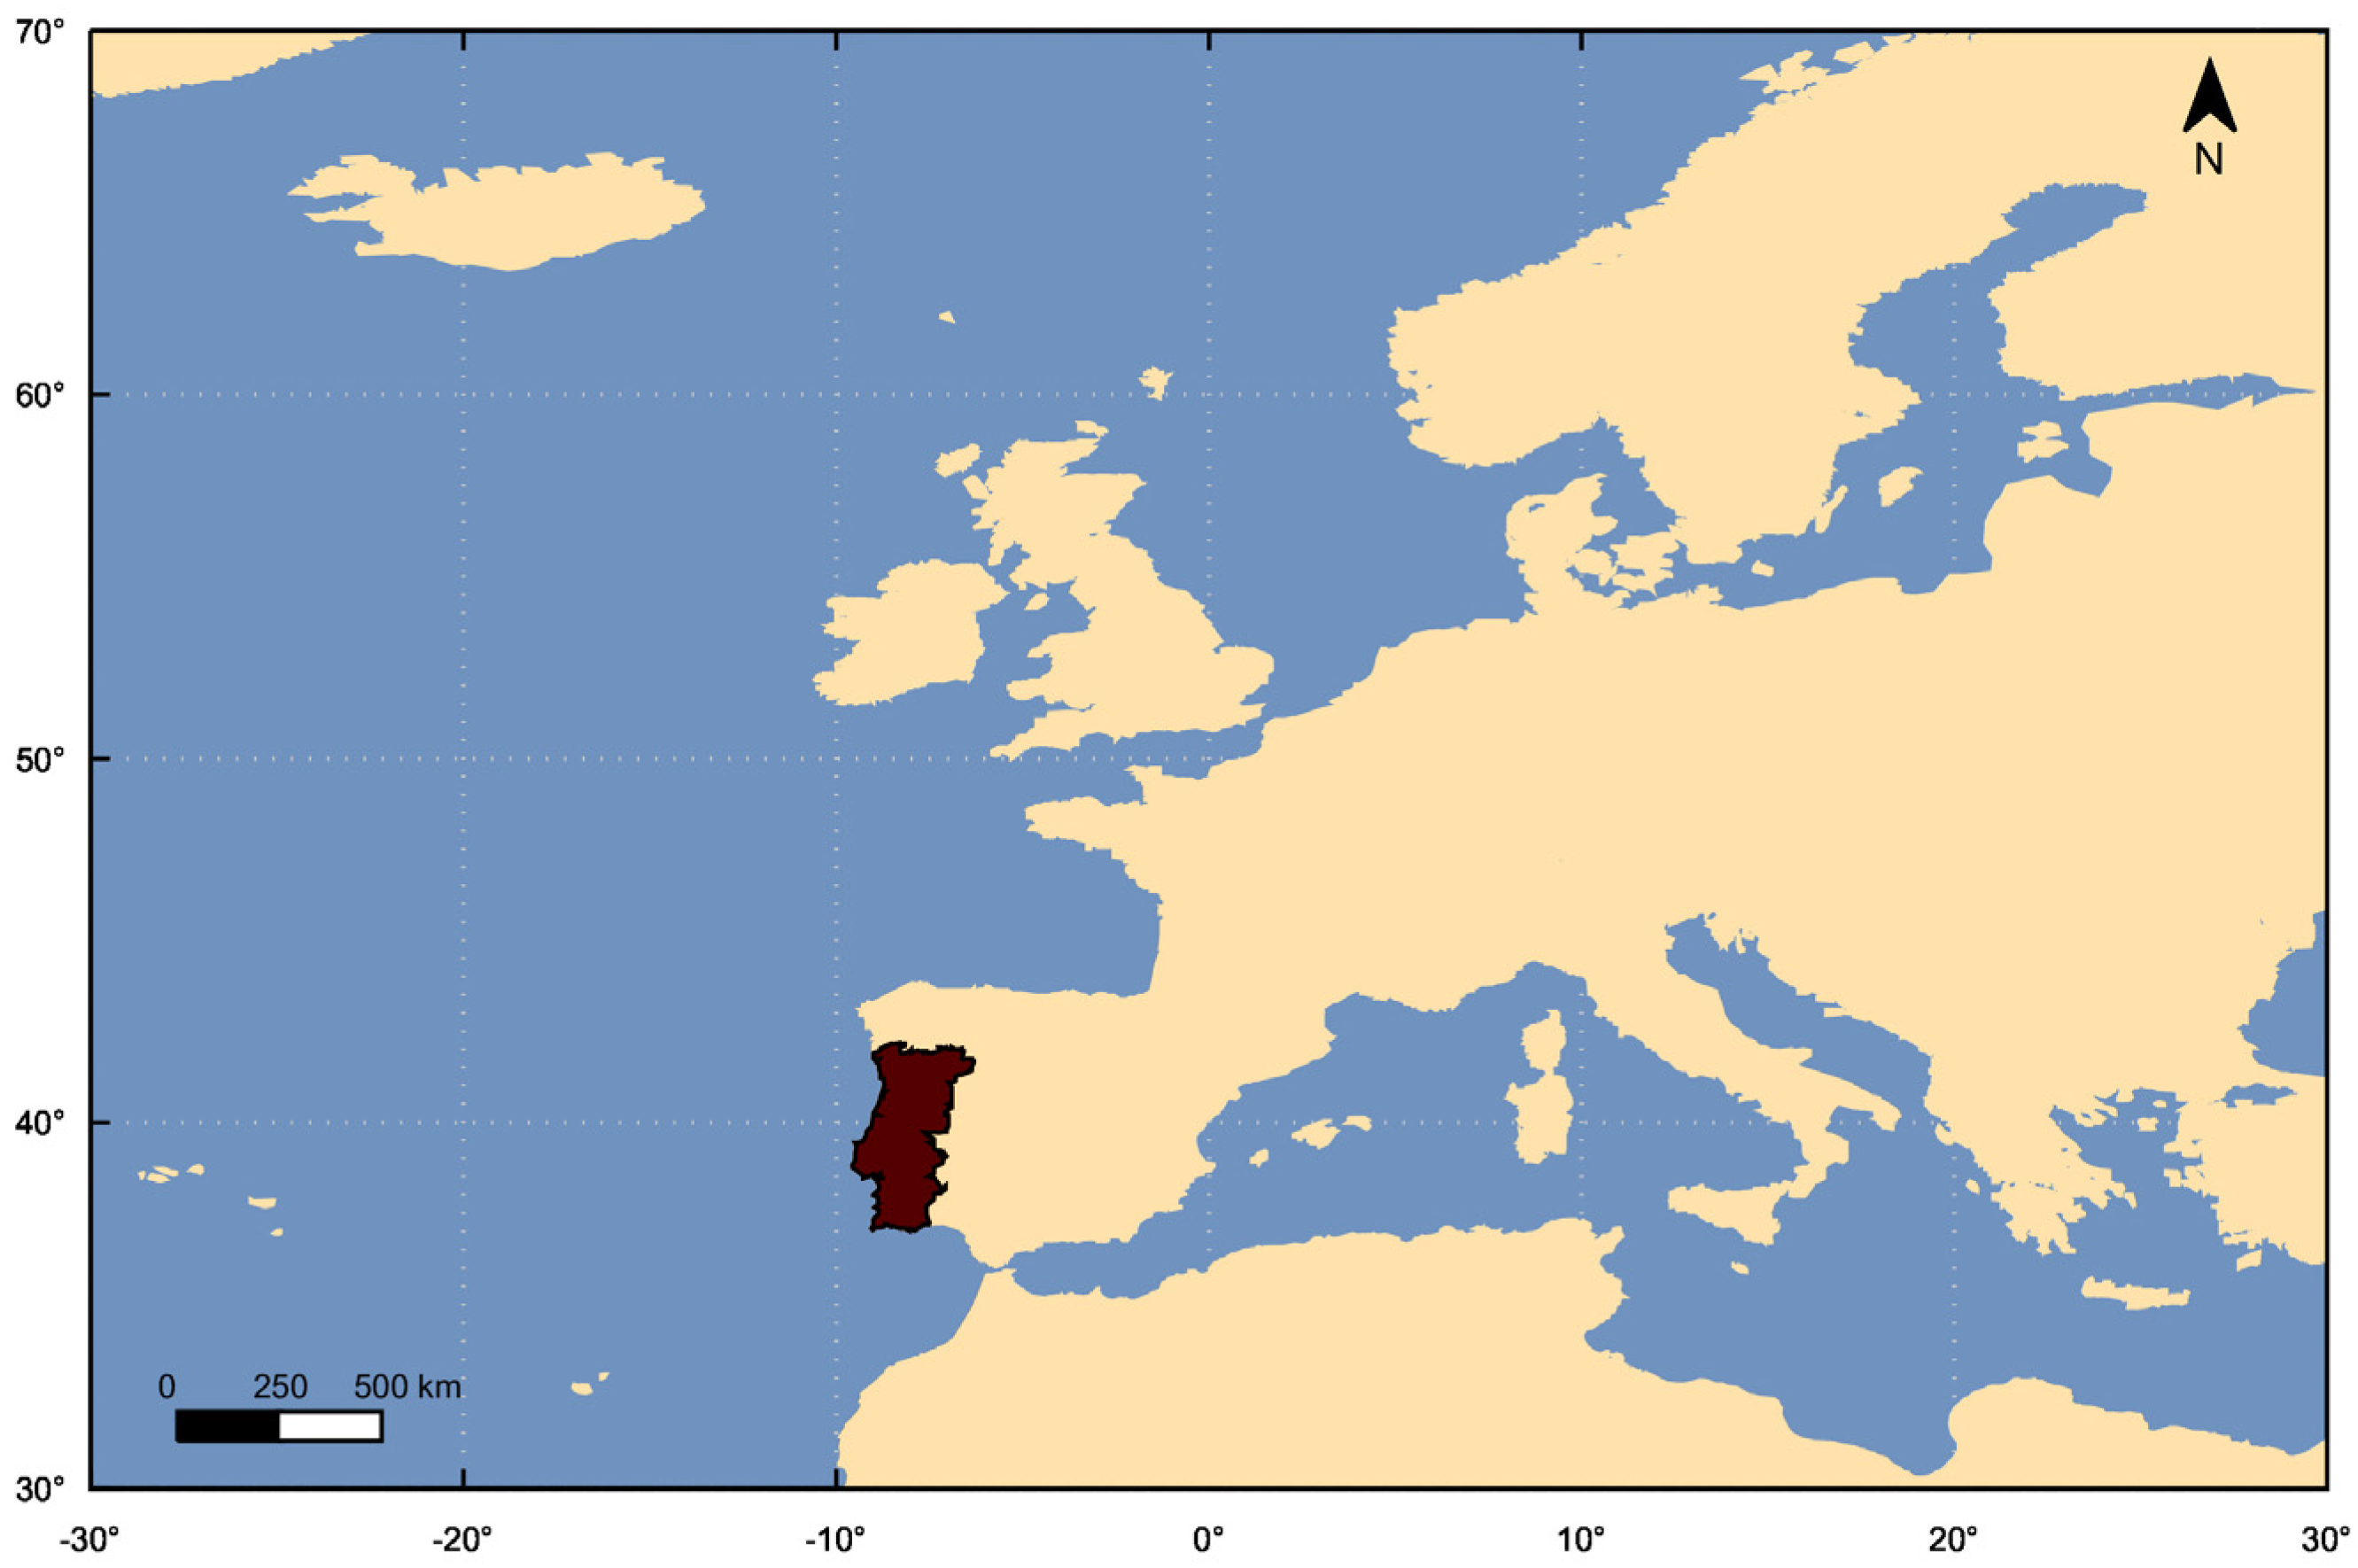
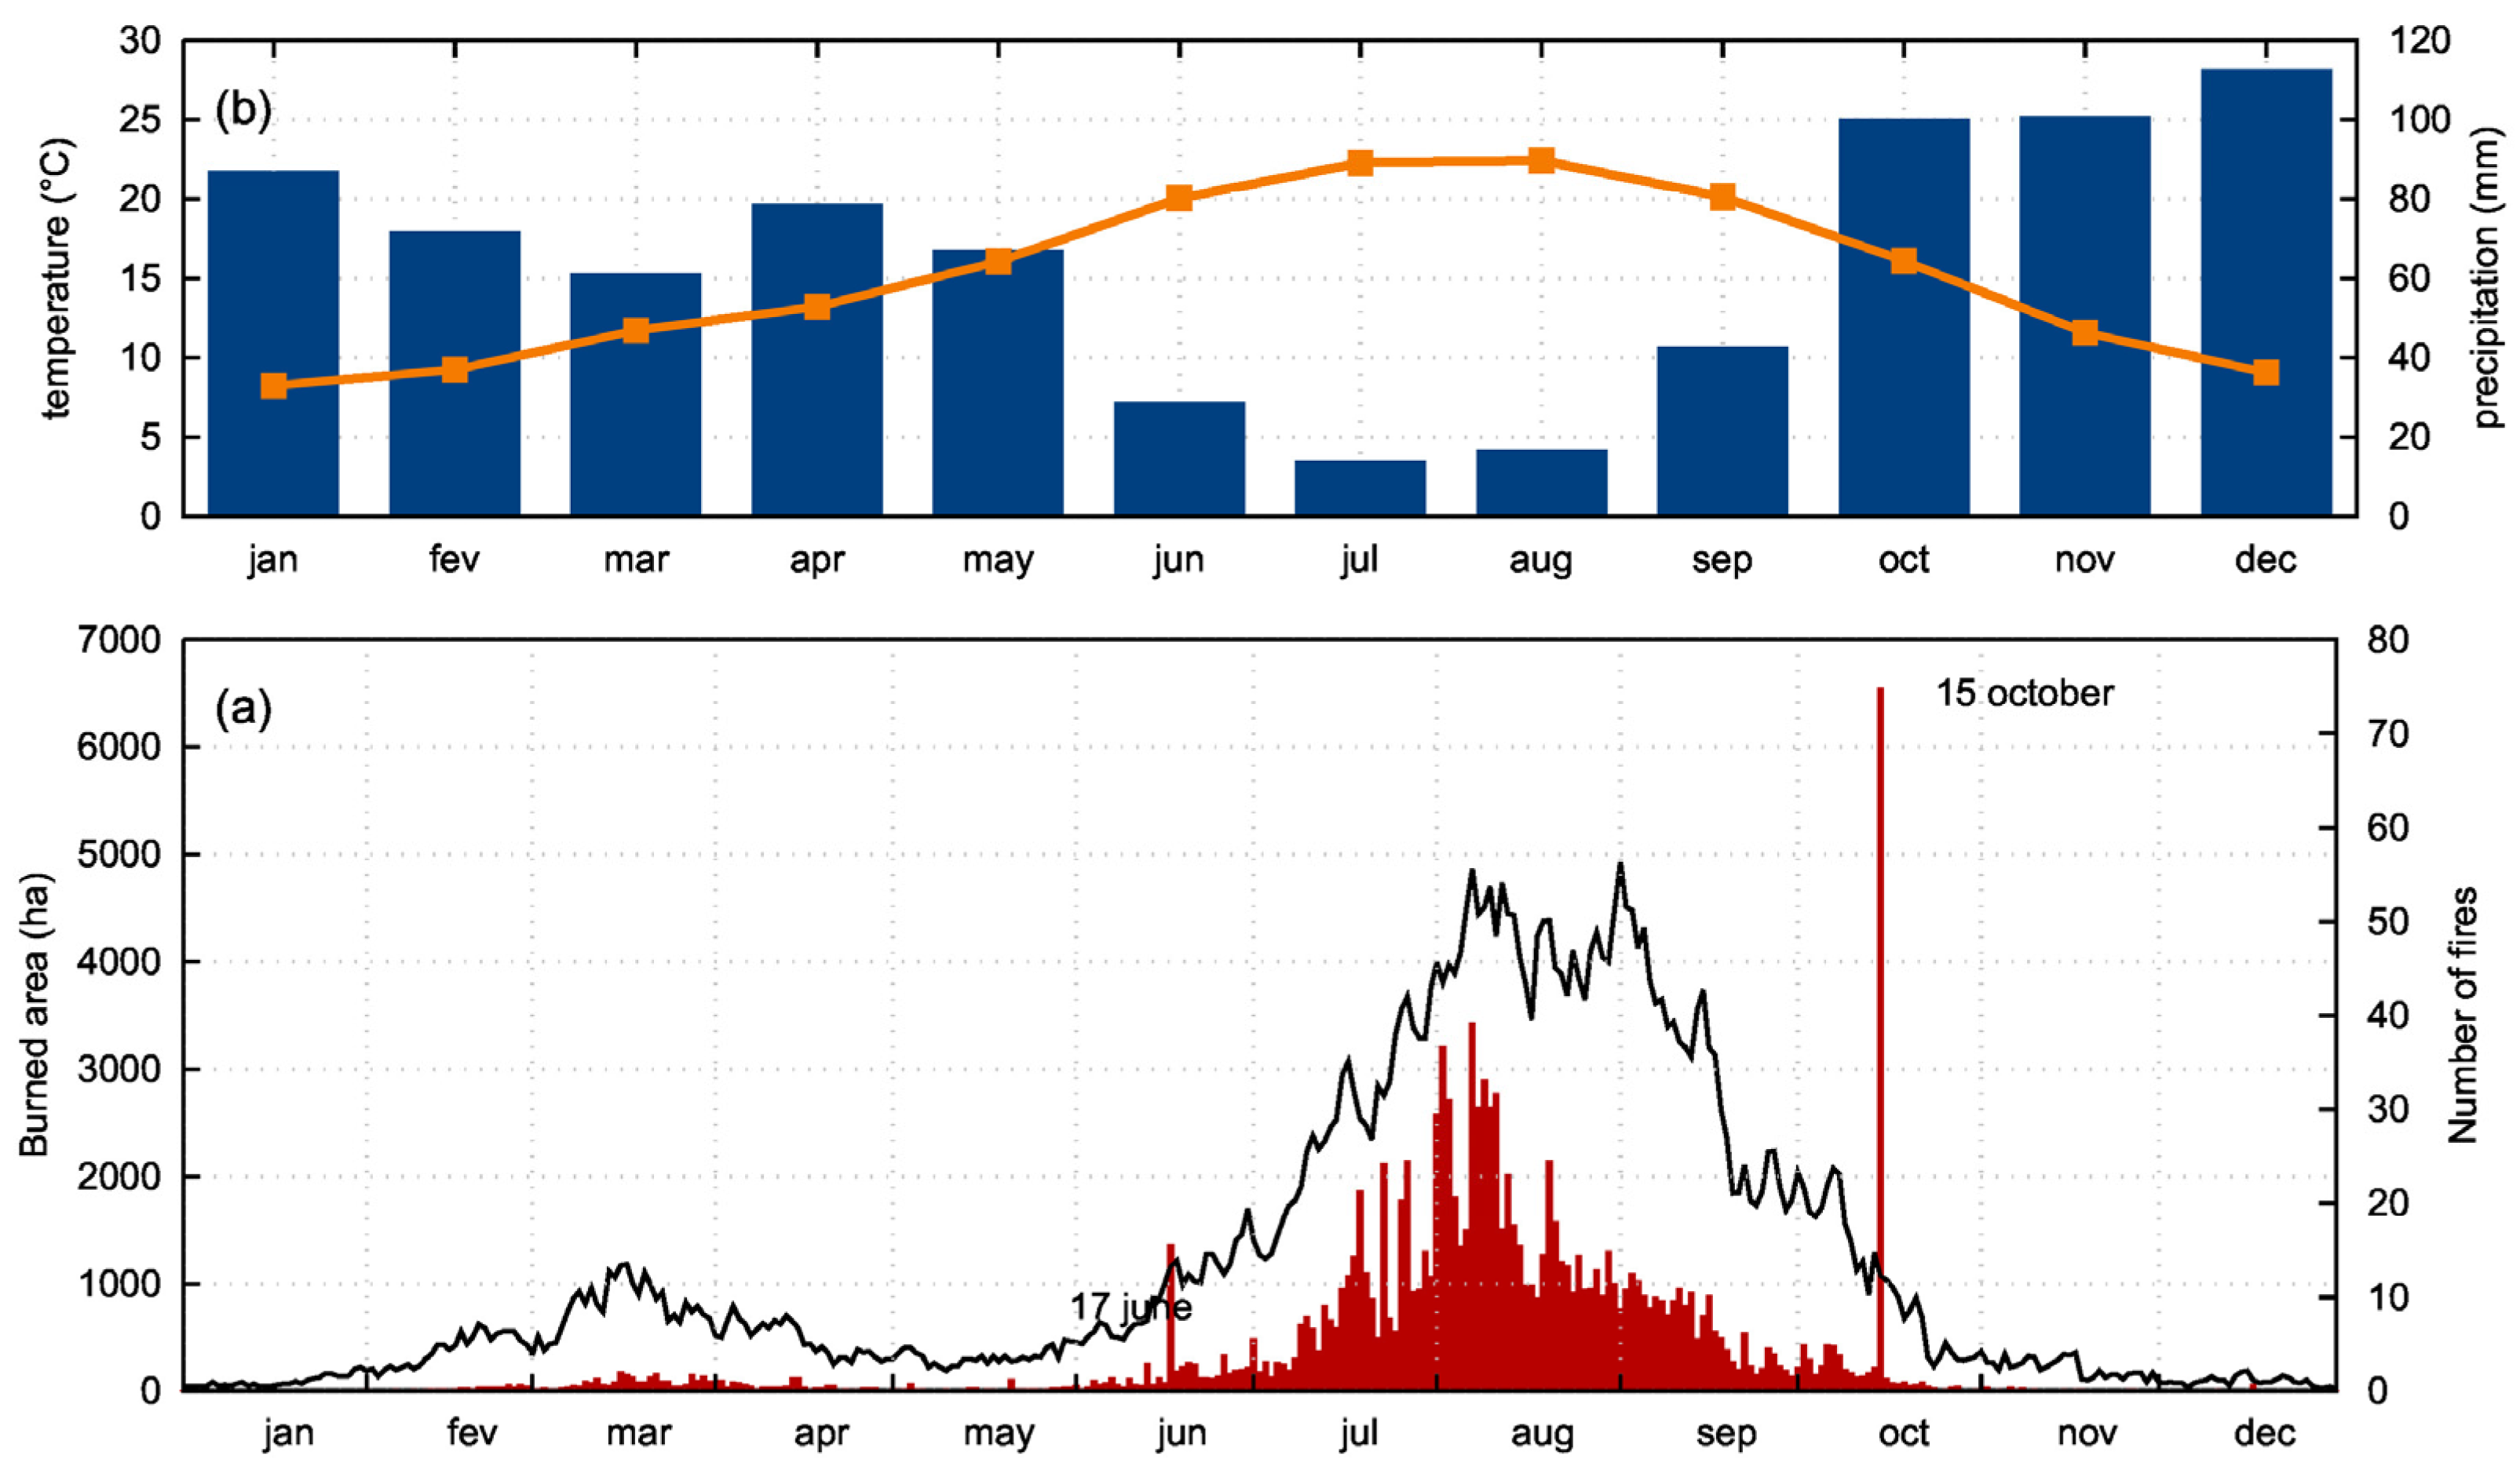
The seasonality of fires in mainland Portugal (Figure 1) can be approached at first by observing the annual cycle of selected fire and weather parameters, as shown in Figure 2. The lower graph displays the average daily evolution of the number of active fires and burned areas against the evolution, in the upper graph, of the monthly averages of mean temperature and total precipitation. This simplified picture of the last four decades reveals a dual fire season with an early fire peak in the winter/spring transition that exhibits average daily active fires of about 1/4 of the summer averages. This late March peak was identified previously in northern and northwestern Iberia, including the northern half of Portugal, and has been related to the combination of agricultural and forestry calendars with a recurring window of weather conditions conducive to fire spread [32,33,34]. So far, this off-season peak has made small contributions to the annual burned area, but it brings into focus the multiple factors and interdependencies that shape the seasonality of fires [35,36,37,38,39]. Climatic and ecological forcings work together with other diverse human-related annual cycles that affect ignitions, fuel availability and fire suppression, and this broader socioenvironmental framework should be convened for the management of more-than-meteorological fire seasons [6,40,41,42].
The present study fits this challenging framework, aiming to (i) describe significant changes in the annual cycle of fire activity in mainland Portugal over the period of 1980–2018. This analysis was based on the national fire record (see Section 2.1 on fire data) and some preliminary results [17,43]. Our second goal was to (ii) assess variations in fire weather over the year using meteorological indices of potential fire development, such as the cumulative Daily Severity Rating (DSR) and daily FWI. As shown below, we tracked the change in fire danger build-up over the year through the cumulative DSR, and FWI provided a more detailed spatio-temporal analysis focused on fire behavior thresholds. Finally, our third goal was to (iii) discuss the variation in fire activity and fire weather in the context of fire danger monitoring and fire season management. The simple question that titles the present study carries some methodological and even conceptual challenges.
2. Methods and Data
2.1. Fire Activity
Fire data were produced from the manually collected database of fire occurrences that has been organized nationally since 1980 [44,45,46], which was subjected to a systematic correction and standardization elsewhere and shared publicly for research [17]. It included a daily time series of burned area, which results from the sum of each fire’s daily ratio between burned area and fire duration in days. In summary, our working database included 189,734 fires that burned 4.6 million hectares between 1980 and 2018 (respectively, 25.8 and 98.5% of the original records).
Annual fire activity was first evaluated on a monthly scale, looking for trends in the area burned in the months of spring (AMJ), summer (JAS) and fall (OND). In order to establish an inter-annual comparison, we calculated the monthly fractions of the annual burned area and analyzed their progression over the study period. The Mann–Kendall test was used for trend detection and significance in these time series. All statistical results are summarized in the Table S1, presented as a Supplementary Material.
In order to identify day-scale historical trends in the annual fire cycle, a methodology was devised to compare the 39 cumulative annual curves of burned area between 1980 and 2018, hereafter called the exceedance date method. This method consists of computing for each year the sequential dates (computed as annual Julian day) where the 99 fractions of annual burned area were reached, starting at 1% up to 99%. Based on this procedure, we could search for significant shifts in the dates on which, for example, 10% of the annual burned area was surpassed from 1980 onward. The exceedance date method provides a normalized view of the changes in the annual distribution of the burned area that is independent of the severity of the fire season in each year. Given the goal of evaluating the length of the fire season, attention was focused on the first and last fractions of the burned area distribution.
2.2. Fire Weather
The DSR is an extension of the FWI system that transforms daily FWI values through a power expression, according to . Higher FWI values are thus emphasized, and DSR becomes more suitable to be cumulated and averaged [47,48]. This indicator is suitable for studying fire weather changes on a seasonal time scale, as it is a good predictor of burned area in different spatio-temporal frameworks [49,50,51,52], including monthly pre-season and season burned areas in Portugal [2] and the Iberian Peninsula [34]. In addition, cumulative DSR has regular use in Portugal in monitoring fire danger build-up throughout the year [53], which makes its inclusion in this study particularly appropriate.
The cumulative annual DSR series between 1980 and 2018 was calculated from daily FWI values provided by the ERA5 reanalysis [54,55] on a grid with a horizontal resolution of 0.25° with 163 land points over mainland Portugal, starting each year on 1 January. For consistency reasons, the same area was used when retrieving other ERA5 meteorological data, such as the 2 m air temperature and total precipitation series included in Figure 2.
In order to further explore the DSR results, we developed a procedure for analyzing the spatial discrimination over the same 1980–2018 period of high FWI daily values, which, unlike the DSR, provide an empirical correspondence with fire behavior according to danger classes and therefore some sense of expected impacts [56,57,58,59]. Fire danger classes are indicators of transition in the potential danger level and relate FWI with fire intensity and fire propagation characteristics [47]. Taking the FWI threshold of 38.3 as a transition value, above which the fire danger is considered severe (classified as “extreme” [56,58] or “maximum” [57]), we counted the number of days per month above this threshold at each grid point and obtained a spatio-temporal representation on a monthly scale of the change in severe fire weather in mainland Portugal.
3. Results and Discussion
3.1. Variation in Fire Activity
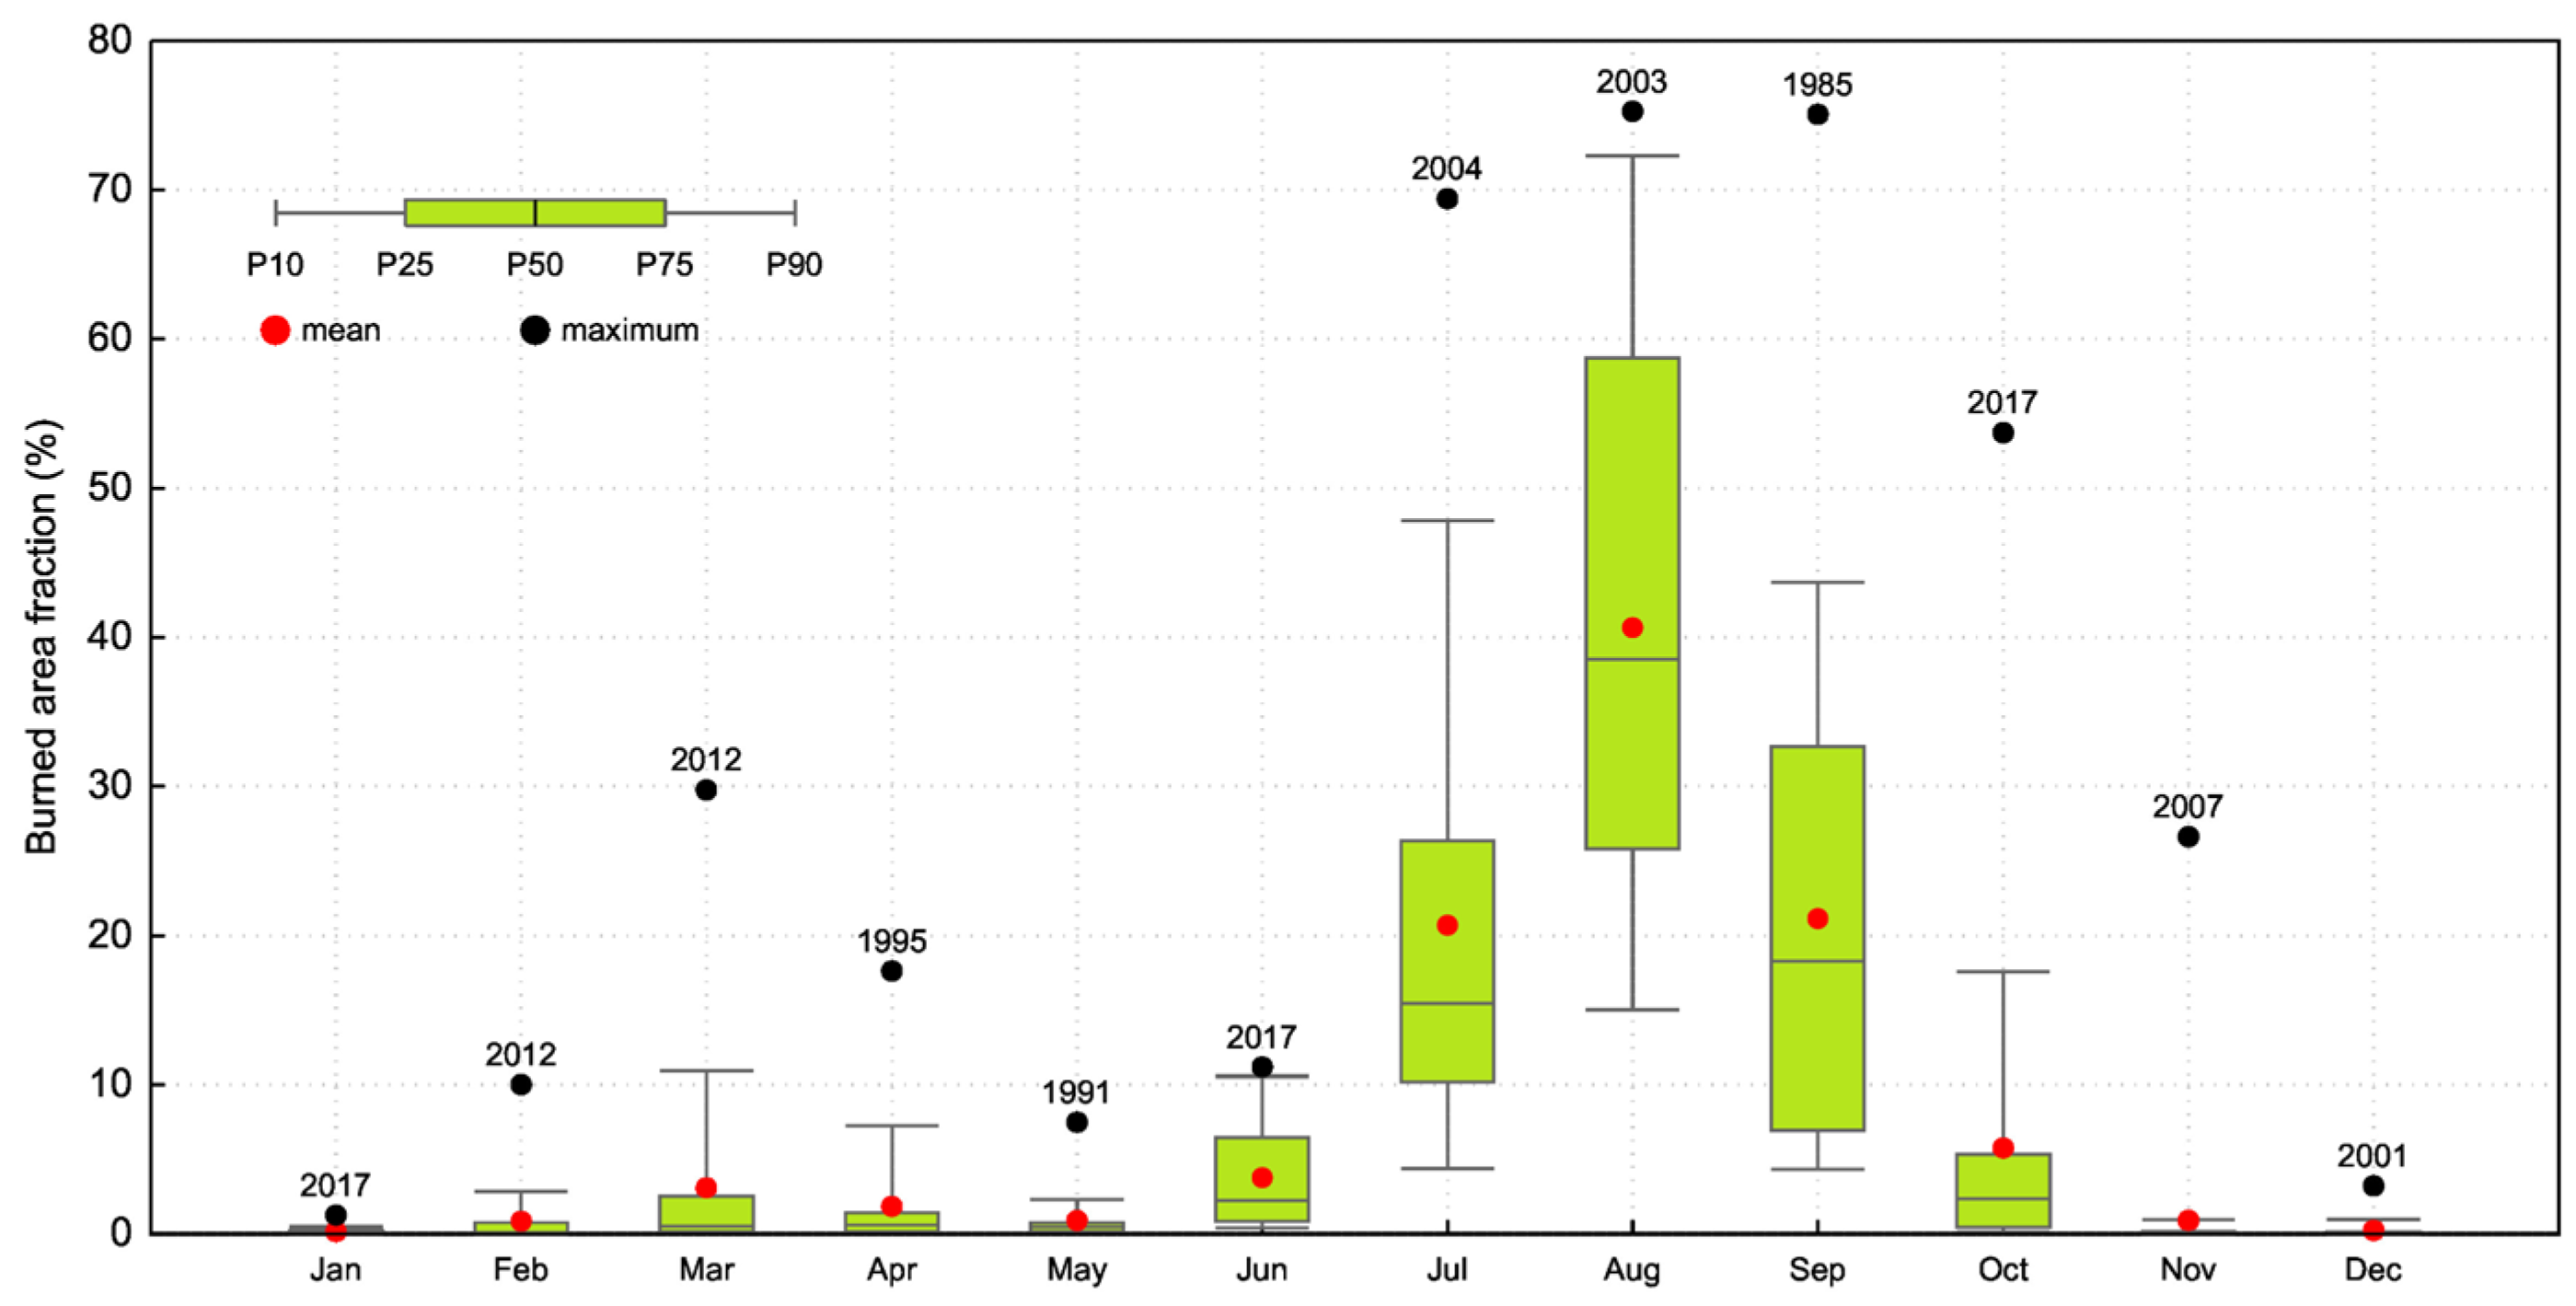
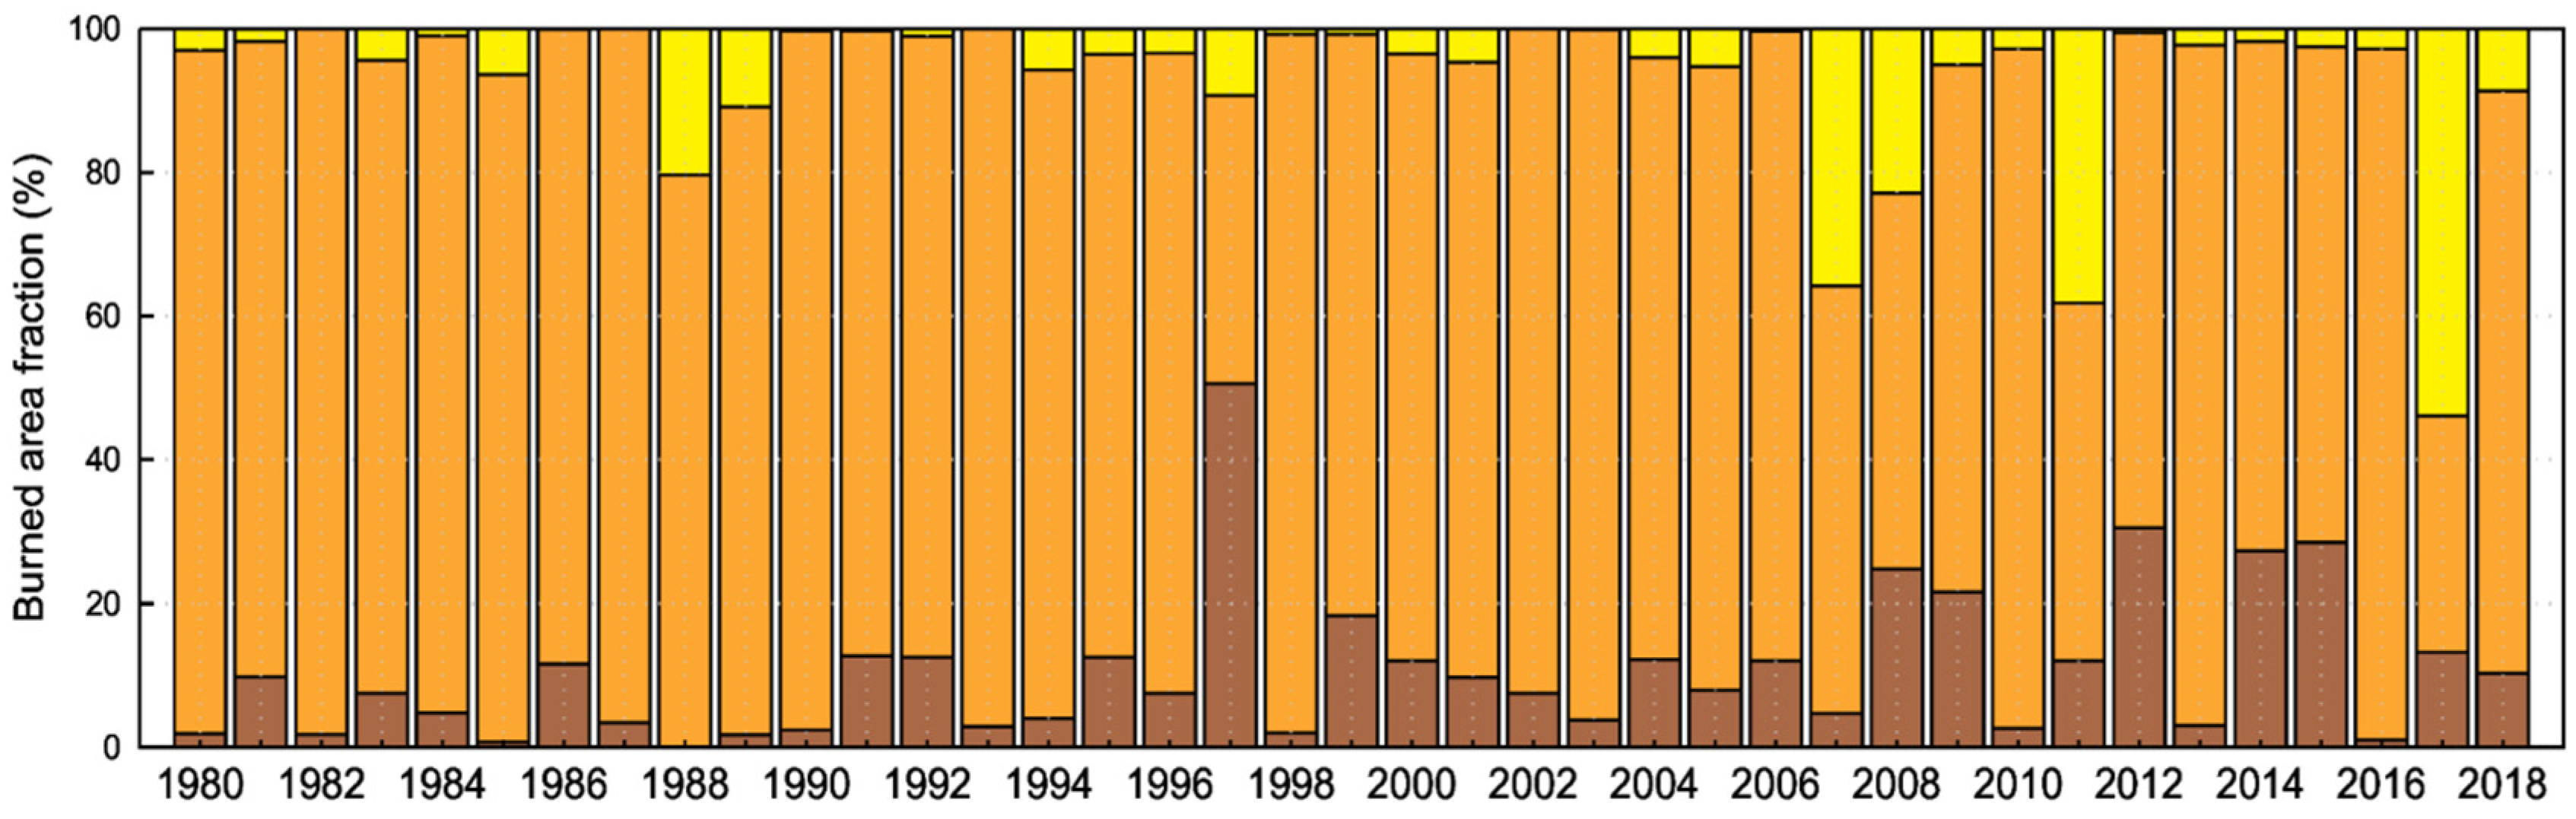
The monthly distribution of the annual burned area in Portugal shows a broad concentration in July, August and September (Figure 3). These three summer months account, on average, for 82.5% of the total area burned each year. However, the monthly data also show an increase in the proportion of the annual burned area that occurred outside of those three months from 1980 onwards (Figure 4). In fact, there is a meaningful increase in the fraction of burned area occurring in the period of January to June, whereas the fraction of July to September shows a decreasing trend (both Mann–Kendall test with ρ < 0.01). Regarding the fall, i.e., October to December, the trend is not significant at the 99% confidence level (trend analysis summary in Table S1).
The year 2017 sounded several alarm bells in Portugal with an unprecedented burnt extent that had never before been recorded (about 540,000 ha), leading to large property damage and an unseen figure of 117 fatalities caused by wildfires. Two main fire events occurred before (17–22 June) and after (15–17 October) the official fire season window decreed by the Portuguese authorities [31,59,60]. In fact, 67.1% of the burned area in 2017 did not occur in the three summer months, July to September. Note the atypical 2017 fire distribution that stands out in Figure 2, Figure 3 and Figure 4.
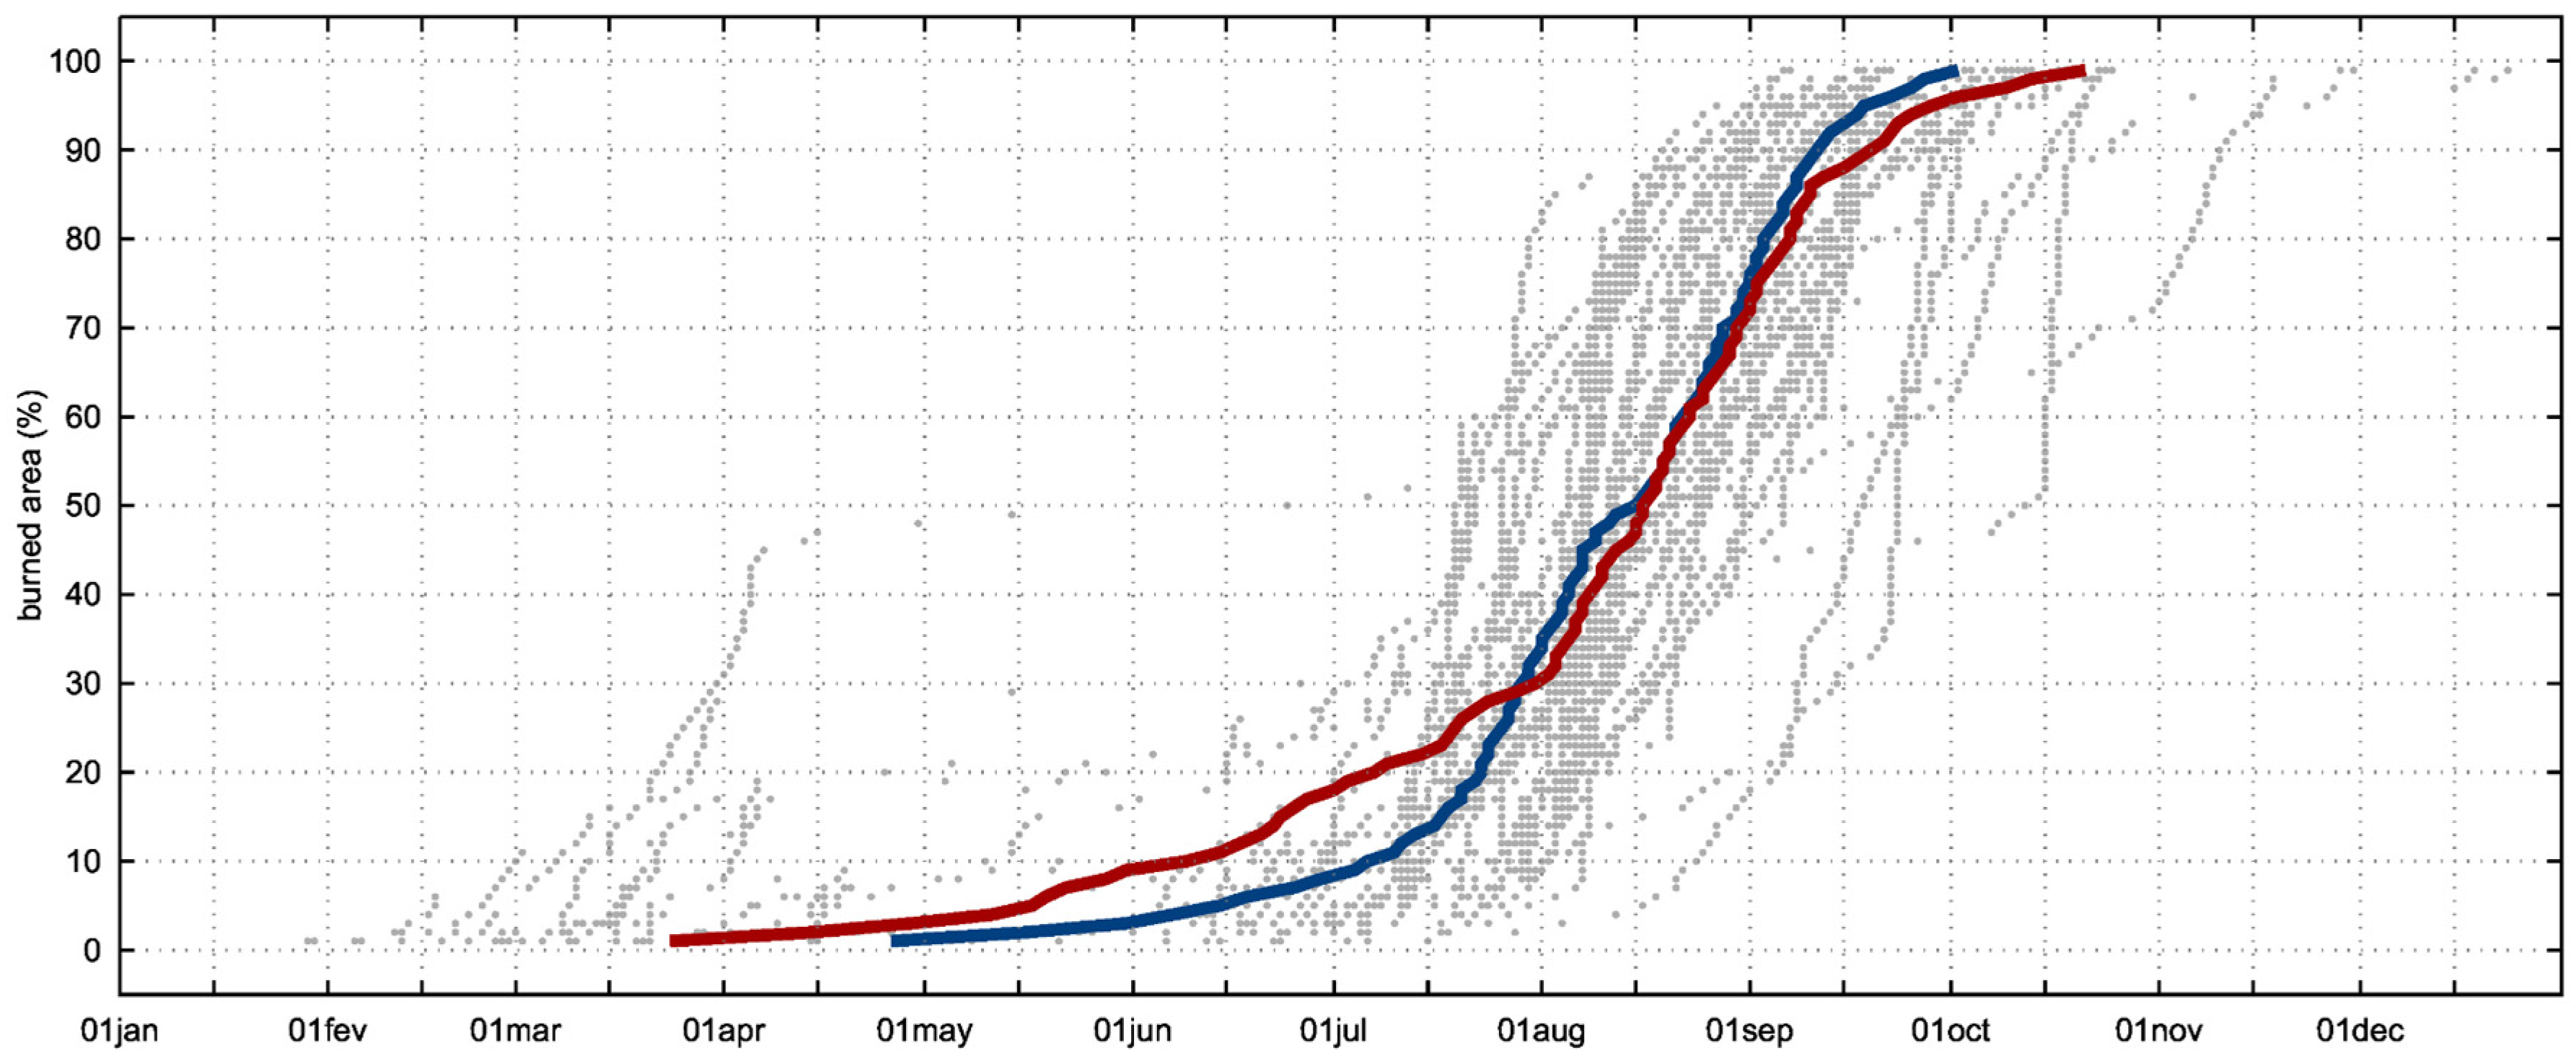
Regarding the changes in the annual cumulative burned area curves, whose results are summarized in Figure 5, the trend analysis shows a significant anticipation of the dates corresponding to the fractions from 1 to 16% (Mann–Kendall test, ρ < 0.05). All the remaining “exceedance dates” show no significant trends, including the slowing down phase of the annual fire cycle in late summer (trend analysis summary in Table S1). Considering the 15% and 85% fractions as reasonable indicators of the respective beginning and end of the fire season (Figure 6), we obtained a significant linear advance rate of 1.34 days·year−1 (early onset) and a non-significant extension rate of 0.13 days·year−1 (later ending). This advance rate represents important anticipation in fire activity of more than 50 days over the 39-year study period.
The two-decade averages represented by the colored lines in Figure 5 suggest that the fractions of annual burned area between 1% and close to 30% have been reached earlier in the year over the last two decades. This means a leftward shift of the left tail of the burned area distribution, as a likely result of early fire activity in the year. Comparing the first and the second halves of the study period, average backward shifts of 27 days (on the 10% exceedance dates) and 23 days (on the 16% dates) were detected.
These results are in line with the expected longer fire seasons in Portugal during the 21st century [28,29]. These two studies have also identified a stronger signal in fire season earliness compared to its extension into fall. However, our results suggest that the lengthening scenarios projected in [28] for the late 21st century have been reached. Similar trends were obtained in the southwestern USA for recent decades based on both fire activity and fire weather [23,24].
3.2. Variation in Fire Weather: Cumulative DSR throughout the Year
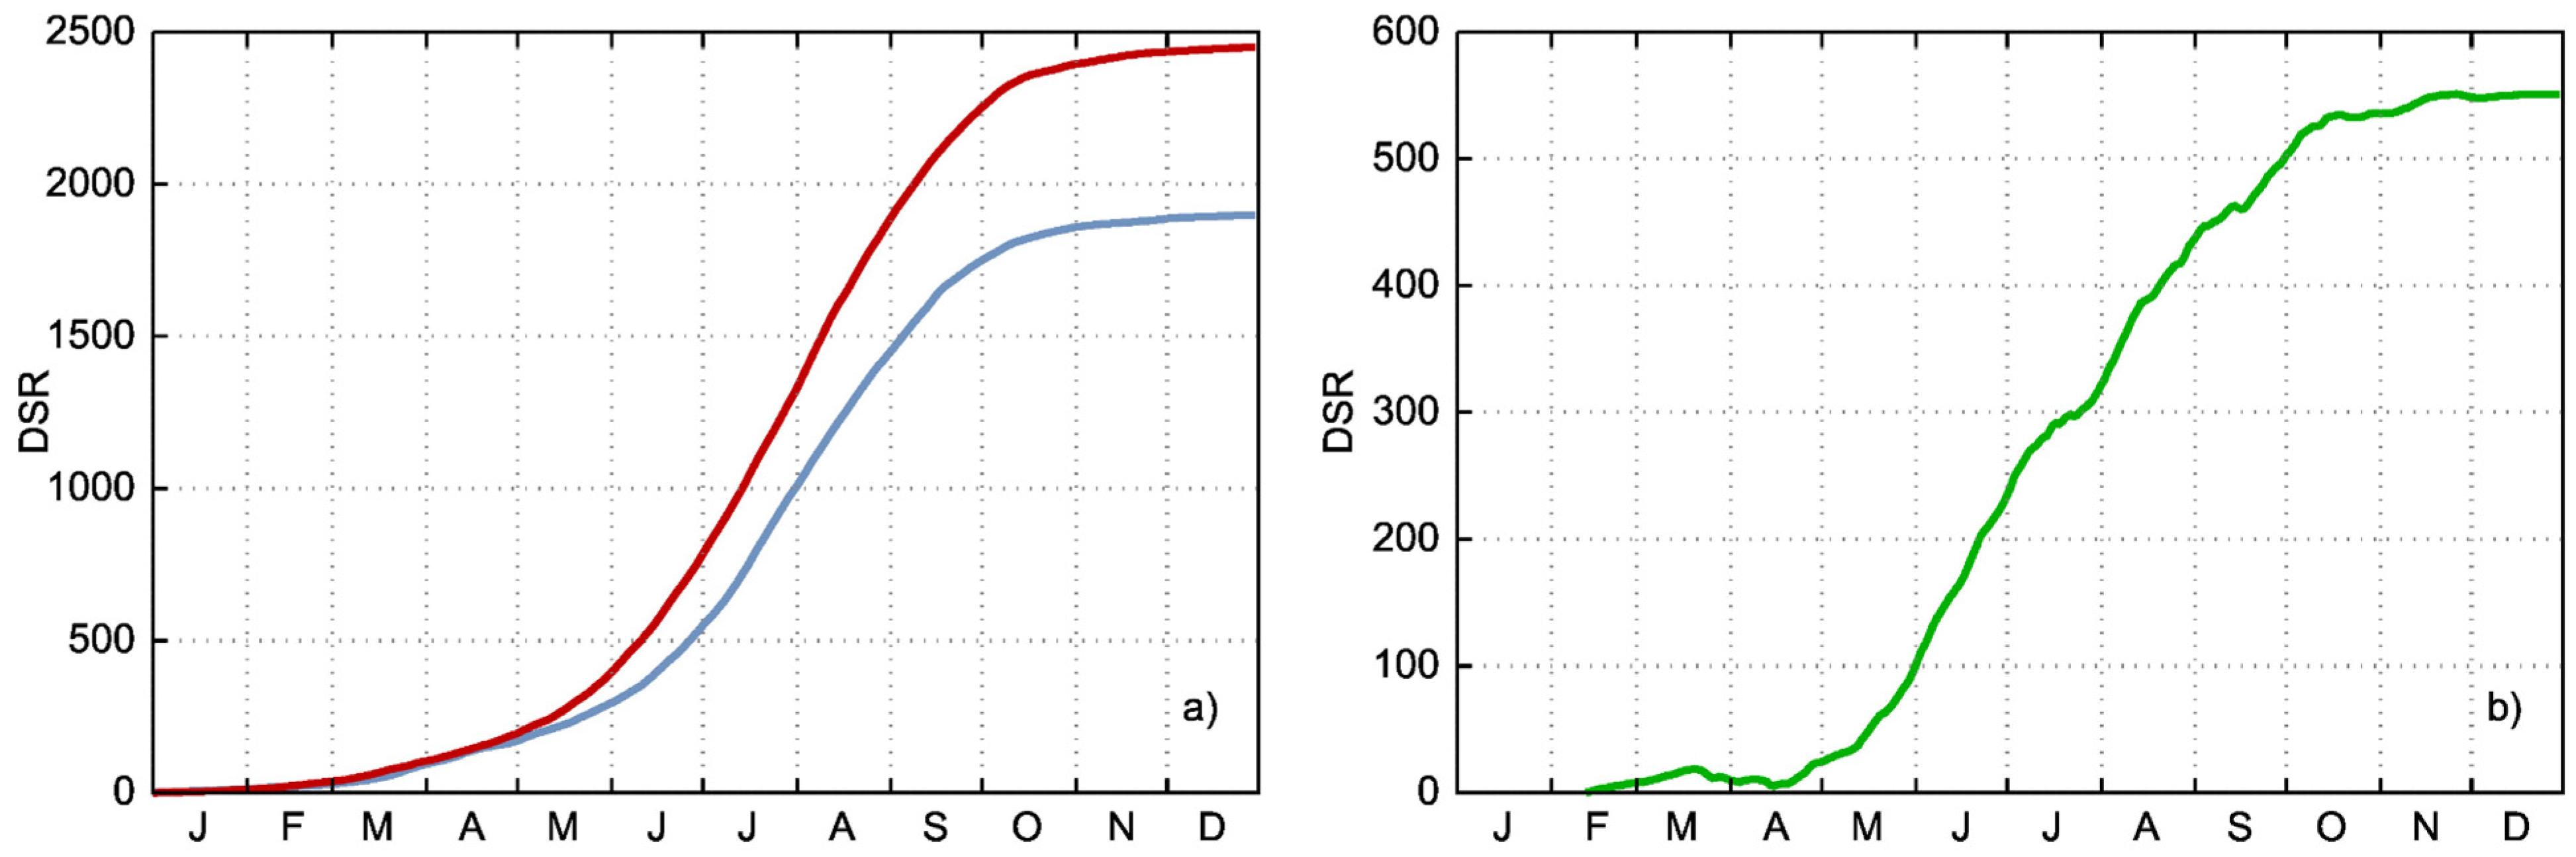
Figure 7a presents the mean cumulative DSR curves for the first (1980–1999) and second (2000–2018) halves of the study period. The time series of these two fire danger curves shows an increasing departure from May that does not stop growing before the end of summer, as can be followed in detail in Figure 7b. After a small differentiation in March and April, the gap between the two curves shows steady growth, which is accentuated in June (steepest slope) and continues until early October (Figure 7b). By the end of the year, the difference between the annual mean accumulated DSR in the two half-periods represents an increase of 29%. Moreover, a slight growth in the DSR gap is apparent as early as March, which then narrows to nearly zero in April before increasing again. Considering the aforementioned secondary peak of fire activity in March, this slight difference may represent an accentuation of the meteorological component of that peak.
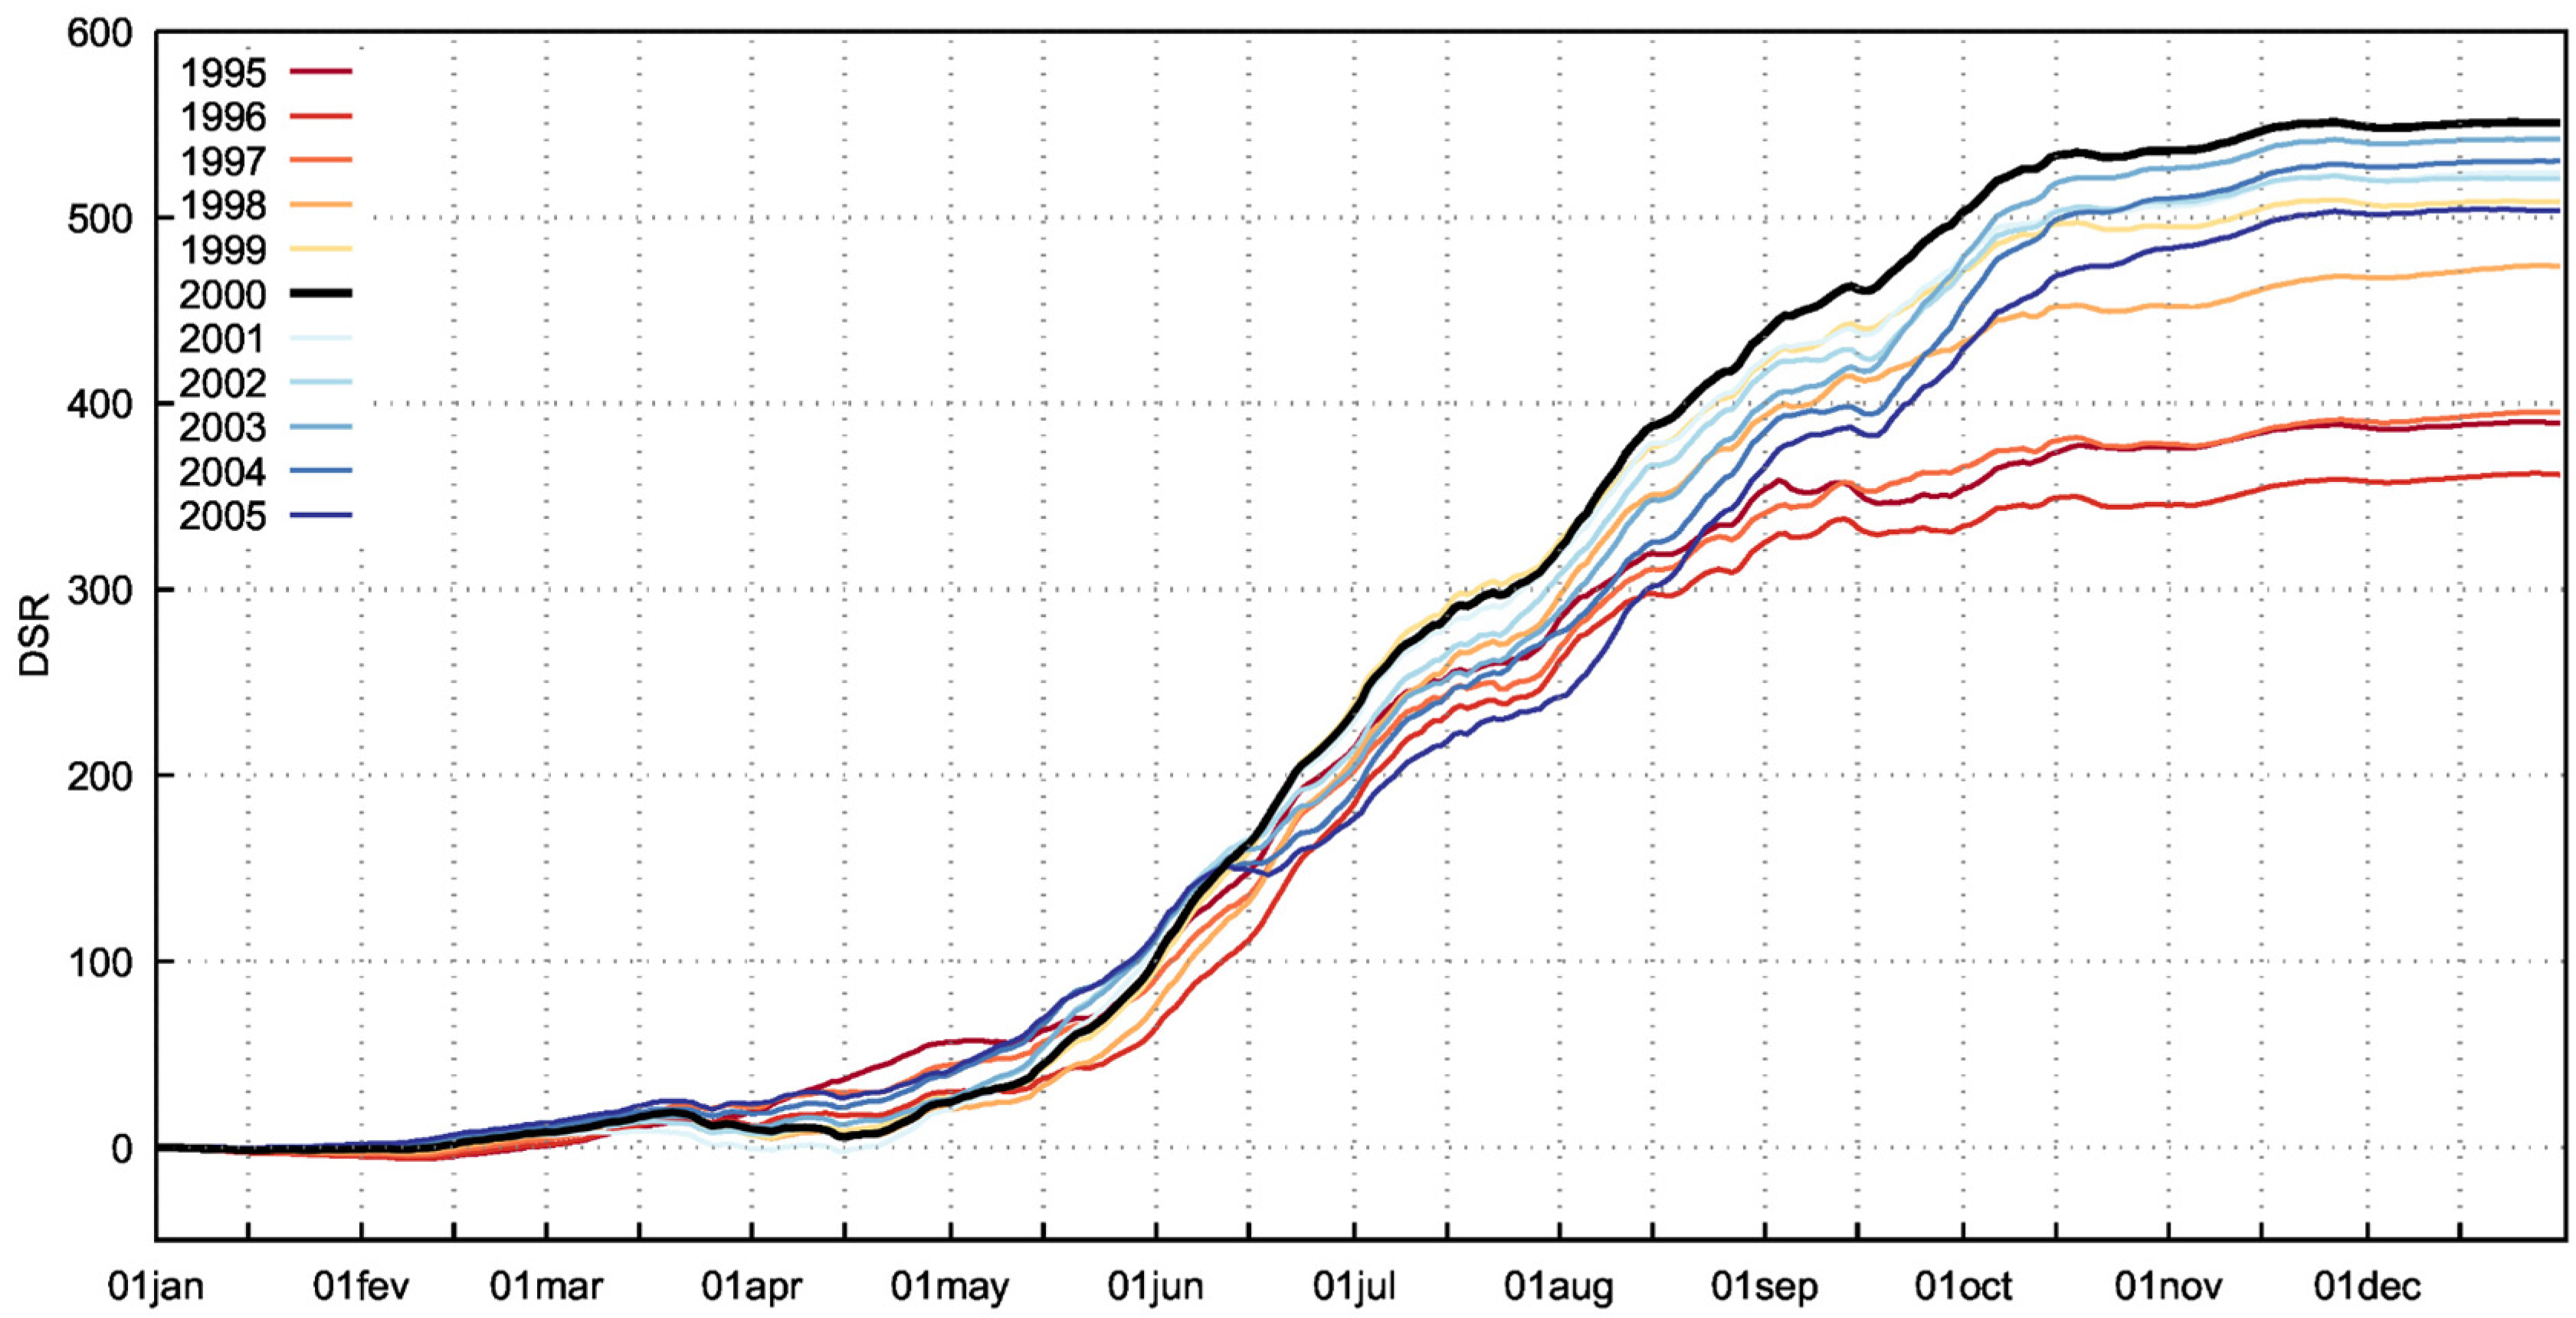
As a sensitivity test to these results, we studied the effect on the DSR difference curve produced by shifting the partition of the study period from 1994/95 (which generates the 1980–1994 and 1995–2018 periods) to 2004/05 (which generates 1980–2004 and 2005–2018). As shown in Figure 8, the split used in this study (1980–1999 and 2000–2018) maximizes the difference in the cumulative DSR by the year’s end, while being based on a balanced split of the study period (20 and 19 years, respectively). It is important to note that, regardless of the year of partition, the most recent period always shows an increased level of severity of the DSR.
3.3. Variation in Fire Weather: Spatio-Temporal Patterns of High FWI
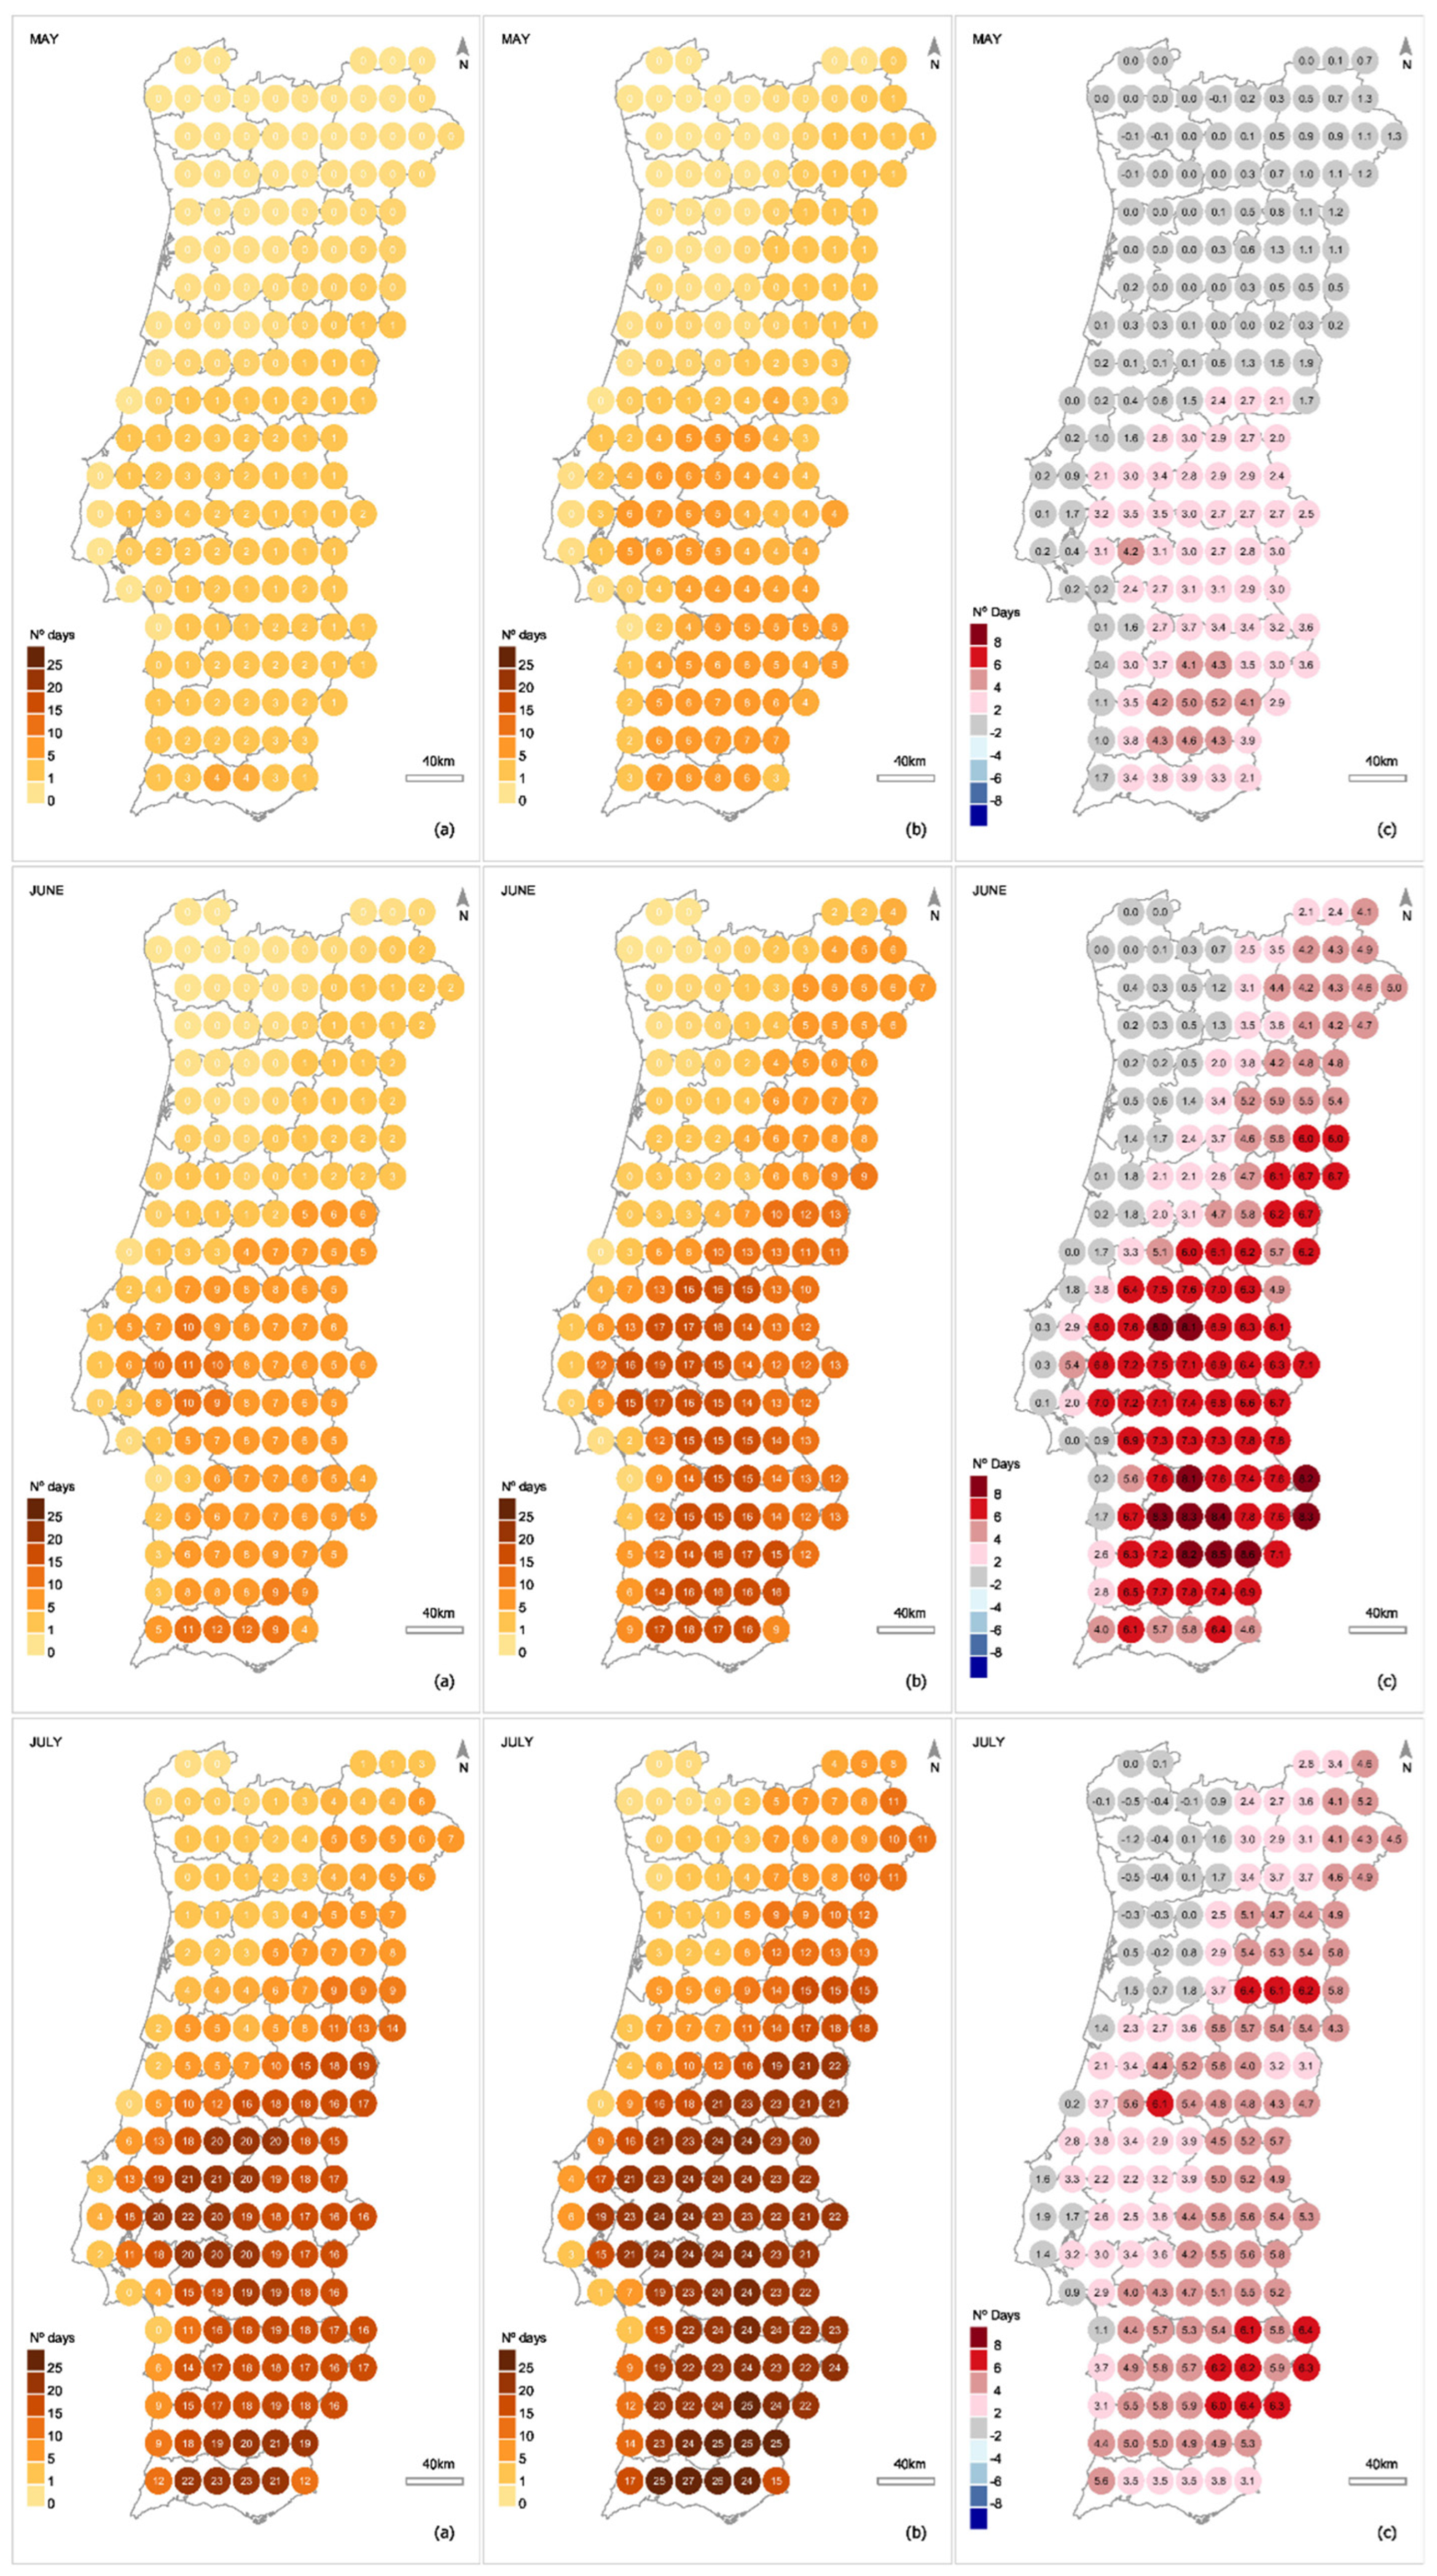
The preceding DSR results call for further clarification on fire weather changes during the spring. As mentioned, this analysis was based on daily FWI in a monthly comparison framework and focused on FWI values above a specific threshold. The triplicate charts presented in Figure 9 compare the average number of days with FWI greater than 38.3 during May, June and July in the same 1980–1999 and 2000–2018 half-periods. The calculation was performed for each of the 163 land points from the ERA5 reanalysis grid referred to above.
There is a slight increase of 2–5 days in the average number of “dangerous” days in May in the central/southern regions, which is absent in March and April (Figure S1). The magnitude of the increase is larger and expands northeastward during June, resulting in about 1/3 of the country having high fire danger for half a month (13–17 days). In June, in some areas of the grid, the number of days with the potential for extreme fire behavior more than doubles. In the following month, July, there is also an important increase in the number of high-danger days, although it is smaller compared to June. These results show the inclusion of June in the most critical months and the aggravation, to a lesser extent, of high fire danger in May.
Note also that the “new” May (from the 2000–2018 period) shows a distribution of high danger days similar to that of the “old” June (1980–1999 period) (Figure 9). This is consistent with the projected May FWI distribution for the last quarter of the present century exceeding (at the 25th and 75th percentiles, median and maximum values) the June FWI distribution in the reference period (1961–1990) [29].
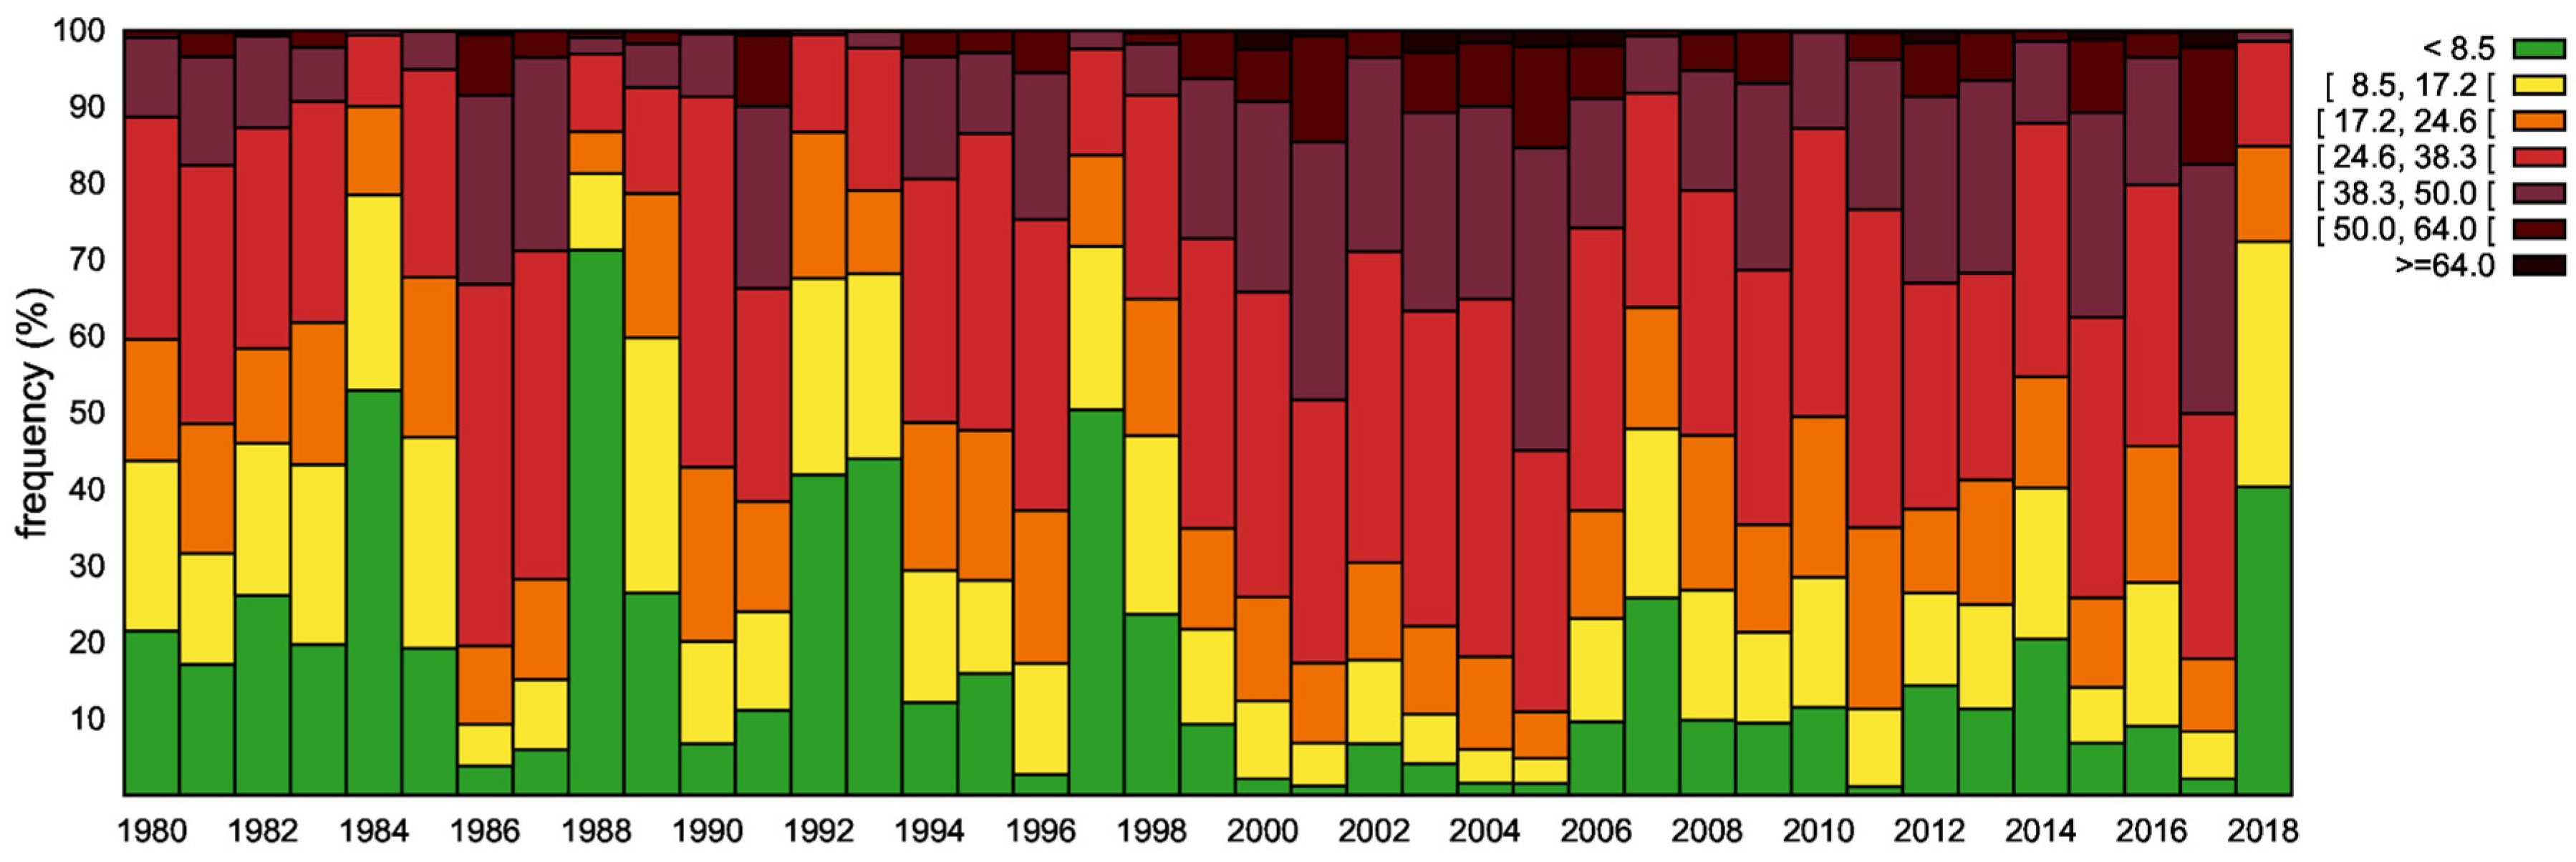
Given the pattern of change during June, we examined the frequency of daily danger classes during this month between 1980 and 2018 (Figure 10). There is a visible increase in the frequency of classes posing a high fire danger from the late 1990s, regardless of whether an FWI above 24.6 or 38.3 is considered. This aggravation is further noticeable in the emergence of two higher FWI classes (FWI above 50.0 and 64.0) from the late 1990s, which were introduced in Portugal in 2018 to improve the discrimination of the FWI index in the upper range of its values [57,58] (p. 231).
4. Conclusions
The results of the present study show relevant changes in the seasonality of wildfire occurrence in mainland Portugal over the last four decades (1980–2018) as a likely effect of consistent changes in fire weather. Overall, the fire season is longer today due to early wildfire activity favored by early fire-prone weather conditions. By contrast, there is no statistically significant extension of the season into the fall in both fire and weather data.
Based on daily burned area data, both monthly data and trend analysis on exceedance dates confirmed an earlier onset of fire activity in a statistical range of 23–50 days. Given these new findings, the projections made for the last quarter of the Portuguese 21st century [28,29] appear to be outdated. Regarding fire weather, the analysis based on cumulative DSR and daily and monthly FWI showed an early build-up of fire danger by comparison of the most recent period of 2000–2018 with the previous one, 1980–1999. The differentiation developed in May and especially in June, as confirmed by the analysis of days per month with high FWI values. FWI analysis showed the inclusion of June in the critical fire season and a slight increase in the number of high-danger days during May in the southern half of mainland Portugal. As expected, the changes between the two periods along the western Atlantic coast are less noticeable.
Moreover, the combined analysis of the evolution of June FWI values and annual cumulative DSR over the study period underlines a historical shift around the year 2000, also suggested elsewhere based on fire data patterns [17]. Importantly, maintenance of the obtained fire season lengthening rates may result in the medium-term merging of the two fire peaks in Portugal into a much longer fire season between March and September. We underline that the monthly fraction of annual burned area in March, April and May shows an upward trend at the 99% confidence level that is not seen in June, July and following months (Table S1). Furthermore, a consistent reduction in precipitation during spring in Portugal, especially in March, has been repeatedly studied [61,62]. The overlap of agricultural and other rural ignition cycles from late winter onward with increasingly earlier fire-prone weather conditions will interplay in currently unknown ways.
Finally, we suggest that a fire season spanning spring and summer, in a convergence between new atmospheric and human-related seasonalities, should be considered as a working scenario for comprehensive meteorological research supporting the management of the fire season. The multiple socioenvironmental interdependencies that shape aggravated fire seasons, as also discussed in [22] and [6], are suggestive of methodological and conceptual innovation in fire meteorology.
Supplementary Materials
The following supporting information can be downloaded at: https://www.mdpi.com/article/10.3390/meteorology2010006/s1, Table S1: Summary statistics of trend analysis based on Mann–Kendall test at 90%, 95% and 99% confidence levels. Figure S1: Average number of days with FWI above 38.3 during March by grid point (ERA5 0.25° × 0.25°). The left-hand chart (a) represents the 1980–1999 period, the middle one (b) represents the 2000–2018 period, and the right-hand chart (c) represents the point-by-point arithmetic difference (b) − (a).
Author Contributions
Conceptualization, P.S., M.C., J.R. and I.N.; Data curation, P.S. and M.C.; Funding acquisition, M.C. and I.N.; Methodology, P.S., M.C., J.R. and I.N.; Software, P.S. and J.R.; Validation, I.N.; Writing—original draft preparation, P.S. and M.C.; Writing—review and editing, P.S., M.C., J.R. and I.N. All authors have read and agreed to the published version of the manuscript.
Funding
This work was funded by the projects FIRESTORM, Weather and Behaviour of Fire Storms (PCIF/GFC/0109/2017) and FIREUSES, a political and environmental history of large wildfires in Portugal (1950–2020) (PTDC/HAR-HIS/4425/2021), both supported by Fundação para a Ciência e a Tecnologia (FCT/MCTES). The IHC-NOVA FCSH is funded through FCT/MCTES under projects UIDB/04209/2020, UIDP/04209/2020 and LA/P/0132/2020.
Data Availability Statement
The fire data used in this study is fully available for research at the following link: https://doi.org/10.1002/joc.7411 (accessed on 1 November 2022). Weather data and the FWI were retrieved from the ERA5 reanalysis implemented by ECMWF—European Centre for Medium-Range Weather Forecasts.
Acknowledgments
The authors thank IPMA colleagues Nuno Moreira and Paulo Pinto as well as FIREUSES colleagues Ana Queiroz, Joana Sousa, Frederico Ágoas, Marta Silva and José Ferreira for rich and supportive discussions. We would like to extend a special thanks to ICNF for providing the rural fire records and to IPMA for the weather data and other facilities that were made available.
Conflicts of Interest
The authors declare no conflict of interest.
References
- Viegas, D.; Viegas, M.T. A Relationship Between Rainfall and Burned Area for Portugal. Int. J. Wildland Fire 1994, 4, 11–16. [Google Scholar] [CrossRef]
- Pereira, M.; Calado, T.; DaCamara, C.; Calheiros, T. Effects of regional climate change on rural fires in Portugal. Clim. Res. 2013, 57, 187–200. [Google Scholar] [CrossRef]
- Kwiecien, O.; Braun, T.; Brunello, C.F.; Faulkner, P.; Hausmann, N.; Helle, G.; Hoggarth, J.A.; Ionita, M.; Jazwa, C.S.; Kelmelis, S.; et al. What we talk about when we talk about seasonality—A transdisciplinary review. Earth-Sci. Rev. 2021, 225, 103843. [Google Scholar] [CrossRef]
- van Wagner, C.E. Structure of the Canadian Forest Fire Weather Index; Canadian Forestry Service Publications n. 1333: Ottawa, ON, USA, 1974. [Google Scholar]
- Flannigan, M.; Wotton, B. Climate, weather, and area burned. In Forest Fires: Behaviour and Ecological Effects; Johnson, E.A., Miyanishi, K., Eds.; Academic Press: San Diego, CA, USA, 2001; pp. 351–373. [Google Scholar] [CrossRef]
- Venäläinen, A.; Korhonen, N.; Hyvärinen, O.; Koutsias, N.; Xystrakis, F.; Urbieta, I.R.; Moreno, J.M. Temporal variations and change in forest fire danger in Europe for 1960–2012. Nat. Hazards Earth Syst. Sci. 2014, 14, 1477–1490. [Google Scholar] [CrossRef]
- Turco, M.; Llasat, M.C.; von Hardenberg, J.; Provenzale, A. Impact of climate variability on summer fires in a Mediterranean environment (northeastern Iberian Peninsula). Clim. Chang. 2012, 116, 665–678. [Google Scholar] [CrossRef]
- Sousa, P.M.; Trigo, R.M.; Pereira, M.G.; Bedia, J.; Gutiérrez, J.M. Different approaches to model future burnt area in the Iberian Peninsula. Agric. For. Meteorol. 2015, 202, 11–25. [Google Scholar] [CrossRef]
- Littell, J.S.; Peterson, D.L.; Riley, K.L.; Liu, Y.; Luce, C. A review of the relationships between drought and forest fire in theUnited States. Glob. Chang. Biol. 2016, 22, 2353–2369. [Google Scholar] [CrossRef] [PubMed]
- Boer, M.M.; Bowman, D.M.J.S.; Murphy, B.P.; Cary, G.J.; Cochrane, A.M.; Fensham, R.J.; Krawchuk, A.M.; Price, O.F.; De Dios, V.R.; Williams, R.J.; et al. Future changes in climatic water balance determine potential for transformational shifts in Australian fire regimes. Environ. Res. Lett. 2016, 11, 065002. [Google Scholar] [CrossRef]
- Gouveia, C.M.; Bistinas, I.; Liberato, M.L.; Bastos, A.; Koutsias, N.; Trigo, R. The outstanding synergy between drought, heatwaves and fuel on the 2007 Southern Greece exceptional fire season. Agric. For. Meteorol. 2016, 218–219, 135–145. [Google Scholar] [CrossRef]
- Giannaros, T.M.; Kotroni, V.; Lagouvardos, K. Climatology and trend analysis (1987–2016) of fire weather in the Euro-Mediterranean. Int. J. Clim. 2020, 41, E491–E508. [Google Scholar] [CrossRef]
- Trigo, R.M.; Pereira, J.M.C.; Pereira, M.G.; Mota, B.; Calado, T.J.; Dacamara, C.C.; Santo, F.E. Atmospheric conditions associated with the exceptional fire season of 2003 in Portugal. Int. J. Clim. 2006, 26, 1741–1757. [Google Scholar] [CrossRef]
- Moreira, F.; Viedma, O.; Arianoutsou, M.; Curt, T.; Koutsias, N.; Rigolot, E.; Barbati, A.; Corona, P.; Vaz, P.; Xanthopoulos, G.; et al. Landscape—Wildfire interactions in southern Europe: Implications for landscape management. J. Environ. Manag. 2011, 92, 2389–2402. [Google Scholar] [CrossRef]
- Ruffault, J.; Curt, T.; Martin-StPaul, N.K.; Moron, V.; Trigo, R.M. Extreme wildfire events are linked to global-change-type droughts in the northern Mediterranean. Nat. Hazards Earth Syst. Sci. 2018, 18, 847–856. [Google Scholar] [CrossRef]
- Pinto, P.; Silva, P.; Viegas, D.X.; Almeida, M.; Raposo, J.; Ribeiro, L.M. Influence of Convectively Driven Flows in the Course of a Large Fire in Portugal: The Case of Pedrógão Grande. Atmosphere 2022, 13, 414. [Google Scholar] [CrossRef]
- Carmo, M.; Ferreira, J.; Mendes, M.; Silva, A.; Silva, P.; Alves, D.; Reis, L.; Novo, I.; Viegas, D.X. The climatology of extreme wildfires in Portugal, 1980–2018: Contributions to forecasting and preparedness. Int. J. Clim. 2021, 42, 3123–3146. [Google Scholar] [CrossRef]
- Carnicer, J.; Alegria, A.; Giannakopoulos, C.; Di Giuseppe, F.; Karali, A.; Koutsias, N.; Lionello, P.; Parrington, M.; Vitolo, C. Global warming is shifting the relationships between fire weather and realized fire-induced CO2 emissions in Europe. Sci. Rep. 2022, 12, 10365. [Google Scholar] [CrossRef] [PubMed]
- Wotton, B.M.; Flannigan, M.D. Length of the fire season in a changing climate. For. Chron. 1993, 69, 187–192. [Google Scholar] [CrossRef]
- Clarke, H.; Lucas, C.; Smith, P. Changes in Australian fire weather between 1973 and 2010. Int. J. Clim. 2012, 33, 931–944. [Google Scholar] [CrossRef]
- Salloum, L.; Mitri, G. Assessment of the temporal pattern of fire activity and weather variability in Lebanon. Int. J. Wildland Fire 2014, 23, 503–509. [Google Scholar] [CrossRef]
- Jolly, W.M.; Cochrane, M.A.; Freeborn, P.H.; Holden, Z.A.; Brown, T.J.; Williamson, G.J.; Bowman, D.M.J.S. Climate-induced variations in global wildfire danger from 1979 to 2013. Nat. Commun. 2015, 6, 7537. [Google Scholar] [CrossRef]
- Westerling, A.L. Increasing western US forest wildfire activity: Sensitivity to changes in the timing of spring. Philos. Trans. R. Soc. B Biol. Sci. 2016, 371, 20150178. [Google Scholar] [CrossRef]
- Jain, P.; Wang, X.; Flannigan, M.D. Trend analysis of fire season length and extreme fire weather in North America between 1979 and 2015. Int. J. Wildland Fire 2018, 26, 1009–1020. [Google Scholar] [CrossRef]
- United Nations Environment Programme (UNEP). Spreading like Wildfire—The Rising Threat of Extraordinary Landscape Fires. A UNEP Rapid Response Assessment. Nairobi. 2022. Available online: https://www.unep.org/resources/report/spreading-wildfire-rising-threat-extraordinary-landscape-fires (accessed on 1 November 2022).
- Liu, Y.; Stanturf, J.; Goodrick, S. Trends in global wildfire potential in a changing climate. For. Ecol. Manag. 2010, 259, 685–697. [Google Scholar] [CrossRef]
- Nitschke, C.R.; Innes, J. Climatic change and fire potential in South-Central British Columbia, Canada. Glob. Chang. Biol. 2008, 14, 841–855. [Google Scholar] [CrossRef]
- Moriondo, M.; Good, P.; Durao, R.; Bindi, M.; Giannakopoulos, C.; Corte-Real, J. Potential impact of climate change on fire risk in the Mediterranean area. Clim. Res. 2006, 31, 85–95. [Google Scholar] [CrossRef]
- Carvalho, A.; Flannigan, M.D.; Logan, K.A.; Gowman, L.M.; Miranda, A.I.; Borrego, C. The impact of spatial resolution on area burned and fire occurrence projections in Portugal under climate change. Clim. Chang. 2009, 98, 177–197. [Google Scholar] [CrossRef]
- Rodrigues, M.; Camprubí, C.; Balaguer-Romano, R.; Megía, C.J.C.; Castañares, F.; Ruffault, J.; Fernandes, P.M.; de Dios, V.R. Drivers and implications of the extreme 2022 wildfire season in Southwest Europe. Sci. Total Environ. 2023, 859, 160320. [Google Scholar] [CrossRef]
- Turco, M.; Jerez, S.; Augusto, S.; Tarín-Carrasco, P.; Ratola, N.; Jiménez-Guerrero, P.; Trigo, R.M. Climate drivers of the 2017 devastating fires in Portugal. Sci. Rep. 2019, 9, 13886. [Google Scholar] [CrossRef]
- Trigo, R.M.; Sousa, P.M.; Pereira, M.G.; Rasilla, D.; Gouveia, C.M. Modelling wildfire activity in Iberia with different atmospheric circulation weather types. Int. J. Clim. 2013, 36, 2761–2778. [Google Scholar] [CrossRef]
- da Camara, C.C.; Trigo, R.M.; Nascimento, M.L. Characterising the secondary peak of Iberian fires in March. In Advances in Forest Fire Research 2014; Viegas, D.X., Ed.; Imprensa da Universidade de Coimbra: Coimbra, Portugal, 2014; pp. 1671–1682. [Google Scholar] [CrossRef]
- Calheiros, T.; Nunes, J.P.; Pereira, M. Recent evolution of spatial and temporal patterns of burnt areas and fire weather risk in the Iberian Peninsula. Agric. For. Meteorol. 2020, 287, 107923. [Google Scholar] [CrossRef]
- Le Page, Y.; Oom, D.; Silva, J.; Jönsson, P.; Pereira, J.M.C. Seasonality of vegetation fires as modified by human action: Observing the deviation from eco-climatic fire regimes. Glob. Ecol. Biogeogr. 2010, 19, 575–588. [Google Scholar] [CrossRef]
- Stambaugh, M.C.; Marschall, J.M.; Abadir, E.R.; Jones, B.C.; Brose, P.H.; Dey, D.C.; Guyette, R.P. Wave of fire: An anthropogenic signal in historical fire regimes across central Pennsylvania, USA. Ecosphere 2018, 9, e02222. [Google Scholar] [CrossRef]
- Pechony, O.; Shindell, D.T. Driving forces of global wildfires over the past millennium and the forthcoming century. Proc. Natl. Acad. Sci. USA 2010, 107, 19167–19170. [Google Scholar] [CrossRef] [PubMed]
- Moreira, F.; Rego, F.C.; Godinho-Ferreira, P. Temporal (1958–1995) pattern of change in a cultural landscape of northwestern Portugal: Implications for fire occurrence. Landsc. Ecol. 2001, 16, 557–567. [Google Scholar] [CrossRef]
- Fernandes, P.M.; Loureiro, C.; Guiomar, N.; Pezzatti, G.B.; Manso, F.T.; Lopes, L. The dynamics and drivers of fuel and fire in the Portuguese public forest. J. Environ. Manag. 2014, 146, 373–382. [Google Scholar] [CrossRef] [PubMed]
- Balch, J.K.; Bradley, B.A.; Abatzoglou, J.T.; Nagy, R.C.; Fusco, E.J.; Mahood, A.L. Human-started wildfires expand the fire niche across the United States. Proc. Natl. Acad. Sci. USA 2017, 114, 2946–2951. [Google Scholar] [CrossRef]
- Bowman, D.M.J.S.; Balch, J.; Artaxo, P.; Bond, W.J.; Cochrane, M.A.; D’Antonio, C.M.; DeFries, R.; Johnston, F.H.; Keeley, J.E.; Krawchuk, M.A.; et al. The human dimension of fire regimes on Earth. J. Biogeogr. 2011, 38, 2223–2236. [Google Scholar] [CrossRef]
- Sousa, J.; Çinar, C.; Carmo, M.; Malagoli, M.A.S. Social and historical dimensions of wildfire research and the consideration given to practical knowledge: A systematic review. Nat. Hazards 2022, 114, 1103–1123. [Google Scholar] [CrossRef]
- Silva, P.; Carmo, M.; Rio, J.; Novo, I. Evolution of the annual cycle of Burned Area in Portugal from 1980 to 2018: Implications for fire season management. In Advances in Forest Fire Research 2022, Chapter 4—Risk Assessment, Proceedings of the IX International Conference on Forest Fire Research, Coimbra, Portugal, 11–18 November 2022; Viegas, D.X., Ribeiro, L.M., Eds.; Imprensa da Universidade de Coimbra: Coimbra, Portugal, 2022; pp. 1095–1100. [Google Scholar] [CrossRef]
- Instituto da Conservação da Natureza e das Florestas, IP (ICNF). Available online: https://www.icnf.pt/florestas/gfr/gfrgestaoinformacao/estatisticas (accessed on 10 October 2020).
- Carvalho, J.B.; Lopes, J.P. Classificação de Incêndios Florestais: Manual do Utilizador; Direcção-Geral das Florestas: Lisboa, Portugal, 2001; p. 34. [Google Scholar]
- Pereira, M.G.; Malamud, B.D.; Trigo, R.M.; Alves, P.I. The history and characteristics of the 1980–2005 Portuguese rural fire database. Nat. Hazards Earth Syst. Sci. 2011, 11, 3343–3358. [Google Scholar] [CrossRef]
- van Wagner, C.E. Development and Structure of the Canadian Forest Fire Weather Index System; Forestry Technical Report 35; Canadian Forestry Service: Ottawa, ON, USA, 1987; p. 37. [Google Scholar]
- Nunes, S.A.; DaCamara, C.C.; Turkman, K.F.; Calado, T.J.; Trigo, R.M.; Turkman, M.A.A. Wildland fire potential outlooks for Portugal using meteorological indices of fire danger. Nat. Hazards Earth Syst. Sci. 2019, 19, 1459–1470. [Google Scholar] [CrossRef]
- Silva, P.S.; Bastos, A.; Libonati, R.; Rodrigues, J.A.; DaCamara, C.C. Impacts of the 1.5 °C global warming target on future burned area in the Brazilian Cerrado. For. Ecol. Manag. 2019, 446, 193–203. [Google Scholar] [CrossRef]
- Ertugrul, M.; Ozel, H.B.; Varol, T.; Cetin, M.; Sevik, H. Investigation of the relationship between burned areas and climate factors in large forest fires in the Çanakkale region. Environ. Monit. Assess. 2019, 191, 737. [Google Scholar] [CrossRef] [PubMed]
- Amatulli, G.; Camia, A.; San-Miguel-Ayanz, J. Estimating future burned areas under changing climate in the EU-Mediterranean countries. Sci. Total Environ. 2013, 450–451, 209–222. [Google Scholar] [CrossRef] [PubMed]
- Flannigan, M.D.; Logan, K.A.; Amiro, B.D.; Skinner, W.R.; Stocks, B.J. Future Area Burned in Canada. Clim. Chang. 2005, 72, 1–16. [Google Scholar] [CrossRef]
- Instituto Português do Mar e da Atmosfera, IP (IPMA). Available online: http://multisites.ipma.pt/anpc/risco-de-incendio-acompanhamento/ (accessed on 12 October 2022).
- Vitolo, C.; Di Giuseppe, F.; Barnard, C.; Coughlan, R.; San-Miguel-Ayanz, J.; Libertá, G.; Krzeminski, B. ERA5-based global meteorological wildfire danger maps. Sci. Data 2020, 7, 216. [Google Scholar] [CrossRef]
- CEMS. Fire Danger Indices Historical Data from the Copernicus Emergency Management Service (Version 3.0). ECMWF. 2019. Available online: https://cds.climate.copernicus.eu/cdsapp#!/dataset/10.24381/cds.0e89c522?tab=overview (accessed on 1 March 2022). [CrossRef]
- Palheiro, P.M.; Fernandes, P.; Cruz, M.G. A fire behaviour-based fire danger classification for maritime pine stands: Comparison of two approaches. For. Ecol. Manag. 2006, 234, S54. [Google Scholar] [CrossRef]
- Instituto Português do Mar e da Atmosfera, IP (IPMA). Available online: https://www.ipma.pt/pt/riscoincendio/fwi/ (accessed on 25 October 2022).
- Comissão Técnica Independente(CTI); Guerreiro, J.; Fonseca, C.; Salgueiro, A.; Fernandes, P.; Lopez Iglésias, E.; de Neufville, R.; Mateus, F.; Castellnou Ribau, M.; Sande Silva, J.; et al. (Eds.) Avaliação dos Incêndios Ocorridos Entre 14 e 16 de Outubro de 2017 em Portugal Continental. Relatório Final; Assembleia da República: Lisboa, Portugal, 2018. Available online: https://www.portugal.gov.pt (accessed on 4 November 2022).
- Viegas, D.X.; Almeida, M.F.; Ribeiro, L.M. (Eds.) Análise dos Incêndios Florestais Ocorridos a 15 de Outubro de 2017. Centro de Estudos Sobre Incêndios Florestais ADAI/LAETA; Universidade de Coimbra: Coimbra, Portugal, 2019. [Google Scholar]
- Viegas, D.X.; Almeida, M.F.; Ribeiro, L.M. (Eds.) O Complexo de Incêndios de Pedrogão Grande e Concelhos Limítrofes, Iniciado a 17 de Junho de 2017. Centro de Estudos sobre Incêndios Florestais ADAI/LAETA; Universidade de Coimbra: Coimbra, Portugal, 2017. [Google Scholar]
- de Lima, M.I.P.; Santo, F.E.; Ramos, A.M.; de Lima, J.L. Recent changes in daily precipitation and surface air temperature extremes in mainland Portugal, in the period 1941–2007. Atmos. Res. 2013, 127, 195–209. [Google Scholar] [CrossRef]
- Portela, M.; Espinosa, L.; Zelenakova, M. Long-Term Rainfall Trends and Their Variability in Mainland Portugal in the Last 106 Years. Climate 2020, 8, 146. [Google Scholar] [CrossRef]
Figure 1.
Location of the study area, continental Portugal, in the context of Europe and the North Atlantic. The axes indicate latitude (YY) and longitude (XX) coordinates.
Figure 1.
Location of the study area, continental Portugal, in the context of Europe and the North Atlantic. The axes indicate latitude (YY) and longitude (XX) coordinates.

Figure 2.
(a) Daily mean values of the number of fires (black solid line) and burned area (red vertical lines) in the period of 1980–2018. The peaks on 17 June and 15 October are mainly due to the exceptional contribution of 2017. (b) Monthly average values of air temperature (orange line) and total precipitation (blue columns) over mainland Portugal (163 grid points) based on 30 years of ERA5 reanalysis (1981–2010). For details on data, see Section 2.

Figure 3.
Distribution of the monthly fraction of annual burned area in the period of 1980 to 2018, indicating the 10th, 25th, 50th, 75th and 90th percentiles (box and whisker plot), the mean (red dots) and the maximum monthly values (black dots labeled with the year of occurrence).
Figure 3.
Distribution of the monthly fraction of annual burned area in the period of 1980 to 2018, indicating the 10th, 25th, 50th, 75th and 90th percentiles (box and whisker plot), the mean (red dots) and the maximum monthly values (black dots labeled with the year of occurrence).

Figure 4.
Annual evolution of the fraction of annual burned area recorded before (brown bars, Jan-Jun months with increasing trend, ρ-value = 0.0052), during (orange bars, Jul-Sep months with decreasing trend, ρ-value = 0.0011) and after (yellow bars, Oct-Dec months with no trend, ρ-value = 0.0429) the most critical months for wildfire incidence in the period of 1980–2018.

Figure 5.
Exceeding dates for successive fractions (1%, 2%, …, 99%) of the annual burned area in each year from 1980 to 2018. Gray dots represent the 99 sequential dates on which each fraction is reached for all years of the study period. Colored lines represent the average dates for the first (1980–1999, blue line) and the second halves (2000–2018, red line) of the study period.

Figure 6.
Evolution of the dates on which the 15% (blue points) and 85% (red points) fractions of the total annual burned area were exceeded in the period of 1980–2018, and corresponding adjusted linear regressions. Gray bars show the annual burned area.
Figure 6.
Evolution of the dates on which the 15% (blue points) and 85% (red points) fractions of the total annual burned area were exceeded in the period of 1980–2018, and corresponding adjusted linear regressions. Gray bars show the annual burned area.

Figure 7.
(a) Daily mean cumulative DSR values in the first (1980–1999, blue curve) and second halves (2000–2018, red curve) of the study period. The DSR is cumulated daily from 1 January to 31 December each year. (b) Daily difference between the two periods’ DSR mean values (1980–1999 and 2000–2018) with modified scale on the Y-axis.

Figure 8.
Sensitivity analysis of the DSR difference curve (Figure 7b) by changing the partition year of the study period with a forward and backward shift of a maximum of 5 years. The black curve (labeled in the graph as 2000) shows that the maximum difference in the mean cumulative DSR by the end of the year is obtained when dividing the study period into 1980–1999 and 2000–2018. The DSR is cumulated daily from 1 January to 31 December each year.

Figure 9.
Average number of days per month with FWI above 38.3 by grid point (ERA5 0.25° × 0.25°). From top to bottom: May, June and July. Left-hand charts (a) represent the 1980–1999 period, middle charts (b) represent the 2000–2018 period, and right-hand charts (c) represent the point-by-point arithmetic difference (b) − (a).

Figure 10.
Interannual variation in the average frequencies by FWI danger class in the month of June between 1980 and 2018. The classes shown are currently used by the meteorological and fire management authorities of Portugal [57,58] (p. 231): <8.5, [8.5, 17.1], [17.2, 24.6], [24.7, 38.3], [38.4, 50.0], [50.1, 64.0], >64.

Disclaimer/Publisher’s Note: The statements, opinions and data contained in all publications are solely those of the individual author(s) and contributor(s) and not of MDPI and/or the editor(s). MDPI and/or the editor(s) disclaim responsibility for any injury to people or property resulting from any ideas, methods, instructions or products referred to in the content. |
© 2023 by the authors. Licensee MDPI, Basel, Switzerland. This article is an open access article distributed under the terms and conditions of the Creative Commons Attribution (CC BY) license (https://creativecommons.org/licenses/by/4.0/).
Share and Cite
MDPI and ACS Style
Silva, P.; Carmo, M.; Rio, J.; Novo, I. Changes in the Seasonality of Fire Activity and Fire Weather in Portugal: Is the Wildfire Season Really Longer? Meteorology 2023, 2, 74-86. https://doi.org/10.3390/meteorology2010006
AMA Style
Silva P, Carmo M, Rio J, Novo I. Changes in the Seasonality of Fire Activity and Fire Weather in Portugal: Is the Wildfire Season Really Longer? Meteorology. 2023; 2(1):74-86. https://doi.org/10.3390/meteorology2010006
Chicago/Turabian StyleSilva, Pedro, Miguel Carmo, João Rio, and Ilda Novo. 2023. "Changes in the Seasonality of Fire Activity and Fire Weather in Portugal: Is the Wildfire Season Really Longer?" Meteorology 2, no. 1: 74-86. https://doi.org/10.3390/meteorology2010006