Article

Investigation of the Thermal Stability of a Solar Absorber Processed through a Hydrothermal Technique

1
UNESCO-UNISA Africa Chair in Nanosciences-Nanotechnology, College of Graduate Studies, University of South Africa, Muckleneuk Ridge, Pretoria P.O. Box 392, South Africa
2
Nanoscience’s African Network (NANOAFNET), iThemba LABS-National Research Foundation, 1 Old Faure Road, P.O. Box 722, Somerset West, Cape Town 7129, South Africa
3
School of Preliminary Studies (SPS) Science, Physics Unit, Ibrahim Badamasi Babangida University, Lapai P.M.B 11, Niger State, Nigeria
4
Department of Physics, Busitema University, Tororo P.O. Box 236, Uganda
5
Department of Physics, Islamic University in Uganda, Mbale P.O. Box 2555, Uganda
6
Department of Mechanical Engineering, Cape Peninsula University of Technology, P.O. Box 1906, Bellville 7535, South Africa
7
Nanoenergy for Sustainable Development in Africa (NESDAF), P.O. Box 362, Western Cape 7139, South Africa
8
Department of Physics, Faculty of Natural Science, University of the Western Cape, Private Bag X 17, Bellville 7535, South Africa
9
Future Leader-African Independent Researcher, College of Natural and Computational Science, Physics, Adigra University, Adigrat P.O. Box 50, Ethiopia
*
Author to whom correspondence should be addressed.
Solar 2022, 2(4), 414-431; https://doi.org/10.3390/solar2040025
Submission received: 23 May 2022 / Revised: 4 July 2022 / Accepted: 5 July 2022 / Published: 28 September 2022
(This article belongs to the Topic Solar Thermal Energy and Photovoltaic Systems)

Abstract

:
In this work, we study the thermal stability of a hydrothermally treated stainless steel (SS) selective solar absorber by annealing in air in a temperature range between 300 °C and 700 °C for a soaking time of 2 h. Thermal stability testing in the presence of air is critical if the vacuum is breached. Therefore, the SS was characterized by X-ray diffraction (XRD), mechanical, and optical techniques. The XRD analysis shows that the grain size of the as-treated absorber is 67 nm, whereas those of the annealed absorbers were found to be in the range between 66 and 38 nm. The phase of the as-treated and annealed SS was further identified by XRD as Fe2O3. The EDS result shows that the elemental components of the SS were C, Cr, Fe, and O. The strain (ε) and stress (σ) calculated for the as-treated absorber are 1.2 × 10⁻¹ and −2.9 GPa, whereas the annealed absorbers are found in the range of 4.4 × 10⁻¹ to 5.2 × 10⁻¹ and −121.6 to −103.2 GPa, respectively, at 300–700 °C. The as-treated SS absorbers exhibit a good spectra selectivity of 0.938/0.431 = 2.176, which compares with 0.941/0.403 = 2.335 after being annealed at 300 °C and 0.884/0.179 = 4.939 after being annealed at 700 °C. These results indicate a small improvement in absorptivity (0.941) and emissivity (0.403) after annealing at 300 °C, followed by a significant decrease after annealing at 700 °C. The obtained analysis confirms that the annealed SS absorber exhibits excellent selectivity and is suitable to withstand any thermal condition (≤700 °C) in air. Thus, using a cost-effective approach as demonstrated in this study, the as-treated and annealed SS absorber could be used for photo-thermal conversion applications.

1. Introduction

As a result of the global awareness of greenhouse gas emissions, air pollution, and energy security issues, many governments and researchers around the world have been motivated to search for alternative energies that must be environmentally friendly, clean, affordable, and sustainable [1]. Seeking an ecofriendly, cost-effective, and feasible alternative to overcome the energy crisis is one of the most significant challenges humanity faces today [2]. Solar energy is one of the attractive solutions to replace fossil fuels, among other diverse alternative energy sources, such as nuclear power, tides, hydro, and wind. Due to the abundance of solar energy throughout the world, its low cost, and environmental friendliness, it has piqued the interest of academia and industry [3]. Solar energy is harnessed through photovoltaic and solar thermal collectors. The latter is a promising solar energy harvesting technology that could be used for a variety of purposes, including domestic hot water, solar thermal generation, industrial cooling, seawater desalination [4], and electricity generation, among other things [5]. The solar selective absorber surface is the vital component of the solar thermal collector because it absorbs high radiant energy in the UV–Vis–NIR range of the solar spectrum and exhibits low emittance in the infrared range [6,7]. Photo-thermal conversion efficiency requires high temperature, and hence operating temperatures of the collectors can rise up to 1100 °C. However, as the temperature rises, the loss of thermal radiation energy increases, and the surface’s structure and performance are affected to a large extent [8]. Zhiyan Yang et al. investigated the solar selectivity and air thermal stability of a spray-fabricated cobalt–nickel–iron oxide coating. The thermal stability of the two-layer Ni0.9Fe0.1Co2Oy coatings was evaluated by continuously heating at 500 °C in the air for 48 h. According to this report, the solar absorptance (α) remained unchanged at 0.93, while the emittance (ε) increased gradually from 0.11 to 0.30 [9]. Xiang-Hu et al. reported the structure, optical properties, and thermal stability of Al2O3-WC nanocomposite ceramic spectrally selective solar absorbers, which exhibit α of 0.94 and ε of 0.08 at 600 °C. Based on their report, the absorber exhibits good thermal stability in a vacuum at 600 °C for 5 h. The absorber seems to exhibit good thermal stability in a vacuum at 600 °C for 5 h [7]. The operating temperature of the most common solar absorbing coatings is between 200 and 600 °C. As a result, a type of solar coating with exceptional thermal stability is sorely needed in environments with high temperatures (T > 600 °C) [5].
The most commonly used methods in the world for preparing solar selective coatings include magnetron sputtering, paint coating, and sol-gel [10,11]. Yuping Ning et al. used DC magnetron sputtering to fabricate a NiCrAlO/Al2O3 solar selective coating, which exhibits high absorptance and low emittance of 0.964 and 0.066 at 25 °C [12]. Vasiliy Pelenovich et al. demonstrated the possibility of using non-equilibrium reactive RF magnetron sputtering to deposit graded solar selective absorbers. The authors record the highest absorptance and emittance at 0.909 and 0.0670, respectively [13]. To enhance the thermal stability of the solar selective metal/dielectric multilayer, Ying Wu et al. employed a multi-target magnetron sputtering method to form Cu, SiO2, and Cr layers, whereas the Al2O3 layer was formed by atomic-layer-deposition (ALD). According to the authors, the as-deposited sample showed α of ~0.954 and ε of ~0.196 (773 K), demonstrating its good optical properties. After heat treatment at 500 °C for 72 h, α drops from ~0.033 to 0.951, while ε decreases from ~0.028 to 0.168 [14]. Adiba et al. investigated the structural and optical properties of sol-gel-synthesized NiO nanoparticles for selective solar absorbers and transparent heat mirror applications. The authors determined the optical band gap of the nanoparticles using UV-Vis absorption spectroscopy and discovered that their absorption edge is in the ultraviolet region of the solar spectrum, confirming their potential for use as selective solar absorbers and transparent heat mirrors [15]. Qihua et al. demonstrated that a (sol-gel prepared) reduced-graphene-oxide-based, spectrally selective absorber (rGO-SSA) has a low thermal emittance (ε = 0.04) and a high solar absorption of α = 0.92 at 800 °C [16]. The CoCuMnOx spinel ceramic film was deposited onto stainless steel 304 through the sol-gel dip coating method to form a solar selective coating that exhibits a selectivity of 0.85 [17]. Tesfamichael et al. synthesized and characterized a FeMnCuOx particle-based solar selective absorbing paint coating. Black carbon pigment was combined with silicone and phenoxy resin to form the coating [18].
Magnetron sputtering technology produces a coating with excellent bonding and optical properties, but it requires a vacuum environment, which in turns requires expensive equipment for mass production [19]. Solar absorbers prepared using paint and sol-gel methods suffer from a lack of adhesion between the film and the substrate, and they exhibit high emission, which has a significant negative effect on the absorber’s performance [20,21].
Therefore, the hydrothermal method may be a better alternative because it has several advantages that overcome some of the above-mentioned challenges. These include low process cost, simplicity, pollution-free operation, and ease of application on a large scale [3]. As a result, the method was used to treat the surface of the stainless steel (SS) in this study in order to enhance its solar absorption property and to investigate the effect of annealing temperatures on the structural and optical properties of the treated surface. Indeed, due to its superior qualities compared to other metallic systems, SS is widely used in a wide variety of applications [22]. Stainless steel (SS) is often used in the fabrication of solar absorbers and can be rarely corroded under normal temperature and alkaline conditions. It has been reported that the corrosion process of the SS can be accelerated by hydrothermal conditions, leading to a special nano/microstructure oxide surface. The hydrothermal condition is very sensitive to film preparation parameters, such as time and temperature, which are very useful for obtaining the desired morphology and exploring an improved new optical phase of the material. For this reason, the hydrothermal heat treatment has been demonstrated to be a feasible technique to prepare solar selective absorbers for a photo-thermal conversion application [3].
Thermal stability of selective solar absorber coatings is critical, as the absorber degrades over time at operating temperatures when exposed to vacuum or air, reducing the life of the absorber and eventually resulting in failure [23,24,25]. Thermal stability testing in the presence of air is critical if the vacuum is breached [26]. Herein, we report the thermal stability of stainless steel (SS) solar absorbers that are hydrothermally treated and annealed in the temperature range between 300 and 700 °C.

2. Materials and Methods

2.1. Materials

Six sheets of stainless steel (434-L. SAE Grade) with square shapes of size 2.00 cm × 2.00 cm, NaOH in pellet form (500 g, Semiconductor Grade, 99.99% Trace metals basis) and solvents such as ethanol (200 Proof, Anhydrous, ≥99.5%) and acetone (Laboratory Reagent, ≥99.5%) were obtained from Sigma Aldrich. Teflon-line autoclaves (with 4 cm of diameter and 6 cm of height) used for hydrothermal treatment were obtained from KIMIX Chemical & Lab Supplies (Ruco bank unit 13, Boston circle airport Industrial north, Western Cape, 7525 South Africa). Chemical products such as ethanol, acetone, and NaOH in pellet form were of analytical grade and hence used without any further purification.

2.2. Methods

The hydrothermal technique was used to treat six sets of stainless steel (SS). The treatment process of the SS is detailed elsewhere [3]. Briefly, the SS was cleaned in ethanol, followed by acetone, and finally rinsed using deionized water. The sample in the autoclave in the alkaline solution was heated in a laboratory oven for 1 h at 200 °C to modify its surface layer, thus forming a film of different structure and composition.
To determine the thermal stability of the treated SS solar absorber, five specimens with the obtained films were isothermally heated between 300 °C and 700 °C in air in a furnace (Elite Thermal Systems Limited model TSH12/50/610-2416CG) for 2 h at each selected temperature: 300, 400, 500, 600 and 700 °C. The temperature was raised from room temperature to the required temperature at a rate of 9 °C/min and then cooled at a rate of 10 °C/min after attaining the required duration. The used furnace has a proportional–integral–derivative (PID) temperature control system to improve the accuracy of the annealing process; we estimated an average of 0.1 °C in precision after performing a number of experiments using the same furnace. One film was not annealed in order to serve as the reference of the sample.

2.3. Structural and Optical Characterization

The structural composition of samples was investigated by using X-ray diffraction (Bruker AXS D8 X-ray diffractometer, Cu-Kα radiation of average wavelength ~1.54 Å, operating at 40 kV and 35 mA in Bragg-Brentano geometry, Billerica, MA, USA). XRD measurements provide significant information on the width and grain size of crystallites, and phase’s identification [27]. The morphology and elemental composition of all samples were studied by High Resolution–Scanning Electron Microscopy (HR-SEM: Hitachi X-650 electron microscopy unit with a resolution limit of 0.12 nm, coupled with the Energy Dispersive X-rays Spectroscopy (EDS), Chiyoda City, Japan). The optical reflectance of the samples was evaluated in the wavelength range of 0.25–2.50 μm by Cary series 5000 UV-Vis-NIR double beam spectrophotometer, while the reflectance in the thermal wavelength zone of 3.00–20.00 µm was characterized by Thermo-Nicolet 8700 Fourier transform infrared (FT-IR) spectroscopy.
Solar absorptance (α) values for the samples were calculated using [8],
α = 0.2 2.5 [ 1 R ( λ ) ] I s o l ( λ ) d λ 0.2 2.5 I s o l ( λ ) d λ
where R, λ, and I s o l denote reflectance, wavelength, and direct normal solar irradiance, respectively, as defined by ISO standard 9845-1 (1992), with an air mass (AM) of 1.5. For opaque materials, the absorptance (α) is expressed in terms of the total reflectance ( R λ ).
α = 1 R λ
The thermal emittance (ε) was obtained using [28],
ε = 3.0 20 [ 1 R ( λ , T ) ] B ( λ , T ) d λ 3.0 20 B ( λ , T ) d λ
where B (λ, T) denote radiance of a blackbody at temperature T.

3. Results and Discussion

3.1. X-ray Diffraction (XRD)

The X-ray diffraction profile of the as-obtained (Figure 1a) and annealed films (Figure 1b–f) have been indexed to the Fe2O3 phases (JCPDS card no. 00-039-1346) and (JCPDS card no. 00-033-0664). Figure 1 shows two different sets of peaks with different structures of the (a) as-obtained and (b–f) annealed film within the temperature range of 300–700 °C. The crystal structures of the (a) as-obtained and (b–f) film annealed at different temperatures were evaluated within the 2θ angular range of 15–90° by X-ray Diffraction. The XRD analysis for the as-obtained and annealed films were tabulated in Table A1, Table A2, Table A3, Table A4, Table A5 and Table A6, respectively (See Appendix A).
The results of the analysis, such as inter-planar distance (d), crystallites grain size (ϕ), full width at half maximum (FWHM), lattice constant (a) and other XRD values for the samples, were evaluated and are summarized in Table 1.
The inter-planer distances (d) were calculated for spectra using Bragg’s law [29],
d = n λ 2 s i n θ
where λ~1.541 Å is the wavelength of Cu-K radiation, n = 1 and θ is the Bragg angle (half of the measured diffraction angle). As shown in Table A1 (See Appendix A) the average ratio of Dd/dbulk (where Dd = dexp − dbulk) is constantly positive, ranging from 0.002 to 0.007 for all hkl reticular plans, except for the film annealed at 400 °C, which shows a negative value (−0.006). This indicated that the peaks of the film annealed at 400 °C are subjected to small compressive strain at the various crystallographic directions, whereas the peaks of the film prepared and annealed at 300, 500, 600 and 700 °C are under tensile strain conditions. The average grain size of the crystallite (Ø) was evaluated using Debye–Scherrer, expressed as [30],
Ø = 0.9   λ D θ 1 2 cos θ B
where λ, Dθ1/2 and θB are the X-ray wavelength (~1.541 Å), Full Width at Half Maximum (FWHM) in radian, and Bragg’s diffraction angle, respectively. The FWHM of the treated (as-obtained) film is 0.024 (rad), whereas the film annealed at different temperatures records FWHM in the range of 0.025–0.043 (rad). The average grain size of the crystallite (Ø) for the as-obtained film is 67 nm, whereas the annealed film at various temperatures records Ø in the range of 66–38 nm, as shown in Table 2. Similarly, it is observed (Table 2) that as the annealing temperature increases, the average grain sizes decreases, whereas the FWHM tends to increase. The increment in FWHM can be attributed to island coalescence [31], whereas the reduction in Ø can be attributed to reduction in surface roughness of the film [3]. Coalescence is a process whereby small crystallites combine to form larger crystalline particles. The process causes major grain growth, which influences porosity and reduction in surface roughness [32].
The dislocation density (δ) was obtained from (Ø) using [33,34,35,36].
δ = 1 ( Ø ) 2
where Ø is the average grain size of the crystallite. The δ was found to be 2.2 × 10⁻⁴ nm−2 for the as-treated film, while 2.3 × 10⁻⁴, 2.7 × 10⁻⁴, 3.9 × 10⁻⁴, 5.4 × 10⁻⁴, and 6.9 × 10⁻⁴ nm−2 were obtained for the films annealed at 300, 400, 500, and 700 °C, respectively. It is observed that the film annealed at 700 °C exhibited a smaller value of δ (6.9 × 10⁻⁴ nm−2), which implies that the film had fewer lattice defects and good crystalline qualities [37].
The lattice constants (a) were calculated using [3],
a = d hkl exp × h 2 + k 2 + l 2
where d hkl exp is the experimental inter-planar spacing obtained from Bragg’s law, and h, k, and l are the Miller indices denoting the plane. The bulk lattice constant (result obtained from database) of the as-obtained film is ~8.35 Å (Fe2O3, JCPDS card no. 00-039-1346), whereas the corresponding experimental average lattice constant for this film (annealed film) was estimated to be ~8.45 Å, which is a little bit higher than the bulk value. The obtained bulk lattice constant of the film annealed is ~5.04 Å (Fe2O3, JCPDS card no. 00-033-0664), whereas the corresponding experimental lattice constant of this film annealed at various temperatures (Appendix A Table A1) was estimated to be in the range of ~7.27 to 7.66 Å. The small differences between the experimental lattice constant ( a exp ) and the corresponding bulk lattice constant ( a bulk ) may be due to the effects of tensile strains between the substrate and film (Fe2O3).
The strains (ε) and stress (σ) are given as,
ε = a exp   a bulk a bulk
σ = 2.33 × 10 11 [ a exp a bulk a bulk ]
where a exp and a bulk are the calculated experimental and bulk lattice constant of the as-obtained and annealed films.
The strains (ε) and stress (σ) along the a-axis in the as-treated film were found to be 1.2 × 101 and −2.9 GPa, whereas the annealed film at 300, 400, 500, 600, 700 °C records the values of the strain (ε) and stress (σ) at 4.4 × 10⁻¹, 5.1 × 10⁻¹, 4.6 × 10⁻¹, 5.2 × 10⁻¹, 5.2 × 10⁻¹ and −103.2, −119.2, −107.8, −121.6, and −120.6 GPa, respectively, using Equations (8) and (9). The stress (σ) negative sign obtained for the films annealed shows that the film is in a state of compressive stress [29]. The presence of the compressive stress can be attributed to the lattice mismatch between the bulk materials (~5.04 Å) and films annealed (in the range of~7.27 to 7.66 Å). According to the reports, the lattice mismatch between the film and the substrate results in a variety of strains of varying degrees [38].
However, examining the ε and σ in the film provides significant information on the evolution of the defect, which is critical for better understanding and optimizing the electrical and optical properties of the film. It has been reported that the band structure of a material can change with the strain field, thereby changing its optical properties [39]. Therefore, the purpose of observing both ε and σ in this study is to determine the level of cracks and other defects in the film treated (as-obtained film) and annealed in the range of 300–700 °C. Fortunately, the obtained results of ε and σ in the films are not significant enough to affect the optical performance of the films (absorber surface).

3.2. Scanning Electron Microscopy (SEM) Analysis

Figure 2 reports the surface morphology images of the (a) as-obtained and (b–f) films annealed at 300, 400, 500, 600 and 700 °C, respectively. SEM images confirm the presence of micropores distributed across the surfaces of all films. It has been reported that micropores on the surface of a material minimize surface reflection, which in turn influences photoabsorption by trapping the incident light and subjecting it to multiple reflections [3].
After the digitization of various HR-SEM images, the diameter of the average size of the pores was found to be 0.47 ± 0.06 µm for the as-treated film, while 0.53 ± 0.07, 0.49 ± 0.11, 0.52 ± 0.10, 0.59 ± 0.11, and 0.69 ± 0.11 µm were obtained for the annealed films at 300, 400, 500, and 700 °C, respectively. Table 2 shows that as the annealing temperature increases, the size of the pores on the film increases. However, films annealed at 400 and 500 °C (sample c & d) are not in trend, and this could be the effect of different Teflon-line autoclaves used for film treatment via the hydrothermal technique.

3.3. Energy-Dispersive X-ray Spectroscopy (EDS) Analysis

The elemental composition of the (a) as-obtained and (b–f) films annealed at 300, 400, 500, 600, and 700 °C were determined using EDS. All samples contain similar elemental components (i.e., C, Cr, Fe, and O) but have varying atomic percentages. The variation in the atomic percentage (%) for each sample is summarized in Table 3, while Figure 3 illustrates the EDS analysis.
It is observed that both as-obtained and annealed films contain Carbon (C), Chromium (Cr), Iron (Fe) and Oxygen (O), but the atomic percentage (%) of these elements in the films varies. It can be observed from Table 4 that the as-obtained film (a) contains the highest atomic % of O (54.60%), whereas the film annealed at 700 °C (f) exhibits the lowest atomic % of O (48.67%). This confirms that as the annealing temperature increases, the atomic % of O decreases. Table 3 revealed that the film annealed at 600 °C (e) contains the highest atomic % of Fe (32.41%), whereas the film annealed at 300 °C (b) has the lowest atomic % of Fe (24.25%). It is also observed that the atomic % of Cr in the film decreases from 9.22 to 8.67% when the film is annealed from 200 to 300 °C and later increases to 9.53% at 400 °C.
However, among the elemental components of the films, Cr and Fe, which are transitional metals, play a vital role in minimizing the thermal radiation from the material. Indeed, the presence of transitional metal in a material helps to enhance its optical infrared reflectance property, which is required to achieve high selectivity for photo-thermal conversion applications. However, the element O also plays a significant role in the absorption property of a metal. Metal atoms are composed of a metallic ion’s d-shell, which is partially filled. When this metallic ion reacts with oxygen, the electrons become localized, forming metallic oxide, a new material with a high absorption capacity. Transition metals’ high infrared reflectance is due to the free electrons contained within their atoms, whereas their absorption is influenced by the bonded electrons. Thus, the oxidized surface of the metal exhibits a high absorption characteristic, whereas the transitional base metal exhibits a high infrared property, which aids in minimizing thermal emission loss from the absorber surface; thus, the combination of the two phases results in a good selective absorber with the required optical properties for photo-thermal conversion applications [3].

3.4. UV-Vis-NIR Diffuse Reflectance Analysis

The optical reflectance of the (a) as-obtained and (b–f) films annealed for 2 h in air at different temperatures was investigated by analyzing UV-Vis-NIR diffuse reflectance data in the wavelength region of 0.25–2.50 µm, as illustrated in Figure 4. It is observed that the film annealed at 300 °C (Figure 4b) exhibits the lowest reflectance of ~7%, whereas the film annealed at 700 °C exhibits the highest reflectance of about 20%. Figure 4 further shows that as the annealing temperature increases, the reflectance of the films also increases, which confirms the negative effect of the high annealing temperature on the reflectivity behavior of the film. It has been reported that the lower a surface’s reflectivity is in the short wavelengths of the solar spectrum, the greater its absorptance value, whereas the opposite is true in the longer wavelengths of the thermal spectrum; i.e., the higher the reflectivity of a surface in the mid/long IR wavelength region, the lower the emissivity of a material. Indeed, the two major requirements for achieving high selectivity of a material for photo-thermal conversion application are the low reflectivity of the incident solar radiation and the high reflectivity of the thermal radiation [3].
The decrease in the reflectance spectra (%R) of the films in the UV-Vis-NIR wavelength zone can be attributed to surface oxidation induced by the NaOH used in the hydrothermal treatment, as confirmed by EDS analysis. Another possible explanation for the decrease in reflectance in this wavelength zone is the presence of micropores on the surface of the films, as revealed by SEM analysis [3].

3.5. FT-IR Diffuse Reflectance Analysis

The optical reflectance of the (a) as-obtained and (b–f) films annealed for 2 h in air at different temperatures was studied by analyzing the FT-IR diffuse reflectance data in the wavelength zone of 3.0–20.0 µm, as shown in Figure 5. It is observed that the film annealed at 700 °C (Figure 5f) exhibits the highest reflectance of ~90%, whereas the as-obtained film exhibits the lowest reflectance of about 60%. Figure 5 further shows that as the annealing temperature increases, the reflectance of the film also increases. The reflectivity reduction at IR wavelength zone causes high emissivity to the absorber material, which in turn reduces its selectivity. Hence, decrement in reflectivity in the IR region does not favor solar selective absorber material for photo-thermal conversion application.
The decrease in reflectance spectra (%R) at the IR wavelength zone of the film can be attributed to the increment in atomic % of oxygen (O), as revealed by EDS results. The atomic % of the oxygen of the film annealed at 700 °C is 48.67%, and the value keeps increasing up to 54.60% (film annealed at 0 °C) as the annealing temperatures decrease, as revealed in Table 3. Indeed, increased oxidation has been shown to result in a decrease in reflectivity in the mid/far-infrared wavelength region, causing high emissivity on a material [3].

3.6. Absorptance (α) and Emittance (ε) Evaluation

Solar absorptance (α) was calculated for the films using Equation (1) and weighted by solar irradiance based on the standard air mass 1.5 solar spectrum in the wavelength range 0.25–2.50 μm, while thermal emittance (ε) was calculated using Equation (3) and measured Blackbody reflectance data [3]. The “α” and “ε” results of the films are shown in Table 4, which reveals that as the annealing temperature increases, the absorptance increases first from 0.938 (as-obtained SS) to 0.941 (annealed) at 300 °C and then continuously decreases as the temperature proceeds to 700 °C, where the film exhibits the lowest absorptance of 0.884. It is similarly observed that as the annealing temperature increases, the film emittance decreases in the range from 0.431 to 0.179, as shown in Table 4. The decrease in film absorptance is attributed to its low surface reflectivity in the UV-Vis-NIR spectrum, whereas the decrease in emittance is attributed to high surface reflectivity in the mid/far-IR wavelength zone, as illustrated in Figure 4 and Figure 5. The error/standard deviation on these data is ±0.11.
The increase in “α” is beneficial to the solar absorber’s properties, whereas the increase in “ε” is detrimental to the solar absorber’s surface. This is because a high emittance value results in a greater loss of energy absorbed by the surface [3].
However, Figure 6 has been plotted to show the variation of α, ε, and η of the films with an increment in annealing temperatures. Figure 6 reveals that both the absorptance (α) and emittance (ε) of the films tend to decrease as the annealing temperature increases, whereas the selectivity factor (η) enclosed in Figure 6 tends to increase. The selectivity factors (η) of the films were evaluated and found to vary from 2.176 to 4.983 ± 1.26, as illustrated in Figure 6. This increment in η implies an improvement in the selectivity of the film annealed at 700 °C.

4. Conclusions

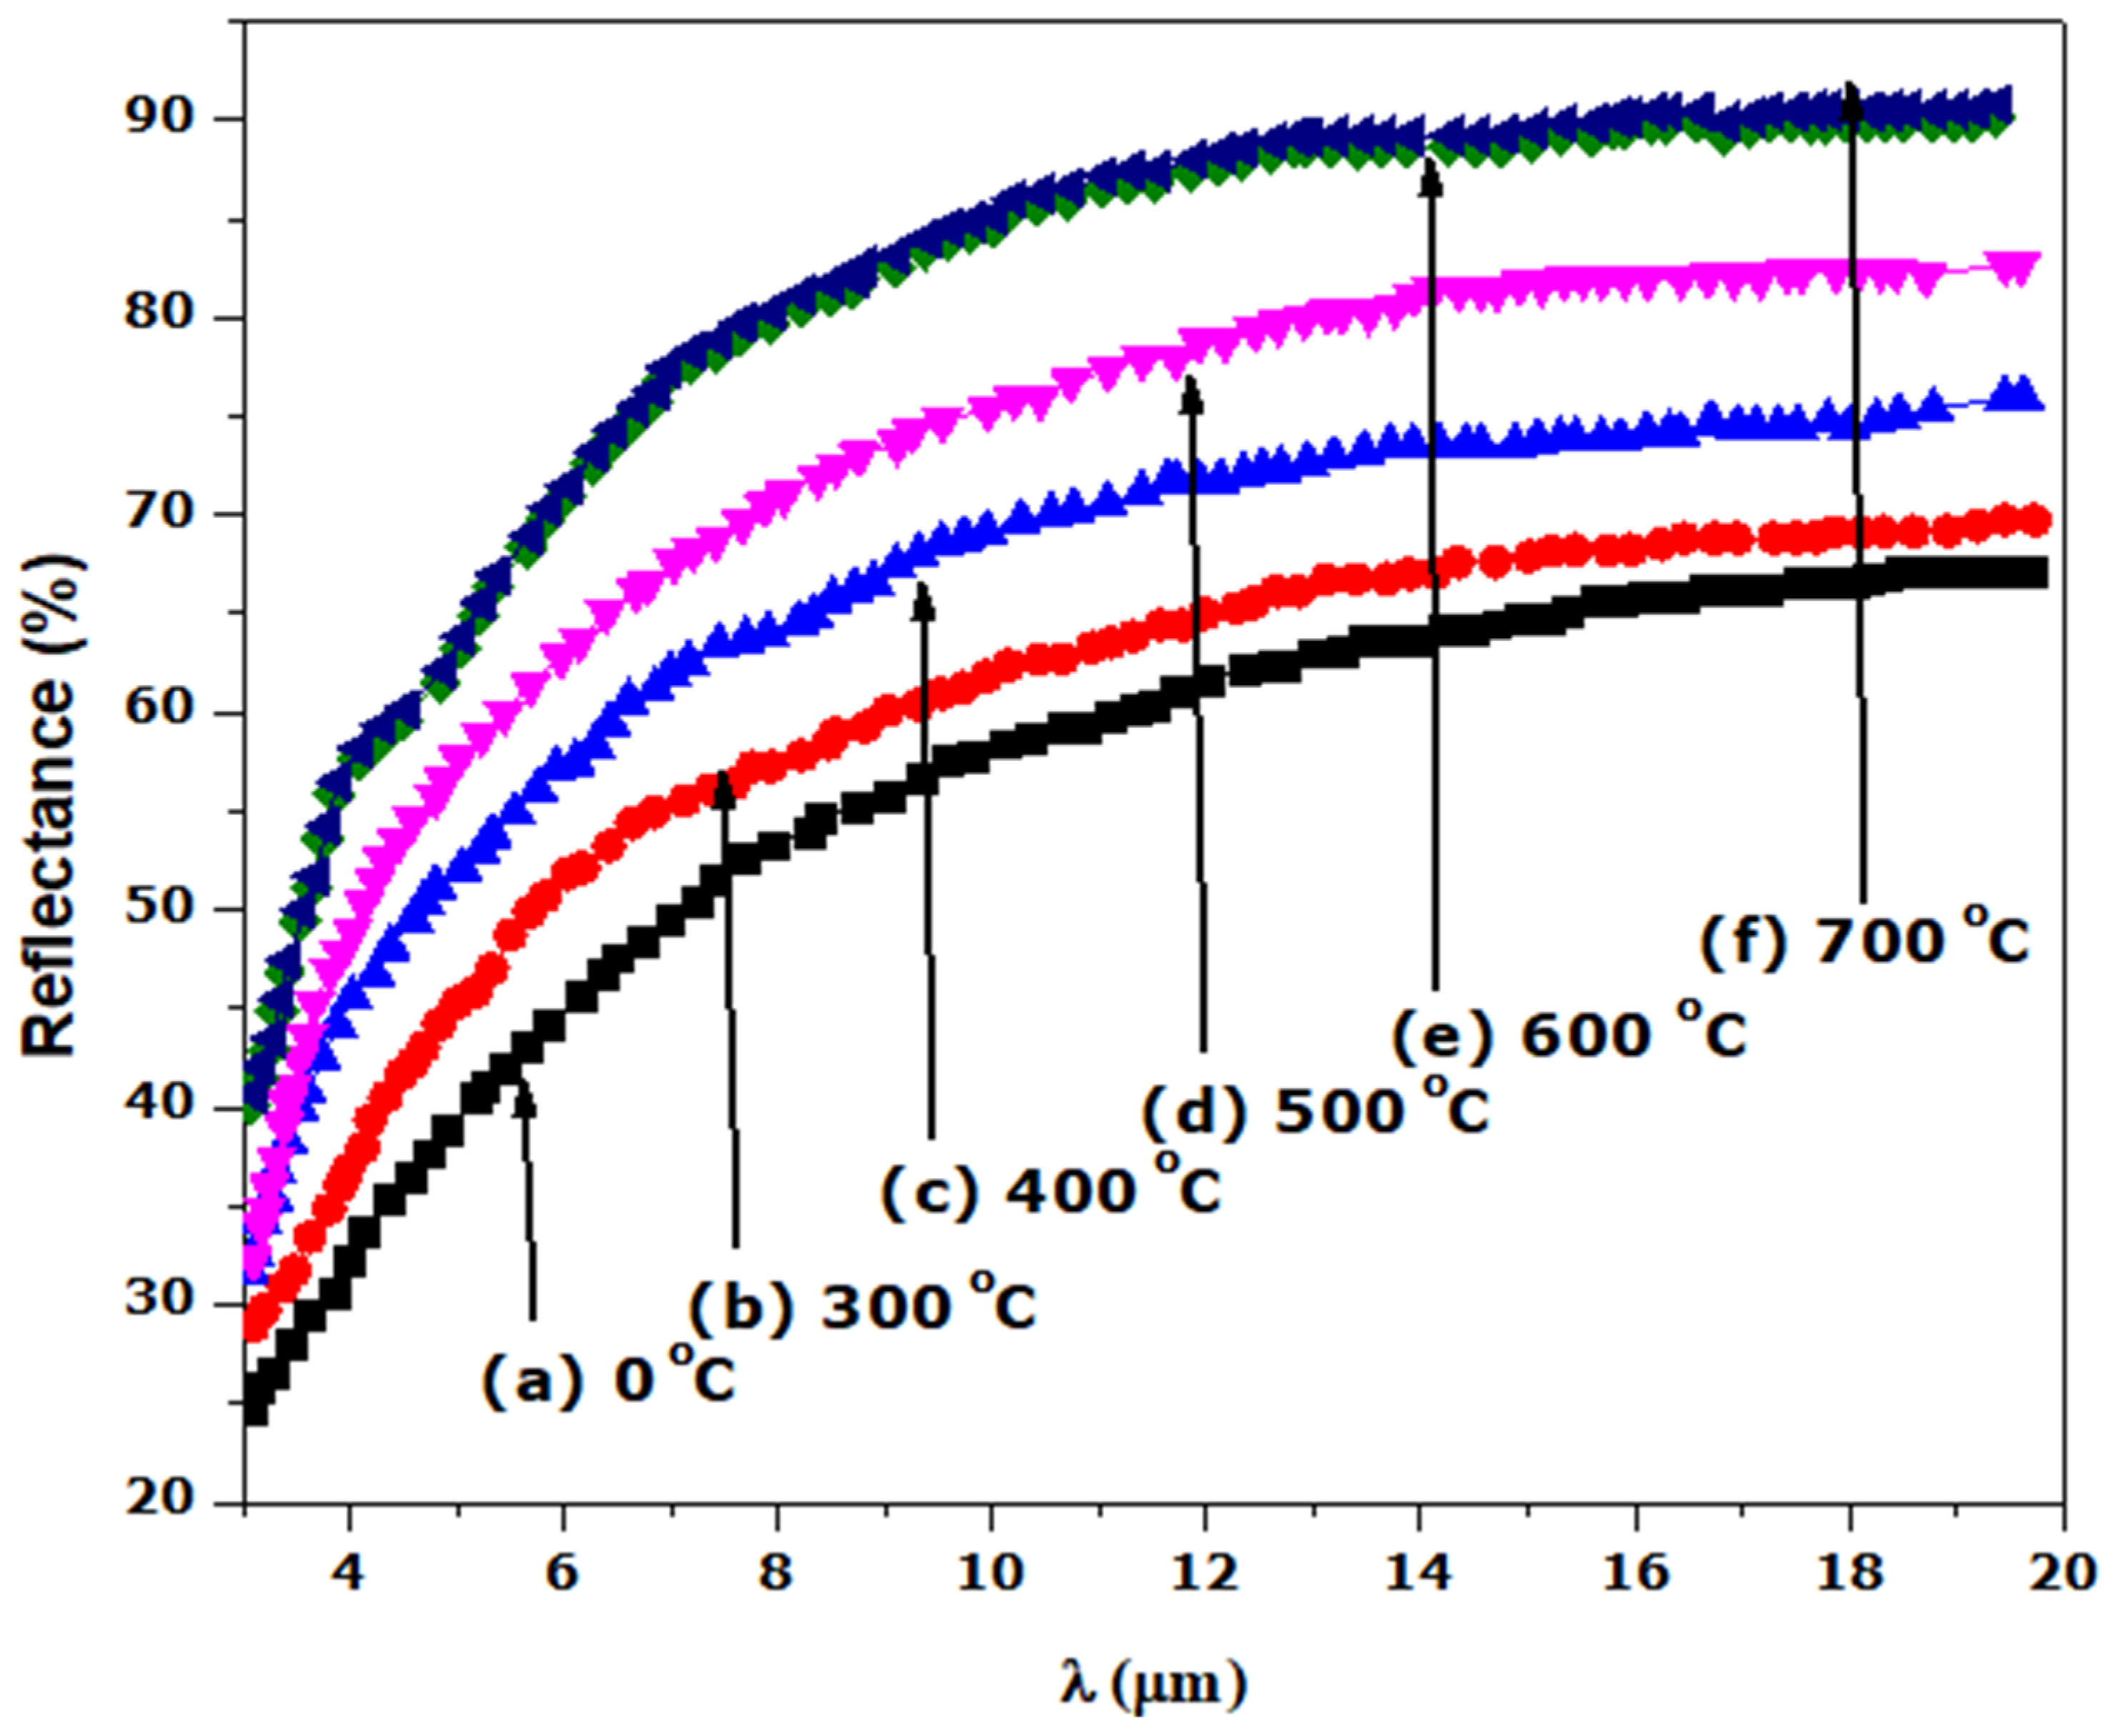
We have treated the surface of stainless steel to enhance its solar absorption property using a hydrothermal technique. Following the thermal treatment at different annealing temperatures, the SS absorber was characterized. The SEM images reveal micropores with decreasing grain sizes and increasing full width at half maximum (FWHM) when annealing temperature is increased, as confirmed by XRD analysis. The EDS spectrum indicates the presence of the transitional elements Cr and Fe, which were evident in the optical response. The SS absorber exhibited a lower reflectance at the UV-VIS-NIR wavelength zone, and this can be attributed to the presence of micropores, which were evident in the SEM images. The optical reflectance of the annealed films at the far-IR wavelength zone were high (60 to 90%), resulting in the obtained minimum thermal emission of the annealed SS absorbers. The major components of the as-treated and annealed film that play a significant role in enhancing the selectivity of the SS absorber are Cr, Fe, and O, as evidenced by the EDS result. Cr and Fe are transitional metals that help to enhance the optical infrared reflectance property of a metal/film, whereas element O (deposited on SS absorber through NaOH used during the hydrothermal treatment) enhances the absorption property of the SS absorber. Thus, the oxidized surface (Fe2O3) of the SS exhibits a high absorption characteristic, whereas Fe and Cr exhibit a high infrared reflectance property, which aids in minimizing thermal emission loss from the absorber surface; thus, the existence of these elements (Fe and Cr) in film results in a good selective absorber with the required optical properties for photo-thermal conversion applications.
The as-obtained SS absorbers exhibit spectra selectivity of 2.176 (0.938/0.431), whereas SS annealed at 700 °C exhibits 4.939 (0.884/0.179). These results indicate a significant improvement in the selectivity (absorptivity/emissivity) of the SS annealed at 700 °C. Hence, the annealed SS absorber could be a promising candidate for a photo-thermal conversion application.

Author Contributions

S.A.A.: Investigation, Data curation, Formal analysis, Writing—original draft, Writing—review & editing. R.A.: Data curation, Writing—review & editing. J.S.: Writing—review & editing. S.K.: Writing—review & editing. S.H.: Writing—review & editing. Z.Y.N.: Writing—review & editing. M.M.: Resources, Supervision, Project administration, Funding acquisition. All authors have read and agreed to the published version of the manuscript.

Funding

This research received no external funding.

Institutional Review Board Statement

Not applicable.

Informed Consent Statement

Not applicable.

Data Availability Statement

Not applicable.

Acknowledgments

This work was supported by the UNESCO-UNISA Africa Chair in Nanosciences & Nanotechnology, and the National Research Foundation (NRF) of South Africa. We gratefully acknowledge the help provided by the Department of Materials Division (MRD), iThemba-LABS, South Africa, for the provision of the research lab and equipment. This research did not receive any specific grant from funding agencies in the public, commercial, or not-for-profit sectors.

Conflicts of Interest

The authors declare that they have no known competing financial interests or personal relationships that could have appeared to influence the work reported in this paper.

Appendix A

Table A1. XRD values and crystallites size of the as-obtained film (Figure 1a).
Hklθ bulk (°)θ exp (°)dbulk (Å)dexp (Å)Dd/dbulkFWHM (rad)Ø (nm)a (Å)
1119.1929.0454.8224.9060.0180.02264.0778.498
22015.12115.0622.5932.9740.1470.02363.9258.411
31117.81617.7242.5182.5340.0060.02363.5958.405
22218.62517.7452.4122.5260.0470.02363.4378.749
40021.64321.5552.0892.0990.0050.02365.0838.396
41022.35322.3152.0262.0320.0030.02462.8748.379
43027.46326.7331.6701.7160.0270.02463.9288.578
51128.63728.5041.6071.6150.0050.02661.4198.391
44131.99831.3011.4541.4840.0210.02565.0698.527
53032.53732.4841.4321.4340.0020.02370.2868.364
54036.20235.4921.3041.3260.0170.02470.7178.489
53337.23737.0361.2731.2790.0050.02666.6568.583
71040.71141.1241.1811.171−0.0090.02866.2068.278
64243.65443.3951.1161.1210.0050.02770.0528.390
73145.11545.0131.0871.0890.0020.02383.7968.369
Table A2. XRD values and crystallites size of the annealed film at 300 °C (Figure 1b).
Hklθ bulk (°)θ exp (°)dbulk (Å)dexp (Å)Dd/dbulkFWHM (rad)Ø (nm)a (Å)
10416.57916.6312.7002.692−0.0030.02461.64811.097
11017.80617.7592.5192.5260.0030.02460.6043.572
20221.75921.6442.0782.1050.0130.02560.9345.954
11627.04626.9411.6941.7000.0040.02563.40410.479
12228.71528.6511.6031.6070.0020.02564.5434.819
30031.99631.3951.4541.4790.0170.02563.9214.436
12533.01432.4291.4141.4360.0160.02663.5227.867
101035.96935.7431.3121.3190.0060.02762.67713.253
22037.71537.1671.2591.2750.0130.02765.6733.607
12840.35640.9451.1891.176−0.0120.02573.5949.764
22644.27143.1291.1041.1270.0210.02674.0467.473
04245.67345.1141.0771.0870.0090.02871.0894.862
Table A3. XRD values and crystallites size of the annealed film at 400 °C (Figure 1c).
Hklθ bulk (°)θ exp (°)dbulk (Å)dexp (Å)Dd/dbulkFWHM (rad)Ø (nm)a (Å)
01212.06812.0793.6843.680−0.0010.02556.2258.229
10416.57916.5912.7702.698−0.0260.02656.13911.124
11017.80617.8292.5192.516−0.0010.02655.6073.558
11320.42820.4422.2072.206−0.0010.02656.3177.316
20221.75921.8552.0782.069−0.0040.02656.9695.852
02424.74024.7601.8411.839−0.0010.02756.2238.226
11627.04127.0371.6941.6950.00020.02856.39210.445
12228.71528.7091.6031.6039.6 × 1050.02954.5134.810
21431.99631.5181.4861.473−0.0080.02857.5956.752
30033.01432.4781.4541.435−0.0130.02761.5814.304
101035.96936.0591.3121.309−0.0020.02762.58913.152
12840.35641.1181.1891.171−0.0150.02962.6419.730
13442.45842.6241.1411.138−0.0030.02965.4385.799
22644.27144.6631.1041.096−0.0070.02578.0517.269
Table A4. XRD values and crystallites size of the annealed film at 500 °C (Figure 1d).
Hklθ bulk (°)θ exp (°)dbulk (Å)dexp (Å)Dd/dbulkFWHM (rad)Ø (nm)a (Å)
01212.06812.0803.6843.680−0.0010.03146.5578.229
10416.57916.5782.7002.699−1.4 × 1050.03146.65811.132
11017.80617.6792.5192.5360.0070.03146.2993.587
11320.42820.3622.2072.2140.0030.03247.0547.343
20221.75921.7332.0782.0800.0010.03247.4455.884
02424.69024.7581.8411.839−0.0010.03247.1348.228
11627.04627.0571.6941.693−0.0010.03347.40610.438
12228.66528.7341.6031.603−0.0010.03446.1854.807
30031.99631.3721.4541.4790.0180.03448.5114.439
12533.01432.3961.4141.4380.0170.03251.4327.874
20834.80134.8451.3491.349−0.0010.03351.75911.121
101035.96936.0851.3121.308−0.0030.03549.56113.143
22037.71537.8751.2591.255−0.0040.03451.6163.549
22339.38040.2581.2141.192−0.0180.03060.1424.914
21041.46941.1771.1631.1690.0060.03158.65511.931
13442.45842.4791.1411.141−0.00040.03554.4945.816
22644.27143.7951.1041.1130.0090.03358.2297.384
Table A5. XRD values and crystallites size of the annealed film at 600 °C (Figure 1e).
Hklθ bulk (°)θ exp (°)dbulk (Å)dexp (Å)Dd/dbulkFWHM (rad)Ø (nm)a (Å)
1212.06812.0773.6843.682−0.0010.03639.7348.234
10416.57916.5932.7002.697−0.0010.03639.91711.121
11017.80617.8182.5192.518−0.00030.03739.7203.561
11320.42820.4442.2072.205−0.0010.03740.2677.314
20221.75920.4442.0782.2050.0610.03740.3236.237
02424.69024.7521.8411.839−0.0010.03840.5758.228
11627.04627.0641.6941.693−0.0010.03840.89010.438
12228.66528.7931.6031.599−0.0030.03940.0814.797
30031.99631.2651.4541.4850.0210.03941.9004.454
12533.01432.4741.4141.4350.0150.03744.2267.858
20834.80134.5981.3491.3570.0050.03844.46811.187
101035.96936.0521.3121.309−0.0020.03943.02813.155
22037.71537.7581.2591.258−0.0010.03944.6593.558
22339.38038.9091.2141.2260.0100.03650.2695.057
21041.46941.0891.1631.1720.0080.03750.20611.953
13442.45842.4961.1411.140−0.0010.03947.3255.815
22644.27144.3451.1041.102−0.0010.03850.7237.311
Table A6. XRD values and crystallites size of the annealed film at 700 °C (Figure 1f).
Hklθ bulk (°)θ exp (°)dbulk (Å)dexp (Å)Dd/dbulkFWHM (rad)Ø (nm)a (Å)
01212.06812.0833.6843.680−0.0010.04134.6478.229
10416.57916.5792.7002.699−1.4 × 1050.04234.87711.132
11017.80617.9392.5192.501−0.0070.04234.7783.537
11320.42820.4662.2072.203−0.0020.04235.2487.308
20221.75922.1122.0782.047−0.0150.04235.6885.788
02424.69024.7661.8411.839−0.0010.04335.6228.223
11627.04627.0881.6941.691−0.0020.04335.95510.427
12228.66528.8261.6031.598−0.0040.04535.3984.792
30031.99631.3231.4541.4820.0190.04436.9294.445
12533.01432.2221.4141.4450.0220.04238.6597.913
20834.80134.5441.3491.3590.0070.04339.04311.203
101035.96935.7991.3121.3170.0040.04537.90913.236
22037.71537.6711.2591.2610.0010.04539.3603.565
22339.38039.6111.2141.208−0.0050.04144.2374.981
21041.46941.1161.1631.1710.0070.04243.94511.946
13442.45842.0421.1411.1500.0080.04541.5115.865
22644.27144.3721.1041.102−0.0020.04444.6297.307

List of Abbreviations, Symbols and Constants

SSStainless steel
ηSelectivity
FTIRFourier Transform Infrared
UV-vis-NIR Ultraviolet-Visible-Near infrared
T Absolute temperature
aLattice Constance
λWavelength
(α)Absorptance
(ε)Emittance
a e x p Experiment results
a b u l k Results from database
d inter-planar distances
DdChange in inter-planar distance
( R λ )Total reflectance
AFM Atomic Force Microscopy
EDS Energy Dispersive Spectroscopy
XRD X-ray Diffraction
SEMScanning Electron Microscopy

References

  1. Simo, A.; Mwakikunga, B.; Sone, B.; Julies, B.; Madjoe, R.; Maaza, M. VO2 nanostructures based chemiresistors for low power energy consumption hydrogen sensing. Int. J. Hydrogen Energy 2014, 39, 8147–8157. [Google Scholar] [CrossRef]
  2. Sani, E.; Mercatelli, L.; Sans, J.-L.; Silvestroni, L.; Sciti, D. Porous and dense hafnium and zirconium ultra-high temperature ceramics for solar receivers. Opt. Mater. 2013, 36, 163–168. [Google Scholar] [CrossRef]
  3. Abdullahi, S.A.; Akoba, R.; Khamlich, S.; Halindintwali, S.; Nuru, Z.; Maaza, M. Hydrothermal surface treatment of 434-L stainless-steel for spectra solar absorber application. Infrared Phys. Technol. 2021, 117, 103848. [Google Scholar] [CrossRef]
  4. Qiu, X.L.; Gao, X.H.; He, C.Y.; Liu, G. Enhanced Thermal Stability of the TiB2–ZrB2 Composite Ceramic Based High Temperature Spectrally Selective Absorber Coatings: Optical Properties, Failure Analysis and Chromaticity Investigation. Opt. Mater. 2020, 100, 109666. [Google Scholar] [CrossRef]
  5. Pang, X.; Zhou, F.; Li, B.; Jiang, J.; Zhou, J. Optical Thermostability and Weatherability of TiN/TiC-Ni/Mo Cermet-Based Spectral Selective Absorbing Coating by Laser Cladding. Opt. Mater. 2021, 117, 111195. [Google Scholar] [CrossRef]
  6. Zhang, X.; Wang, X.; Zhang, X.; Li, Y.; Cheng, X. Effect of Multilayered CoO-CoAl2O4 Films on Improving Solar Absorptance of Co-WC Solar Selective Absorbing Coatings. Vacuum 2018, 155, 185–192. [Google Scholar] [CrossRef]
  7. Gao, X.-H.; Wang, C.-B.; Guo, Z.-M.; Geng, Q.-F.; Theiss, W.; Liu, G. Structure, optical properties and thermal stability of Al2O3-WC nanocomposite ceramic spectrally selective solar absorbers. Opt. Mater. 2016, 58, 219–225. [Google Scholar] [CrossRef]
  8. Liu, H.D.; Fu, T.R.; Duan, M.H.; Wan, Q.; Luo, C.; Chen, Y.M.; Fu, D.J.; Ren, F.; Li, Q.Y.; Cheng, X.D.; et al. Structure and thermal stability of spectrally selective absorber based on AlCrON coating for solar-thermal conversion applications. Sol. Energy Mater. Sol. Cells 2016, 157, 108–116. [Google Scholar] [CrossRef]
  9. Yang, Z.; Tan, S.; Yang, J.; Li, Y.; Yang, X.; Deng, J. Study on the solar selectivity and air thermal stability of cobalt–nickel–iron oxide coating fabricated by spraying method. Opt. Mater. 2021, 111, 110573. [Google Scholar] [CrossRef]
  10. Kaluža, L.; Šurca-Vuk, A.; Orel, B.; Dražič, G.; Pelicon, P. Structural and IR Spectroscopic Analysis of Sol-Gel Processed CuFeMnO4 Spinel and CuFeMnO4/Silica Films for Solar Absorbers. J. Sol-Gel Sci. Technol. 2001, 20, 61–83. [Google Scholar] [CrossRef]
  11. Orel, Z.C. Characterisation of high-temperature-resistant spectrally selective paints for solar absorbers. Sol. Energy Mater. Sol. Cells 1999, 57, 291–301. [Google Scholar] [CrossRef]
  12. Ning, Y.; Wang, J.; Sun, C.; Hao, Z.; Xiong, B.; Wang, L.; Han, Y.; Li, H.; Luo, Y. NiCrAlO/Al2O3 solar selective coating prepared by direct current magnetron sputtering and water boiling. Sol. Energy Mater. Sol. Cells 2021, 219, 110807. [Google Scholar] [CrossRef]
  13. Pelenovich, V.; Liu, H.; Zeng, X.; Liu, Y.; Liu, K.; Yang, B. Graded solar selective absorbers deposited by non-equilibrium RF magnetron sputtering. Sol. Energy Mater. Sol. Cells 2021, 230, 111188. [Google Scholar] [CrossRef]
  14. Wu, Y.; Hu, E.-T.; Cai, Q.-Y.; Wang, J.; Wang, Z.-Y.; Tu, H.-T.; Yu, K.-H.; Chen, L.-Y.; Wei, W. Enhanced thermal stability of the metal/dielectric multilayer solar selective absorber by an atomic-layer-deposited Al2O3 barrier layer. Appl. Surf. Sci. 2021, 541, 148678. [Google Scholar] [CrossRef]
  15. Adiba; Pandey, V.; Munjal, S.; Ahmad, T. Structural and optical properties of sol gel synthesized NiO nanoparticles. AIP Conf. Proc. 2020, 2270, 110011. [Google Scholar] [CrossRef]
  16. Liao, Q.; Zhang, P.; Yao, H.; Cheng, H.; Li, C.; Qu, L. Reduced Graphene Oxide–Based Spectrally Selective Absorber with an Extremely Low Thermal Emittance and High Solar Absorptance. Adv. Sci. 2020, 7, 1903125. [Google Scholar] [CrossRef]
  17. Taha, F.; El Mahallawy, N.; Shoeib, M.A. A study of sol gel process parameters on CoCuMnOx selective coating characteristics. Mater. Res. Express 2020, 7, 026410. [Google Scholar] [CrossRef]
  18. Testafamichael, T. Characterization of Selective Solar Absorbers. Ph.D. Thesis, Uppsala University, Uppsala, Sweden, 2000. [Google Scholar]
  19. Zheng, L.; Zhou, F.; Zhou, Z.; Song, X.; Dong, G.; Wang, M.; Diao, X. Angular Solar Absorptance and Thermal Stability of Mo-SiO2 Double Cermet Solar Selective Absorber Coating. Sol. Energy 2015, 115, 341–346. [Google Scholar] [CrossRef]
  20. Yang, Y. The Study of Nanostructured Solar Selective Coatings. Ph.D. Thesis, University of York, Heslington, UK, 2012. [Google Scholar]
  21. Lampert, C.M. Coatings for Enhanced Photothermal Energy Collection. Sol. Energy Mater. 1979, 2, 1–17. [Google Scholar] [CrossRef]
  22. Alyousif, O.M. On the influence of thermo-mechanical process history on stress corrosion cracking of solution annealed type 304 stainless steel. Nucl. Mater. Energy 2021, 29, 101074. [Google Scholar] [CrossRef]
  23. Nuru, Z.Y.; Perez, D.; Kaviyarasu, K.; Vantomme, A.; Maaza, M. Annealing effect on the optical properties and interdiffusion of MgO/Zr/MgO multilayered selective solar absorber coatings. Sol. Energy 2015, 120, 123–130. [Google Scholar] [CrossRef]
  24. Zhao, S.S.; Gao, X.H.; Qiu, X.L.; Yu, D.M.; Tian, G.K. A Novel TiC-TiN Based Spectrally Selective Absorbing Coating: Structure, Optical Properties and Thermal Stability. Infrared Phys. Technol. 2020, 110, 103471. [Google Scholar] [CrossRef]
  25. Trefon-Radziejewska, D.; Juszczyk, J.; Krzywiecki, M.; Hamaoui, G.; Horny, N.; Antoniow, J.-S.; Chirtoc, M. Thermal characterization of morphologically diverse copper phthalocyanine thin layers by scanning thermal microscopy. Ultramicroscopy 2022, 233, 113435. [Google Scholar] [CrossRef] [PubMed]
  26. Kennedy, C.E. Review of Mid- to High-Temperature Solar Selective Absorber Materials; National Renewable Energy Lab.: Golden, CO, USA, 2002. [CrossRef]
  27. Maniv, S.; Zangvil, A. Controlled texture of reactively rf-sputtered ZnO thin films. J. Appl. Phys. 1978, 49, 2787–2792. [Google Scholar] [CrossRef]
  28. Akoba, R.; Abdullahi, S.A.; Sackey, J.; Nkosi, M.; Mothudi, B.M.; Nuru, Z.Y.; Maaza, M. Ultrasound-assisted wet chemical synthesis of texturized Mo/MoO3 spectrally selective solar absorber coatings. Thin Solid Films 2021, 735, 138892. [Google Scholar] [CrossRef]
  29. Tüzemen, E.; Kavak, H.; Esen, R. Influence of oxygen pressure of ZnO/glass substrate produced by pulsed filtered cathodic vacuum arc deposition. Phys. B Condens. Matter 2007, 390, 366–372. [Google Scholar] [CrossRef]
  30. Kaźmierczak-Bałata, A.; Bodzenta, J.; Guziewicz, M. Microscopic investigations of morphology and thermal properties of ZnO thin films grown by atomic layer deposition method. Ultramicroscopy 2020, 210, 112923. [Google Scholar] [CrossRef]
  31. Kareem, M.M.; Khodair, Z.T.; Mohammed, F.Y. Effect of Annealing Temperature on Structural, Morphological and Optical Properties of Zno Nanorod Thin Films Prepared by Hydrothermal Method. J. Ovonic Res. 2020, 16, 53–61. [Google Scholar]
  32. Fang, Z.B.; Yan, Z.J.; Tan, Y.S.; Liu, X.Q.; Wang, Y. Influence of post-annealing treatment on the structure properties of ZnO films. Appl. Surf. Sci. 2005, 241, 303–308. [Google Scholar] [CrossRef]
  33. Sackey, J.; Bashir, A.K.H.; Ameh, A.E.; Nkosi, M.; Kaonga, C.; Maaza, M. Date pits extracts assisted synthesis of magnesium oxides nanoparticles and its application towards the photocatalytic degradation of methylene blue. J. King Saud Univ. Sci. 2020, 32, 2767–2776. [Google Scholar] [CrossRef]
  34. Dongol, M.; El-Denglawey, A.; El Sadek, M.S.A.; Yahia, I.S. Thermal annealing effect on the structural and the optical properties of Nano CdTe films. Optik 2015, 126, 1352–1357. [Google Scholar] [CrossRef]
  35. Dongol, M.; El-Denglawey, A.; Elhady, A.; Abuelwafa, A. Structural properties of nano 5, 10, 15, 20-Tetraphenyl-21H,23H-porphine nickel (II) thin films. Curr. Appl. Phys. 2012, 12, 1334–1339. [Google Scholar] [CrossRef]
  36. Dolzhenko, A.; Tikhonova, M.; Kaibyshev, R.; Belyakov, A. Microstructures and Mechanical Properties of Steels and Alloys Subjected to Large-Strain Cold-to-Warm Deformation. Metals 2022, 12, 454. [Google Scholar] [CrossRef]
  37. Muchuweni, E.; Sathiaraj, T.; Nyakotyo, H. Synthesis and characterization of zinc oxide thin films for optoelectronic applications. Heliyon 2017, 3, e00285. [Google Scholar] [CrossRef]
  38. Ghosh, R.; Basak, D.; Fujihara, S. Effect of substrate-induced strain on the structural, electrical, and optical properties of polycrystalline ZnO thin films. J. Appl. Phys. 2004, 96, 2689–2692. [Google Scholar] [CrossRef]
  39. He, H.P.; Zhuge, F.; Ye, Z.Z.; Zhu, L.P.; Wang, F.Z.; Zhao, B.H.; Huang, J.Y. Strain and its effect on optical properties of Al-N codoped ZnO films. J. Appl. Phys. 2006, 99, 023503. [Google Scholar] [CrossRef]
Figure 1. XRD patterns of the (a) as-obtained (0 °C) and films annealed for 2 h in air at: (b) 300 °C, (c) 400 °C, (d) 500 °C, (e) 600 °C and (f) 700 °C. The figure revealed the formation of the new peaks and changes (width and height of the peaks) that occurred on them as the annealing temperature increases.
Solar 02 00025 g001
Figure 2. HR-SEM images of the (a) as-obtained (0 °C) and films annealed for 2 h in air at: (b) 300 °C, (c) 400 °C, (d) 500 °C, (e) 600 °C and (f) 700 °C. The insert figures revealed the size of the pores on the film surfaces.
Solar 02 00025 g002aSolar 02 00025 g002b
Figure 3. EDS patterns of the (a) as-obtained (0 °C) and films annealed for 2 h in air at: (b) 300 °C, (c) 400 °C, (d) 500 °C, (e) 600 °C and (f) 700 °C. The figure depicts the variation in elemental composition of the films as the annealing temperature varied.
Solar 02 00025 g003
Figure 4. UV-vis-NIR reflectance spectra of the (a) as-obtained (0 °C) and annealed films for 2 h in air at: (b) 300 °C, (c) 400 °C, (d) 500 °C, (e) 600 °C, and (f) 700 °C. The variation of reflectance with annealing temperature at UV-Vis region depicted in the figure implies an improvement in absorptance as the temperature increases.
Solar 02 00025 g004
Figure 5. FT-IR reflectance spectra of the (a) as-obtained (0 °C) and annealed films for 2 h in air at: (b) 300 °C, (c) 400 °C, (d) 500 °C, (e) 600 °C, and (f) 700 °C. The variation of reflectance with annealing temperature at IR region is revealed in this figure.
Solar 02 00025 g005
Figure 6. Variation of absorptance (α), emittance (ε) and selectivity factor (ƞ) of the (a) as-obtained (0 °C) and annealed films at: (b) 300 °C, (c) 400 °C, (d) 500 °C, (e) 600 °C, and (f) 700 °C. The insert figure depicts the improvement in the selectivity (α/ε) of the annealed films.
Solar 02 00025 g006
Table 1. XRD results summarized for the (a) as-obtained (0 °C) and films annealed for 2 h in air at: (b) 300 °C, (c) 400 °C, (d) 500 °C, (e) 600 °C and (f) 700 °C.
Samplet (°)Dd/dbulkFW (Rad)ϕ (nm)ε (10−1)σ (GPa)δ (nm−2)a (Å)
a00.0200.024671.2−2.92.2 × 10−48.45
b3000.0070.025664.4−103.22.3 × 10−47.27
c400−0.0060.027605.1−119.22.8 × 10−47.61
d5000.0020.032514.6−107.83.9 × 10−47.64
e6000.0020.038435.2−121.65.3 × 10−47.66
f7000.0020.043385.2−120.66.9 × 10−47.64
Table 2. Variation of the film pore’s diameter with increment in annealing temperature.
SampleAnnealed Temp (°C)Pore Diameter (μm)
a00.47 ± 0.06
b3000.53 ± 0.07
c4000.49 ± 0.11
d5000.52 ± 0.10
e6000.59 ± 0.11
f7000.69 ± 0.11
Table 3. EDS elemental analysis of the (a) as-obtained (0 °C) and films annealed for 2 h in air at: (b) 300 °C, (c) 400 °C, (d) 500 °C, (e) 600 °C and (f) 700 °C.
ElementsAtomic Percentage (%)
abcdef
C10.2413.739.5710.0010.2019.71
Cr9.228.679.536.544.875.40
Fe25.9424.2527.4831.4132.8726.22
O54.6053.3553.4252.0552.0548.67
Total100100100100100100
Table 4. Absorptance (α) and emittance (ε) of the (a) as-obtained and (b–f) film annealed for 2 h in air at different temperature.
SampleT (°C)αεα/ε (η)
a00.9380.4312.176
b3000.9410.4032.335
c4000.9220.3332.769
d5000.9170.2743.347
e6000.8920.1794.983
f7000.8840.1794.939
Publisher’s Note: MDPI stays neutral with regard to jurisdictional claims in published maps and institutional affiliations.

