Article

Measuring Concentrated Solar Radiation Flux in a Linear Fresnel-Type Solar Collector

by
Jesús Fernández-Reche
1,*,
Loreto Valenzuela
1,* and
Diego Pulido-Iparraguirre
2
1
CIEMAT—Plataforma Solar de Almería, Crta. Senes, km.4.5, Tabernas, E04200 Almería, Spain
2
Centro de Desarrollo Energético Antofagasta, Universidad de Antofagasta, Avenida Angamos, Antofagasta 601, Chile
*
Authors to whom correspondence should be addressed.
Solar 2022, 2(4), 401-413; https://doi.org/10.3390/solar2040024
Submission received: 22 July 2022 / Revised: 11 September 2022 / Accepted: 21 September 2022 / Published: 23 September 2022

Abstract

:
Linear Fresnel solar collectors are a promising and emerging solution to contribute to renewable heat supply in industrial processes with thermal energy demand in the medium temperature range (<250 °C). An innovative linear Fresnel collector (LFC) prototype has been designed, patented, and built at the Plataforma Solar de Almería (PSA), Spain. This work presents the applied methodology, experimental device, and results obtained in the measurement of the flux density of concentrated solar radiation in the focal plane of the solar collector. The experimental results confirm that an average flux density of (9.8 ± 0.6) kW/m2 was obtained with a direct normal solar irradiance of (870 ± 10) W/m2 in tests performed in May 2002, which is a result similar to that obtained in optical simulations of the system.

Graphical Abstract

1. Introduction

A linear Fresnel solar collector (LFC) is a concentrating solar collector system designed to supply thermal energy in the medium temperature range. Its design consists of a primary concentrator composed of several rows of reflectors that are oriented in a coordinated movement to reflect direct solar radiation, which is incident on the surface of the mirrors, onto a linear receiver located at a fixed position above the surface of the mirrors. There are designs of LFCs conceived for industrial process heat supply, which have concentrator sizes with apertures ranging from approximately 2 to 4 m and lengths of around 10 m, allowing for highly modular solar field designs to adapt to space constraints in industries or built-up areas, even existing roofs; but there are also larger designs for integration into solar thermal power plants [1].
Due to the number of independently moving rows of mirrors within a LFC, adjacent mirrors can interact with each other optically, reducing the amount of radiation reaching the receiver aperture surface. To reduce these losses, the optical design must be such that the row spacing is optimized to reduce the negative effect of possible shadowing or blocking. Furthermore, in LFC design, the receiver is fixed and only the reflectors move, which means that the angle of incidence θ i of the solar radiation on the primary concentrator mirrors is defined in terms of their projections in the transverse plane, θ and longitudinal plane, θ . Unlike parabolic trough collectors, whose design is also linearly focused, in LFCs, the transverse component of the angle of incidence is not always zero and therefore this has a negative influence on the optical efficiency of the system due to the cosine effect.
With the aim of improving the optical performance of LFC systems, a collector was designed that incorporates a series of innovations aiming to improve the optical efficiency of the system, by tilting an angle λ the primary solar concentrator of the LFC towards the south (for Northern Hemisphere locations) (see Figure 1), together with the tilt of the linear receiver with the same angle as the tilt of the concentrator (see label 3 in Figure 1), the linear displacement a distance d z towards the north of the receiver (see Figure 1), and the possibility of adjusting the transverse tilt angle of each of the two racks into which the primary solar concentrator was divided according to the position of the Sun (see labels 1 and 2 in Figure 1) [2].
In recent years, other researchers have been also working on new LFC developments to make this technology competitive with other CSP systems. Different novel designs that aim to enhance the optical performance of LFC can be classified into two groups: primary concentrator and receiver designs. The first group is the most interesting according to the modifications proposed in this work, and the most relevant designs are presented below.
Zhu and Chen [3] present a compact LFC with polar orientation and two receivers. The authors claims that the 2.1 m2 field area concentrator can achieve 0.95 of ground utilization ratio. Another geometrical modification from a standard design that several authors are incorporated is the displacement of the receiver to minimize the end losses. One of them is Hongh et al. [4], who report an increase up to 12% in the thermal power for winter season with a fix displacement of the receiver. Yang et al. [5] introduce a two-axis tracking system, which increases the optical efficiency in the range of 8–50% (according to size and geometry of the collector) providing of an adjustable displacement, in the axial axe, of the reflectors in order to avoid end losses. Another strategy proposed in the literature is the tilt of the primary concentrator. Ma and Chang [6] tested an experimental system that increased by 20–50% the thermal efficiency by tilting exclusively the primary mirrors (not the receiver). Manikumar et al. [7] and Zhu et al. [8] studied the tracking of both receiver and primary mirrors simultaneously, significantly improving the overall performance of the LFC, in despite of the mechanical complexity. Finally, Zhu and Huang [9] suggest a semi-parabolic configuration which also has a two-axis tracking system.
The LFC design experimentally investigated in this work incorporates some of these features already proposed by some authors and was developed to contribute to and demonstrate a new solution to make this solar thermal technology market competitive. The scope of present work is to first present experimental results on the optical performance of the first prototype of LFC manufactured with this design and confirm simulation results. Ray-tracing simulations are performed to quantify the optical performance of the system in terms of incidence angle modifier and incident power achieved in the receiver plane, and experimental tests are executed to validate simulation results.
Concentrated solar flux measurements performed on LFC systems and reported in the literature are very scarce. A recent work of Zhao et al. [10] follows a procedure using similar equipment to the one considered in the present work to quantify the effect of dust accumulation on the energy flux concentrated in the receiver plane of a small unit of LFC installed for research purposes.
In the present work, energy flux measurements are carried out to validate average solar flux values and incident power calculated in previous simulations studies developed during the optimization process of the designed innovative LFC. Section 2 of this article presents the main features of the LFC prototype tested, the methodology, and experimental device prepared for the measurement of the flux density of concentrated solar radiation in the plane of the receiver. Section 3 summarizes the results obtained in an experimental campaign of flux density and total incident power measurements in the focal plane, carried out on the first innovative LFC prototype built and installed at the Plataforma Solar de Almería (PSA). Section 3 also includes a comparison between experimental and simulation results obtained by ray-tracing.

2. Materials and Methods

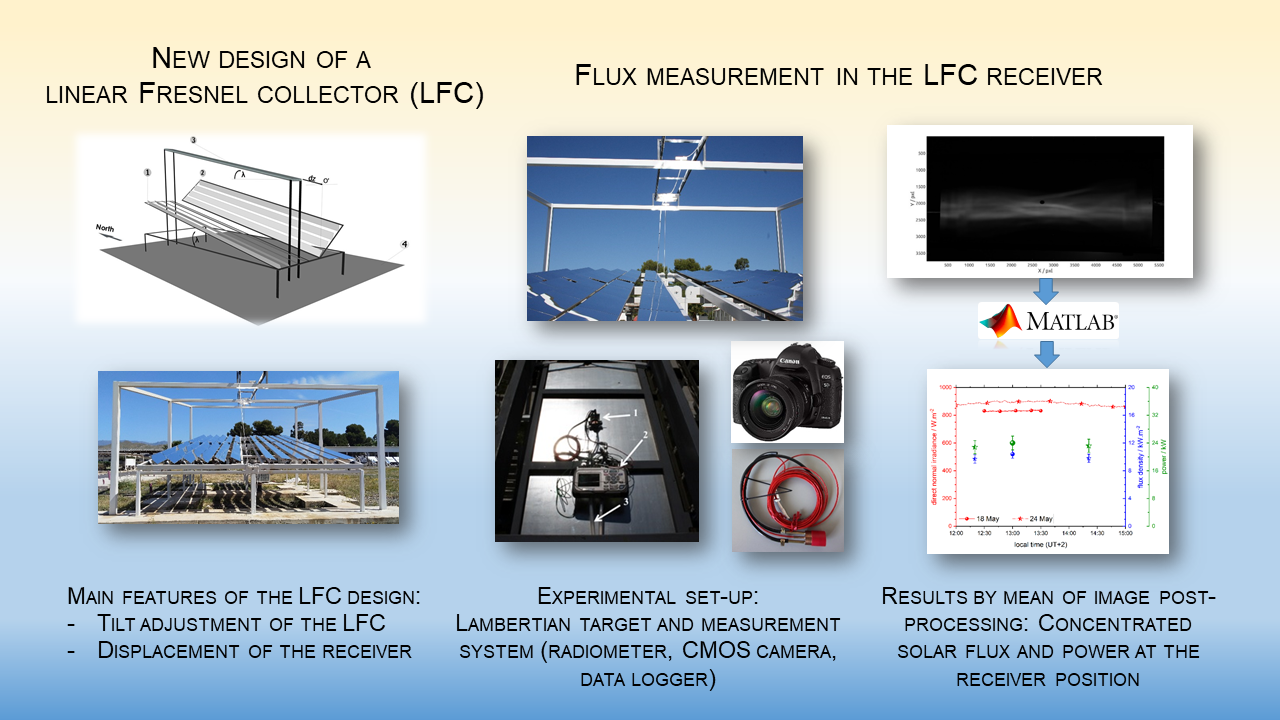
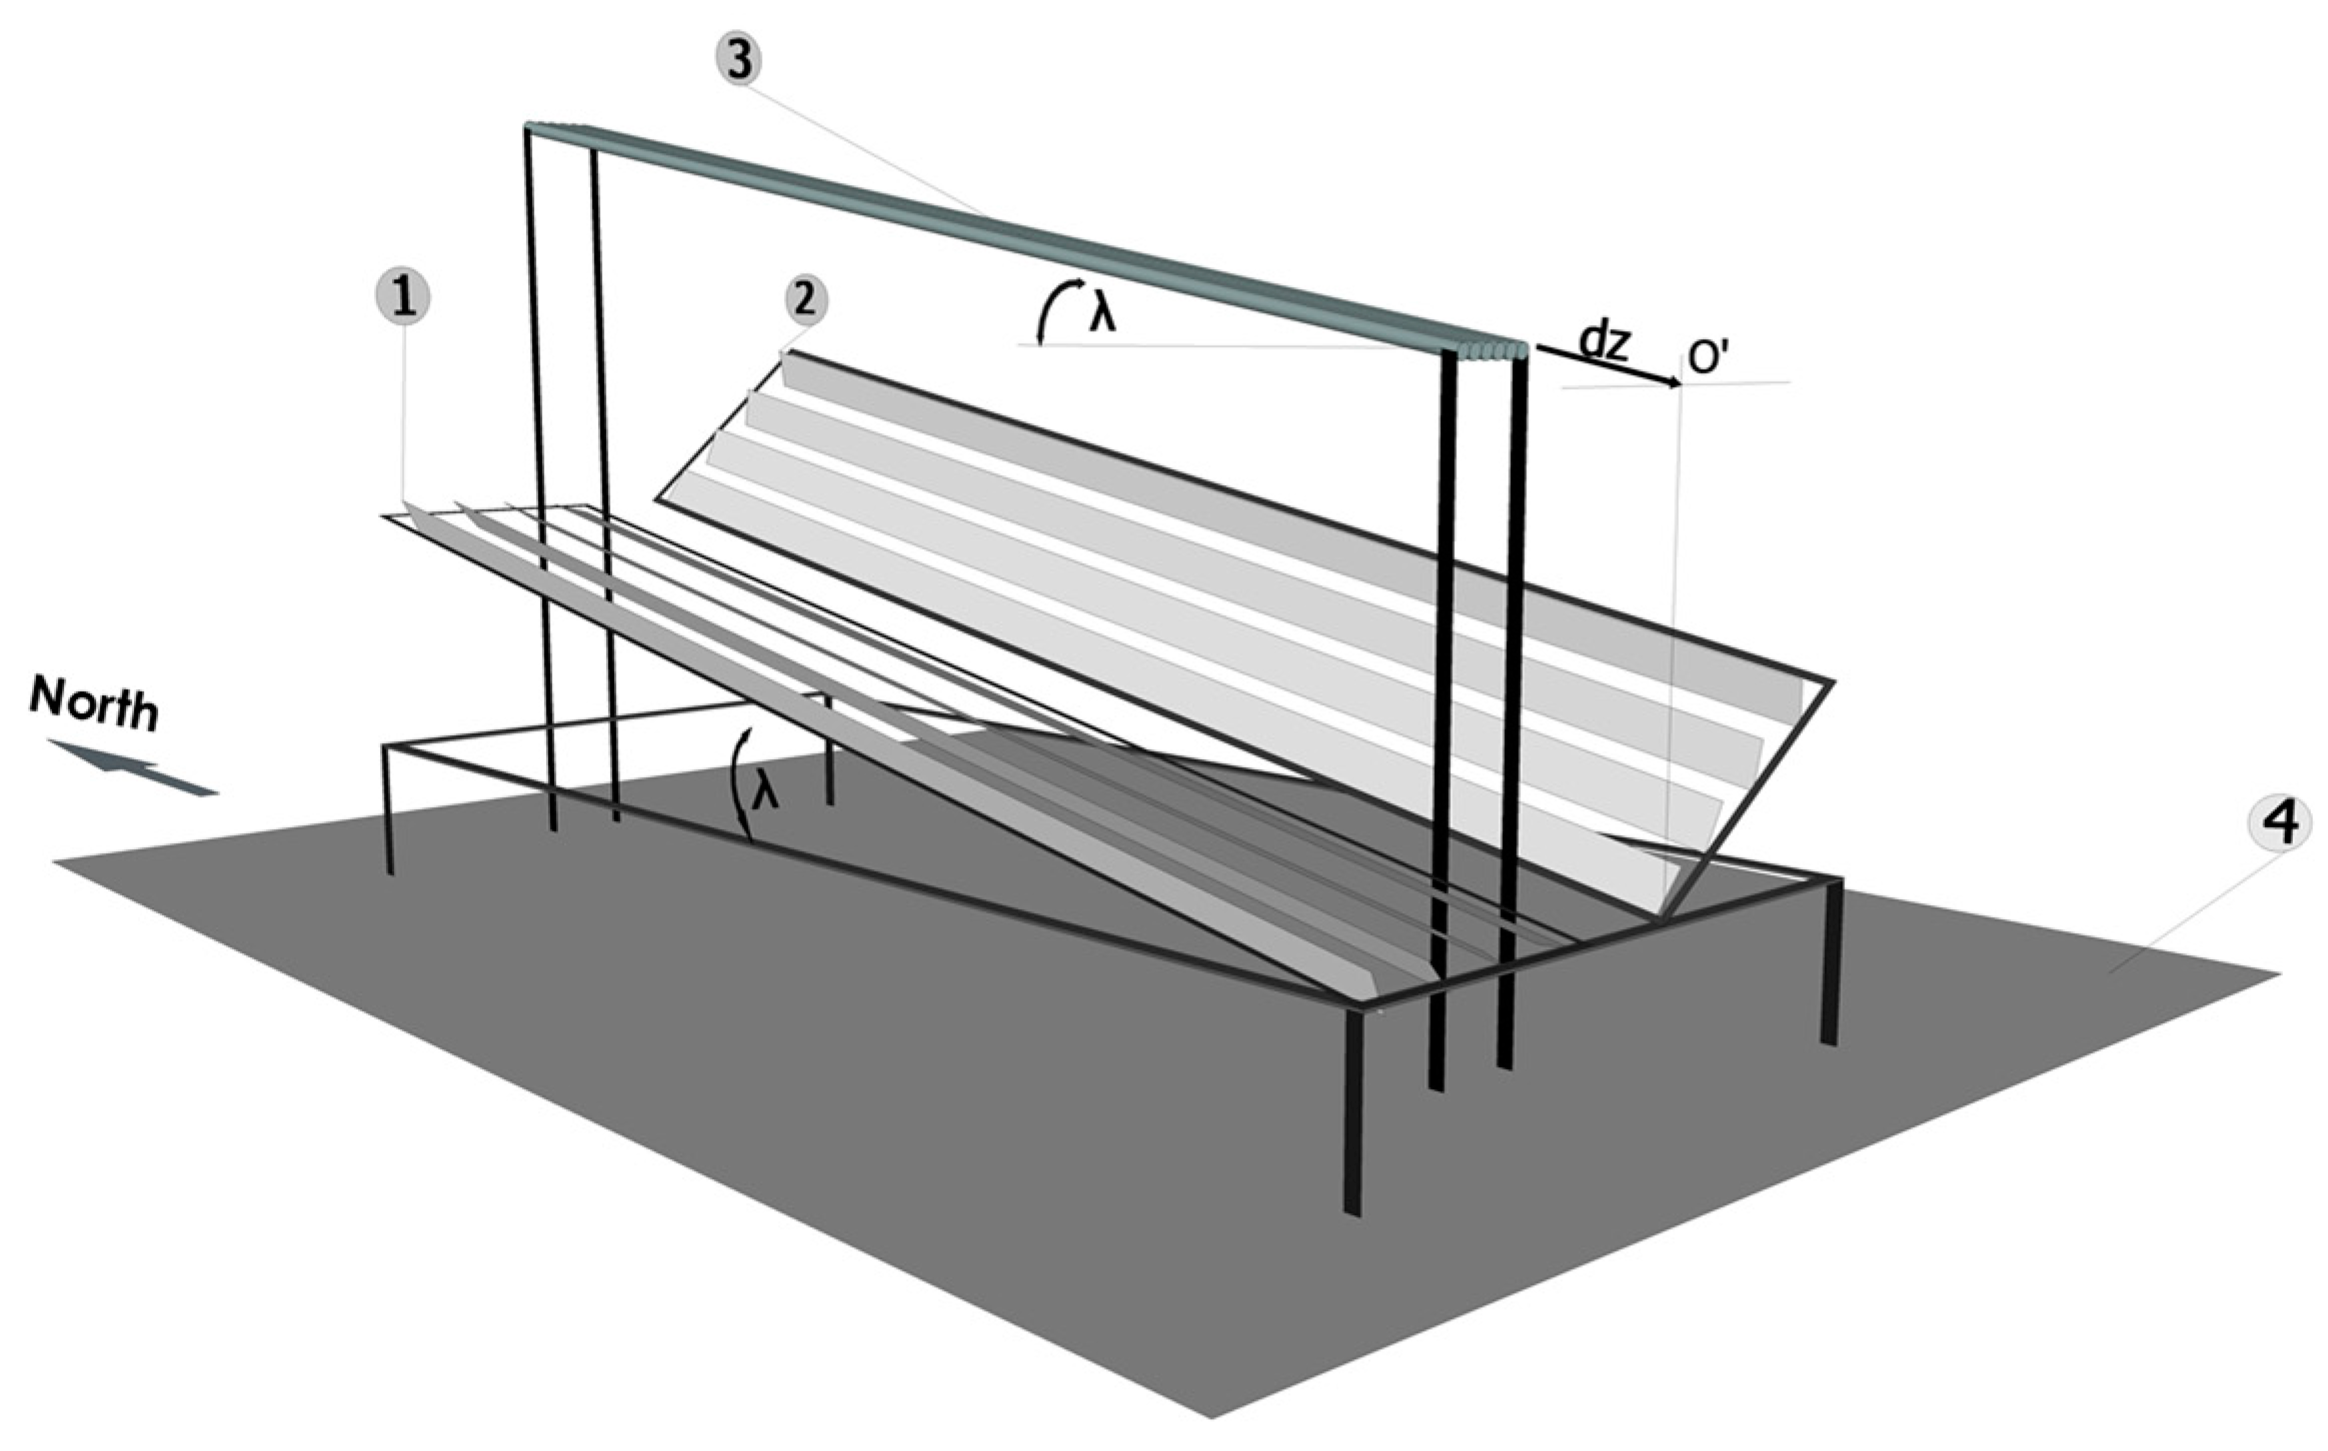
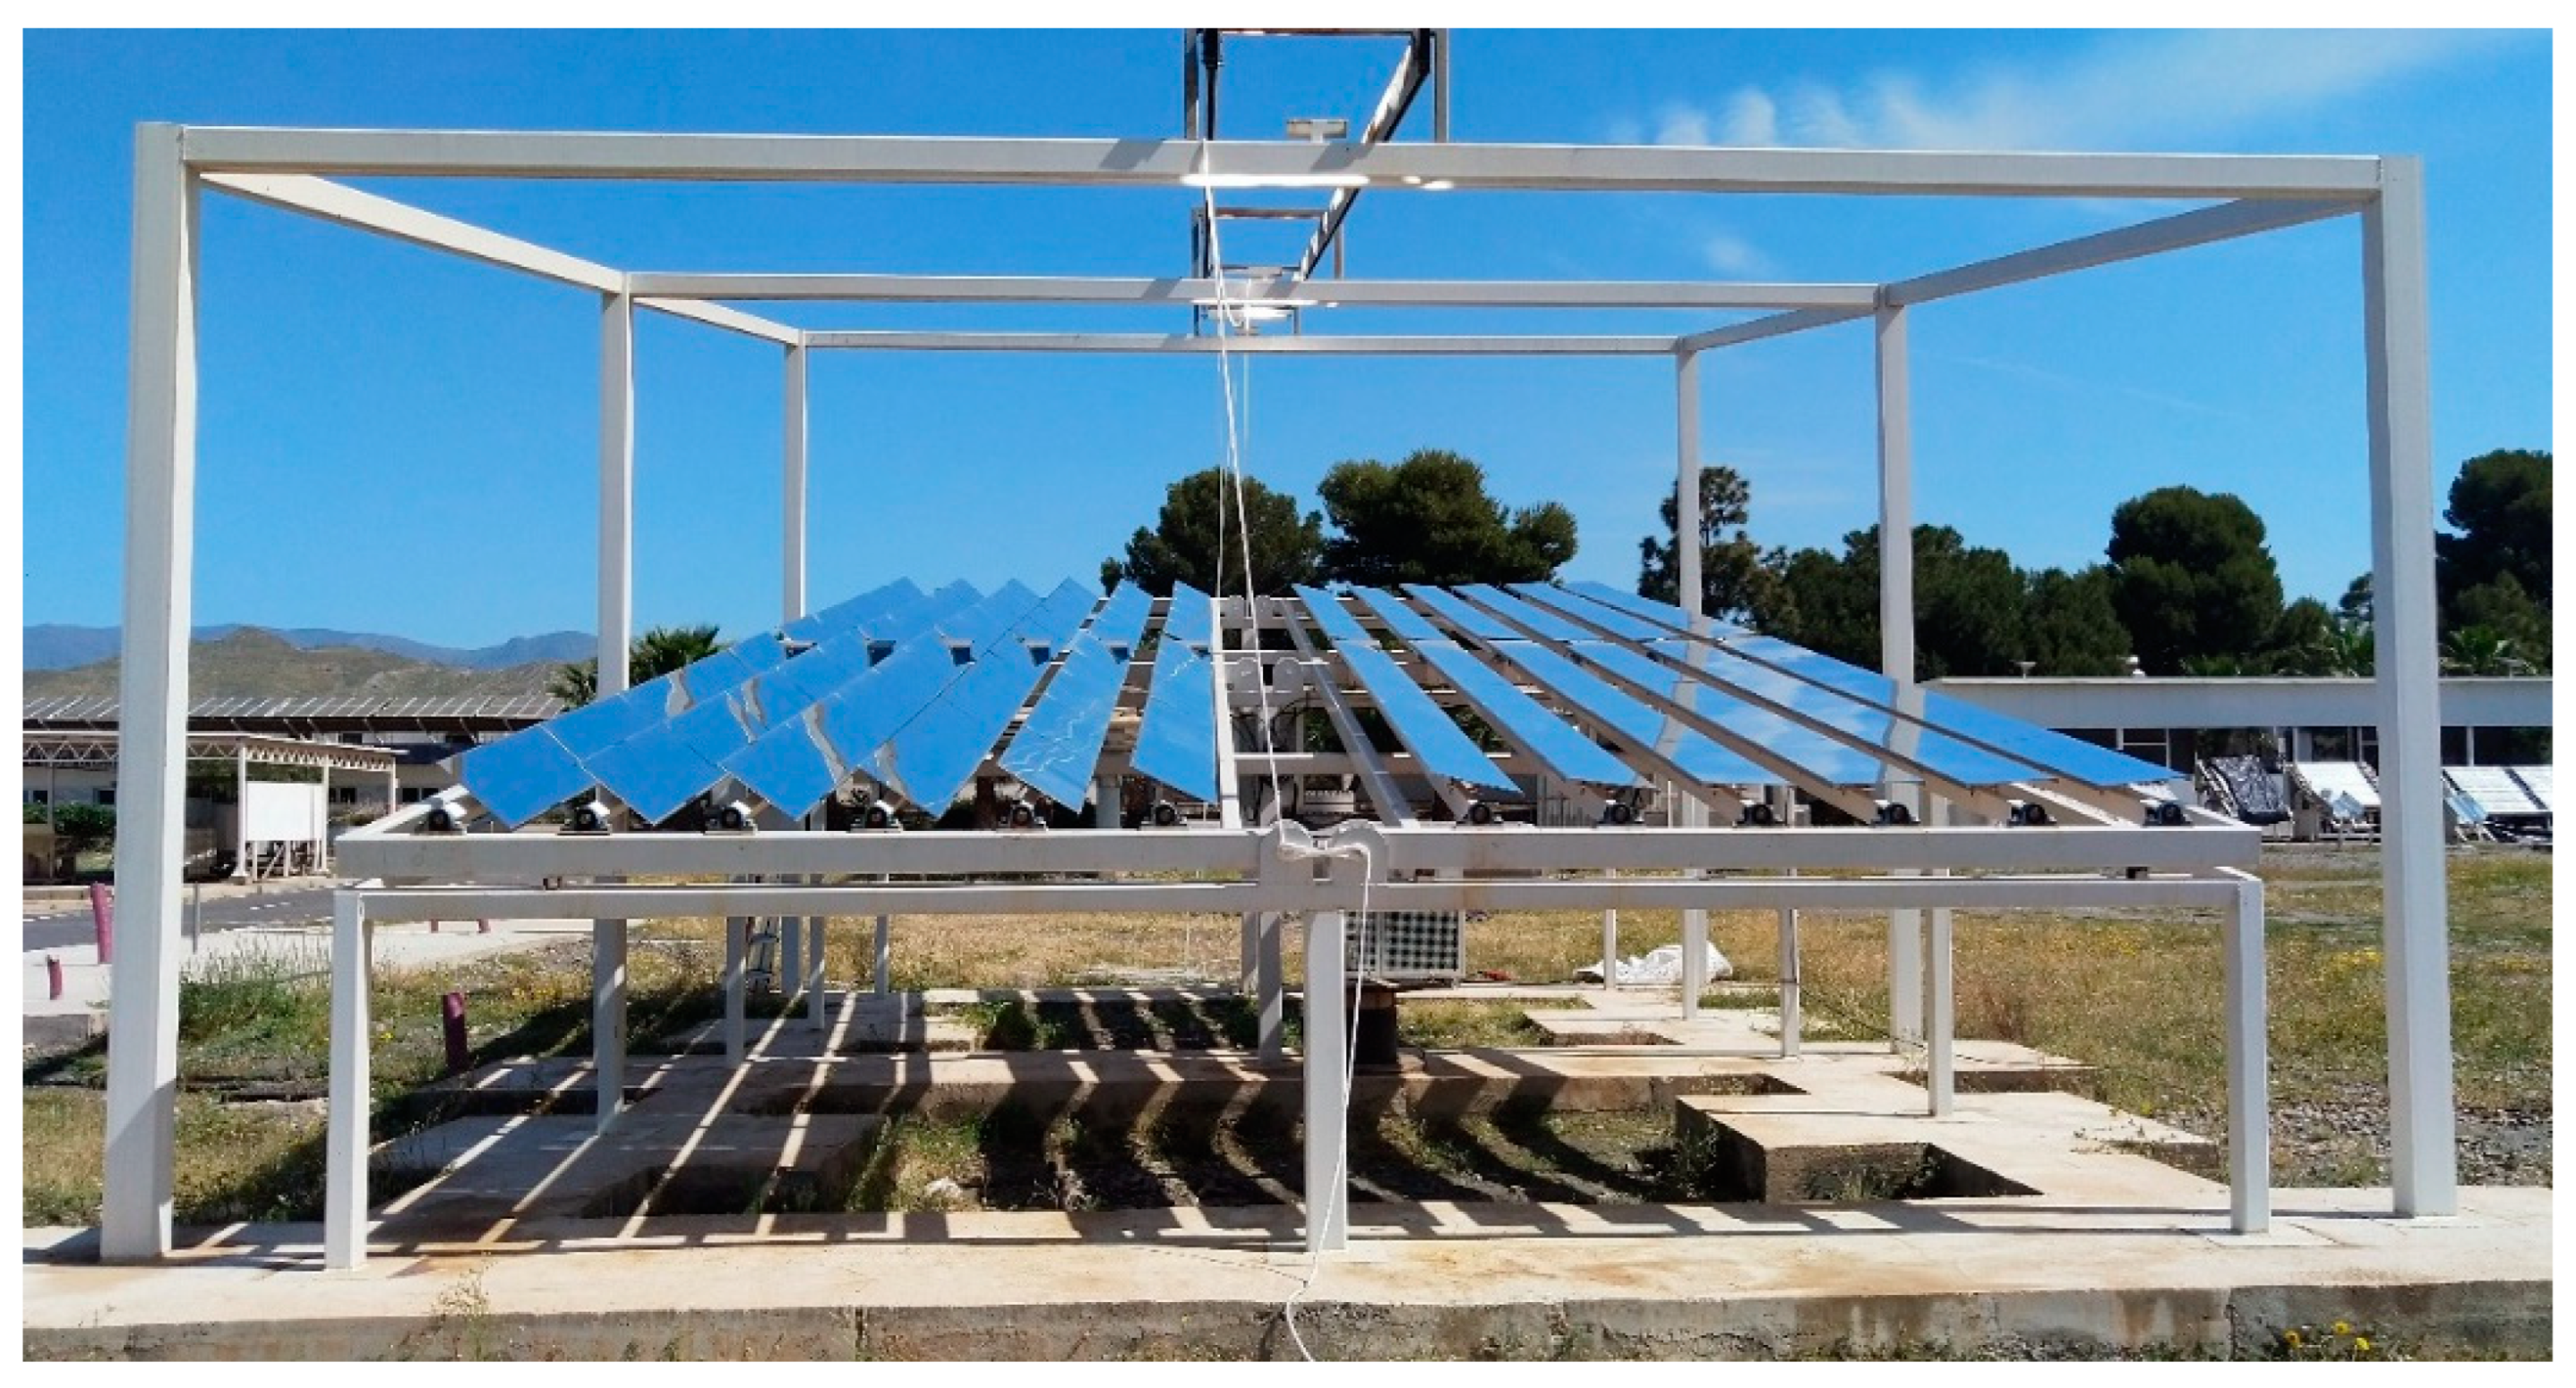
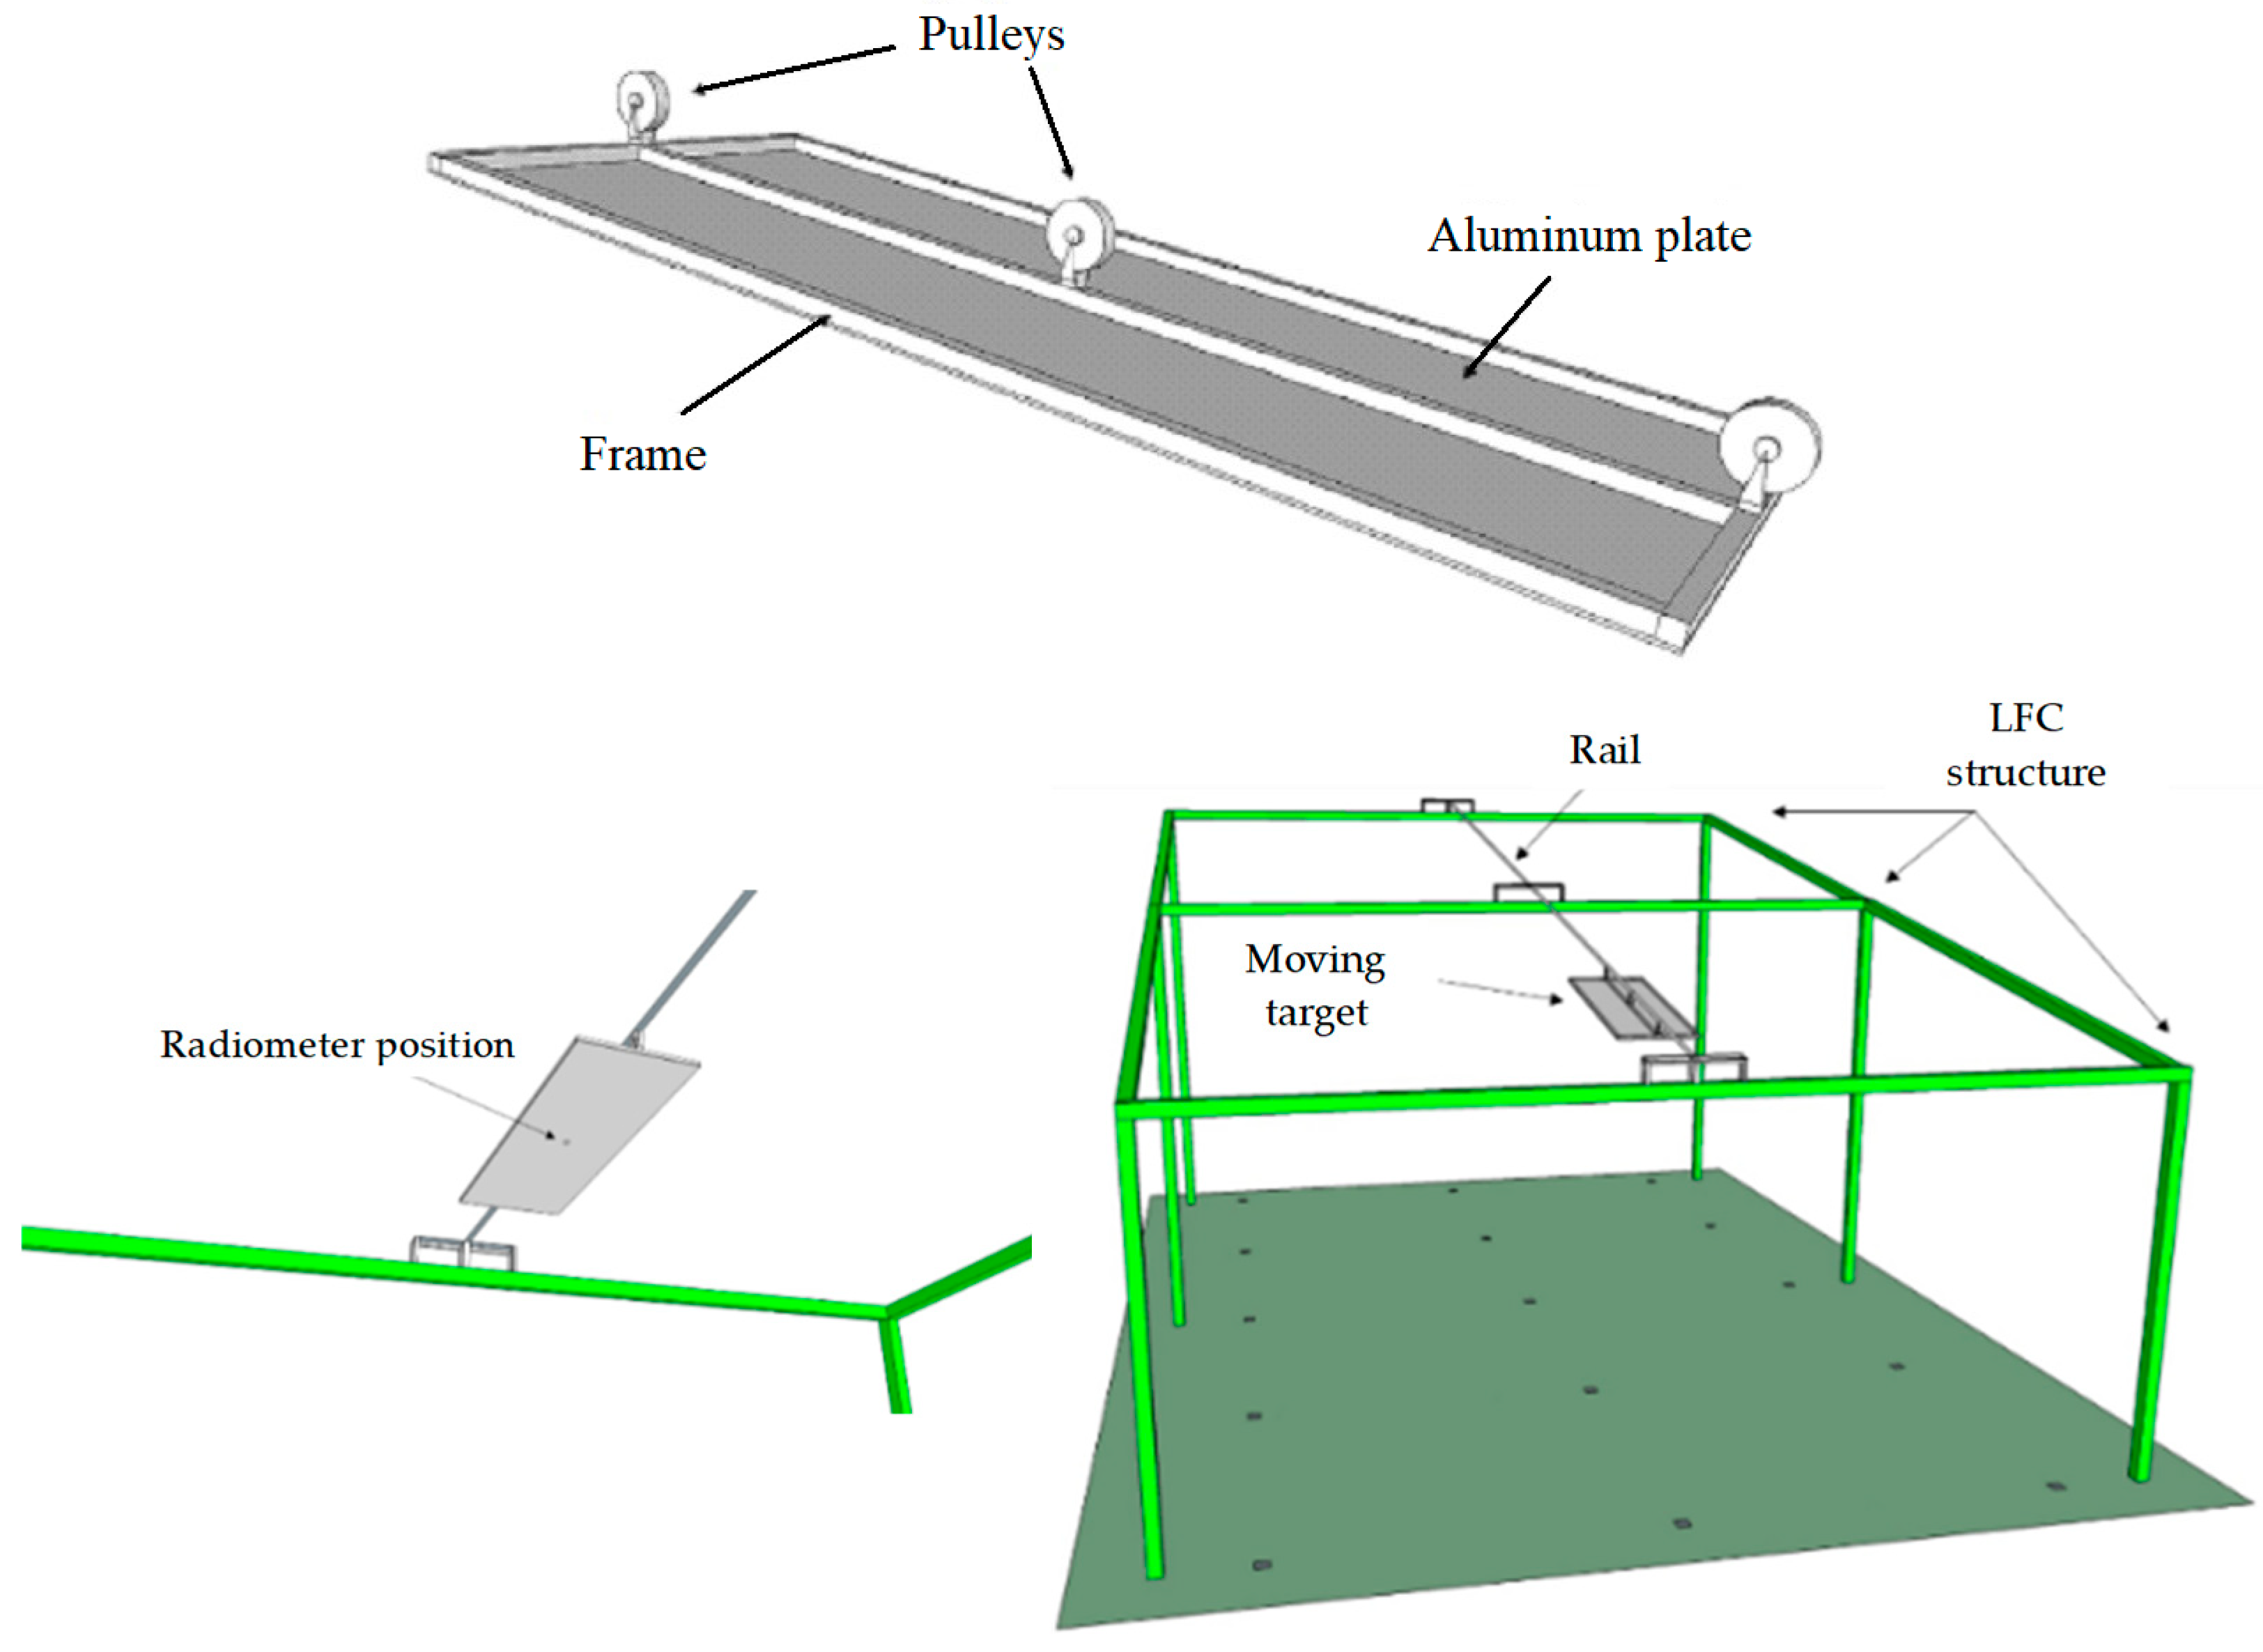
2.1. Description of the Linear Fresnel Collector

2.1.1. Geometry of the Collector System

The innovative LFC prototype, which was manufactured and installed at PSA, consists of a primary concentrator, composed by 12 rows of 10 m long reflectors (see Figure 2), and a receiver consisting of 6 parallel absorber tubes, of the same length (10 m), located in a trapezoidal cavity mirrored on the inside. The tilting angle λ of both, the primary solar concentrator and the receiver, is 10°. Details on the optimization design process followed to define configuration of the concentrator, shape of the primary mirrors, number and width of mirrors, concentrator tilt, and receiver design, height, axial displacement and configuration of the LFC prototype can be found in [2].
The mirrors of the primary concentrator are made of silvered glass with a thickness of 1 mm [11]. Each row of primary reflector of the LFC is segmented into 10 facets; the facet size is 1 m long by 0.28 m wide. They were fabricated at PSA from 1 mm thick silvered glass mirrors and 3 mm thick curved aluminum sheet [12]. The curvature of the facets is cylindrical because although this geometry presents optical aberrations that do not appear in the case of parabolic geometry, it is constructively simpler and cheaper to manufacture. In addition, this geometry presents an optical behavior similar to the parabolic if the distance from the receiver to the reflector and the width of the reflector are similar to those of this design [13]. In the case of cylindrical geometry, the radius of curvature of the facet must be twice that of the focal length.
With regards the multi-tube cavity receiver, the stainless-steel absorber tubes of diameter DN20 (outer diameter 1.05 inches) are spaced 30 mm apart. The aperture width of the cavity is 350 mm, with the receiver panel centered in this aperture and located at a (focal) distance of 2.3 m from the plane of the primary concentrator.

2.1.2. Optical Efficiency of the Novel Design

In concentrating solar collectors, the effect of the variation of θ i through the day affects the optical efficiency of the system, η opt , which is modified as follows
η opt = η opt , 0 ° · K θ i
where η opt , 0 ° is the optical efficiency of the system for normal incidence of solar radiation and K θ i is the incidence angle modifier (IAM). The lower the value of IAM is below 1, the worse the optical efficiency will be. By mean of ray tracing simulations is possible to calculate K θ i for different positions of the Sun, accounting the number of rays impinging on the surface of the receiver panel for each θ i considered, N receiver θ i , and comparing to the rays impinging when the incidence is normal θ i = 0 ° , N receiver 0 ° , as shown in Equation (2).
K θ i = N receiver θ i N receiver 0 °
To compare the percentage improvement in optical efficiency in the proposed LFC design compared to a LFC with same dimensions but without considering the modifications mentioned related to the tilting of the concentrator/receiver, displacement of the receiver to the north, and rotation of the frames composing the primary concentrator, ray tracing simulations using Tonatiuh software [14] were performed of the two LFC configurations, i.e., with modifications and of a standard version, for a wide range of Sun positions: (i) solar azimuth from 90° (east) to 270° (west), and (ii) solar elevation from 0° to 90° [15]. Figure 3 shows maps of IAM values calculated for both LFC configurations, considering a system installed in the Northern Hemisphere. Optical efficiency improves more than 39 ppt (percentage points) for a significant number of combinations of solar azimuth and elevation, within the range of azimuth between 90° and 140° and 220° and 270° (taking into account that azimuth 180° is the direction to the south) and for low elevations of the Sun, which is the situation occurring every day close to the sunrise and to sunset at many times of the year. It is also noted that the improvement is about 20 ppt for a wide range of solar azimuth and elevation combinations, in the range of elevations from 20° to 70° with solar azimuth varying between 120° and 240°, which happens in many times along the year at the Plataforma Solar de Almería location, where the LFC prototype is installed (Latitude = 37°06′ north). Averaging the values of the matrix with the differences of values represented in both IAM maps of Figure 3, the percentage of improvement in optical efficiency of the innovative LFC presented, is 10.4 ppt.

2.2. Concentrated Solar Radiation Flux Measurement Methodology

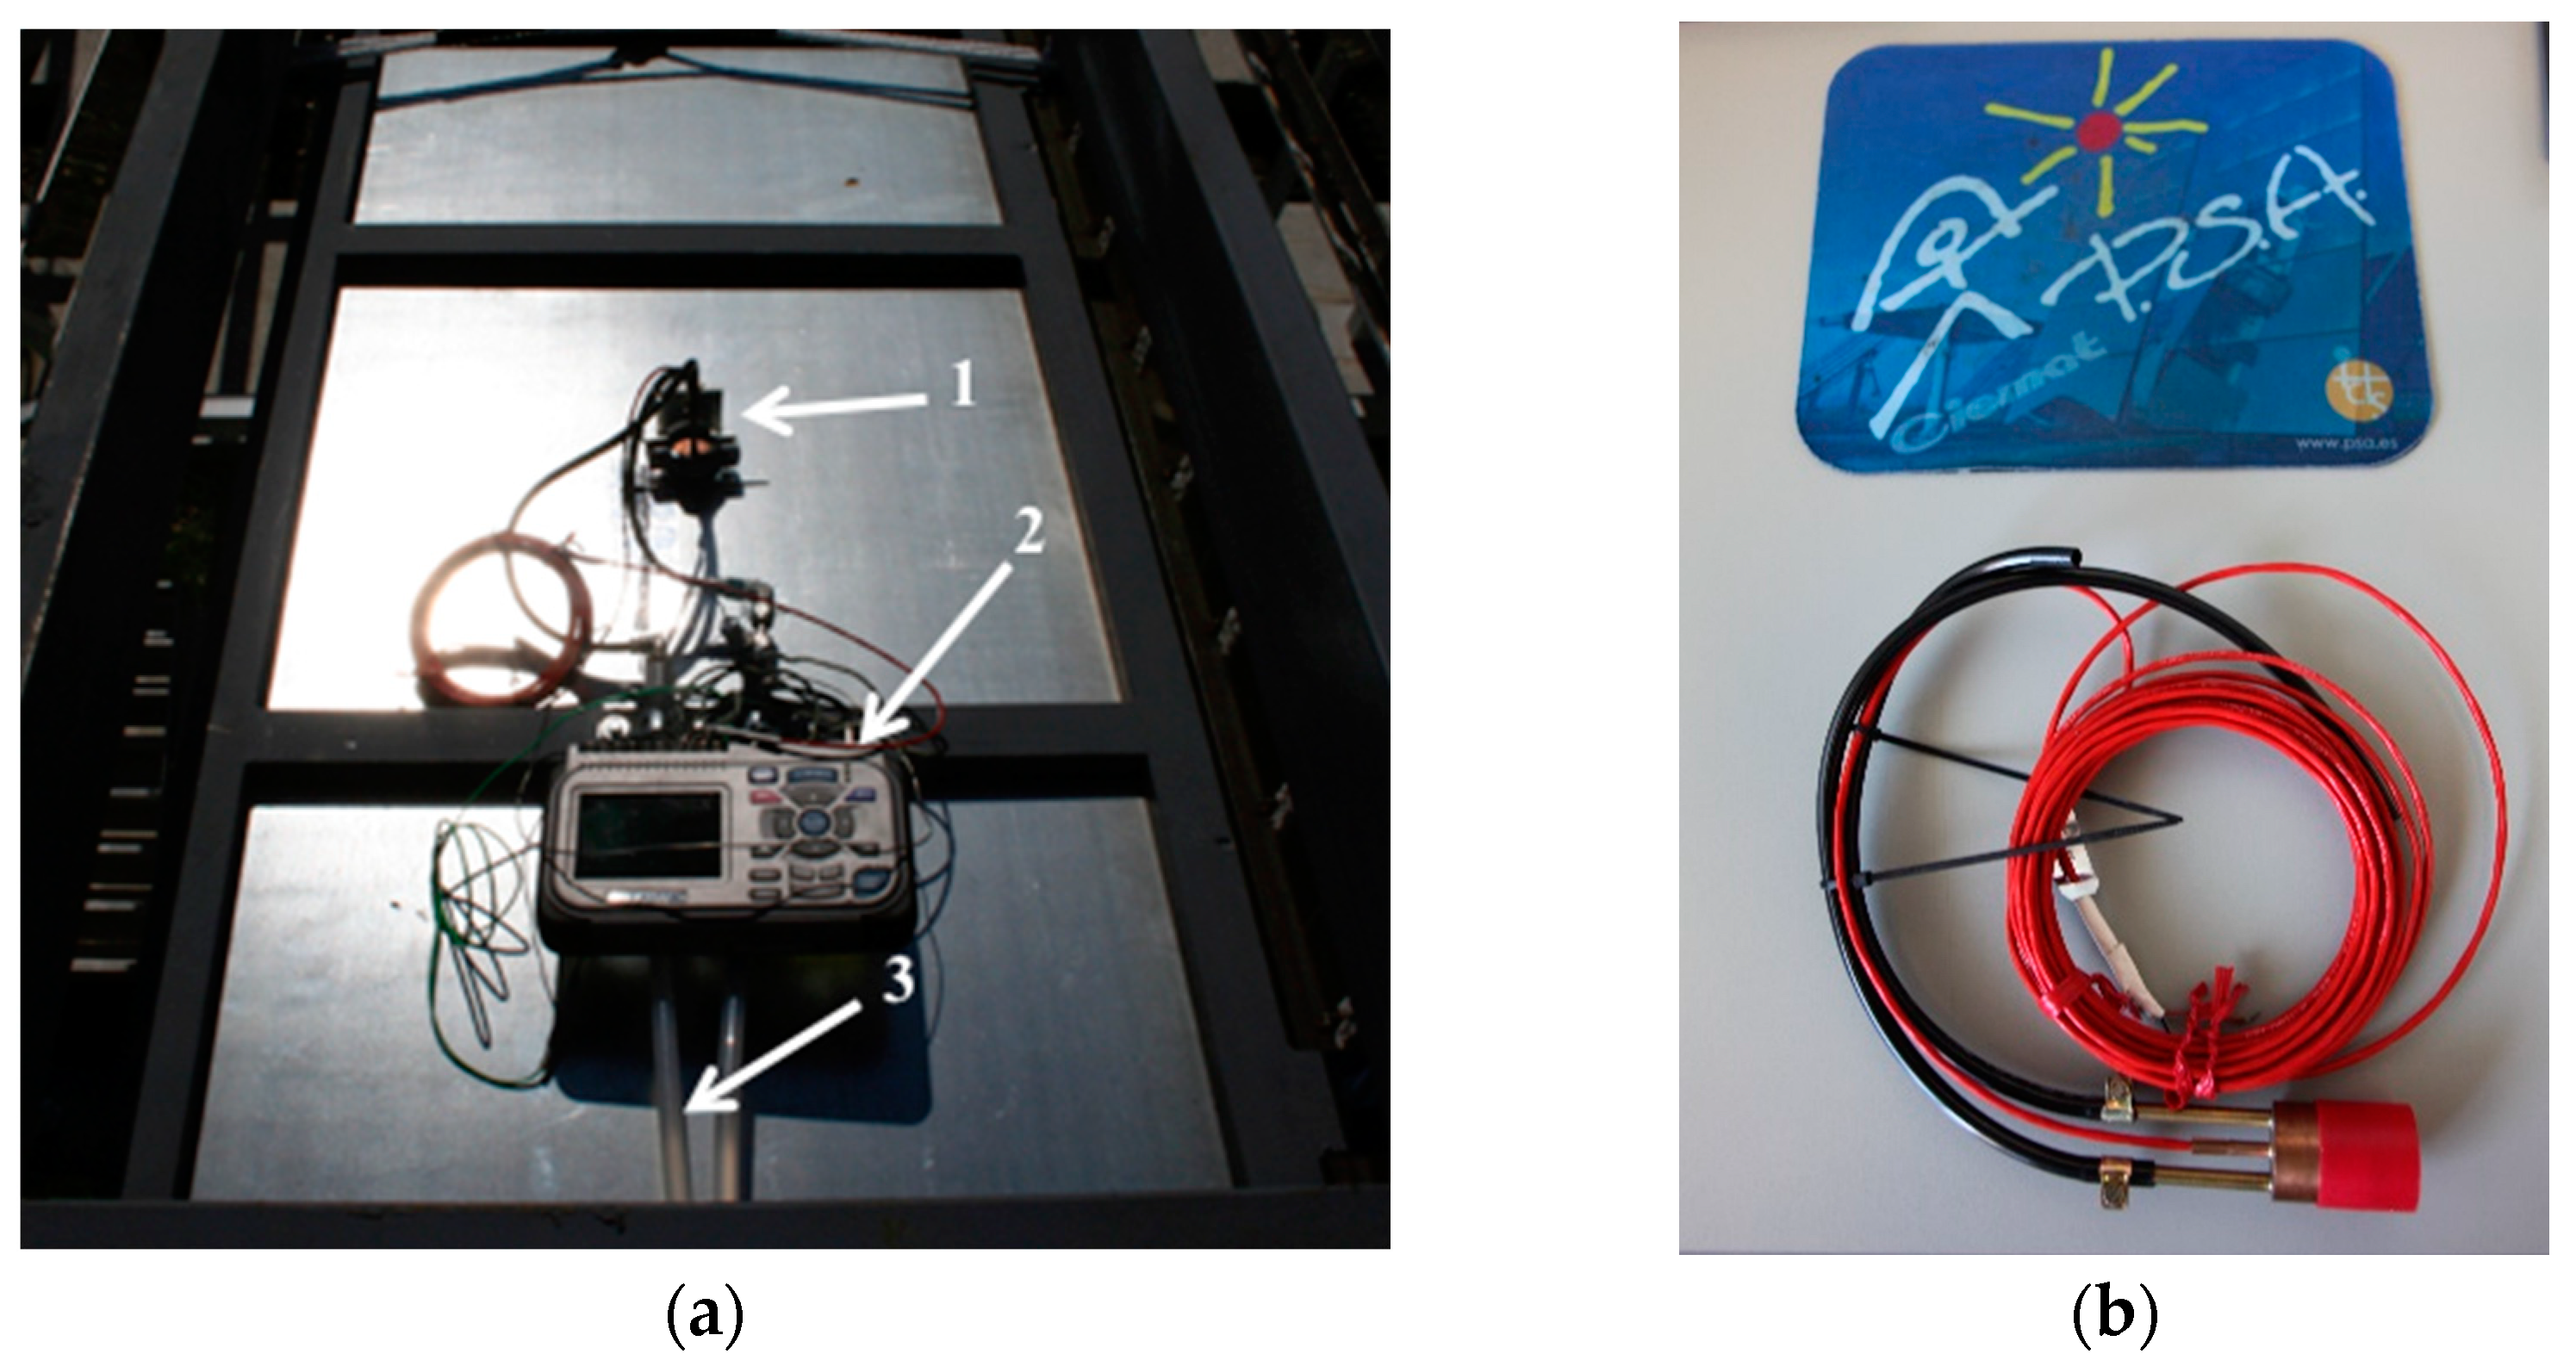
2.2.1. Description of the Measuring Device

In order to evaluate the optical behavior of the primary concentrator of the LFC designed, manufactured, and built before the installation of the cavity receiver, an experimental device was prepared and used to measure the flux density of concentrated solar radiation on the receiver plane aperture. The device implemented is an indirect measurement system consisting of taking images, by means of a CMOS camera, of the illumination level of a Lambertian surface where all the facets of the primary reflector point to, which is located at the position of the receiver (in the focal plane of the primary concentrator). This illumination level, represented by a gray scale, of each pixel of the image of this surface is calibrated to a given value of flux density measured pointwise with a Gardon radiometer [16]. The signal measured at each pixel of the target surface must be corrected by considering a function, which depends on the non-linearity of the camera response, the distortion of the lens, the homogeneity of the surface properties, the position of the camera relative to the surface, the available solar spectrum and the dependence of the reflectance with the angle of incidence. The CMOS camera is equipped with an optical filter of neutral density 2, which prevents signal saturation.
The surface on which the measurement is done must have Lambertian characteristics, i.e., an ideally matte homogeneous white surface where diffuse reflection predominates and specular reflection is minimal or negligible. Thus, the illumination level of the Lambertian surface for an observer is the same, independently of the observer’s viewing angle. The surface must also be temperature resistant, and its reflectance must also be independent of temperature.
The instrumentation used in the experimental setup is completed with a Gardon type radiometer for the measurement of concentrated solar radiation. This sensor uses a transducer consisting of a differential thermocouple that measures the temperature difference between the center and the edge of a water-cooled thin film disc. Due to the characteristics of the two materials used in this sensor, an output voltage is generated which is directly proportional to the heat flux absorbed by the sensor surface. The exposed sensor surface is additionally coated with a high absorbance black coating, in order to achieve a sufficiently high absorption of the incident solar radiation to generate a perceptible electrical signal [17].
Table 1 presents a summary of the characteristics of the measurement equipment used in the experimental setup.
For the construction of the Lambertian target and its installation in the LFC, this surface was defined as 1.2 m long and 0.6 m wide. The target is made of 4 mm thick aluminum plate, which was sandblasted to achieve a rough surface to ensure diffuse reflectance when illuminated and to get good adhesion of the applied Amercoat® coating. The coated side of the aluminum plate faces the primary reflectors of the LFC. In addition, the plate has a circular opening in its central position, whose diameter is that of the radiometer head (see Figure 4b), where it is positioned to have a reference measurement of the concentrated solar irradiance in the plane of the target (Figure 4). The device is completed by a manual mechanism, consisting of a rail and pulleys to position the target along the entire length of the focal plane, where the receiver is located (Figure 5).

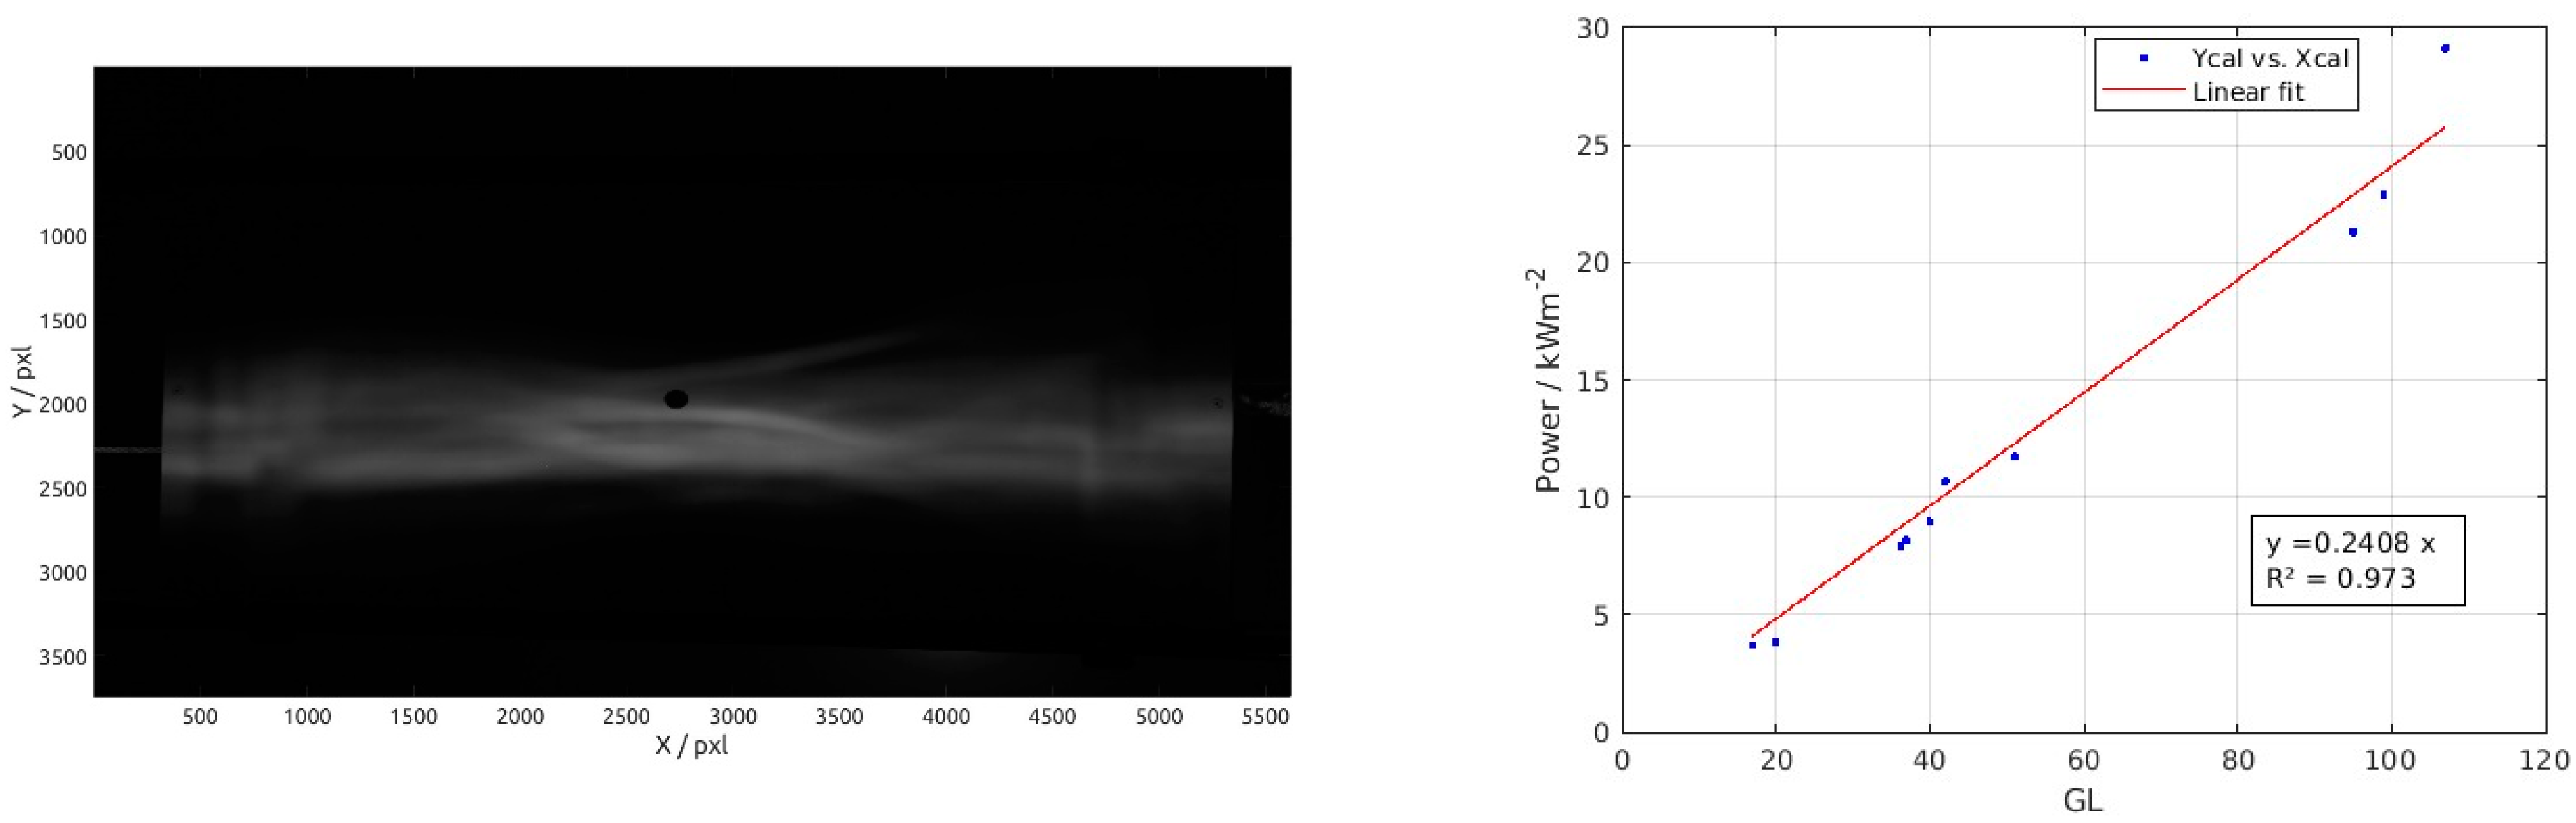
2.2.2. Calibration Procedure of the Flux Measurement System
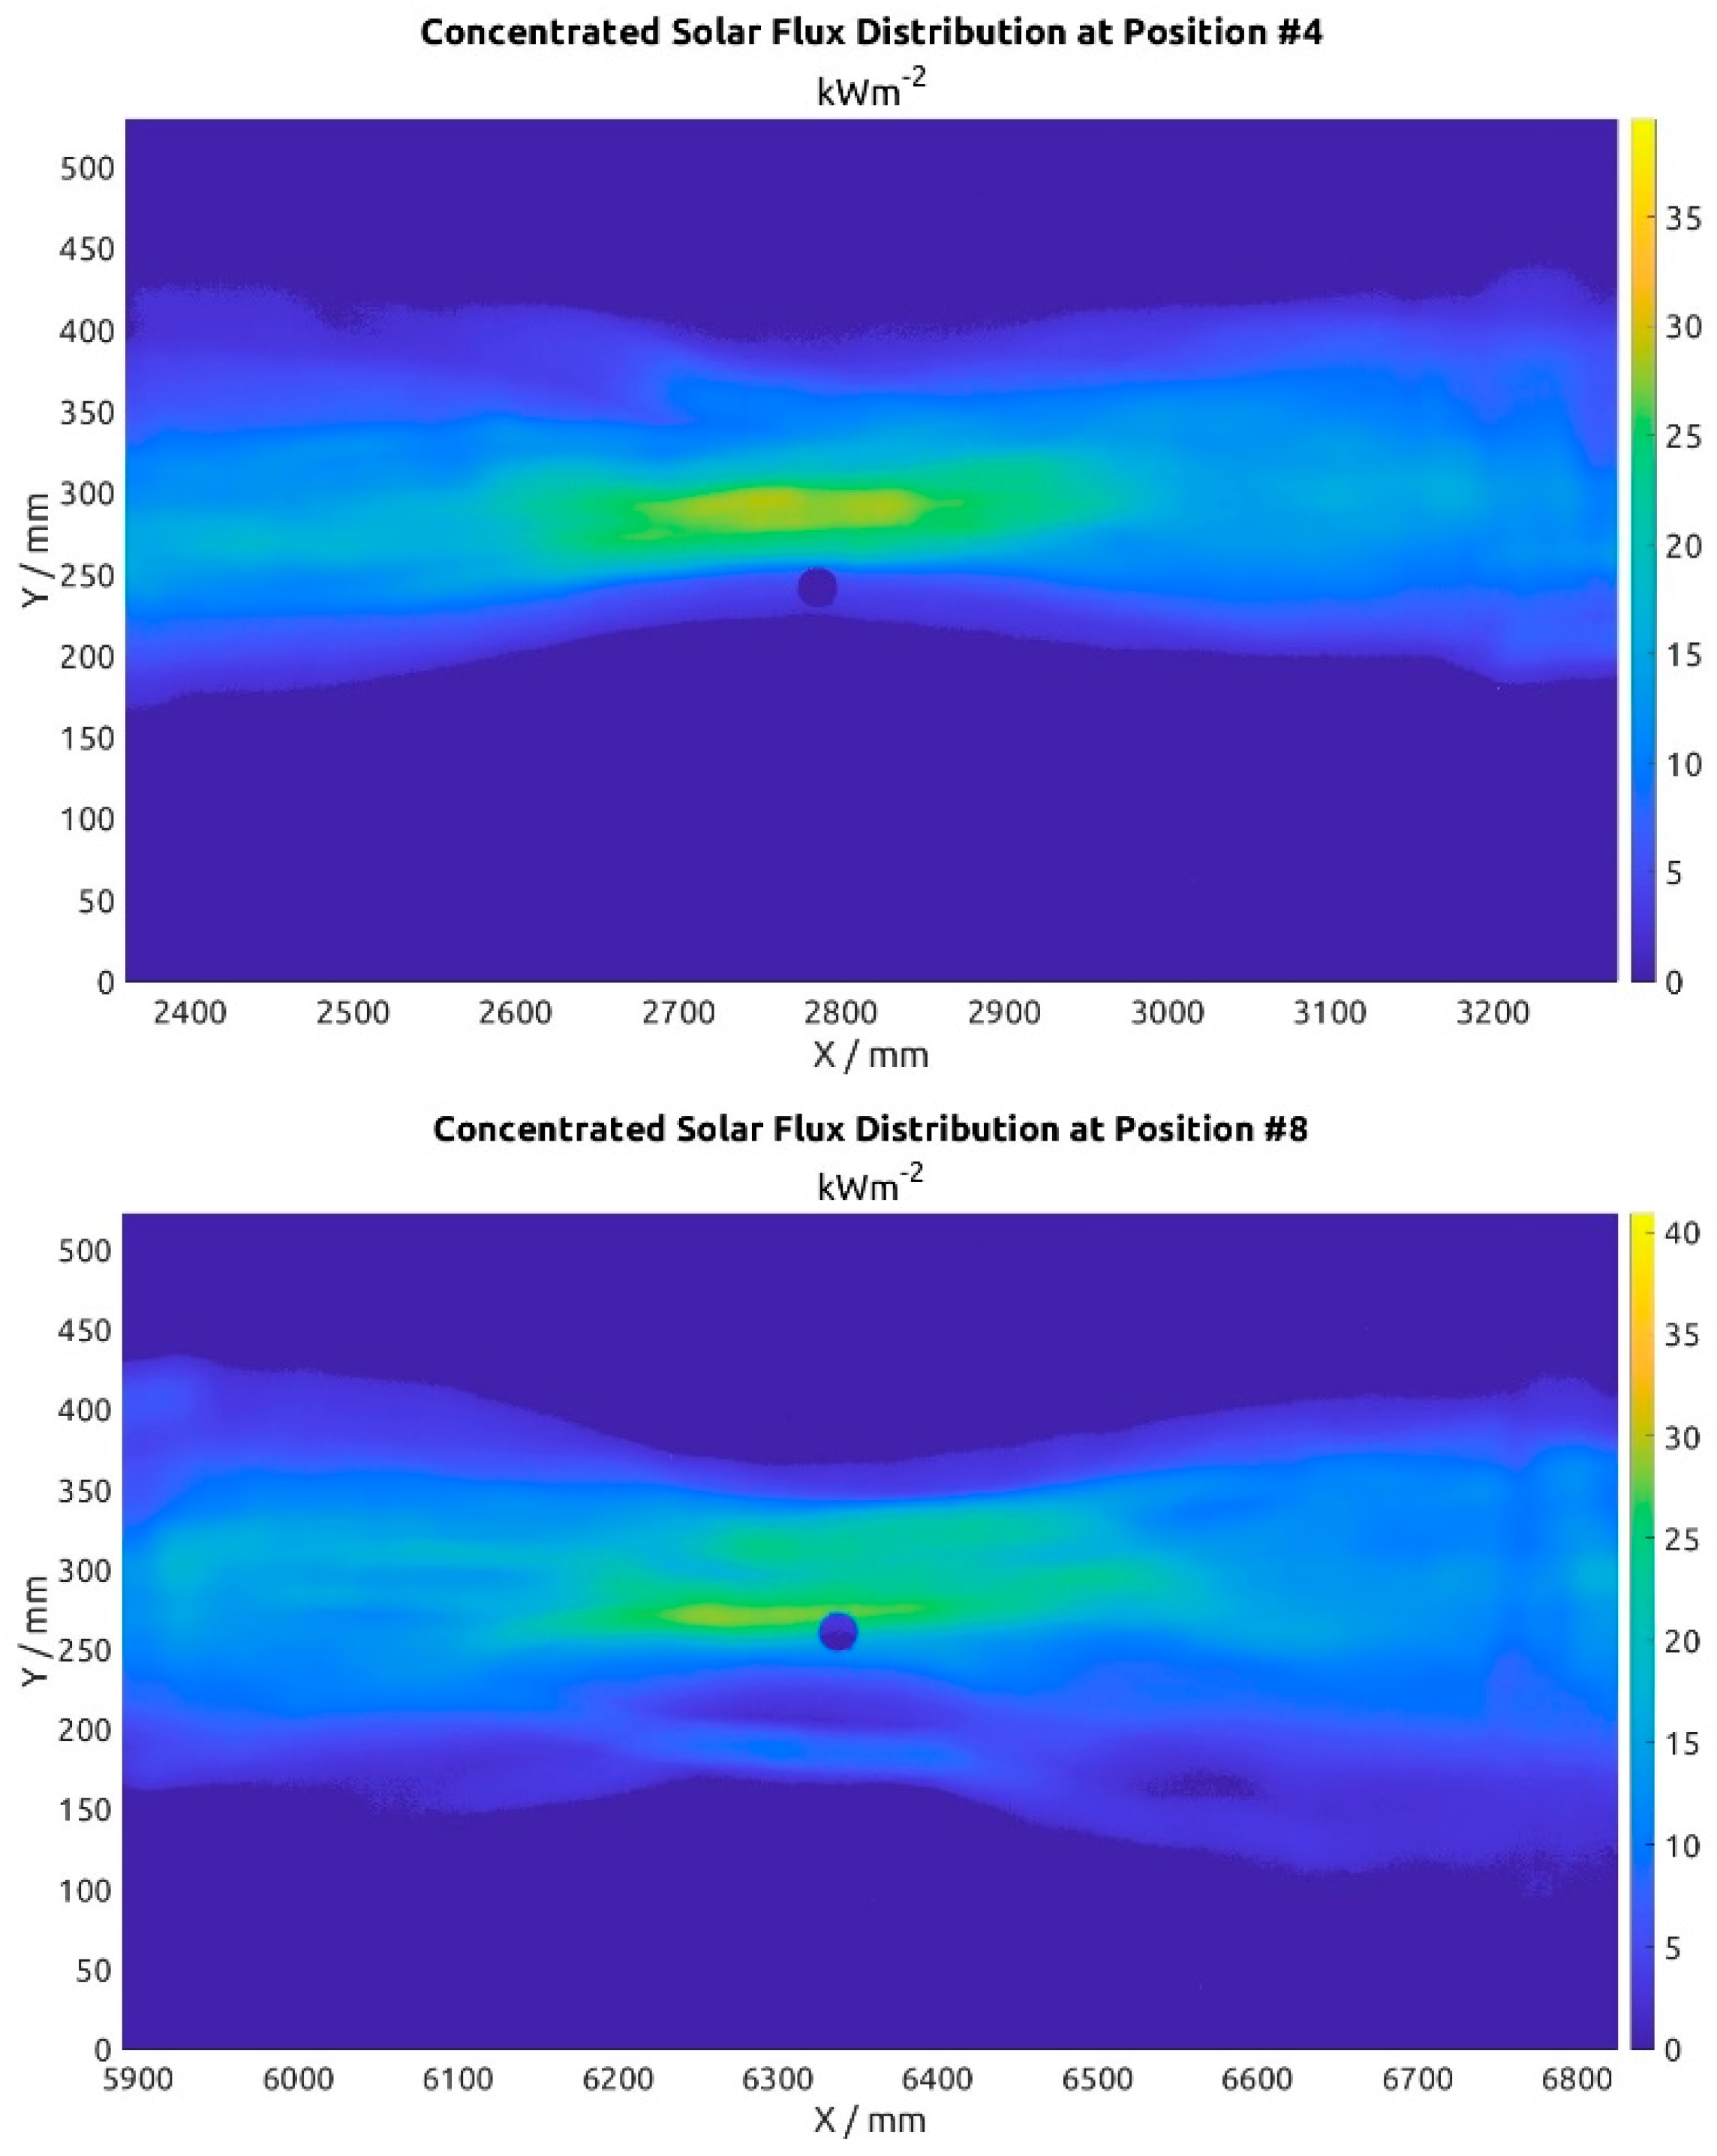
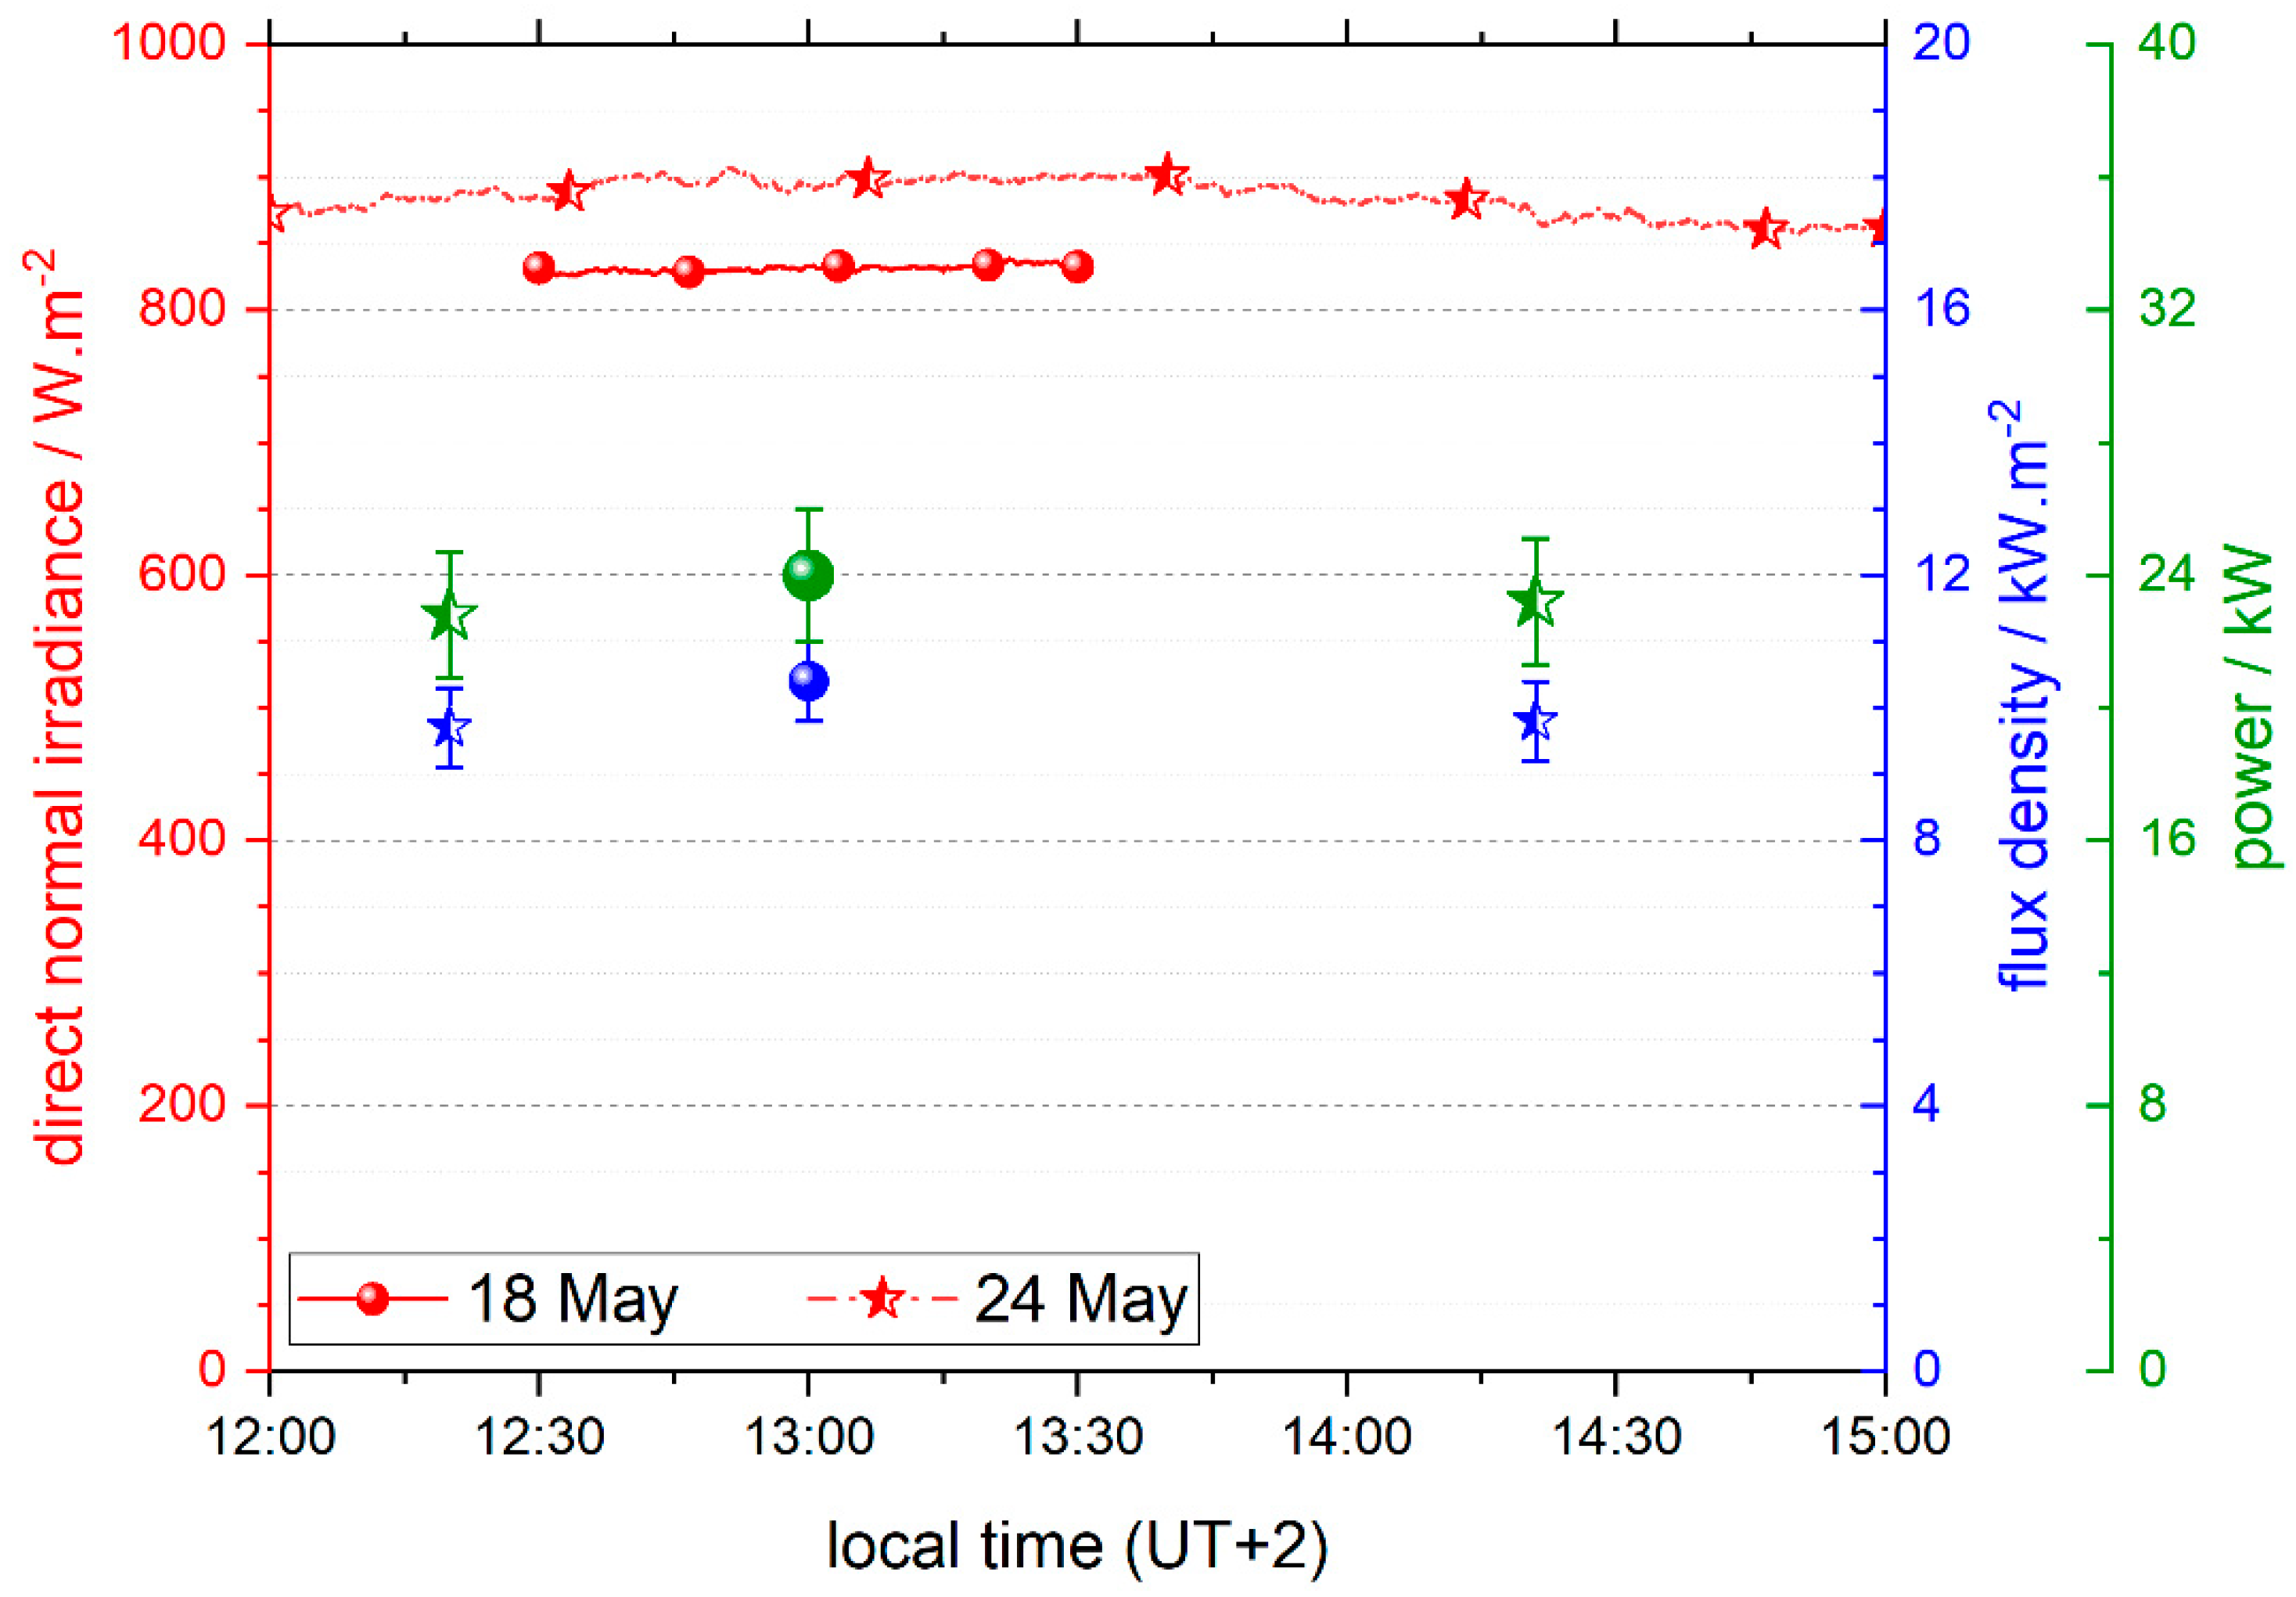
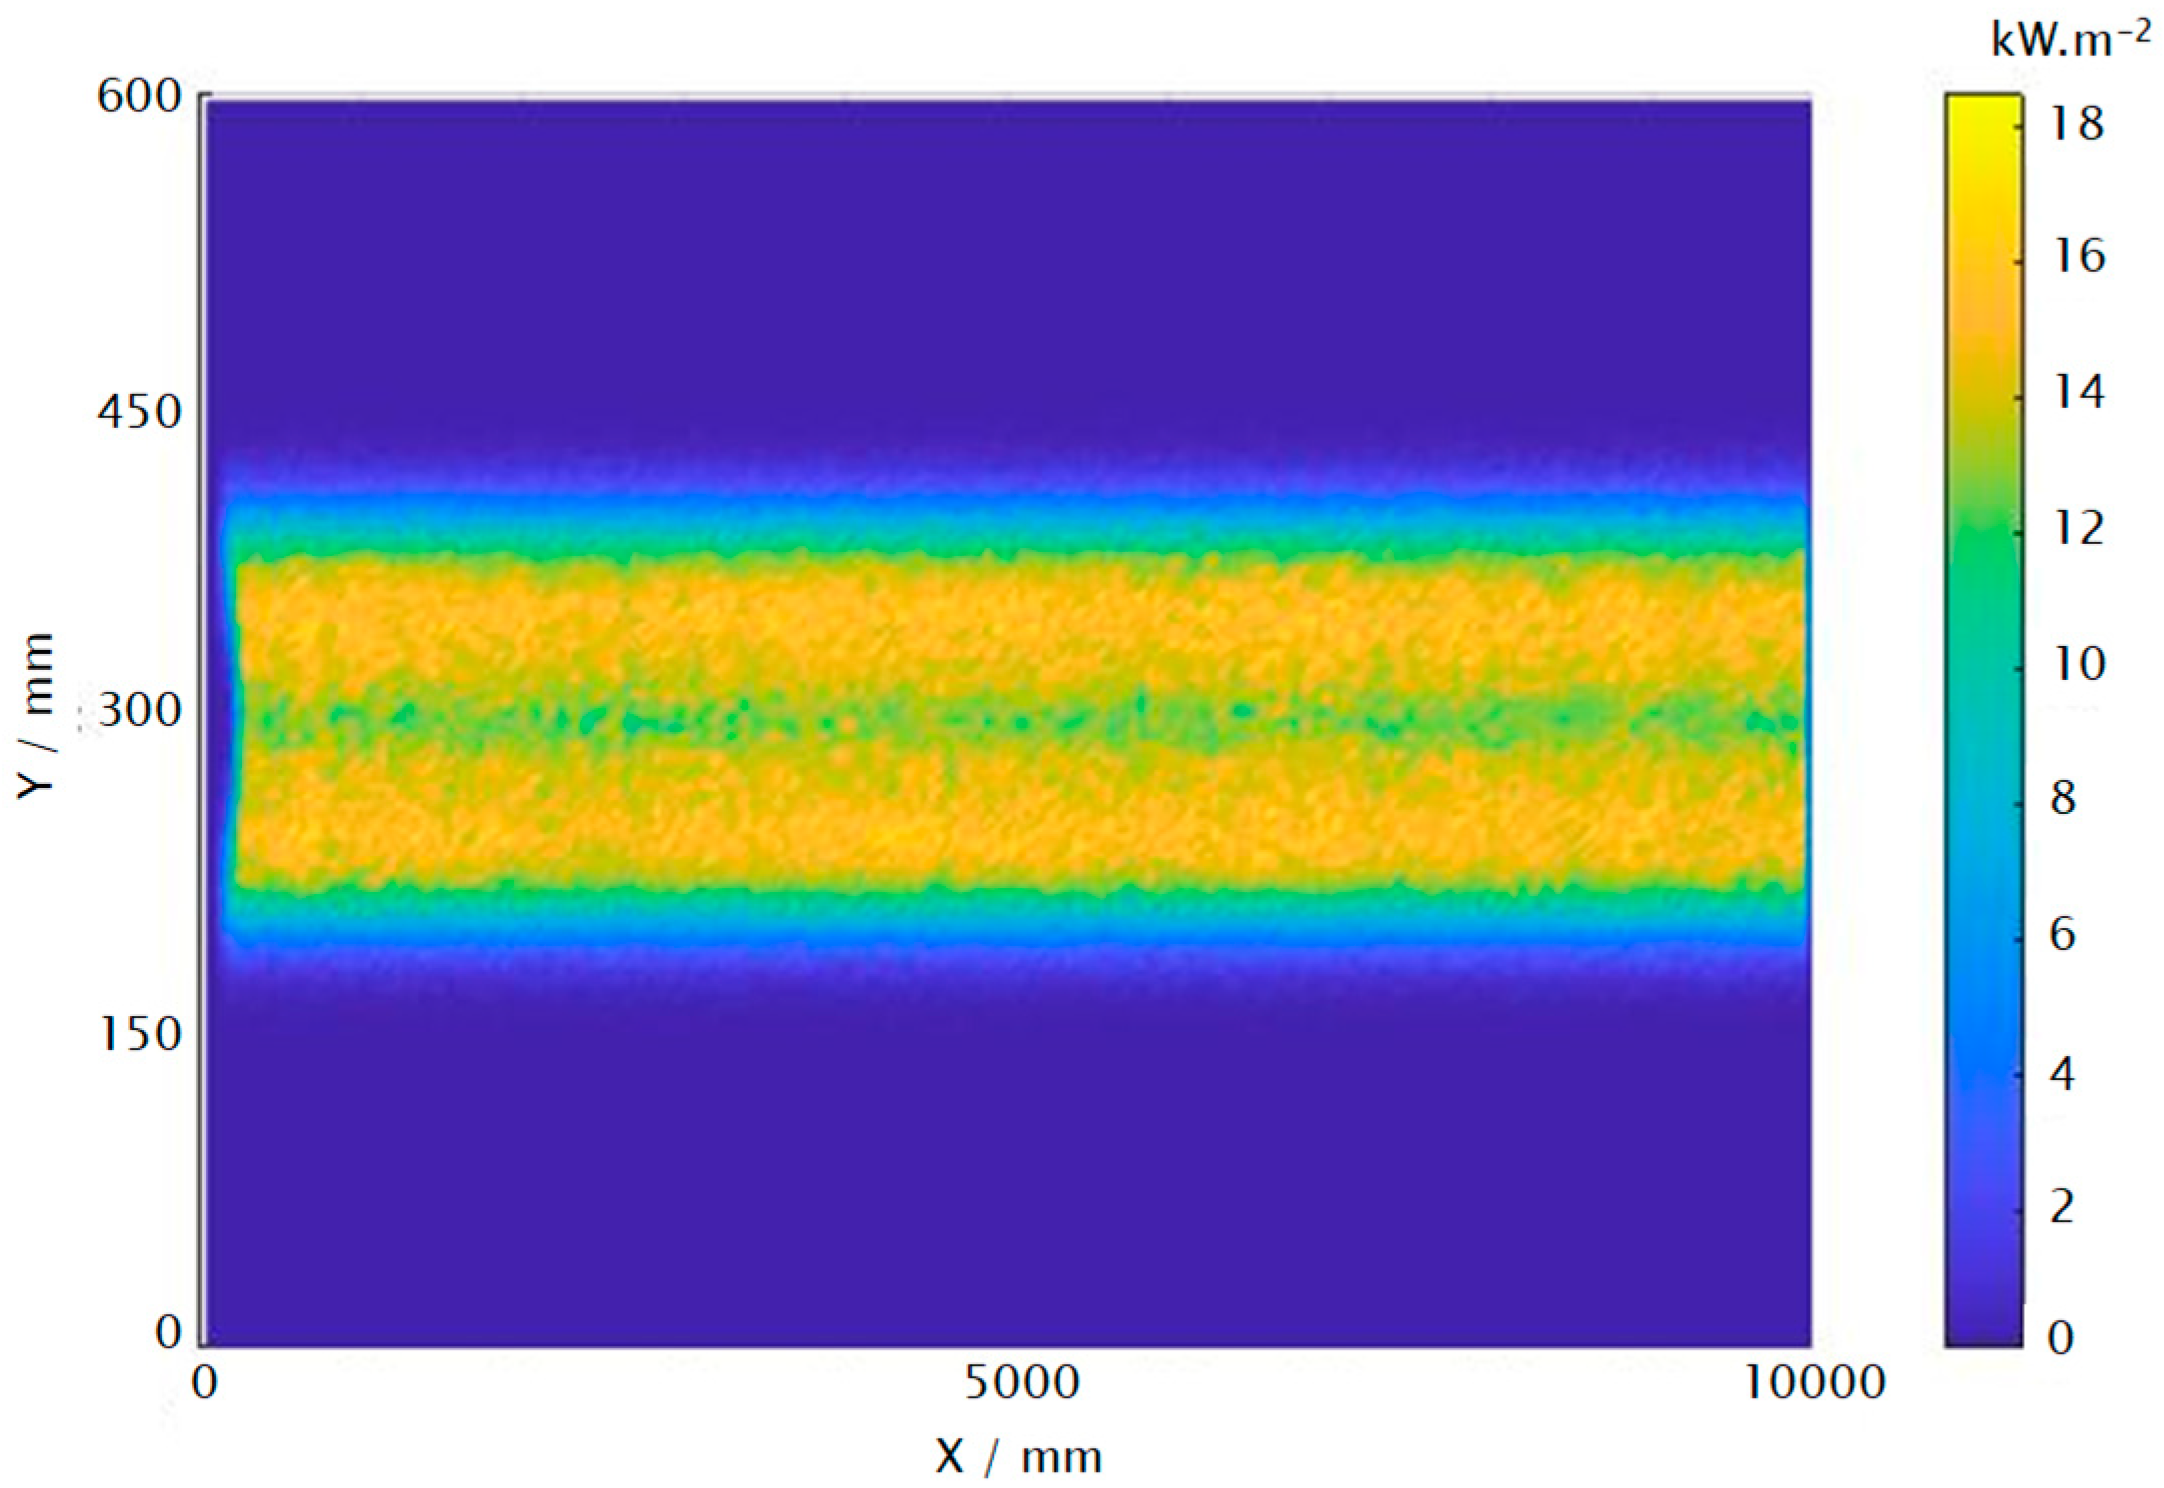
The flux measurement system needs to be calibrated both in the energy level range to be measured as well as spatially. The energy calibration consists of correlating the illumination levels of the Lambertian surface (also called gray levels, GL), which are measured with the CMOS camera in the vicinity of the radiometer position, with the concentrated solar radiation density measured by the radiometer itself. For this purpose, 10 images are used, each captured at the focal plane positions where the radiation is reflected by each of the 10 facets that make up each of the 12 rows of the primary concentrator (see Supplementary Material, Video S1).
Before calibrating the images, it is necessary to make a series of corrections to the images consisting, firstly, in subtracting from the images the thermal current noise of the CMOS sensor (determined by taking a photograph with the camera covered); and, secondly, in compensating for the inhomogeneities of the Lambertian surface, as well as the aberrations and defects that may be introduced by the camera optics and the response of the CMOS sensor. These corrections are summarized in the following equation, where I corr , I raw , and I ref are the intensity of the corrected, raw, and reference images taken without solar radiation concentrated on the Lambertian target; D is the intensity of the image for the removal of the thermal noise (Dark), and the operations are performed for all pixels i , j of the image.
I ij corr = I ij raw I ij ref D ij
Figure 6 left shows one of the images captured by the CMOS camera at one of the measurement positions and the calibration performed with the total of the 10 images taken on the surface of the Lambertian target.
The calibration curve (Figure 6 right), given the linear response of the CMOS camera and the optical properties of the Lambertian target, is a line with positive slope, which relates the incident power per unit area, P s , to the corresponding image grey level, GL (Equation (4)).
P s = 0.241 ± 0.012 · GL
The spatial calibration consists of determining the actual size that each pixel of the image subtends, taking as a reference the length of Lambertian surface (1200 mm). Since each of the 10 images was taken at a different amplification in order to maximize the area subtended by the pixels, minimizing the errors of the procedure, each of the 10 images has a different spatial calibration, but all of them are in the range of 0.24 × 0.24 mm2/pixel. The spatial calibration makes it possible to integrate the total power of the LFC for each of the 10 measurement positions, as well as to calculate the total power concentrated in the focal plane.

3. Results

The following are the results of a concentrated solar radiation measurement test carried out on the LFC prototype installed at the PSA.
Several tests were carried out on 18 and 24 May 2022 around solar noon to have results as comparable as possible among different tests, although in this type of experiment, it is unavoidable to have differences in the power output due to different values of DNI and θ i in each test. Tests are performed with the LFC primary concentrator tracking the Sun in automatic mode, with the reflector lines concentrating and reflecting solar radiation in the focal plane, and with both concentrator racks (see Figure 1) tilted at 0° to the horizontal plane of the concentrator, but which in turn is inclined 10° to the south.
Figure 7 shows, as an example, the distribution of concentrated solar radiation in the plane of the receiver, for two of the ten measurement positions, which correspond to positions #4 and #8 of the facets of each of the rows into which the LFC prototype is divided.
From the incident solar radiation distributions in the focal plane for each of the measurement positions, it is possible to determine the peak flux density (maximum of the concentrated solar radiation), the average flux density (integrated in the area of the Lambertian target where the illumination level is greater than zero), and the total incident power at each of the measurement positions by integrating for all pixels (considering the spatial calibration performed in the previous section). Table 2 shows the summary of these values for all measurement positions.
As can be seen from both Table 2 and Figure 7, despite the manual fabrication of the LFC prototype facets [12], a good homogeneity in the average concentration has been achieved for each of the 10 measurement positions.

4. Discussion

4.1. Flux Density, Power, and Optical Efficiency from Experiment

From results shown in Table 2, the average flux densities in the focal plane of the LFC prototype installed at PSA, are 10.4 ± 0.6, 9.7 ± 0.6, 9.8 ± 0.6 kW/m2 in the tests performed on 18 May, 24 May before solar noon, and 24 May after solar noon, respectively These values are the mean values of the ones recorded and calculated at the 10 measurement positions. The measurement procedure did not take more than 10 min, during which the direct solar radiation remained stable, with variations of less than 2% (see Figure 8). Considering the DNI values available during the tests, 831 ± 10 W/m2 and 870 ± 10 W/m2 (see Figure 8), the average concentration ratio (CR) of the LFC ranges between 12.4 ± 0.7 and 11.3 ± 0.7. There are differences among CR values calculated due to the difference time and consequently different incidence angle during the tests, which changes the optical performance.
The total power of the manufactured LFC prototype, P t , is calculated by summing up the individual powers of each of the measurement positions represented in Table 2, being P t = 24 ± 2 ,   22.8 ± 1.9 ,   23.9 ± 1.9 kW (see Figure 8). Although the total power was not determined at the same instant, but was obtained by adding the power values measured in the 10 positions, the total measurement procedure did not take more than 10 min, during which the DNI remained stable, with variations of less than 2%. Therefore, the efficiency of the LFC can be calculated as follows:
η opt = P t G b · S
where P t is the total power measured, G b is the average direct normal radiation during the test period to characterize the concentrator and S is the total collection surface (120 facets of dimensions 0.28 m × 1.00 m). The results obtained are optical efficiencies of the LFC concentrator equal to 0.86 ± 0.08 and 0.82 ± 0.07 for the tests performed on 18 May and 24 May, respectively.

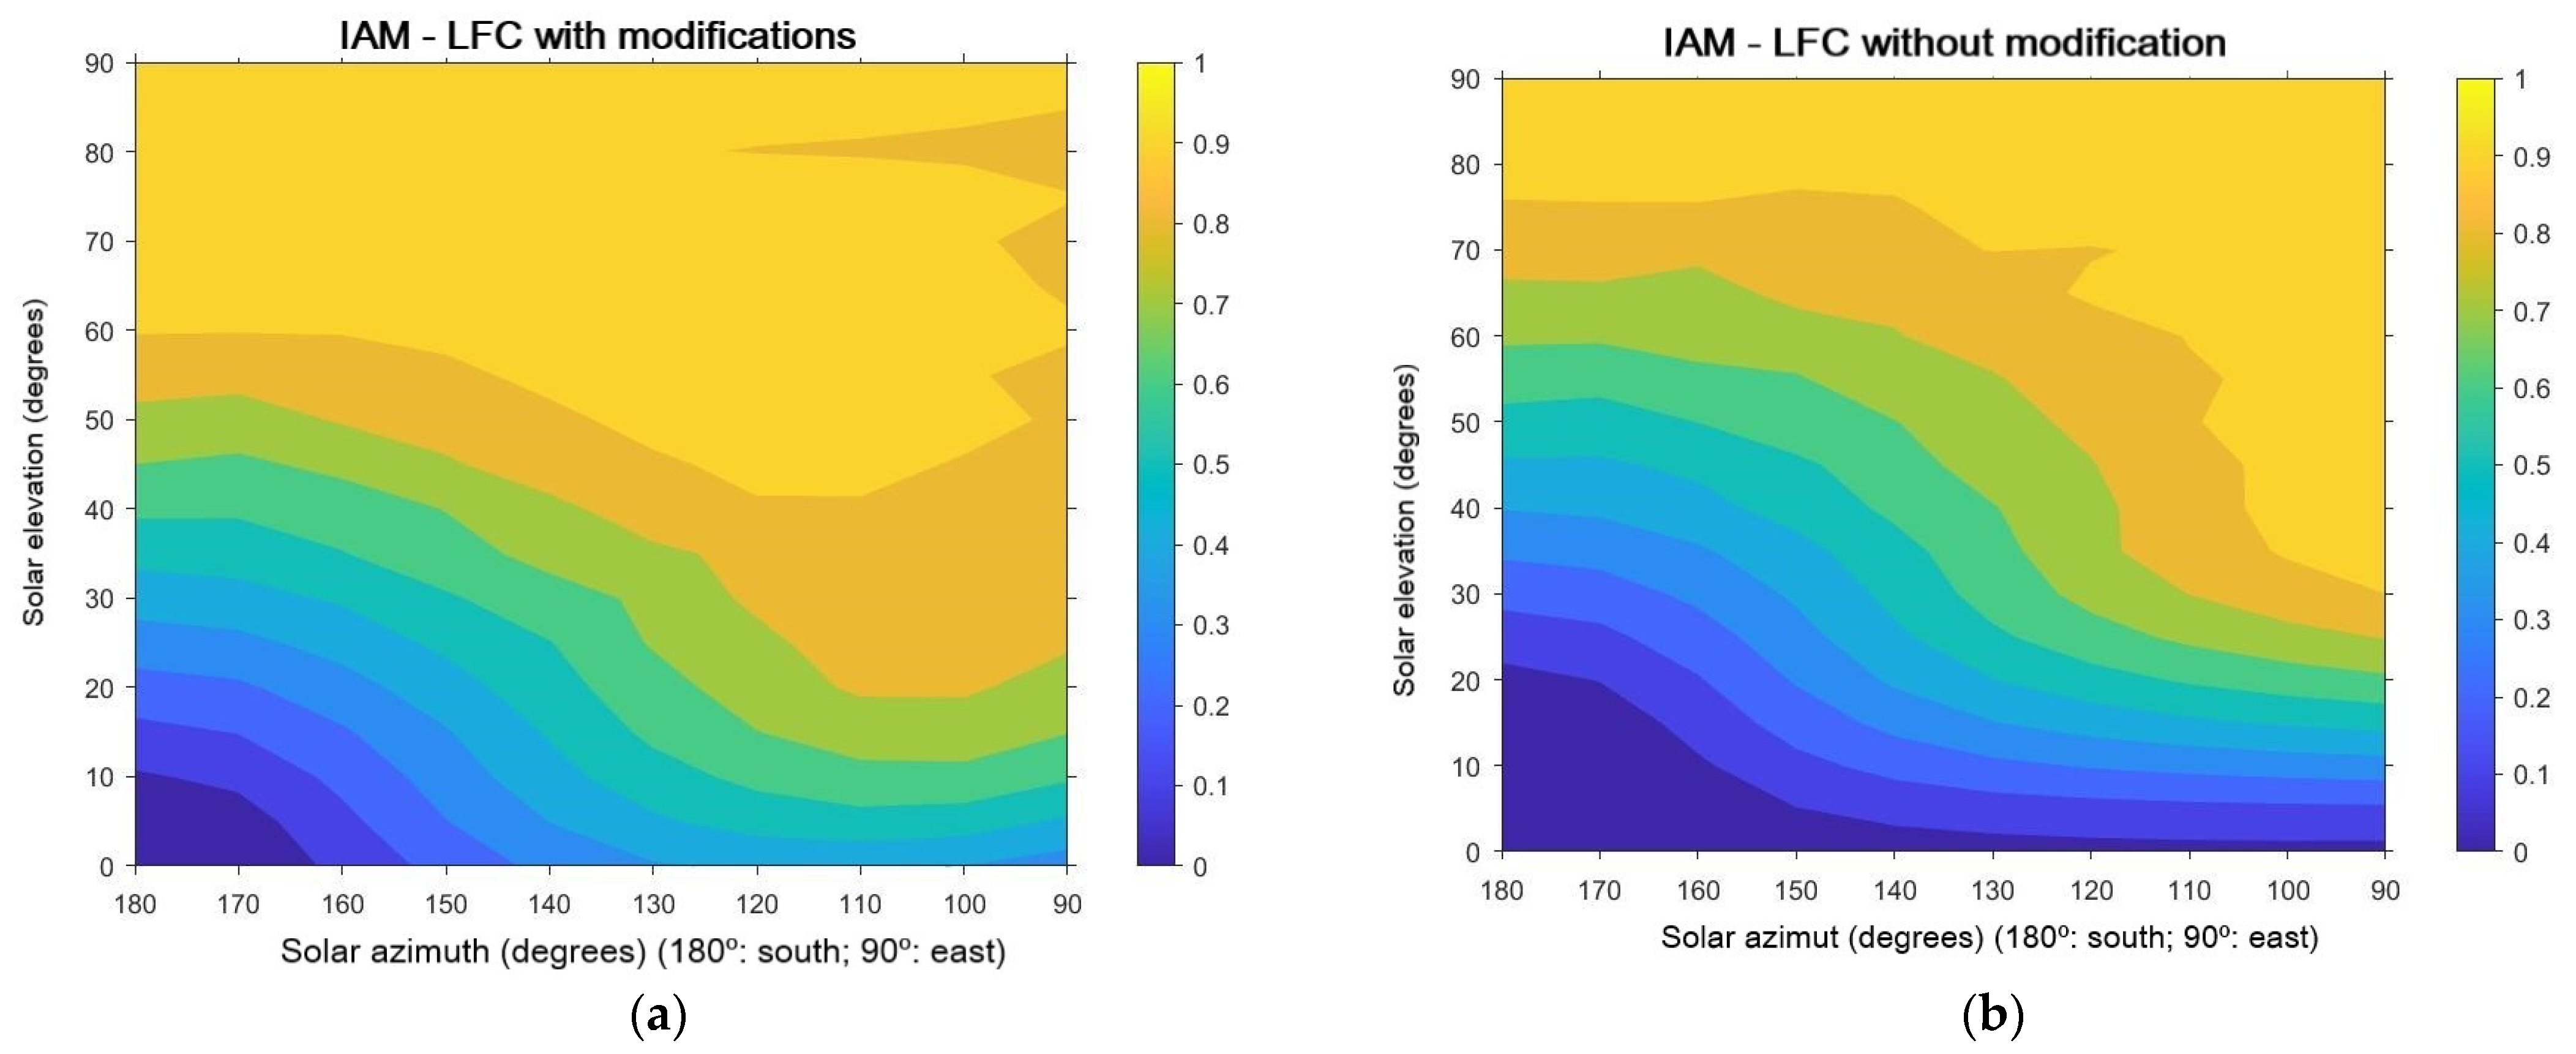
4.2. Comparison of Experimental to Simulation Results

This flux density, power, and efficiency values obtained from the experiment can be compared with simulation or calculated values.
The experimental values of average flux density can be compared to the ones obtained in simulation by ray tracing. The LFC system designed and constructed was already modelled in preliminary studies. A ray-tracing code developed in Matlab® software environment allows to analyze the optical performance of the LFC system. In the simulation, the inputs considered to perform the analysis are the DNI and solar time during the experiment, i.e., for the case of comparison to experimental data of 24 May, the DNI value considered is 870 W/m2 and solar time equal to solar noon. The outputs of the simulation are a flux density map along the whole length of the solar collector on a plane of the same size of the Lambertian target, which is placed at the defined height of 2.3 m (focal distance from the LFC axis). The output matrix that includes the flux density values in the whole surface of the plane considered allows the calculation of the average flux density values and total incident power on the receiver plane. Figure 9 shows the distribution of simulated flux density of concentrated solar radiation on the receiver plane aperture. The average flux from simulation is 9.43 kW/m2, which is a bit lower than the one obtained experimentally. If this value is multiplied by the illuminated area of the receiver surface (pixels where flux density is higher than 0), the total incident power obtained is 26.9 kW, which in this case is a bit higher than the one obtained from the experiments executed on 24 May; reasons that explain this difference are that in the simulation optical errors of the mirror facets and complete primary concentrator, neither in the tracking system, are considered at this stage; and the average flux simulated is more homogeneous and spatially distributed what also explains a lower value of flux density but a slightly higher calculated value of total power due to a higher surface irradiated.
Finally, if the optical efficiency of the primary concentrator of the LFC is calculated by multiplying the following measured or estimated optical parameters of its constituent’s elements:
  • mirror facet nominal reflectance, 0.95 [11];
  • mirror facet cleanliness factor, 0.95 (measured with a reflectometer);
  • intercept factor of the primary concentrator assembly, 0.95; this value takes into account the optical error of the facets, the facet edging error of the facets in the rows, and the error associated with the tracking system (estimated from [18,19,20]);
  • angle of incidence modifier calculated for the time at which the measurement was made, 0.99 [15];
The optical efficiency value obtained is 0.85, which is slightly higher than that obtained from the flux density measurement data taken on 24 May, but taking into account the uncertainty associated with the experimental value, it is agreed that both results are in agreement.

5. Conclusions

Fresnel-type linear concentrating solar collector technology is a very attractive option for the supply of thermal energy to processes that demand heat in the medium temperature range, from 100 °C to 250 °C. Its conceptual design allows the use of components for the solar radiation reflection system and the receiver at a lower cost than other technological options for concentrating solar systems, such as parabolic trough collectors.
A LFC was designed, built, and installed at the Plataforma Solar de Almería and is currently in the evaluation phase. The prototype has a primary concentrator consisting of 12 lines of reflectors, each 10 m long and 0.28 m wide. Each line of reflectors is equipped with a drive motor for solar tracking. For the analysis of the optical behavior of the primary concentrator, a device was implemented to measure the flux density of concentrated solar radiation based on an indirect measurement, based on taking images of a Lambertian target where a radiometer is also installed. The role of the radiometer is to provide a reference signal of radiation flux for the subsequent calibration and evaluation of the images of the brightness on the target.
An experimental campaign was carried out to test the flux density values of concentrated solar radiation reached at the focal plane of the LFC. The maximum recorded flux value is 49 ± 3 kW/m2 for a DNI value equals to 831 ± 10 W/m2, close to the solar noon. The average recorded flux density values range between 9.7 ± 0.6 kW/m2 and 10.4 ± 0.6 kW/m2 in the tests performed, with DNI values higher than 800 W/m2, and the incident power calculated from the experimental data analyzed is up to 24 ± 2 kW. These values are consistent with simulations performed by ray-tracing of the LFC built.

6. Patents

In 2018, a PCT with reference PCT/ES2018/070059 on the LFC design investigated in this article was submitted. In 2022, the patent for the LFC was granted in Spain, with reference ES 2 782 149 B2, and in Chile, with reference No. So. PCT/2020-001904.

Supplementary Materials

The following supporting information can be downloaded at: https://www.mdpi.com/article/10.3390/solar2040024/s1, Video S1: View of the LFC and concentrated solar radiation on the Lambertian target during experiments.

Author Contributions

Conceptualization, J.F.-R. and L.V.; methodology, J.F.-R., L.V. and D.P.-I.; software, J.F.-R. and D.P.-I.; validation, L.V.; formal analysis, J.F.-R. and L.V.; investigation, J.F.-R., L.V. and D.P.-I.; resources, L.V.; data curation, J.F.-R. and L.V.; writing—original draft preparation, L.V.; writing—review and editing, J.F.-R. and L.V.; visualization, L.V.; supervision, L.V.; project administration, L.V.; funding acquisition, L.V. All authors have read and agreed to the published version of the manuscript.

Funding

This research was funded by Ministerio de Ciencia, Innovación y Universidades from the Spanish government, grant number ENE2017-83973-R (project SOLTERMIN).

Data Availability Statement

Not applicable.

Acknowledgments

The authors would like to thank the CIEMAT staff and the operation, maintenance and instrumentation teams of the PSA for their contribution to the project; in particular, Jesús Ballestrín for his collaboration with the instrumentation of the flux measurement device, Ginés García for his collaboration with the commissioning of the solar tracking system, and María Gutiérrez, Jose Galindo, Guillermo Alonso, Blas Díaz, and other colleagues for their contribution to the construction and commissioning of the LFC.

Conflicts of Interest

The authors declare no conflict of interest.

Abbreviations

CMOScomplementary metal-oxide semiconductor
DNdiameter nominal
DNIdirect normal irradiance (W/m2)
IAMincidence angle modifier
ISOInternational Standards Organization
LFClinear Fresnel collector
PSAPlataforma Solar de Almería
UTuniversal time

References

  1. Platzer, W.J.; Mills, D.; Gardner, W. Linear Fresnel collector (LFC) solar thermal technology. In Concentrating Solar Power Technology, 1st ed.; Lovegrove, K., Stein, W., Eds.; Woodhead Publishing: Cambridge, UK, 2021; Chapter 6; pp. 165–217. [Google Scholar] [CrossRef]
  2. Pulido-Iparraguirre, D.; Valenzuela, L.; Serrano-Aguilera, J.J. Optimized design of a Linear Fresnel reflector for solar process heat applications. Renew. Energy 2019, 131, 1089–1106. [Google Scholar] [CrossRef]
  3. Zhu, J.; Chen, Z. Optical design of compact linear fresnel reflector systems. Sol. Energy Mater. Sol. Cells 2018, 176, 239–250. [Google Scholar] [CrossRef]
  4. Hongn, M.; Flores Larsen, S. Hydrothermal model for small-scale linear Fresnel absorbers with non-uniform stepwise solar distribution. Appl. Energy 2018, 223, 329–346. [Google Scholar] [CrossRef]
  5. Yang, M.; Zhu, Y.; Taylor, R.A. End losses minimization of linear Fresnel reflectors with a simple, two-axis mechanical tracking system. Energy Convers. Manag. 2018, 161, 284–293. [Google Scholar] [CrossRef]
  6. Ma, J.; Chang, Z. Understanding the effects of end-loss on linear Fresnel collectors. IOP Conf. Ser. Earth Environ. Sci. 2018, 121, 052052. [Google Scholar] [CrossRef]
  7. Manikumar, R.; Valan Arasu, A. Heat loss characteristics study of a trapezoidal cavity absorber with and without plate for a linear Fresnel reflector solar concentrator system. Renew. Energy 2014, 63, 98–108. [Google Scholar] [CrossRef]
  8. Zhu, Y.; Shi, J.; Li, Y.; Wang, L.; Huang, Q.; Xu, G. Design and experimental investigation of a stretched parabolic linear Fresnel reflector collecting system. Energy Convers. Manag. 2016, 126, 89–98. [Google Scholar] [CrossRef]
  9. Zhu, J.; Huang, H. Design and thermal performances of Semi-Parabolic Linear Fresnel Reflector solar concentration collector. Energy Convers. Manag. 2014, 77, 733–737. [Google Scholar] [CrossRef]
  10. Zhao, X.; Yan, S.; Zhang, N.; Zhao, N.; Gao, H. Solar flux measuring and optical efficiency forecasting of the linear Fresnel reflector concentrator after dust accumulation. J. Therm. Sci. 2022, 31, 663–677. [Google Scholar] [CrossRef]
  11. AGC Solar Mirror Thin, Datasheet. Available online: https://www.agc-solar.com/product-solutions/ (accessed on 25 May 2021).
  12. Pulido-Iparraguirre, D.; Valenzuela, L.; Fernández-Reche, J.; Galindo, J.; Rodríguez, J. Design, Manufacturing and Characterization of Linear Fresnel Reflector’s Facets. Energies 2019, 12, 2795. [Google Scholar] [CrossRef]
  13. Abbas, R.; Muñoz-Antón, J.; Valdés, M.; Martínez-Val, J.M. High concentration linear Fresnel reflectors. Energy Convers. Manag. 2013, 72, 60–68. [Google Scholar] [CrossRef]
  14. Blanco, M.J.; Amieva, J.M.; Mancillas, A. The Tonatiuh Software Development Project: An open source approach to the simulation of solar concentrating systems. In ASME 2005 International Mechanical Engineering Congress and Exposition (IMECE); American Society of Mechanical Engineers: Orlando, FL, USA, 2005; pp. 157–164. [Google Scholar] [CrossRef]
  15. Valenzuela, L.; Pulido-Iparraguirre, D.; Fernández-Reche, J. Mejora de la eficiencia óptica de un captador linear Fresnel innovador. In Proceedings of the XVIII Congreso Ibérico y XIV Congreso Iberoamericano de Energía Solar, Palma, Spain, 20–22 June 2022. [Google Scholar]
  16. Lüpfert, E.; Heller, P.; Ulmer, S.; Monterreal, R.; Fernández-Reche, J. Concentrated solar radiation measurement with video image processing and online fluxgage calibration. In Proceedings of the Solar Thermal 2000 International Conference, Sydney, Australia, 8–10 March 2000. [Google Scholar]
  17. Ballestrin, J.; Ulmer, S.; Morales, A.; Barnes, A.; Langley, L.W.; Rodríguez, M. Systematic error in the measurement of very high solar irradiance. Sol. Energy Mater. Sol. Cells 2003, 80, 375–381. [Google Scholar] [CrossRef]
  18. Pulido-Iparraguirre, D. Desarrollo de un Prototipo de Captador Solar Fresnel Lineal de Media Temperatura. Ph.D. Thesis, Universidad de Almería, Almería, Spain, February 2020. [Google Scholar]
  19. Chekh, B.A.; Fernández-Reche, J.; Valenzuela, L.; Pulido-Iparraguirre, D.; Villasante, C. Compact system for fast on-line geometry characterization of facets for solar concentrators. SolarPACES 2020. AIP Conf. Proc. 2022, 2445, 070001. [Google Scholar] [CrossRef]
  20. García, G.; Egea, A.; Valenzuela, L.; Pulido-Iparraguirre, D.; Liria, J. Advanced sun-tracking control of an innovative linear Fresnel collector. In Proceedings of the 27th SolarPACES Conference, Online Event, 27 September–1 October 2021. [Google Scholar]
Figure 1. Design scheme of the innovative linear Fresnel collector developed.
Solar 02 00024 g001
Figure 2. View of the prototype of LFC installed at the Plataforma Solar de Almería (Spain) during one of the tests to measure the flux of concentrated solar radiation in the focal plane.
Solar 02 00024 g002
Figure 3. Maps of IAM versus solar elevation and azimuth angles of: (a) LFC incorporating as geometrical modifications a 10° southward tilt of concentrator/receiver and 0.5 m offset of the receiver to the north; and (b) a LFC of the same size but without the geometrical modifications described for case (a).
Solar 02 00024 g003
Figure 4. Details of the experimental device for measuring the concentrated solar radiation flux at the LFC: (a) 1 Radiometer, 2 data logger, 3 inlet and outlet pipe lines of the cooling system; (b) detailed view of the radiometer used.
Solar 02 00024 g004
Figure 5. Schemes of the concentrated solar flux measurement system installed in the LFC structure.
Solar 02 00024 g005
Figure 6. Image captured by the CMOS camera with the flux measurement device (left), and energy calibration of the flux measurement device (right).
Solar 02 00024 g006
Figure 7. Maps of concentrated solar radiation distribution measured on the Lambertian target for positions #4 (top) and #8 (bottom) of the facets located on each of the reflector lines that make up the primary concentrator during one of the tests performed on 24 May, after solar noon.
Solar 02 00024 g007
Figure 8. Direct normal irradiance (red), average flux densities (blue), and total power (green) measured in tests performed with the LFC prototype on May 2022.
Solar 02 00024 g008
Figure 9. Map of concentrated solar radiation distribution simulated on the receiver plane of the LFC considering DNI = 870 W/m2 and solar time corresponds to solar noon of 24 May 2022.
Solar 02 00024 g009
Table 1. Instrumentation of the device for measuring concentrated solar radiation flux in the LFC.
EquipmentCharacteristics
Image acquisitionCANON EOS 5d MarkII Camera
Lens focal length: 80 mm
Aperture: f/22
Exposure time: 1/1250 s
ISO: 6400
Filter: neutral optical density 2.0 (log Ii/It = 2)
RadiometerVatell water cooled heat flux sensor
Coating: zynolite
Calibration constant: 5.32 kW·m−2·mV−2 (±3%)
PyrheliometerKipp & Zonen CH1
Installed on a robotic solar tracker
Uncertainty < 1%
Data acquisitionMidi LOGGER GL200. Graphtec Corp.
Table 2. Average and maximum concentrated solar radiation density and power measured for each of the measurement positions in the focal plane of the LFC during the experiments (18 May @DNI = 831 ± 10 W/m2 and 24 May @DNI = 870 ± 10 W/m2).
PositionAverage Flux Density (kW/m2)Maximum Flux Density (kW/m2)Total Incident Power (kW)
18 May24 May
Bef. Noon
24 May
Aft. Noon
18 May24 May
Bef. Noon
24 May
Aft. Noon
18 May24 May
Bef. Noon
24 May
Aft. Noon
#110.2 ± 0.69.5 ± 0.69.7 ± 0.538 ± 236 ± 236.3 ± 1.81.96 ± 0.131.83 ± 0.111.86 ± 0.12
#210.6 ± 0.69.9 ± 0.610.0 ± 0.531.4 ± 1.929.3 ± 1.829.9 ± 1.52.51 ± 0.172.35 ± 0.142.39 ± 0.16
#310.5 ± 0.69.8 ± 0.69.9 ± 0.535 ± 233 ± 233.5 ± 1.72.95 ± 0.202.75 ± 0.162.80 ± 0.18
#410.8 ± 0.610.1 ± 0.610.3 ± 0.542 ± 339 ± 240 ± 22.10 ± 0.141.96 ± 0.121.99 ± 0.13
#510.9 ± 0.610.1 ± 0.610.3 ± 0.542 ± 339 ± 240 ± 22.53 ± 0.172.36 ± 0.142.40 ± 0.16
#69.2 ± 0.68.6 ± 0.58.8 ± 0.538 ± 236 ± 236.3 ± 1.82.74 ± 0.182.56 ± 0.152.61 ± 0.17
#710.1 ± 0.69.5 ± 0.69.6 ± 0.549 ± 345 ± 346 ± 22.12 ± 0.141.98 ± 0.122.02 ± 0.13
#810.4 ± 0.69.7 ± 0.69.9 ± 0.543 ± 340 ± 241 ± 22.28 ± 0.152.13 ± 0.132.17 ± 0.14
#910.7 ± 0.610.0 ± 0.610.2 ± 0.541 ± 238 ± 238.5 ± 1.92.53 ± 0.172.36 ± 0.142.41 ± 0.16
#1010.2 ± 0.69.5 ± 0.69.7 ± 0.541 ± 238 ± 238.8 ± 1.92.68 ± 0.182.50 ± 0.152.55 ± 0.17
Publisher’s Note: MDPI stays neutral with regard to jurisdictional claims in published maps and institutional affiliations.

