Article

Interaction of a House’s Rooftop PV System with an Electric Vehicle’s Battery Storage and Air Source Heat Pump

by
George Stamatellos
,
Olympia Zogou
and
Anastassios Stamatelos
*
Department of Mechanical Engineering, University of Thessaly, 383 34 Volos, Greece
*
Author to whom correspondence should be addressed.
Solar 2022, 2(2), 186-214; https://doi.org/10.3390/solar2020011
Submission received: 29 January 2022 / Revised: 14 March 2022 / Accepted: 6 April 2022 / Published: 8 April 2022
(This article belongs to the Topic Solar Thermal Energy and Photovoltaic Systems)

Abstract

:
Understanding the implications of introducing increasing shares of low-carbon technologies such as heat pumps and electric vehicles on the electricity network demand patterns is essential in today’s fast changing energy mixture. Application of heat pumps for heating and cooling, combined with the rooftop installation of photovoltaic panels, is already considered as a convenient retrofitting strategy towards building electrification. This may further profit from the parallel, rapid electrification of the automotive powertrain, as demonstrated in the present study. Exploitation of the combined battery storage of the house owners’ electric car(s) may help cover, to a significant degree, the building’s and cars’ electricity needs. To this end, an efficient single family house’s energy system with an optimized rooftop PV installation, heat pump heating and cooling, and two high efficiency electric cars is studied by transient simulation. The use of TRNSYS simulation environment makes clear the interaction of the house’s heating, ventilation, and air conditioning (HVAC) system, the house’s and cars’ batteries, and the rooftop PV system in transient operation. The building’s and EV’s energy performance on a daily, monthly, and seasonal level is compared with the respective demand curves and energy sources of the Greek electricity network. The specific design of the house’s energy system makes it a net exporter of electricity to the grid, to an annual amount of 5000 kWh. On the other hand, electricity imports are slightly exceeding 400 kWh and limited to the first two months of the year. In addition to the self-sufficiency of the household, the impact to the electricity grid becomes favorable due to the phase shift of the electricity export towards the late afternoon hours, thus assisting the evening ramp-up and adding to the grid’s stability and resilience. Based on the results of this study, the possibility of combining the financial incentives for the purchase of an EV with those for the installation of rooftop PV in the owners’ house is very promising and worth considering, due to the demonstrated synergy of electrical storage with the rooftop photovoltaic installations.

Graphical Abstract

1. Introduction

Car buyers are selecting electric vehicles (EVs) in increasing numbers, attracted by the excellent drivability of EVs and the drop in prices that follows the significant battery cost reduction. The 6 million new electric cars that entered the fleet in 2021 correspond to about 8% of total car registrations [1]. That figure is expected to rise steeply in the near future. For example, the US Environmental Protection Agency projects that as the greenhouse gas standards get stronger over four years, sales of EVs and plug-in hybrid vehicles will grow from about 7% market share in Model Year 2023 to about 17% in Model Year 2026 [2]. In the European Union, the New European Green Deal projects that, to achieve climate neutrality, a 90% reduction in transport emissions will be needed by 2050, where road, rail, aviation, and waterborne transport will all have to contribute to the reduction [3]. This leads to further strengthening of the CO2 emission performance standards for new passenger cars and light commercial vehicles, which would require a 35% share of the European fleet of new passenger cars to be zero-emission by 2030 [4]. The rapid penetration of EVs is necessary because transport accounts for 25% of the worldwide CO2 emissions [5], out of which road vehicles are responsible for 75% [6]. Achieving net zero carbon emissions by 2050, is only possible through the rapid shift to electric cars (with the electricity produced from low-carbon sources). This electrification of transport is carried out in parallel with an on-going electrification of residential heating that traditionally required the burning of fossil fuels. The prevailing problem associated with the rapid expansion of EVs is their charging, since there is a need to plug in and recharge electric cars roughly every 150–300 km. Charging requires a certain amount of time, and if one refers to a public charging point, it is not easily accessible today, with an additional possibility to be faulty [7]. A survey of chargers in China by Volkswagen AG found many inoperable or “ICEd” chargers (those blocked inadvertently or deliberately by fossil-fueled cars) [8]. Only 30–40% of China’s 1 million public points were available at any time. These facts explain the main reason of today’s drivers’ hesitation to buying an EV, which is reported as “range anxiety” [9]. With the rapidly increasing numbers of EVs, the charging problem is pressing because an increasing number of drivers do not have a drive in front of their house or a private space in their work’s car parking [9]. Currently, the world has just 1.5 million public charging points, whereas meeting net zero emissions goals by 2050 will require 200 million chargers. For this reason, Britain and other countries are planning to require new buildings to install chargers [10]. Thus, subsidizing EV sales is now combined with subsidizing private companies willing to develop and operate networks of public chargers. Studies indicate that in the long term, the public chargers will account for 60% of the total during the next decade [11]. The future EV charging infrastructure will be composed of a mixture of fast “long distance” chargers installed near motorways and slower “top-up” chargers available at houses, curb sides, or in the car parks of shopping centers [12]. Thus, grid-efficient charging is an important strategy for the integration of increasing numbers of electric cars into the electricity grid. A legal framework is currently being discussed that could in future oblige e-vehicle drivers to pay a surcharge for the ability to charge their vehicles unconditionally [13]. This situation has significantly increased the integration of photovoltaic (PV) systems and electric vehicles (EVs) in the urban environment, posing new power system challenges, such as increased peak loads and component overloading. For a typical residential feeder circuit of 150 houses at 25% local electric car penetration, a study by McKinsey [14] predicted that the local peak load would increase by approximately 30% and that the evening ramp becomes steeper. This peak growth in residential areas is not very high because of the relaxing effect of the aggregation across several households. Additionally, the introduction of delayed or smart charging further alleviates these effects. Thus, improved matching between PV generation and EV load through both optimal sizing and operation of PV-EV systems can minimize these challenges. Fachrizal et al. [15] studied an optimal PV-EV sizing framework for workplace solar-powered charging stations considering load matching performances, by employing a novel performance metric based on self-consumption (SC) and self-sufficiency (SS). Osório et al. [7] presented a survey of the state-of-the-art concepts of photovoltaic (PV) panels, EVs, and batteries and how the different associated technologies can be applied in the concept of solar (rooftop PV) parking lots. Bhatti et al. [16] summarized and updated some important aspects of the PV-EV charging in a review paper. Alkawsi et al. [17] reviewed studies related to the renewable energy charging infrastructure. An integration of the rooftop PV renewable energy sources with the enhanced power quality onboard EV charging system increases the reliability of the overall charging process and also reduces the burden on the grid, thus optimizing the energy cost per km. Gupta et al. [18] presented a single-phase single-stage charging system assisted with rooftop solar photovoltaic (PV) for the e-rickshaw small cab.
Martin et al. [19] presented an empirical analysis based on a 10-month data set of the charging and mobility behavior of 78 EV users in Switzerland, combined with a digital surface model for extracting the detailed roof geometry and the rooftop PV generation capacity of each of the EV owners’ houses. They tested four different smart charging strategies and found that with a simple controlled charging approach, the average coverage was between 56% and 90%, without affecting the individual mobility behavior of the EV owners. The increasing electrification of buildings’ HVAC by means of heat pumps already affects and reshapes the electricity demand curve and especially the ramp rate that needs to be supported by an increased capacity of flexible power plants during winter and summer months. The ramp rate becomes steeper during the evening hours of these months, when people return from work [20]. Severe episodes of summer heat waves that become more frequent from climate change due to global warming are another source of rapid demand increases during evening hours. Under these circumstances, the added effect of EV charging in the electricity demand patterns is closely monitored. At high penetrations of electric cars, a significant impact on the aggregate electricity demand and the shape of the daily demand curve is expected. Smart management of electricity use could mitigate excessive peaks or spikes in demand by shifting consumption to other times of the day. Now, although the energy performance of electric cars tends to stabilize to efficiency of the order of 0.1–0.2 kWh/km [21], the energy performance of buildings is continuously improving, leaving room for more EV charging at the single-family house level. Near-zero energy buildings (NZEB) are demonstrating an ultra-low energy consumption. Moreover, this is mainly addressed by the use of renewables. The European Commission routinely monitors NZEBs in Europe, and a requirement for all new buildings to be NZEB is legislated [22]. The steady increase in photovoltaics in these buildings will allow the implementation of semiautonomous micro-grids. These micro-grids would additionally exploit battery storage and other forms of renewables [23,24,25,26]. Whenever the main grid falls short, microgrids provide more resilient power. These self-sufficient energy hubs can run independently or connect to the grid according to the needs. Microgrid design is a vibrant research sector, involving complex tradeoffs between risk tolerance and capital investment payback period. However, careful design is important even at the lowest level, which is the single-family house. Here, the electrification of space heating and cooling maybe supported by rooftop PV electricity production. This is already legislated in California for new buildings since 2019 [27]. Several studies focus on the incorporation of energy efficient buildings with rooftop PV in residential low voltage distribution grids [28].
Experiments and computations have been conducted with rooftop PV systems supported by electric battery storage. Bagalini et al. [29] studied a 3 kWp grid-connected PV system with 14.4 kWh usable battery storage installed in a residential apartment. System modeling in a TRNSYS environment was combined with economic analysis to find an optimum battery size of the order of 2 kWh/kWp of PV installation. The battery sizing is mainly governed by the high price of the battery, whereas the PV sizing is governed by the reduced electricity needs of the near-zero energy building concept. However, the emerging situation with the increasing numbers of electric vehicles in modern households sets a new challenging landscape: A high performance useable battery capacity becomes available that may support a significantly increased PV installation size to partially cover charging of the homeowners’ EVs. Matching the electricity consumption and production profiles should be sought in order to ameliorate the grid’s performance. The high burden on the electricity network caused by the EV charging can be relieved by financial incentives that maximize rooftop PV installation capacity in this direction. Sorensen et al. [30] proposed a methodology to describe charging habits, electricity load profiles, and flexibility potentials of EV charging in apartment buildings with multiple EV charge points, employing input field data from 6878 charging sessions registered by 97 users. Doroudchi et al. [31] presented a concept with an intelligent energy management system for a single-family house, considering electric vehicle (EV) as an active component of the building’s energy system, including bidirectional energy exchange with the house and the grid. In the above-mentioned studies, due to assumed average profiles plug-in and plug-out times of the vehicles, the EV charging times are focused during the night hours (2 a.m. to 6 a.m.). Of course, no PV energy is produced in this period. In the present study, we examine the case with the homeowner family owning two EVs instead of one. In this case, due to the changing workplace habits with work from home, one of vehicles is expected to frequently remain plugged-in during the day. This would make available the battery for charging by electricity surplus produced by the rooftop PV during sunny days. Of course, two electric cars per household are very rare today; however, the vehicle electrification pace set by European and US legislation is very fast as we approach 2030 [32,33]. An equivalent assumption would be that a battery of equal size be included in the house’s energy system. In this context, it is useful to assess the optimal installed rooftop PV size that would refrain the electricity network from using a significant percentage of the energy needs of the owners’ electric cars.

2. Materials and Methods

This study employs a systems model to investigate the interaction of a large rooftop PV system with battery storage and battery charging from the two owners’ electric cars and heat pump affects the building’s and EVs’ autonomy in everyday operation. The transient simulation of the building energy system assists the understanding of the building’s interaction with the electricity system load curves. Simulations of the “typical day operation” type have been profitably combined with detailed consideration of the HVAC controls [34,35]. This type of simulation enables an accurate prediction of the house’s energy consumption on an hourly basis [36,37]. Equipment size, prevailing weather conditions, and operating schedules are conveniently modeled in the TRNSYS environment [38]. This program’s modular structure enables the transient modeling of complex energy systems by breaking them down into smaller components [38], configured and assembled via a visual interface. The simulation engine solves the resulting system of equations. The TRNSYS library includes numerous utility components, which include weather data and various types of forcing functions. TRNSYS is one of the simulation programs listed in the European Standards on solar thermal systems (ENV-12977-2). Type 56, which models a multi-zone building, by use of the conduction transfer function (CTF) method, is compliant with ANSI/ASHRAE Standard 140-2001 [39]. The program is extensively deployed in energy system simulations [40,41,42,43]. The performance of this software against measurements and results of other standard simulation tools has been amply demonstrated [44,45,46].

2.1. Building Simulation Details

The reference house selected for this study (Figure 1) is a two story, single family house with a basement. The total floor area is 257.83 m2, out of which the conditioned zones are 141.81 m2. The level roof has 2 m overhangs in the northern and southern directions. The south facing rooftop PV installation has a 20° tilt angle.
A plan view of the 35 rooftop PV panels is seen in Figure 1, where minimal shading effects are achieved. Climatic data are inserted in the form of a typical meteorological year (TMY), which comprises hourly input data of ambient temperature (DB), relative humidity, wind direction and wind speed, and total/direct solar horizontal radiation for the city of Volos.

2.2. HVAC System Modeling Details

A 10 kW capacity air-to-water heat pump is employed (SEER = 20, HSPF = 11). The nominal heating capacity of 10 kW is produced at 7 °C (DB) ambient temperature. The nominal cooling of 10 kW is attained at 35 °C DB [47]. The hydronic distribution network comprises a fan coil unit for each conditioned room. Efficient lighting by means of LED lamps and (A+) electrical appliances are included. The HVAC control assumes a free-floating fan coil; that is, the fan coil’s air output temperature is not fixed but allowed to vary a little above or below the set point, according to the energy balance of the coil at each time step. The air source heat pump is modeled by a modified version of Type 668 [48]. Domestic hot water is produced by a solar thermal collector, as required by Greek legislation. The solar thermal collector and tank are installed on an overhang above the third parking lot, as shown in Figure 1. The heat pump characteristics are presented in Table A2.

2.3. Electric Car Consumption and Performance Data, Batteries Simulation Details

The real energy consumption of the EVs lies between 130 and 260 Wh/km, depending on the average velocity and ambient temperature. City driving at warm temperatures gives the lowest electricity consumption. As regards the Li-ion battery performance and the accurate estimation of the state of charge, capacity, and power fade analysis, research is on-going, and the various modeling approaches are described in [49,50]. In the present study, a generic battery model relating battery voltage, current, and state of charge from the TRNSYS library is employed, based on Hyman (modified Shepherd) equations [51]. In the specific mode employed, the power is given as input.
The most significant part of the battery charging task is prescribed to be covered by the house chargers: This is assumed to correspond, for each car, to a daily trip of city driving to workplace (2 × 10 km = 20 km for 200 days, amounting to 4000 km), with average electricity consumption of 150 Wh/km and a weekend excursion (highway driving, 2 × 100 km = 200 km for 25 days, amounting to 5000 km) with average electricity consumption 240 Wh/km. The total requirements for the two cars amount to 3600 kWh, or about 300 kWh/month. The house is equipped with two level 2, 3.7 kW, 1-phase home chargers (220 V/16 A), each of which can fully charge an EV’s 82 kWh battery in 22 h [52].
The low limit of battery fractional state of charge is set to 0.2 in the control unit of the inverter, which regulates the output from the rooftop PV installation. Technical data of the 3-phase inverter are listed in Table A2 (Appendix A). In the specific simulation, the assumption is made that one car battery is always connected to the charger. Another important assumption on the specific energy system simulation is that while staying at home, the car batteries are charged exclusively by the inverter fed by the PV installation. That is, no charging is made at home with power from the grid.

2.4. Photovoltaic System Simulation Details

The manufacturer’s data [53] are not sufficient for detailed PV modeling. De Soto et al. [54] derived the PV module operating curve based on the manufacturer’s data by modeling the module as an equivalent one-diode circuit based on five parameters: I L (the light current), I 0 (reverse diode current), R S (module series resistance), R S H (shunt resistance), and α (modified ideality factor). The I–V curve is modeled by the following expression:
I = I L I 0 ( e V + I R S α 1 ) V + I R S R S H
The factor α is derived from cell temperature TC, the number of cells in series NS, the usual ideality factor η I , the Boltzmann constant k, and the electron charge q:
a = N S η I k T C q
By using the I–V values from the manufacturer’s data, these equations can be solved to give the values of Table 1.
The 35 rooftop PV panels are arranged in portrait orientation as shown in Figure 1. Panel dimensions are 1048 × 1765 mm, and nominal output is 370 Wp (technical data in Table 2). Thus, the rooftop PV installation is sized at 12.95 kWp.

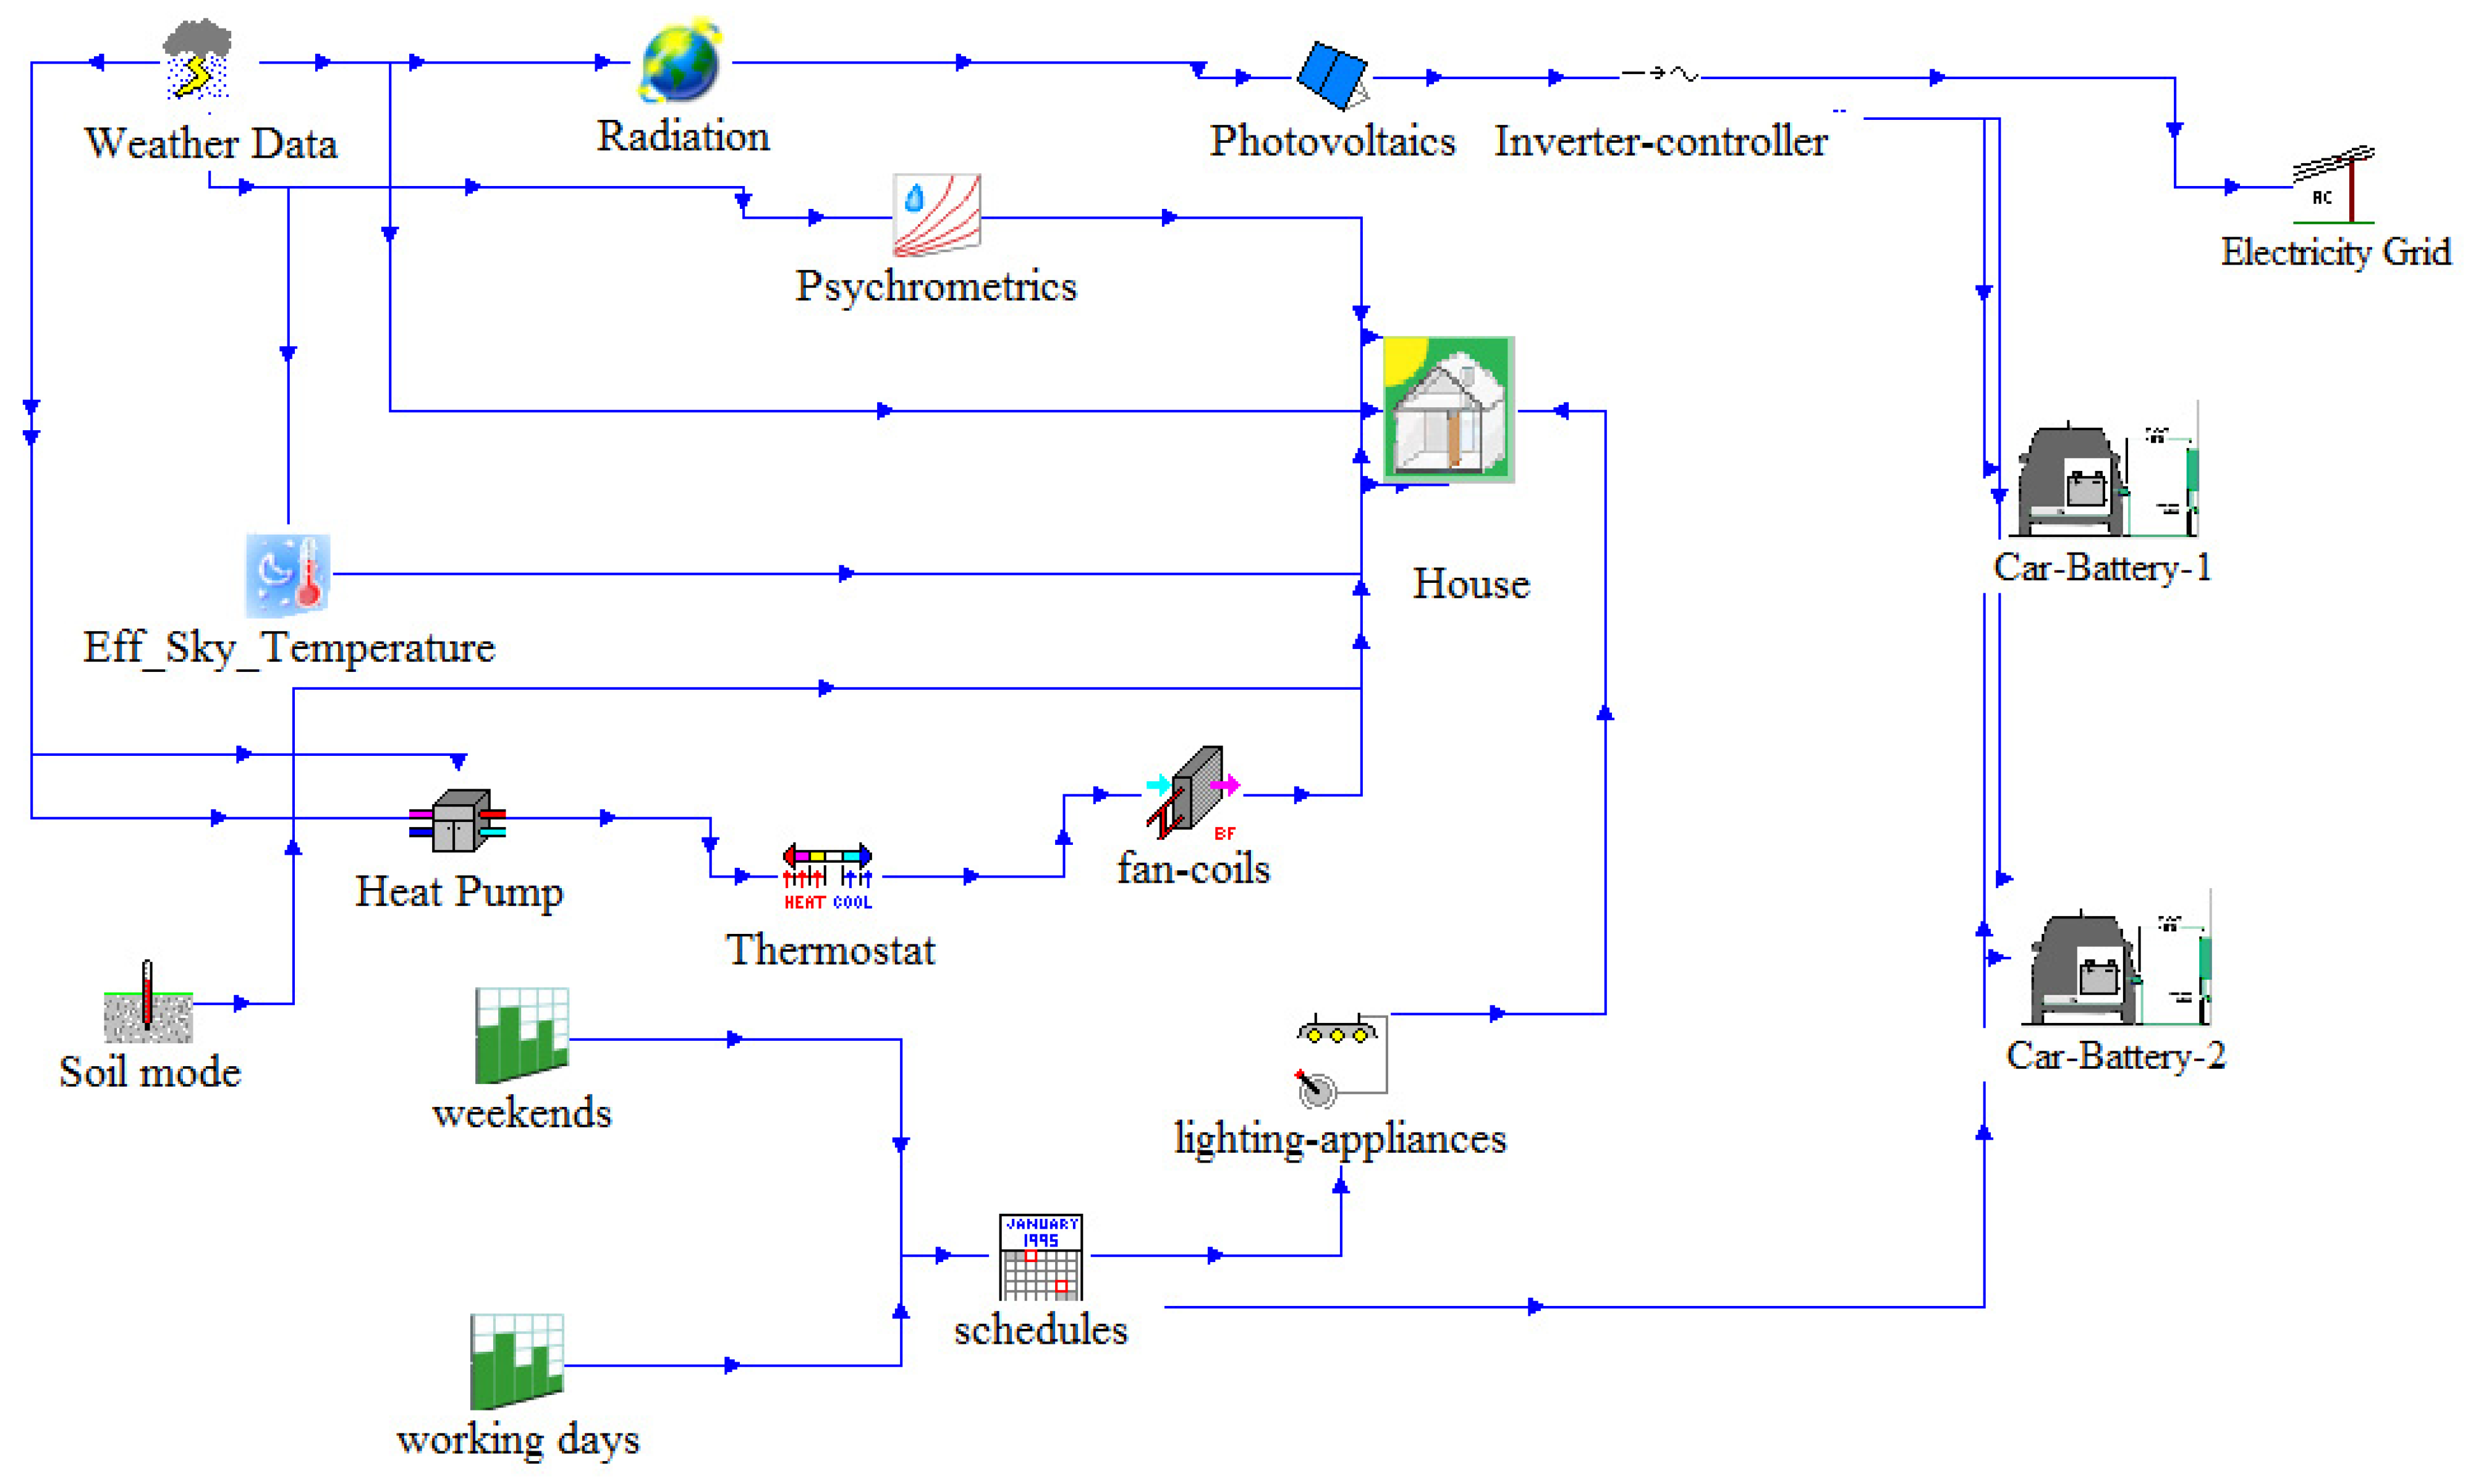
2.5. TRNSYS Types and Simulation Details

The system’s components interaction is presented in Figure 2. The 3-zone building model of the reference house is conditioned by the HVAC system based on the air-source heat pump. The rooftop PV installation is included, and each one of the two EVs’ batteries is connected to the respective house’s charger whenever the car stays at the house’s parking places.
Apart from Type 56 and the standard utility components of the TRNSYS environment (Type 54—weather generator, Type 16—solar radiation processor, Type 69—effective sky temperature, Type 501—ground temperature calculation, Type 33—psychrometrics), specific TRNSYS component models for the PV panels (Type 194), the inverter (Type 48b), the 48 V car batteries (Type 47c), and the HVAC system (Type 668, Type 753a, Type 108) are employed in the simulations, based on subroutines acquired from the TRNSYS and the TESS libraries [48].

3. Results

A simulation for a full year (8760 h) with a time step of 0.1 h consumes one minute of CPU time on an 8-core Ryzen 5 processor.
The simulation gives a lot of detail on the variation in the numerous energy system’s variables. In addition to the usually reported energy system variables employed in building simulation, the following additional variables, considered essential to the understanding of the electrical system’s behavior, are presented in the figures below:
Battery state of charge: This corresponds to the total battery capacity (i.e., refers to the sum of the two batteries’ state of charge, based on the assumption mentioned in the previous section).
Power to grid: The electric power exported to the electricity grid.
Power from grid: The electric power imported from the grid whenever the batteries cannot cover the house’s and EVs’ electricity needs.

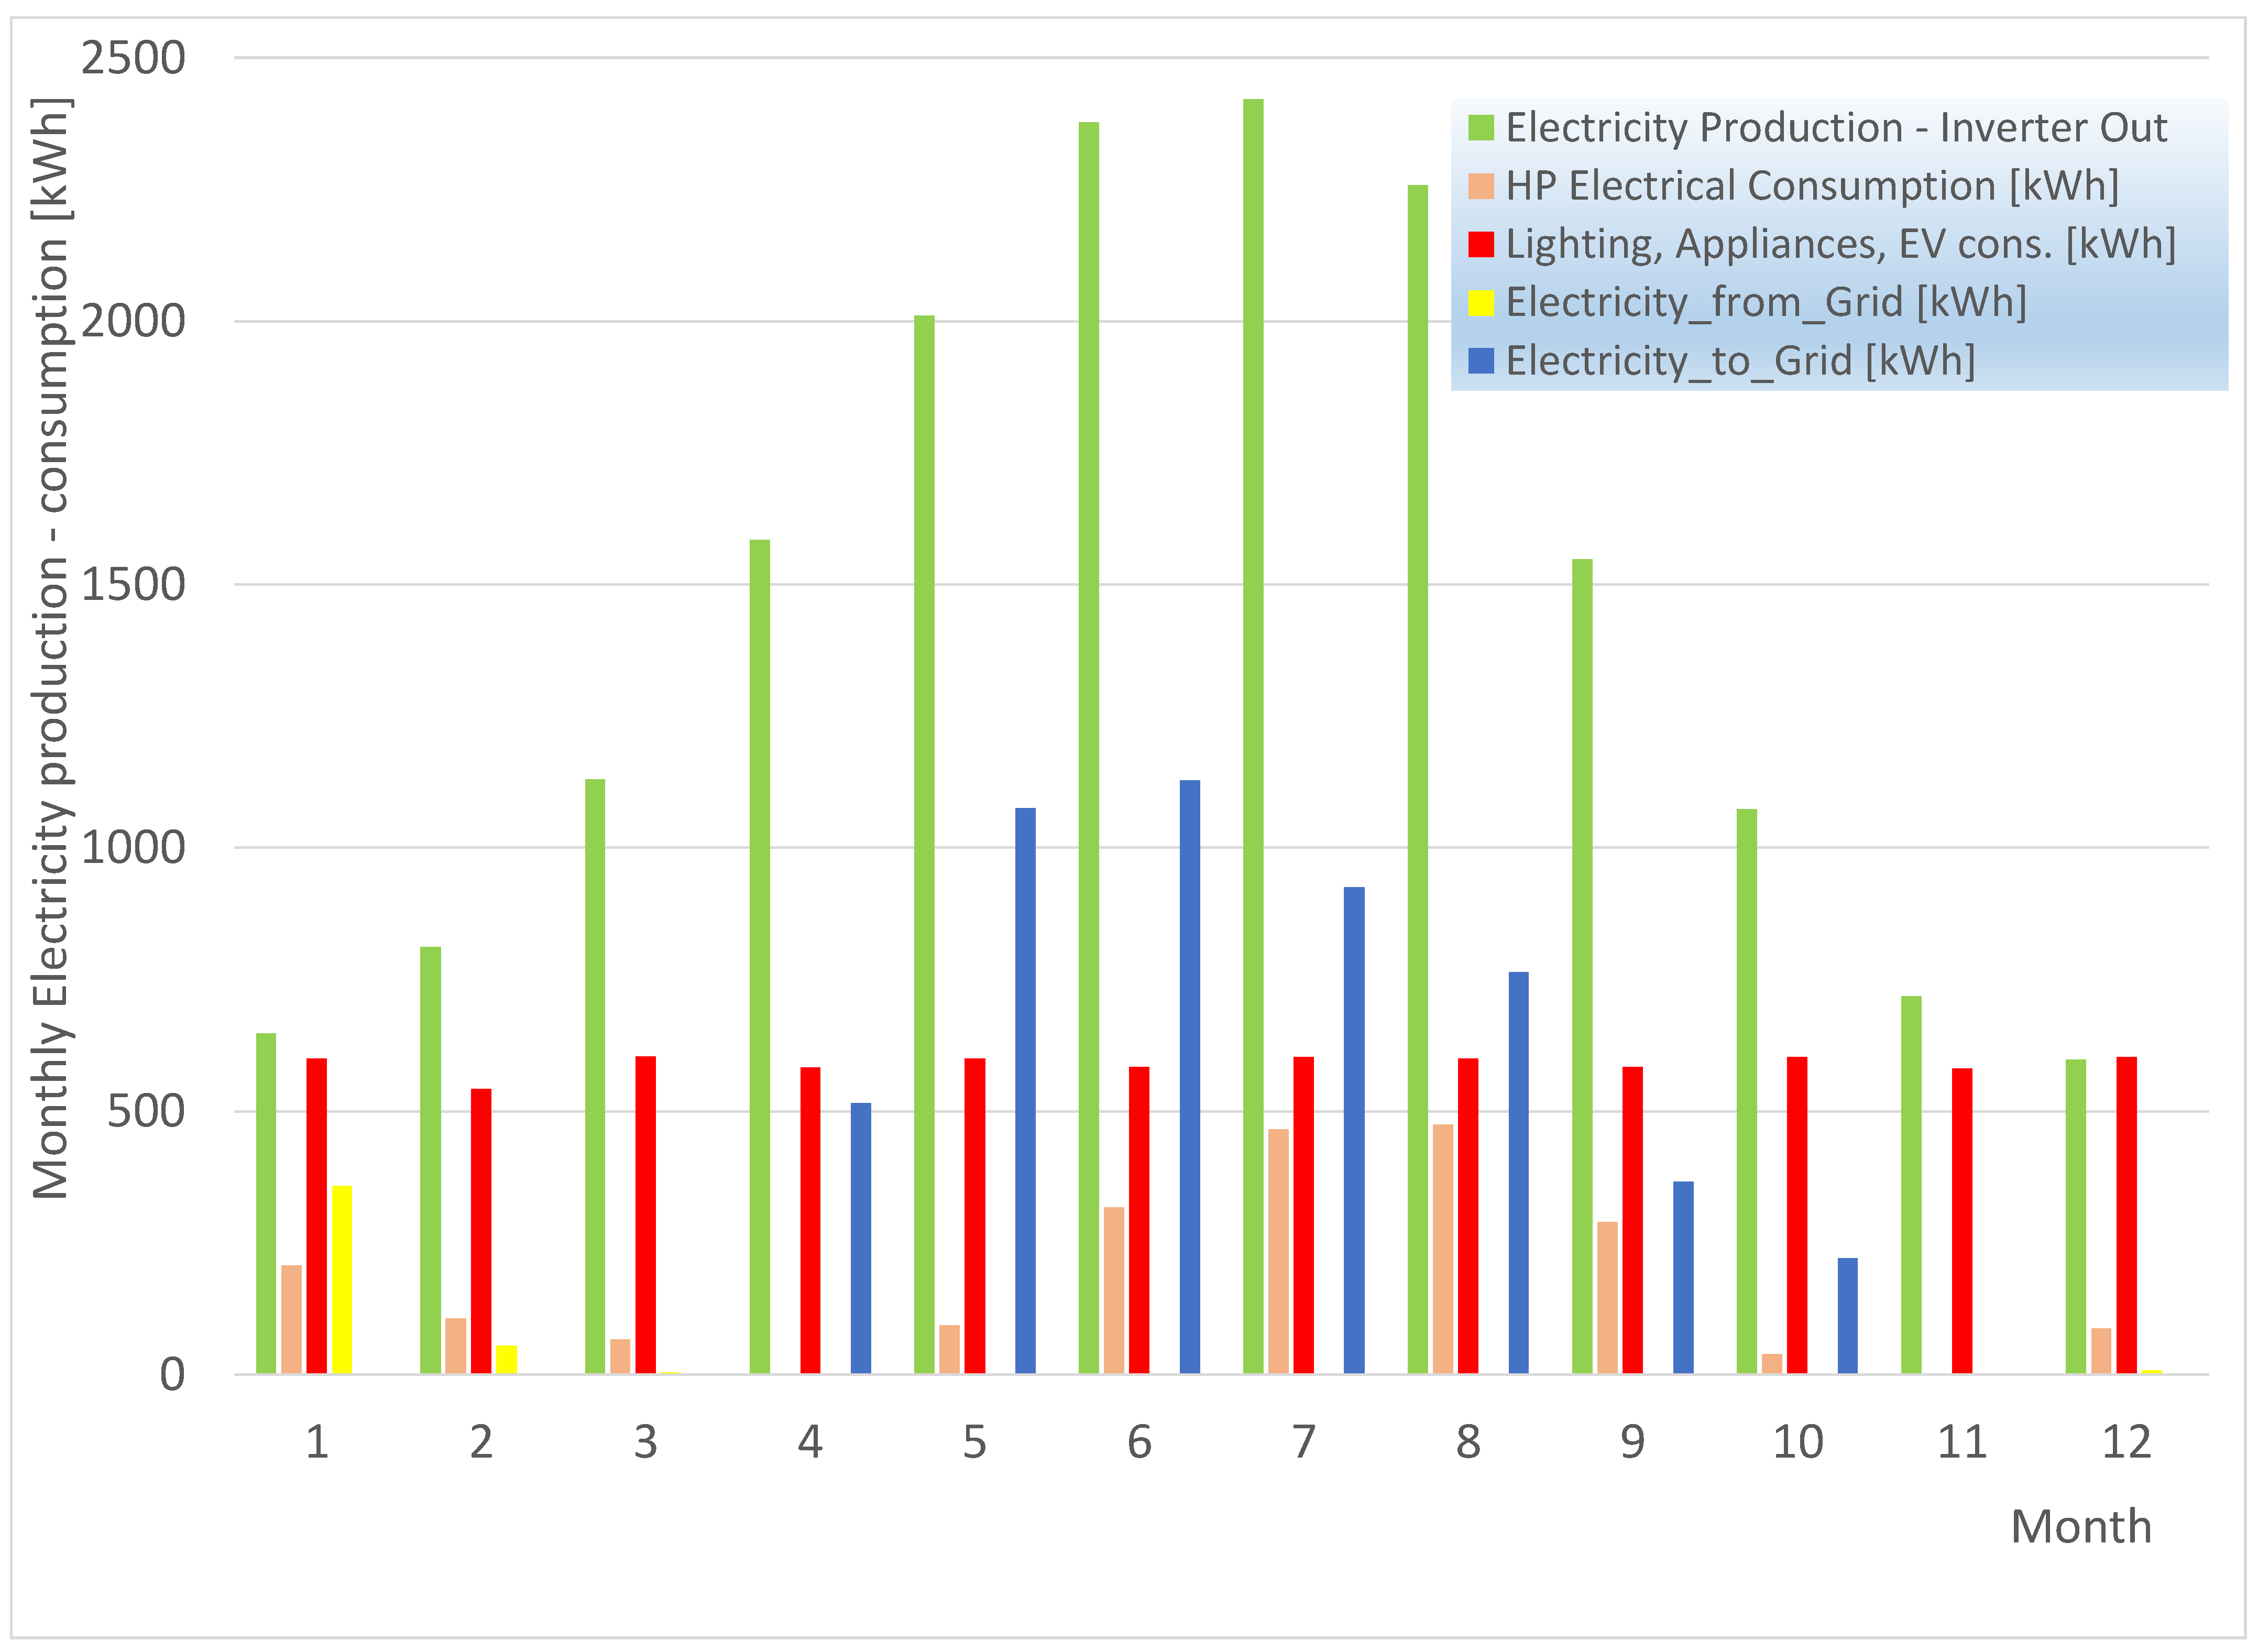
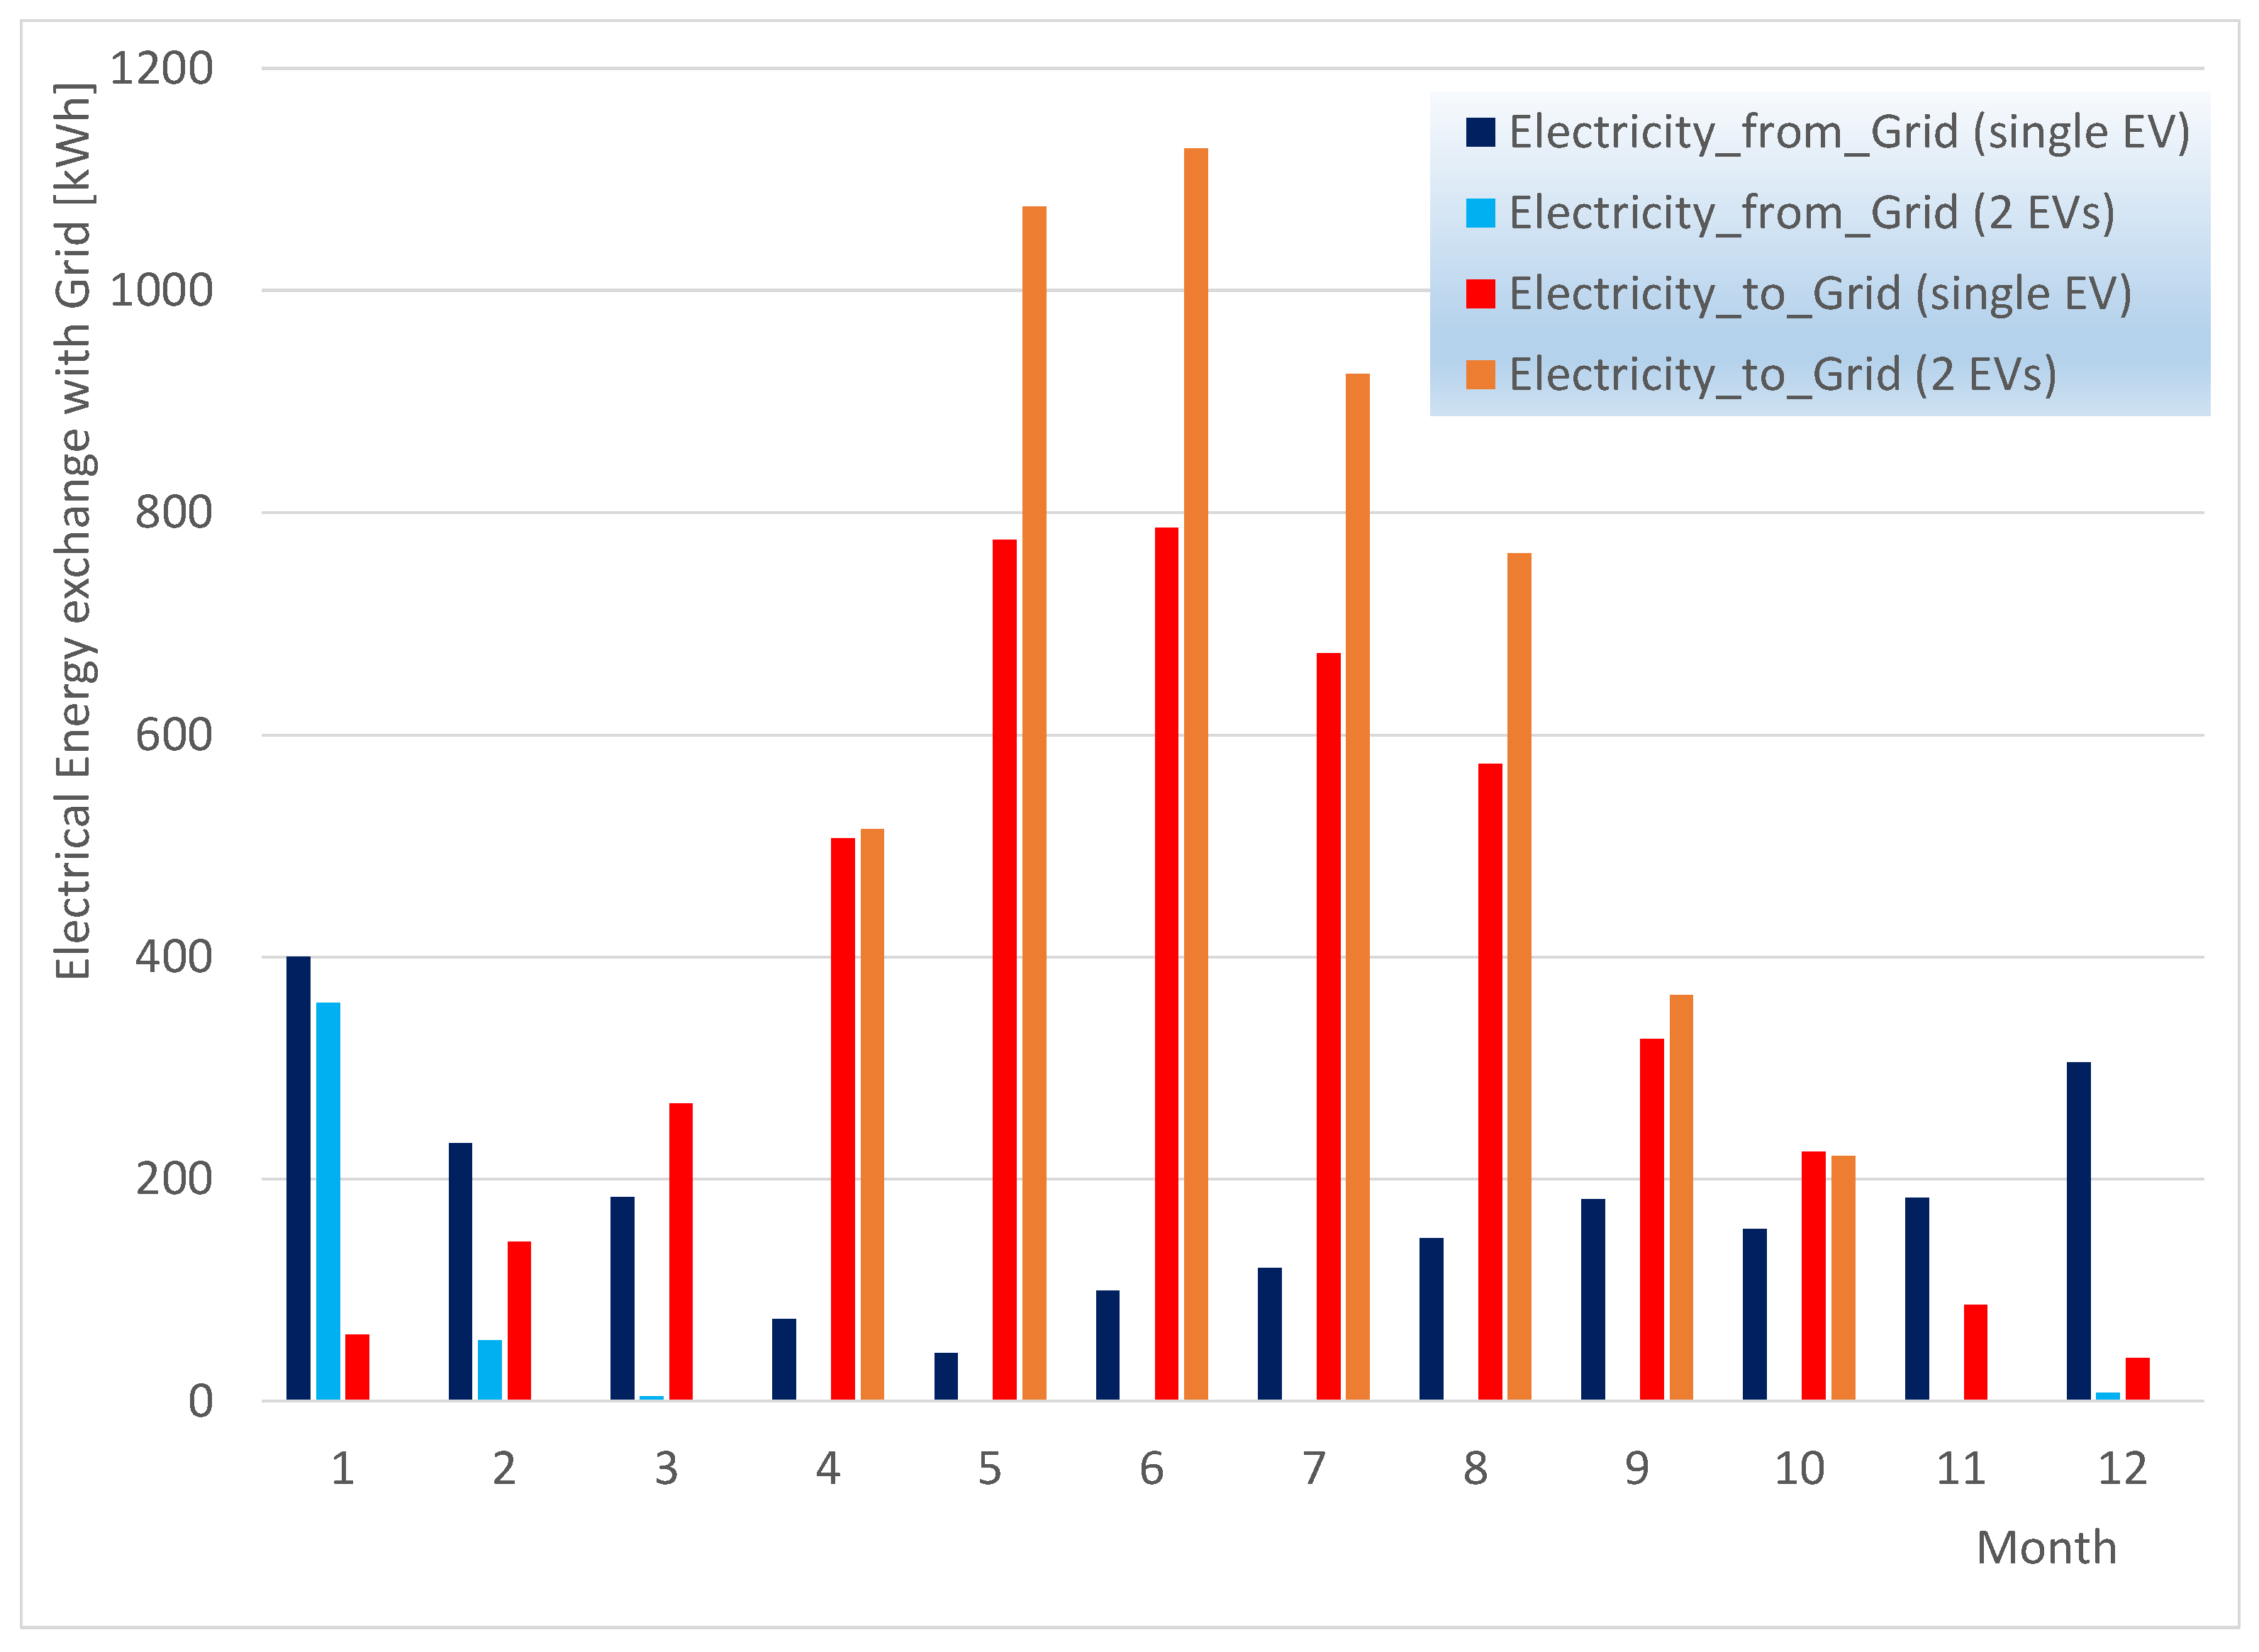
3.1. Monthly Systems Performance and Annual Summary

Integration of the results on a monthly basis is a good starting point for the analysis.
A comparison of the predicted monthly electricity consumption of the house plus the two electric cars is presented in Figure 3, compared with the monthly electricity production of the photovoltaic installation. The heat pump’s consumption varies according to the season and is negligible or zero during the neutral months of April, October, and November. The heat pump’s performance will be detailed in the next figure. Now, continuing with Figure 3, the electrical consumption for the house’s lighting and appliances amounts to the order of 300 kWh/month, and the respective electricity consumption for the home charging of the two electric cars amounts to about 10 kWh/day or 300 kWh/month. These are assumed to be evenly distributed throughout the year in the current simulation study. The total annual electricity consumption of the house plus the two electric vehicles is predicted to amount to 9250 kWh, or about 65 kWh/m2y. Now, the total electricity produced by the large rooftop PV installation amounts to 17,200 kWh, which is almost twice the electricity requirement of the house plus the two electric cars. One may observe that this size of high efficiency PV installation not only results in a zero-energy house (plus the two electric vehicles) but also results in the house being a net exporter of electricity to the network from April to October. As regards the electricity production of the rooftop PV installation, as already mentioned above, it is optimized for the summer because of the selected panels’ tilt angle of 20 degrees. On the other hand, due to the specific house’s (and cars’) consumption and production profiles, we observe from Figure 3 that it is necessary to import some electricity from the grid during the months December to March.
The monthly electricity consumption and heating and cooling energy production summary for the heat pump during the year is presented in Figure 4. The seasonal heat pump capacity and coefficient of performance (COP) is seen on a monthly basis. Average COP in winter ranges between 3.9 and 4.9. Monthly average COP during summer varies between 3.3 and 3.8. Summer cooling loads are considerably higher. This is due to the prevailing climatic conditions (mild winters, relatively hot summers). The annual electricity consumption of the heat pump amounts to 2150 kWh, or about 15 kWh/m2y, which is a very low consumption, due to the house’s insulation standards and the heat pump’s efficiency. The house’s electricity production significantly outperforms its electricity consumption during summer. This includes the consumption of the two electric vehicles.
It is interesting to compare in Figure 5 the trend in the monthly electricity self-consumption of the house (including the owners’ electric cars) with the rooftop PV production. The total annual electricity consumption of the house plus two EVs is about 60% of the total PV production. Thus, on a total annual basis, a detached, energy-efficient single-family house with two electric cars goes beyond zero energy with the maximum possible rooftop PV installation size.
As discussed above, with the specific rooftop PV size, the house plus two EVs is a net exporter of electricity during all months except for December and January. Now, the significant electricity storage capacity of the batteries of the two EVs will be proven to be an important asset to the house’s energy system since they allow minimization of the instantaneous needs for electricity from the network on a daily basis, increasing self-sufficiency of the house and minimizing the load to the network. This will be further analyzed in the next section.
Figure 6 shows the net electric power that can be sent to the network on a monthly basis. The monthly electricity consumption of all Greece for 2021 is comparatively presented.
Now if one observes the respective trends in the monthly electricity demand (total and the respective demand without the photovoltaic production) of Greece during 2021, the following remarks can be made: Although the absolute maximum of electricity load is observed in July, if we deduct the electricity produced by photovoltaics, the maximum demand from the rest of production types is in December/January. However, these months are characterized by an increased wind and hydroelectric power production (Figure 5); thus, the maximum demand for fossil fuel electricity remains in July and August. Further increase in rooftop PV installed capacity in Greece is beneficial in that context and expected to allow for increased penetration of electric cars, profiting from their significant electricity storage capacity.

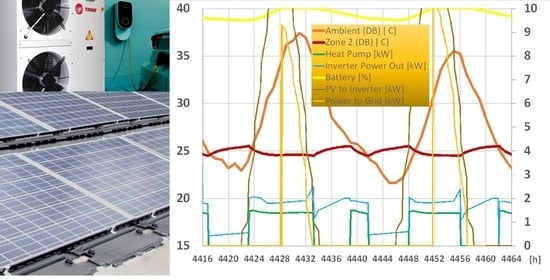
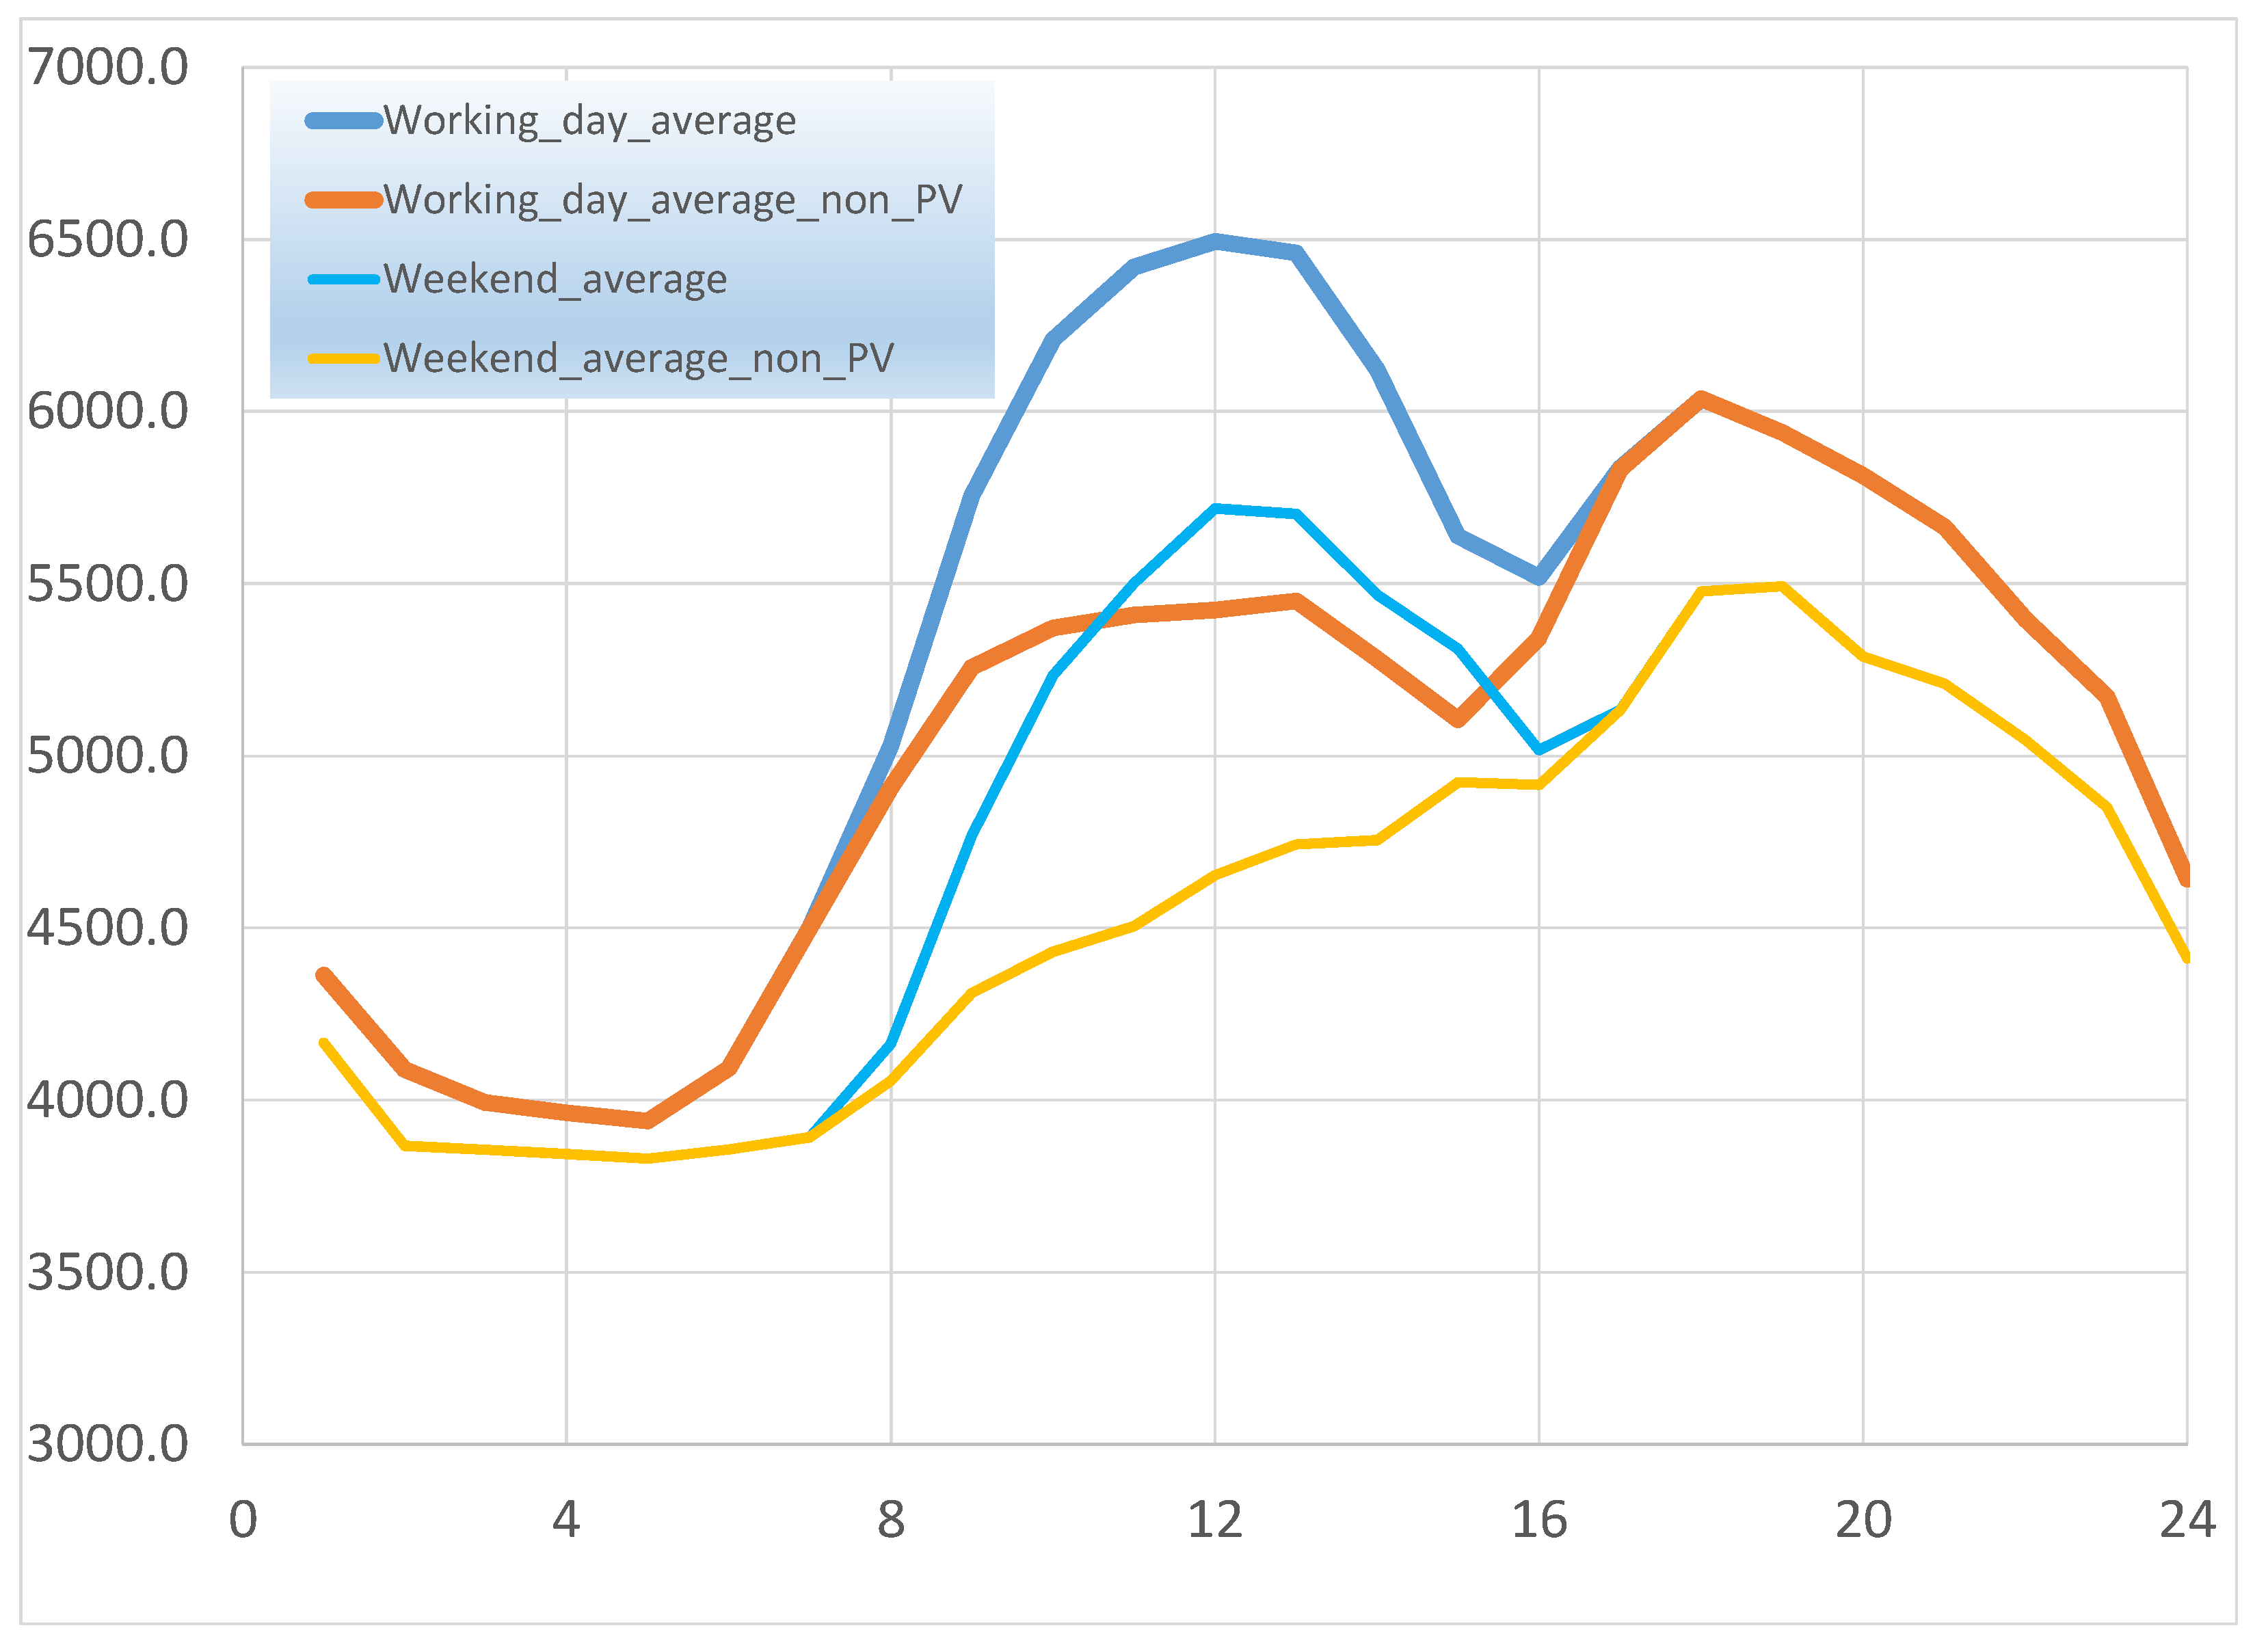
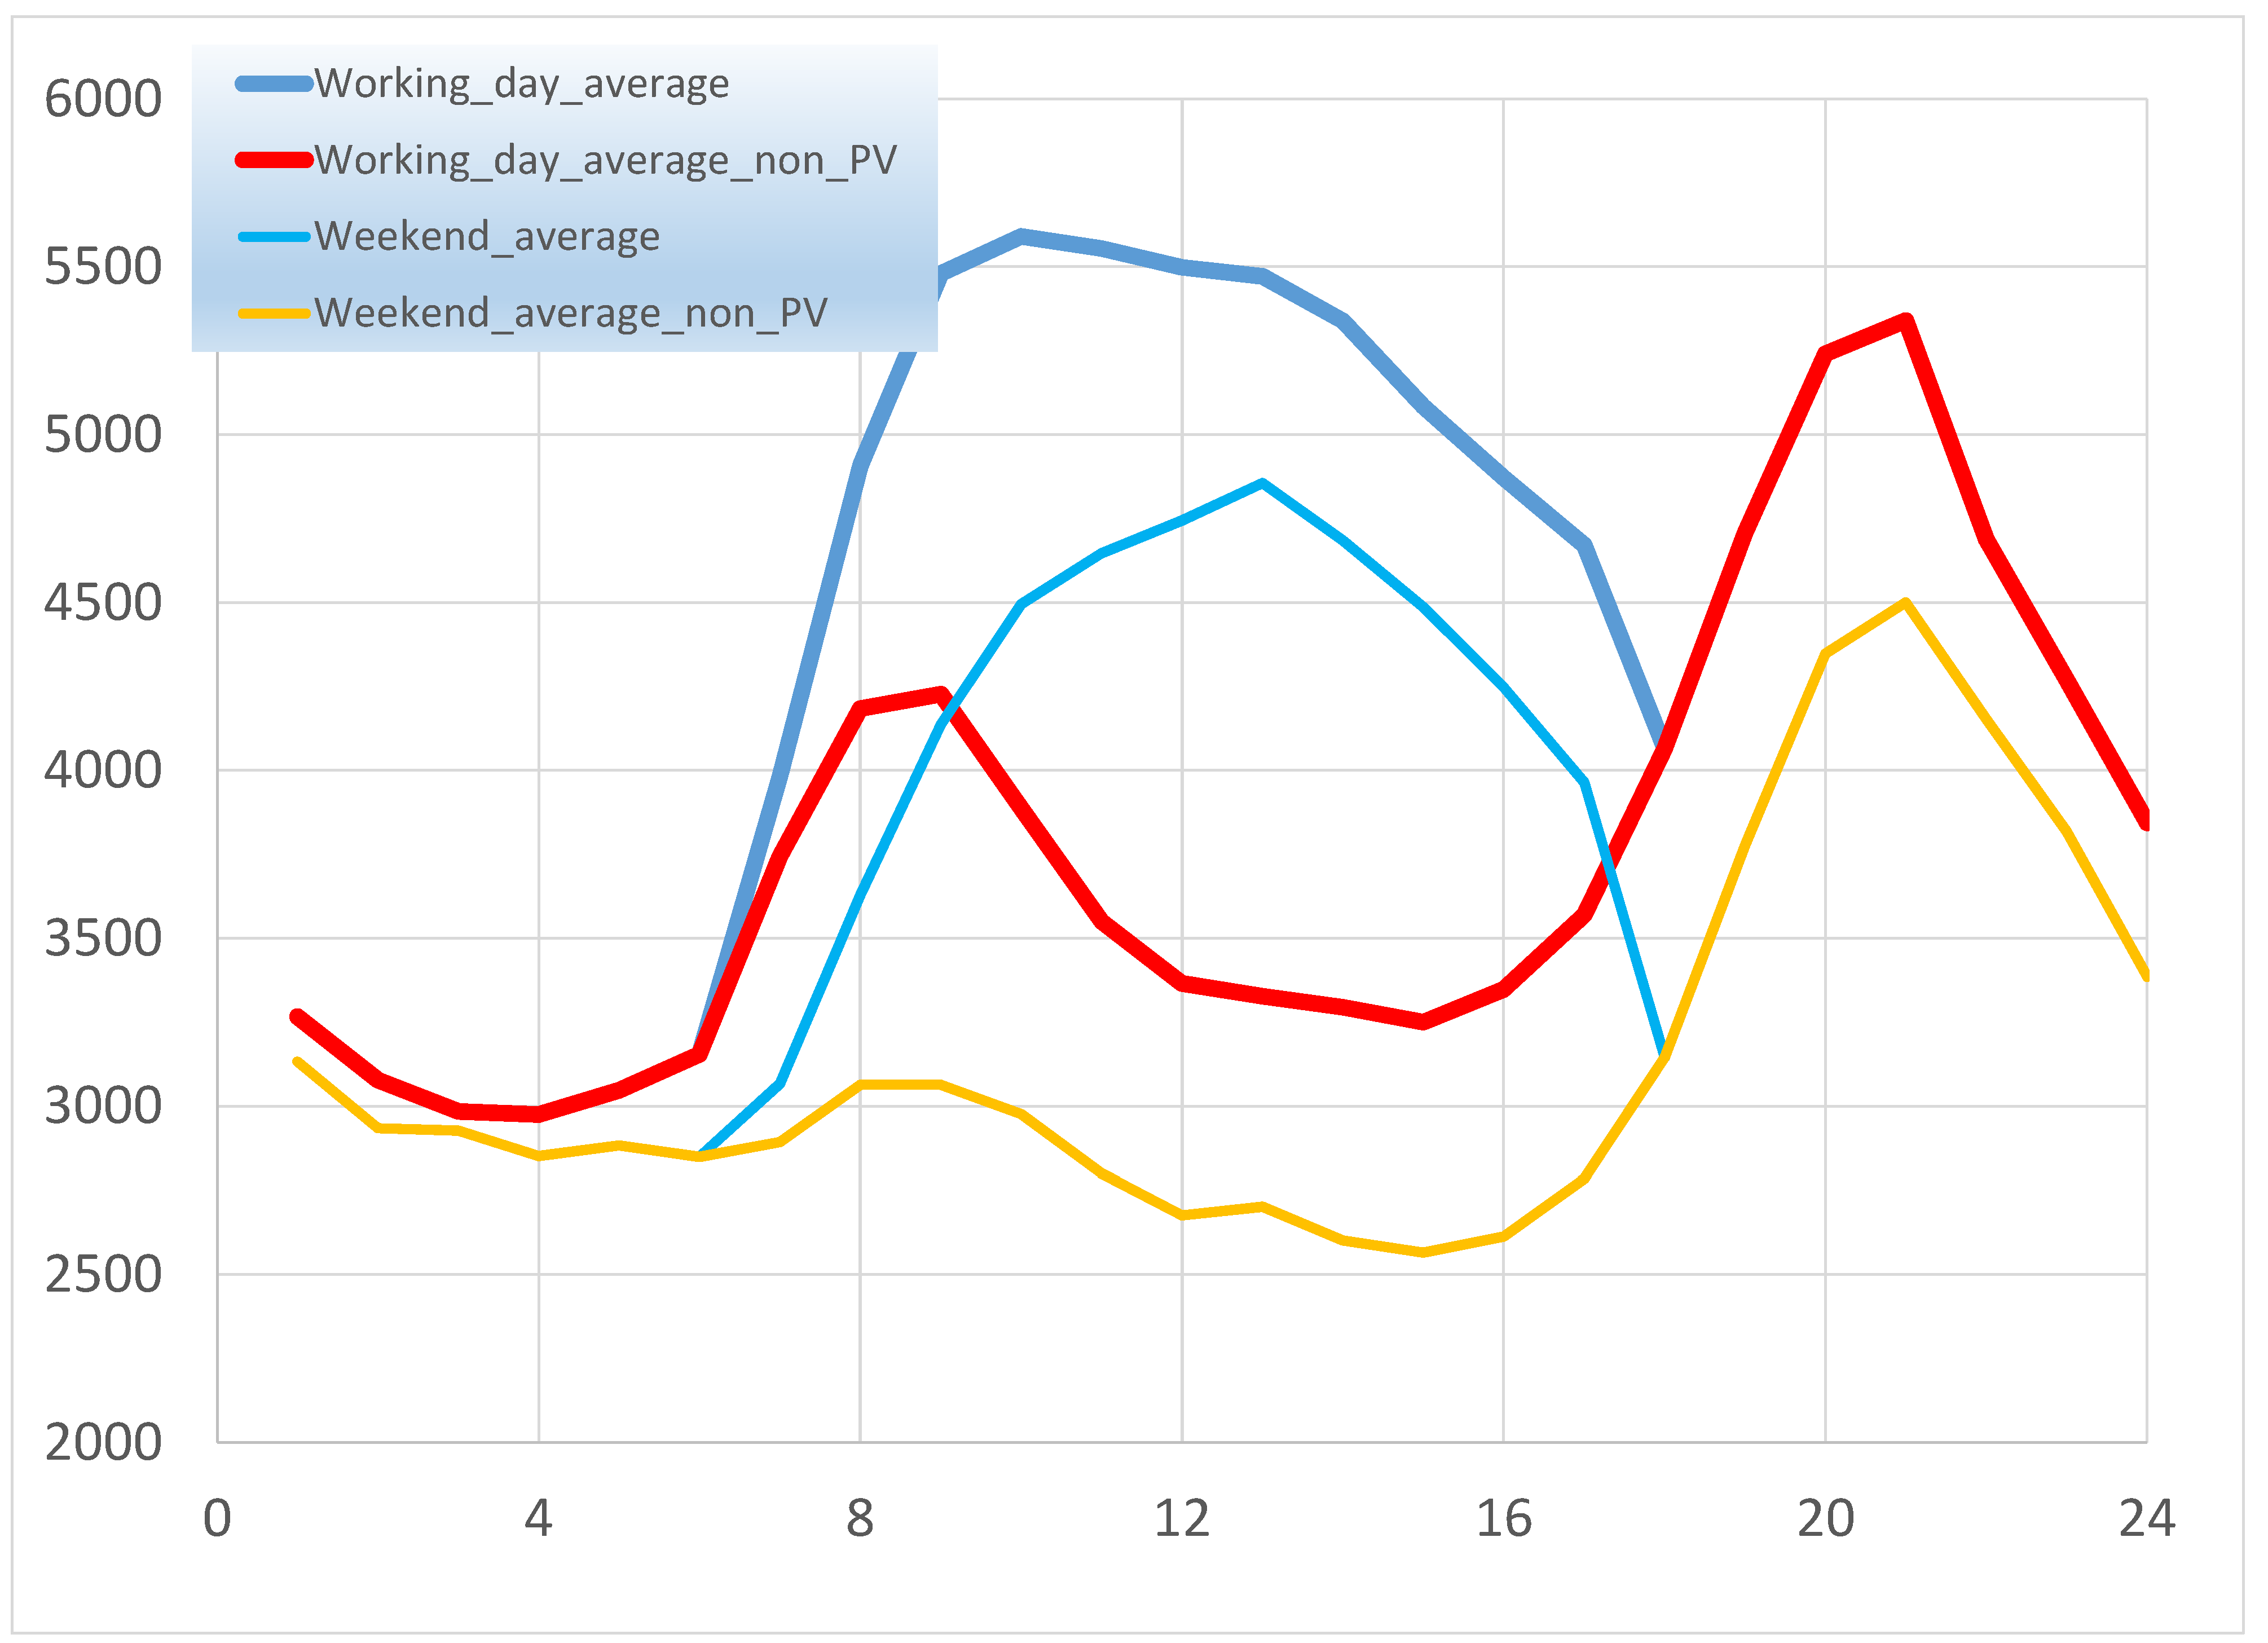
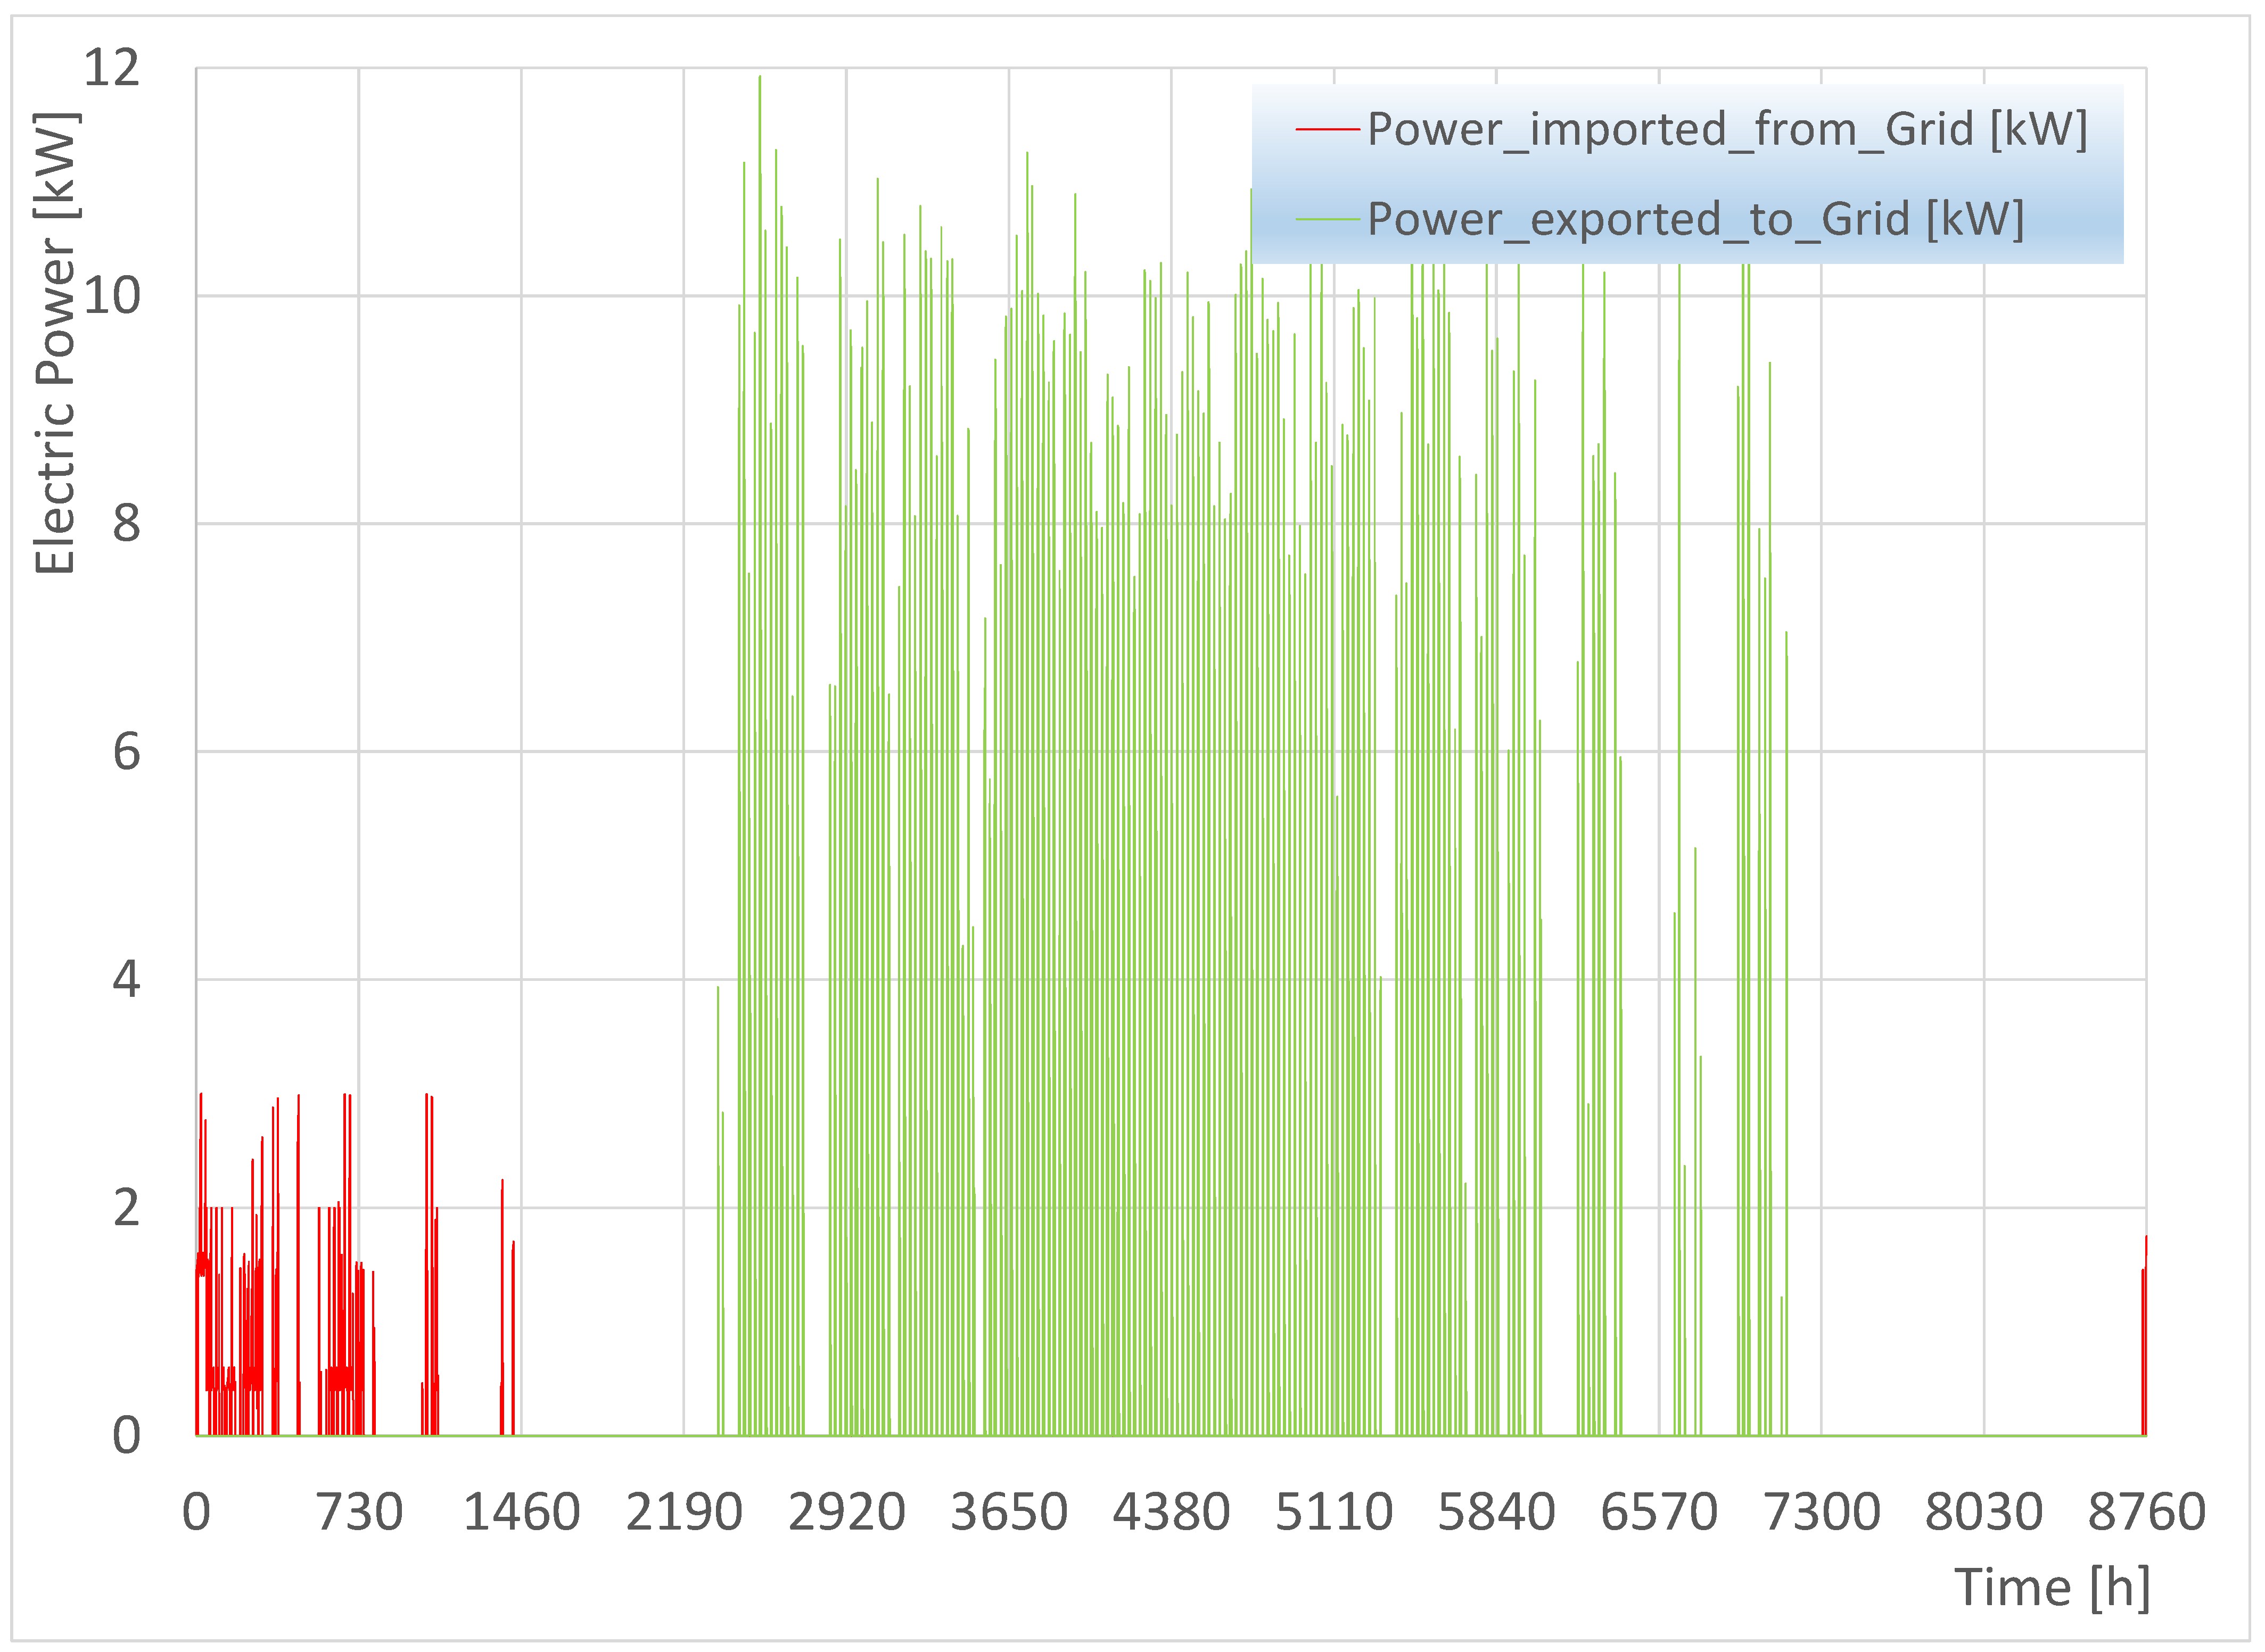
3.2. Hourly Systems Performance and Interactions

Now we proceed to study the daily and hourly systems performance in more detail by exploiting the transient simulation capabilities of the TRNSYS software. With the increased penetration of heat pumps, they are seen to impact on the shape of the daily electricity demand curve during the winter (December to February). This happens because during the summer the space cooling is already accomplished by electricity. On the other hand, additional electricity demand is expected during winter as heat pumps replace gas and oil-fired boilers. This trend could increase the required ramp rate of electricity generators during spikes in heating demand. On the other hand, the increased penetration of electric vehicles in the Greek car fleet, which continues at a fast pace, is expected to impact the electricity demand curve, especially during the evening ramp, as the people return from work. This would contribute to a fast ramp of electricity generation capacity and would require additional overnight levels of electricity demand.
Thus, apart from the effects on the overall electricity demand levels, the change in daily demand patterns and the associated flexibility requirements must be seriously examined and discussed. In this discussion one should keep in mind that the traditional and reliable source of flexibility, in the form of open cycle, aeroderivative gas turbines are hit by the legislation because of their high carbon emissions intensity.
The effect on the daily demand curves and flexibility requirements may be better understood if one examines the average daily electricity load curve of the Greek system during the first half of January 2021. The average curve of the electricity demand of Greece during the first half of January 2021 is presented in Figure 7. During the weekdays, we observe that the first characteristic peak (morning peak) is higher than the evening peak. However, if we deduct the average hourly PV generation in Greece during the specific days, we see that the evening peak is significantly higher, at about 6 GW. Moreover, the evening ramp now becomes clearly visible, requiring an additional flexible power source of 650 MW to be added each hour between hours 16:00 and 18:00 (a total of 1.3 GW for two hours). Now, it is apparent from this figure that there is a quite significant margin for increasing installed PV capacity since the system exploits about 2.5 GW of fossil electricity from 9:00 to 16:00, out of which about 1.8 GW is fueled by natural gas. That is, there exists a margin for doubling the installed PV capacity in Greece before seriously affecting the shape of the curve with a risk of over-generation during the noon hours (California duck curve) [55].
On the other hand, the added flexibility gained by the increased battery capacity of the house owners’ electric cars is a serious advantage in this context because it normally significantly exceeds the electric cars’ daily needs. The damping and equalizing effect of the car batteries’ capacity will be demonstrated in the transient simulation results that are presented next.
Aiming to understand and compare the transient behavior of the house energy system during the same period, winter operation is presented in Figure 8 for the first 10 days of January. The HVAC control operation is apparent here.
During the first two hours, the heat pump continuously runs to heat the house up starting from 15 °C. In the sequel, the room thermostat cycles on/off to keep room temperature at the set point of °C.
For simplicity, the batteries are assumed to start empty at the first day of the year. The batteries are seen to charge quickly during the first, third, fourth, and fifth days of January, reaching about 20% of their total capacity. Upon exceeding their 20% FSC, they are allowed to discharge whenever necessary to cover electrical consumption of the heat pump, lighting, and electrical appliances. In addition, the car batteries are discharging when each car is in motion. Low sunshine and increased consumption by the heat pump during the last days of this period are seen to discharge the batteries up to their discharge limit of 0.2.
A closer examination of the transient behavior of the system can be studied in the example of Figure 9, where we focus on only two days of the start of January. The battery state of charge is starting from low levels at 20%. The battery is charging during the day and discharging during the evening due to the heat pump operation. The next morning the battery charges only slightly because the heat pump is operating to meet the low ambient temperature levels. It is interesting to see that, due to the low state of charge of the batteries in this period, the system needs to import electricity from the grid in three instances during this period: during the night starting at 168 h, during the next night and very early morning where the heat pump starts and the PV installation does not receive enough solar irradiance, and during the next evening where the battery is at its low state of charge.
Next we shift our focus to the average daily electricity load curve of the Greek system during the first half of May 2021, presented in Figure 10. During the weekdays, we observe again that the first characteristic peak (morning peak) is higher than the evening peak, but when we subtract the average hourly PV generation, the evening peak is significantly higher, at about 5.4 GW. Moreover, the evening ramp becomes now clearly visible, requiring an additional flexible power source of 550 MW to be added each hour between hours 17:00 and 20:00 (a total of 1.65 GW added in 3 h). Again, there exists a quite significant margin for increasing installed PV capacity since the system exploits about 2–2.5 GW of fossil electricity from 9:00 to 16:00, out of which about 1.5–2.0 GW is fueled by natural gas.
A graph of the house energy system’s operation during the same period (first days of May) is presented in Figure 11 for comparison. Most of April and the first days of May usually belong to the spring neutral season of the year. Thus, heating demand is off, and the batteries are seen to be charged close to 100% of their capacity for this period. During the last four days, a lot of sunshine increases solar gains of the house, and the heat pump operates in cooling. The battery that becomes fully charged during the day easily covers the evening and night loads by discharging during these periods. A cloudy day observed after 3120 h also causes a discharging of the battery of up to 95%, to be recovered during the next day.
A closer look at the situation in this neutral period of May is presented in Figure 12, with two consecutive days depicted, the first of which is a cloudy day, as mentioned above.
As already reported, the battery starts with a near 100% state of charge because of the reduced electricity consumption of the previous days, since the heat pump remains shut down in the neutral season. The battery is discharging during the night in order to cover the house’s and cars’ demands. However, it continues to charge during the noon of the second day, while addressing at the same time the needs of the heat pump in cooling operation. This happens because of the high electricity production from the PV installation, due to high insolation and more favorable panels’ tilt angle for the summer. It is observed that under these circumstances, the house and EVs remain completely autonomous from the electricity network. Moreover, the house starts exporting electricity to the grid during the afternoon of the second day, thus assisting the grid to address the evening ramp (see Figure 10). The connection of a car’s battery during the morning and noon hours has a buffering action on the export of electricity to the grid, thus shifting it later in the afternoon to a time that this electricity is needed by the grid.
The next season of interest in our analysis is the summer season. Thus, we shift our focus to the average daily electricity load curve of the Greek system during the first half of June 2021, presented in Figure 13. This was a period with several heat waves; thus, during the weekdays, we observe a very high characteristic peak in the noon (morning peak), reaching 8 GW. Obviously, this is much higher than the evening peak due to the space cooling requirements (air conditioners).
Now, when we subtract the average hourly PV generation, which is very big, reaching about 2 GW during these days; the evening peak becomes higher, at about 6.8 GW. However, the evening ramp is not significant maximizing between 16:00 and 17:00, where it requires an additional flexible power unit of 600 MW for just 1 h. However, during this hot summer season, the maximum ramp rate of about 1 GW/h is observed between the hours 5:00 and 6:30 during the morning ramp-up. This necessitates the respective capacity in flexible power units (open cycle gas turbines).
Further increase in the installation of PV units assists the grid in addressing this ramp with reduced deployment of flexible units. The gradual increase in heat pump units for space heating, on the other hand, adversely affects both the morning and especially the evening ramp. This is studied by means of field measurements and transient simulations.
Thus, there exists a very significant margin for increasing installed PV capacity in the Greek system since it uses about 5 GW of fossil electricity from 8:00 to 17:00, out of which about 4 GW is fueled by natural gas. Thus, the Greek system would significantly benefit during the summer months by additional PV installations. PV peak power levels could be doubled to 2 GW without compromising the system’s stability. This would reduce the dependence on expensive natural gas. The additional PV power does not deteriorate system stability during the neutral months (see for example Figure 10). The synergy will become more favorable with the increasing electricity consumption of the electric cars entering the fleet, provided that they are adding to the network’s storage in the mode demonstrated in this study.
A graph of the system’s operation for the first days of July is presented in Figure 14, in order to comparatively study the house energy system’s transient operation during the same season. The heat pump operates quite frequently in cooling mode to address the high cooling needs of the heat waves.
High ambient temperatures are observed from 4330 h, causing an increased deployment and consumption of the heat pump during the hot hours. The specific heat pump is optimized for summer operation because the space cooling loads are significantly higher than the heating loads for the specific climatic conditions. The battery starts at high charging levels and oscillates between 90% and 100% FSC due to the quite significant production of the rooftop PV installation, which outperforms the house’s and cars’ demand and the added, significant consumption of the heat pump. The heat pump’s consumption lowers and the battery charging levels stabilize even higher, between 95% and 100% FSC when the ambient temperatures drop after 4460 h. Since the battery now remains fully charged for some intervals during midday, the house becomes a net electricity producer and sends power to the grid.
The modified transient behavior of the house’s energy system during this period is seen in more detail in Figure 15, where we focus on two consecutive days of the same period in mid-July. The battery charge variation is seen in more detail. Moreover, the power exported to the grid is shown superimposed. The charging/discharging behavior of the battery is seen more clearly in relation to the PV production and the electricity load profiles of the house, EVs, and heat pump. The power sent to the grid during the afternoon peak to 9 kW and last about 2 h. Again, the favorable buffering effect of the car battery connected to the house’s network in shifting the power export to grid towards the afternoon hours is apparent in this figure.
Next, we shift the discussion to the average daily electricity load curve of the Greek system during the mid-November 2021, presented in Figure 16. During the weekdays, we observe again that the first characteristic peak (morning peak of 6.5 GW is somewhat higher than the evening peak. However, when we subtract the average hourly PV generation the evening peak prevails at 6.25 GW. The evening ramp is not very steep, requiring an additional flexible power source of a total of 1 GW to be added in total for the 5 h between 14:00 and 19:00. Again, there exists quite significant margin for increasing installed PV capacity, since the system exploits about 3.5 GW of fossil electricity from 8:00 to 16:00, out of which about 3 GW is fueled by natural gas.
Figure 17 presents the system’s performance during the respective period (ten weekdays in mid-November). This is usually a neutral season, which does not require heating or cooling.
According to this figure, the battery fractional state of charge starts to lower, especially during the cloudy days with reduced production of the rooftop PV installation, which are seen to be more frequent during the specific time interval in November. Moreover, the tilt angle selected for the PV panels is not favorable for the winter operation with low solar altitude angles.
The situation is better understood if we focus on two consecutive days of the same period (Figure 18). As already seen in the previous figure, the battery starts very low with a near 80% state of charge, mainly due to low PV production (cloudy days). A significant increase in the state of charge is observed during the second day—a clear sky day with high insolation. It is interesting that, despite the reduced state of charge, the battery continues to keep the house autonomous from the grid. This is favored by the neutrality of the season that keeps the heat pump shut off.
Thus, the low PV production during the first day suffices for the loads and a slight charging of the battery. The battery is discharging during the night hours to cover some minor electric loads.
Overall, the total annual electricity imported from the network is computed to be about 420 kWh, and the annual electricity exported to the network is 5000 kWh (Figure 19). In order to comparatively assess the performance of the system when only one EV is available, the respective amounts of energy exchanged with the grid are presented in the same figure. In this case, the house will need to import about 2100 kWh from the grid and will be able to export about 4500 kWh to the grid. That is, the addition of the second EV to the household reduces by 80% the electricity imports from the grid, without affecting the total amount of electricity exported.
In this context, it is interesting to see in Figure 20 how these amounts are distributed in the course of the year in the form of the instantaneous and power levels transmitted to or from the network.
As already reported and explained in the transient simulation diagrams, these are instances of short duration, not exceeding 1–2 h in a day. As seen in Figure 20, the electricity imports from the grid are mainly concentrated during January and February, where the car batteries’ charging levels are low and frequently drop to the FSC = 0.2 threshold. The electricity exports to the grid are concentrated during the summer months from May to September. The grid power input levels peak at 1 to 3 kW, whereas the levels of power output to the grid are significantly higher, ranging between 4 and 11 kW. The house and two electric cars remain completely autonomous from the network from March to December, where the batteries remain at high levels in their state of charge.
It is interesting to compare the situation when there is no electric car connected to the house’s network during the day. For a fair comparison, the electricity consumption profile of two electric cars is also considered in this case. However, the system now lacks the favorable synergy of a battery storage connected during the peak PV production hours. The results are presented in Figure 21. Obviously, the system is now frequently exchanging electric power with the external network during all year. Moreover, there is a frequent shift between peaks of electricity exported and imported from the network every day, which is a source of instability to the network. As already discussed in the previous section, the favorable effect to the system’s stability could also be attained by the existence of a separate battery of equivalent size to a car’s battery.
In order to better quantitatively assess the performance improvement with the second EV, an alternative comparison can be made between the monthly performance of the two alternative systems, when the power exchange between the house and the network is integrated on a monthly basis. This is presented in the graph of Figure 22.
The favorable effect of the car’s battery connected to the network during the day is apparent in the comparison of monthly exchanges of electricity with the grid. When two EVs become available to the household, the house’s network becomes self-sufficient to a large extent; it imports small amounts of electricity mainly during January and February. On the other hand, it exports large amounts of energy to the network during the summer months; however, as already explained, the electricity export is phase-shifted to the late afternoon hours, when this is favorable for the evening ramp of the grid. On the other hand, the existence of only one EV is seen to produce a year-round, reciprocating inward and outward exchange of electricity with the grid (Figure 22), which is not favorable to the network’s operation, as discussed above.
The results of this study point to the role of equipment sizing optimization, which may be carried out at the system-level of the single-family house to fully exploit the new, important storage capabilities presented by the high penetration rate of electric vehicles in the fleet. Optimal sizing of the various components in the specific case study may lead to a wide range of partial or complete autonomy for the house’s electricity network, which during the summer months becomes a net electricity exporter to the grid.
Based on the results of this study, the possibility of combining the financial incentives for the purchase of EVs with those for the installation of rooftop PV in the owners’ house is very promising and worth considering because of the favorable synergy of electrical storage with the rooftop photovoltaic installations. Future studies with similar approaches may improve our understanding of the energy performance and interactions of the combination of a large size PV system with the energy systems of commercial building, including the battery storage from a significant number of employees’ electric vehicles connected to chargers during working days.

4. Conclusions

Understanding the implications of the introduction of increasing shares of heat pumps and electric vehicles on the electricity system demand patterns is essential in today’s fast changing environment and energy mixture.
The accelerated electrification of the car fleet in Europe and elsewhere makes available a large amount of electricity storage to a house’s energy system. The interaction of this storage with the house’s rooftop PV installation and the heat pump’s and cars’ electrical consumption, if studied in detail, may lead to optimal sizing of the system’s components towards further increasing energy efficiency and autonomy of the household.
A detailed, transient simulation of a house’s HVAC system along with the rooftop PV installation and the batteries of the owners’ electric cars was carried out for a full year. The results clearly show the interaction of these systems on an hourly basis, along with the daily and seasonal balance between electricity consumed and supplied to the network. The analysis was carried out in view of the daily and seasonal data of electricity demand from the Greek power grid in 2021. According to the results of the simulations and the seasonal performance of the Greek electricity grid, a doubling of the currently installed PV capacity is possible in Greece without significant risk of overproduction during the noon hours in all seasons. A large portion of this added capacity could be in the form of large rooftop PV installations in large buildings but also in detached houses. It turns out that exploiting the increasing storage capacity of the electric vehicles introduced to the market reduces the necessary flexibility to be added to the network. That is, in addition to the self-sufficiency of the household, the impact on the electricity grid becomes favorable due to the phase shift of the electricity export towards the late afternoon hours, thus assisting the evening ramp-up and adding to the grid’s stability and resilience.
Thus, before taking care of the micro-networks, significant optimization may be carried out at the level of the single-family house, which under the examined circumstances becomes a net electricity producer. With the addition of the second EV, the household (including the cars) becomes more autonomous, with the annual electricity imported from the grid reduced by 80%, keeping the annual energy exported to the grid to the same levels. Moreover, electricity is only needed to be imported from the grid during the first two months of the year, instead of all months with a single EV household.
Based on the results of this study the possibility of combining the financial incentives for the purchase of EVs with those for the installation of rooftop PV in the owners’ house is very promising and worth considering due to the demonstrated, favorable synergy of EV storage with the rooftop photovoltaic installations.
Future studies could further explore, with similar methodologies, the energy performance and interactions of the combination of a large-size PV system with the energy systems of commercial buildings, including battery storage from the employers’ electric vehicles.

Author Contributions

Conceptualization, O.Z. and A.S.; methodology, O.Z. and G.S.; software validation, G.S.; formal analysis, G.S.; investigation, G.S.; writing—original draft preparation, G.S.; writing—review and editing, A.S.; project administration, O.Z. All authors have read and agreed to the published version of the manuscript.

Funding

This research received no external funding.

Acknowledgments

The authors wish to thank Aphrodite Ktena, Energy Systems Laboratory, National and Kapodistrian University of Athens, for her advice and fruitful discussions on smart grids and smart charging of electric vehicles.

Conflicts of Interest

The authors declare no conflict of interest.

Appendix A

This section contains more details and data on the house’s location, climate type and building envelope characteristics, and the characteristics of the heat pump employed in this simulation, as well as technical data of the reference single-phase inverter.
The house is located in Volos, a coastal city in Greece, latitude 39°21′, longitude 22°56′, with a warm and temperate climate, average monthly temperatures ranging between 8 and 10 °C during winter and 25 and 28 °C in summer and 500 mm annual precipitation.
The insulation values used (Table A1) adhere to current legislated standards in Greece. Double-glazed windows are employed with U = 1.29 W/m2K and g = 0.333 (solar heat gain coefficient). Window-to-wall ratio is 0.25. Shading is applied to the vertical openings of the house, resulting in shading coefficients ranging from 0.70 for the south-facing openings to 1.00 for the north-facing ones (according to the specifications set for the reference building by the Greek building energy efficiency standard). Ventilation rates comply with the requirements of ASHRAE 62.2-2004 [56]. The operation schedule provides uninterrupted heating or cooling of the house.
Table A1. Insulation data (U-values) for the building envelope (reinforced concrete structure).
Shell TypeLayersU (W/m2K)
Roof insulationReinforced concrete slab, extruded polystyrene, lightweight concrete, ceramic tiles0.293
Concrete columnReinforced concrete, extruded polystyrene0.334
Outside WallCeramic brick, extruded polystyrene, ceramic brick0.313
Floor insulationReinforced concrete slab, extruded polystyrene0.564
Table A2. Heating and cooling mode characteristics of the air-to-water heat pump.
Heating ModeOutdoor Ambient Temperature (°C)
18.015.013.010.08.57.04.52.00.0−3.0−6.0−8.0−10.0
KW1.171.141.121.101.081.071.051.041.031.021.000.980.96
COP5.85.65.45.25.04.94.64.44.24.03.83.63.5
kW thermal6.796.386.055.725.405.244.834.554.324.083.803.533.36
Cooling ModeOutdoor Ambient Temperature (°C)
29.435.040.646.1
kW thermal5.615.265.285.39
kW1.71.952.22.45
EER11.39.38.37.4
COP3.32.72.42.2
Table A3. Specifications of the StecaGrid 10,000 + 3-phase inverter [57].
ParameterValue
DC input side (PV generator)-
Maximum input voltage845 V
Minimum input voltage350 V
Number of MPP tracker1
Maximum input current32 A
Maximum input power at maximum active output power10,800 W
Maximum recommended PV power12,500 W
AC output side (grid connection)-
Grid voltage320 V, …, 480 V
Rated grid voltage400 V
Maximum output current16 A
Maximum active power (cos φ = 0.95)9800 W
Maximum apparent power (cos φ = 0.95)10,300 VA
Rated frequency50 Hz
Night-time power loss<2.5 W
Distortion factor (cos φ = 1)<3%
Power factor cos φ0.95 capacitive, 0.95 inductive
Maximum efficiency96.3%
MPP efficiency>99%
Standby power9 W

References

  1. EEA. New Registrations of Electric Vehicles in Europe; European Environment Agency: Brussels, Belgium, 2021; Available online: https://www.eea.europa.eu/ims/new-registrations-of-electric-vehicles (accessed on 6 April 2022).
  2. EPA. Final Rule: Revised 2023 and Later Model Year Light-Duty Vehicle Greenhouse Gas Emissions Standards; EPA: Washington, DC, USA, 2021; Volume 86.
  3. European Commission. The European Green Deal; COM(2019) 640 Final, Brussels, 11.12.2019; European Union, Ed.; European Commission: Brussels, Belgium, 2019. [Google Scholar]
  4. EU. Regulation (EU) 2019/631 of the European Parliament and of the Council, Setting CO2 Emission Performance Standards for New Passenger Cars and for New Light Commercial Vehicles; European Commission: Brussels, Belgium, 2019. [Google Scholar]
  5. EU. Climate Action: Transport Emissions—A European Strategy for Low-Emission Mobility; European Commission: Brussels, Belgium, 2021; Available online: https://ec.europa.eu/clima/eu-action/transport-emissions_en (accessed on 12 January 2022).
  6. Tiseo, I. Distribution of Carbon Dioxide Emissions Produced by the Transportation Sector Worldwide in 2020, by Subsector. Available online: https://www.statista.com/statistics/1185535/transport-carbon-dioxide-emissions-breakdown/ (accessed on 12 January 2022).
  7. Osório, G.J.; Gough, M.; Lotfi, M.; Santos, S.F.; Espassandim, H.M.; Shafie-khah, M.; Catalão, J.P. Rooftop photovoltaic parking lots to support electric vehicles charging: A comprehensive survey. Int. J. Electr. Power Energy Syst. 2021, 133, 107274. [Google Scholar] [CrossRef]
  8. Dik, A.; Omer, S.; Boukhanouf, R. Electric Vehicles: V2G for Rapid, Safe, and Green EV Penetration. Energies 2022, 15, 803. [Google Scholar] [CrossRef]
  9. Economist. A Lack of Chargers Could Stall the Electric-Vehicle Revolution. 2021. Available online: https://www.economist.com/business/a-lack-of-chargers-could-stall-the-electric-vehicle-revolution/21806663 (accessed on 12 January 2022).
  10. GOV.UK. PM to Announce Electric Vehicle Revolution. 2021. Available online: https://www.gov.uk/government/news/pm-to-announce-electric-vehicle-revolution (accessed on 27 January 2022).
  11. Funke, S.Á.; Sprei, F.; Gnann, T.; Plötz, P. How much charging infrastructure do electric vehicles need? A review of the evidence and international comparison. Transp. Res. Part D Transp. Environ. 2019, 77, 224–242. [Google Scholar] [CrossRef]
  12. Nicholas, M.; Lutsey, N. Quantifying the Electric Vehicle Charging Infrastructure Gap in the United Kingdom; ICCT: London, UK, 2020. [Google Scholar]
  13. Dreisbusch, M.; Mang, S.; Ried, S.; Kellerer, F.; Pfab, X. Regulation of Grid-Efficient Charging from the User’s Perspective; MTZ Worldwide: Wiesbaden, Germany, 2020; Volume 81, pp. 66–70. [Google Scholar]
  14. Engel, H.; Hensley, R.; Knupfer, S.; Sahdev, S. The Potential Impact of Electric Vehicles on Global Energy Systems; McKinsey Center for Future Mobility: Atlanta, GA, USA, 2018. [Google Scholar]
  15. Fachrizal, R.; Shepero, M.; Åberg, M.; Munkhammar, J. Optimal PV-EV sizing at solar powered workplace charging stations with smart charging schemes considering self-consumption and self-sufficiency balance. Appl. Energy 2021, 307, 118139. [Google Scholar] [CrossRef]
  16. Bhatti, A.R.; Salam, Z.; Aziz, M.J.B.A.; Yee, K.P. A critical review of electric vehicle charging using solar photovoltaic. Int. J. Energy Res. 2016, 40, 439–461. [Google Scholar] [CrossRef]
  17. Alkawsi, G.; Baashar, Y.; Abbas U, D.; Alkahtani, A.A.; Tiong, S.K. Review of Renewable Energy-Based Charging Infrastructure for Electric Vehicles. Appl. Sci. 2021, 11, 3847. [Google Scholar] [CrossRef]
  18. Gupta, J.; Singh, B.; Kushwaha, R. A Rooftop Solar PV Assisted On-Board Enhanced Power Quality Charging System for E-Rickshaw. In 2020 International Conference on Power, Instrumentation, Control and Computing (PICC); IEEE: Piscataway, NJ, USA, 2020. [Google Scholar]
  19. Martin, H.; Buffat, R.; Bucher, D.; Hamper, J.; Raubal, M. Using rooftop photovoltaic generation to cover individual electric vehicle demand—A detailed case study. Renew. Sustain. Energy Rev. 2022, 157, 111969. [Google Scholar] [CrossRef]
  20. Love, J.; Smith, A.Z.; Watson, S.; Oikonomou, E.; Summerfield, A.; Gleeson, C.; Biddulph, P.; Chiu, L.F.; Wingfield, J.; Martin, C.; et al. The addition of heat pump electricity load profiles to GB electricity demand: Evidence from a heat pump field trial. Appl. Energy 2017, 204, 332–342. [Google Scholar] [CrossRef]
  21. Renault. The Energy Efficiency of An Electric Car Motor; Groupe Renault: Boulogne-Billancourt, France, 2021; Available online: https://www.renaultgroup.com/en/news-on-air/news/the-energy-efficiency-of-an-electric-car-motor/ (accessed on 12 January 2022).
  22. European Commission. Directive 2010/31/EU of the European Parliament and of the Council of 19 May 2010 on the Energy Performance of Buildings. Amended by: Directive (EU) 2018/844 of the European Parliament and of the Council of 30 May 2018 and Regulation (EU) 2018/1999 of the European Parliament and of the Council of 11 December 2018; Office for Official Publications of the European Communities: Luxembourg, 2018. [Google Scholar]
  23. Angelopoulos, A.; Ktena, A.; Manasis, C.; Voliotis, S. Impact of a Periodic Power Source on a RES Microgrid. Energies 2019, 12, 1900. [Google Scholar] [CrossRef] [Green Version]
  24. Mele, E.D.; Elias, C.; Ktena, A. Machine Learning Platform for Profiling and Forecasting at Microgrid Level. Electr. Control. Commun. Eng. 2019, 15, 21–29. [Google Scholar] [CrossRef] [Green Version]
  25. Schlachtberger, D.P.; Brown, T.; Schramm, S.; Greiner, M. The benefits of cooperation in a highly renewable European electricity network. Energy 2017, 134, 469–481. [Google Scholar] [CrossRef] [Green Version]
  26. Cebulla, F.; Naegler, T.; Pohl, M. Electrical energy storage in highly renewable European energy systems: Capacity requirements, spatial distribution, and storage dispatch. J. Energy Storage 2017, 14, 211–223. [Google Scholar] [CrossRef] [Green Version]
  27. EEE. Residential Building Electrification in California. Consumer Economics, Greenhouse Gases and Grid Impacts; Energy and Environmental Economics, Inc.: San Francisco, CA, USA, 2019. [Google Scholar]
  28. Protopapadaki, C.; Saelens, D. Heat pump and PV impact on residential low-voltage distribution grids as a function of building and district properties. Appl. Energy 2017, 192, 268–281. [Google Scholar] [CrossRef]
  29. Bagalini, V.; Zhao, B.Y.; Wang, R.Z.; Desideri, U. Solar PV-Battery-Electric Grid-Based Energy System for Residential Applications: System Configuration and Viability. Research 2019, 2019, 3838603. [Google Scholar] [CrossRef] [Green Version]
  30. Sørensen, Å.L.; Lindberg, K.B.; Sartori, I.; Andresen, I. Analysis of residential EV energy flexibility potential based on real-world charging reports and smart meter data. Energy Build. 2021, 241, 110923. [Google Scholar] [CrossRef]
  31. Doroudchi, E.; Alanne, K.; Okur, Ö.; Kyyrä, J.; Lehtonen, M. Approaching net zero energy housing through integrated EV. Sustain. Cities Soc. 2018, 38, 534–542. [Google Scholar] [CrossRef] [Green Version]
  32. EU. 2021/0197 (COD); Proposal for a Regulation of the European Parliament and of the Council Amending Regulation (EU) 2019/631 as Regards Strengthening the CO2 Emission Performance Standards for New Passenger Cars and New Light Commercial Vehicles in Line with the Union’s Increased Climate Ambition. EU: Brussels, Belgium, 2021.
  33. The White House. President Biden Outlines Target of 50% Electric Vehicle Sales Share in 2030 to Unleash Full Economic Benefits of Build Back Better Agenda and Advance Smart Fuel Efficiency and Emission Standards. 2021. Available online: https://www.whitehouse.gov/briefing-room/statements-releases/2021/08/05/fact-sheet-president-biden-announces-steps-to-drive-american-leadership-forward-on-clean-cars-and-trucks/ (accessed on 18 January 2022).
  34. Zhen Huang, W.; Zaheeruddin, M.; Cho, S.H. Dynamic simulation of energy management control functions for HVAC systems in buildings. Energy Convers. Manag. 2006, 47, 926–943. [Google Scholar] [CrossRef]
  35. Stamatellos, G.; Zogou, O.; Stamatelos, A. Energy Performance Optimization of a House with Grid-Connected Rooftop PV Installation and Air Source Heat Pump. Energies 2021, 14, 740. [Google Scholar] [CrossRef]
  36. Zogou, O.; Stamatelos, A. Optimization of thermal performance of a building with ground source heat pump system. Energy Convers. Manag. 2007, 48, 2853–2863. [Google Scholar] [CrossRef]
  37. Safa, A.A.; Fung, A.S.; Kumar, R. Comparative thermal performances of a ground source heat pump and a variable capacity air source heat pump systems for sustainable houses. Appl. Therm. Eng. 2015, 81, 279–287. [Google Scholar] [CrossRef]
  38. NN. TRNSYS 16 Manual; Solar Energy Laboratory, University of Wisconsin-Madison: Madison, WI, USA, 2005. [Google Scholar]
  39. Nayak, A.K.; Hagishima, A. Modification of building energy simulation tool TRNSYS for modelling nonlinear heat and moisture transfer phenomena by TRNSYS/MATLAB integration. EDP Sci. 2020, 172, 25009. [Google Scholar] [CrossRef]
  40. Wang, L.; Gwilliam, J.; Jones, P. Case study of zero energy house design in UK. Energy Build. 2009, 41, 1215–1222. [Google Scholar] [CrossRef]
  41. Mazzeo, D.; Matera, N.; Cornaro, C.; Oliveti, G.; Romagnoni, P.; De Santoli, L. EnergyPlus, IDA ICE and TRNSYS predictive simulation accuracy for building thermal behaviour evaluation by using an experimental campaign in solar test boxes with and without a PCM module. Energy Build. 2020, 212, 109812. [Google Scholar] [CrossRef]
  42. Almeida, P.; Carvalho, M.J.; Amorim, R.; Mendes, J.F.; Lopes, V. Dynamic testing of systems—Use of TRNSYS as an approach for parameter identification. Sol. Energy 2014, 104, 60–70. [Google Scholar] [CrossRef] [Green Version]
  43. Chargui, R.; Sammouda, H. Modeling of a residential house coupled with a dual source heat pump using TRNSYS software. Energy Convers. Manag. 2014, 81, 384–399. [Google Scholar] [CrossRef]
  44. Safa, A.A.; Fung, A.S.; Kumar, R. Heating and cooling performance characterisation of ground source heat pump system by testing and TRNSYS simulation. Renew. Energy 2015, 83, 565–575. [Google Scholar] [CrossRef]
  45. Neymark, J.; Judkoff, R.; Knabe, G.; Le, H.T.; Dürig, M.; Glass, A.; Zweifel, G. Applying the building energy simulation test (BESTEST) diagnostic method to verification of space conditioning equipment models used in whole-building energy simulation programs. Energy Build. 2002, 34, 917–931. [Google Scholar] [CrossRef]
  46. Standard 140-2001; Standard Method of Test for the Evaluation of Building Energy Analysis Computer Programs. ASHRAE: Atlanta, GA, USA, 2001.
  47. Trane. Picco 6-16 kW Air-to-Water Heat Pumps with Inverter-Driven Scroll Compressors 2019. Available online: https://www.trane.com/commercial/europe/no/en/products-systems/equipment/heat-pumps/air-to-water/Picco-heat-pump.html (accessed on 12 November 2021).
  48. NN. T.E.S.S. Component Libraries for TRNSYS; Version 2.0. User’s Manual; University of Wisconsin: Madison, WI, USA, 2004; Available online: http://www.tess-inc.com/services/software (accessed on 12 December 2020).
  49. Saldaña, G.; San Martín, J.I.; Zamora, I.; Asensio, F.J.; Oñederra, O. Analysis of the Current Electric Battery Models for Electric Vehicle Simulation. Energies 2019, 12, 2750. [Google Scholar] [CrossRef] [Green Version]
  50. Meng, J.; Luo, G.; Ricco, M.; Swierczynski, M.; Stroe, D.I.; Teodorescu, R. Overview of Lithium-Ion Battery Modeling Methods for State-of-Charge Estimation in Electrical Vehicles. Appl. Sci. 2018, 8, 659. [Google Scholar] [CrossRef] [Green Version]
  51. Hussein, A.A.; Batarseh, I. An Overview of Generic Battery Models. In 2011 IEEE Power and Energy Society General Meeting; IEEE: Piscataway, NY, USA, 2011. [Google Scholar]
  52. AE. AE-A-Series EV Charger. 2022. Available online: https://www.ae-electronics.com/ (accessed on 12 November 2021).
  53. Sharp. 370 Wp/Mono: NUJC370 Data Sheet. 2020. Available online: https://www.sharp.co.uk/cps/rde/xbcr/documents/documents/Marketing/Datasheet/2004_NUAC300B_Mono_Datasheet_EN.pdf (accessed on 18 January 2022).
  54. De Soto, W.; Klein, S.A.; Beckman, W.A. Improvement and validation of a model for photovoltaic array performance. Sol. Energy 2006, 80, 78–88. [Google Scholar] [CrossRef]
  55. California_ISO. What the Duck Curve Tells Us about Managing A Green Grid. 2016. Available online: http://www.caiso.com/Documents/FlexibleResourcesHelpRenewables_FastFacts.pdf (accessed on 12 December 2021).
  56. ANSI/ASHRAE Standard 62.2-2004; Ventilation and Acceptable Indoor Air Quality in Low-rise Residential Buildings. ASHRAE: Washington, DC, USA, 2004; p. 18.
  57. STECA. StecaGrid-10000+ 3-ph Technical-Data. 2021. Available online: https://www.photovoltaic.gr/public/media/upload-files/Steca/StecaGrid_8000plus_3ph_10000plus_3ph_specification_EN_3.pdf (accessed on 12 January 2022).
Figure 1. Layout drawing of the house employed in the simulations: Plan of ground level, first levels, section AA (reduced scale), and plan of the rooftop photovoltaic (PV) installation. Dimensions in meters (m). Insulation in blue color. Openings in green color.
Solar 02 00011 g001
Figure 2. TRNSYS project file components (Types) of the simulated system.
Solar 02 00011 g002
Figure 3. Monthly electricity production and consumption during one full year.
Solar 02 00011 g003
Figure 4. Monthly summaries of heat pump electricity consumption, heat from source, and heat to load. Cooling mode prevails during months May to October, as seen by the negative (cooling) kWh.
Solar 02 00011 g004
Figure 5. Monthly variation in PV electricity production and the consumption of the house and owners’ cars compared with the trend in the monthly electricity consumption and photovoltaic production of Greece during 2021.
Solar 02 00011 g005
Figure 6. Monthly variation in net electric power sent to the network. Total monthly electricity demand for Greece (2021) is shown for comparison.
Solar 02 00011 g006
Figure 7. Average daily variation in the Greek system electricity load curve during weekdays and weekends during the first 10 days of January 2021. For comparison, the load curves without the contribution from Photovoltaics is drawn in the same figure.
Solar 02 00011 g007
Figure 8. Ambient temperature, room temperature, heat pump consumption, and PV inverter outlet power, during the first 10 days of January. The room thermostat is set to 20 °C. The battery starts from zero charging levels and reaches only 25% of its total capacity due to the significant power requirement for the cars’ and the heat pump’s operation.
Solar 02 00011 g008
Figure 9. Ambient conditions, room temperature, heat pump electricity consumption, and electric power at the PV inverter outlet during two consecutive days in January, starting at midnight.
Solar 02 00011 g009
Figure 10. Average daily variation in the Greek system electricity load curve during weekdays and weekends during the first half of May 2021. For comparison, the load curves without the contribution from Photovoltaics is drawn in the same figure.
Solar 02 00011 g010
Figure 11. Transient performance of the system during the first half of May. As the cooling season starts, the room thermostat is set to 25 °C. The battery that was charged up to 80% of its capacity starts to discharge due to the onset of space cooling after 3120 h.
Solar 02 00011 g011
Figure 12. Ambient conditions, room temperature, heat pump electricity consumption, and electric power at the PV inverter outlet, during two consecutive days in mid-May, starting at midnight.
Solar 02 00011 g012
Figure 13. Average daily variation in the Greek system electricity load curve during weekdays and weekends during the first 10 days of July 2021 (a heat wave episode was recorded in this period). For comparison, the load curves without the contribution from Photovoltaics is drawn in the same figure.
Solar 02 00011 g013
Figure 14. Transient performance of the system during the first 10 days of July. The room thermostat, which controls the heat pump operation, is set to 25 °C. The battery starts at high charging levels due to the insignificant consumption of the heat pump during the neutral season and drops to 25% of its total capacity due to the significant power requirement for the car and the heat pump cooling operation.
Solar 02 00011 g014
Figure 15. Ambient conditions, room temperature, heat pump electricity consumption, and electric power at the PV inverter outlet, during two consecutive days in mid-July, starting at midnight.
Solar 02 00011 g015
Figure 16. Average daily variation in the Greek system electricity load curve during weekdays and weekends during mid-November 2021. For comparison, the load curves without the contribution from Photovoltaics is drawn in the same figure.
Solar 02 00011 g016
Figure 17. Transient performance of the system during 10 days in mid-November. The battery starts at low charging levels due to high heat pump consumption during the cooling season; however, it cannot significantly increase its charging state because of low irradiance on these cloudy days.
Solar 02 00011 g017
Figure 18. Ambient conditions, room temperature, heat pump electricity consumption, and electric power at the PV inverter outlet during two consecutive days in mid-November, starting at midnight.
Solar 02 00011 g018
Figure 19. Comparison of the total annual amounts of electrical energy imported and exported to the grid with one or two EVs in the household.
Solar 02 00011 g019
Figure 20. Power levels imported or exported to the electricity grid in the course of the year.
Solar 02 00011 g020
Figure 21. Power levels imported or exported to the electricity grid in the course of the year, without the car battery connected during the day.
Solar 02 00011 g021
Figure 22. Comparison of the electrical energy monthly in and out of the house with one or two EVs in the household.
Solar 02 00011 g022
Table 1. Values for the five-parameter model used in Type 194.
ParameterIL,refI0,refRSRSHa
Value9.705 A0.2991 nA0.06054 Ω5000 Ω2.664
Table 2. Technical data of the 370 Wp monocrystalline silicon PV modules NU JC370, as used in Type 194.
PV Module ParameterValueComments
ISC at STC1154 AShort circuit current
VOC at STC40.81 VOpen circuit voltage
IMPP at STC10.75 ACurrent at max power point
VMPP at STC34.42 VVoltage at max power point
Temp. coefficient of ISC (STC)0.057%/KαISC
Temp. coefficient of VOC (STC)−0.263%/KβVOC
Number of cells wired in series2 strings × 60modules
Module temperature at NOCT318 K
Ambient temperature at NOCT293 K
Module area1.85 m2
Module efficiency20.0%
Publisher’s Note: MDPI stays neutral with regard to jurisdictional claims in published maps and institutional affiliations.

