Article

Systemic Inflammasome Biomarkers as Predictors of Diabetic Retinopathy Progression: Evidence from a Pilot Study

1
Buchanan Ocular Therapeutics Unit, Department of Ophthalmology, New Zealand National Eye Centre, University of Auckland, Auckland 1023, New Zealand
2
Department of Surgery, North Shore Hospital, Te Whatu Ora—Waitemata, Auckland 0610, New Zealand
3
Department of Medicine, Faculty of Medical and Health Sciences, The University of Auckland, Auckland 1023, New Zealand
*
Author to whom correspondence should be addressed.
Future Pharmacol. 2023, 3(3), 612-624; https://doi.org/10.3390/futurepharmacol3030039
Submission received: 1 July 2023 / Revised: 28 August 2023 / Accepted: 29 August 2023 / Published: 7 September 2023

Abstract

:
The nucleotide-binding oligomerization domain (NOD)-like receptor (NLR) protein 3 (NLRP3) inflammasome pathway is believed to mediate chronic inflammation in diabetic retinopathy (DR); however, its impact on the progression of DR remains to be elucidated. Therefore, the primary aim of this pilot study was to determine whether systemic inflammasome biomarkers interleukin (IL)-1β and IL-18 can be used to predict DR progression. DR screening results were analyzed against weight, level of glycated hemoglobin (HbA1c), and plasma levels of inflammasome biomarkers (IL-1β and IL-18), as well as general inflammation markers (C-reactive protein (CRP), IL-6, IL-8, tumor necrosis factor-alpha (TNF-α), and vascular endothelial growth factor (VEGF)) in patients with type 2 diabetes at baseline and 1 year post-bariatric surgery. Cross-sectional analysis demonstrated that weight, HbA1c, CRP, and IL-18 did not correlate with DR severity. The progressed group showed a higher relative change in IL-18 and CRP levels compared to the stable and regressed groups. Furthermore, relative changes in plasma CRP levels correlated with those of IL-18. Although further validation with larger cohorts is necessary, this pilot study supports the hypothesis that systemic inflammasome activation is associated with DR progression.

1. Introduction

Diabetic retinopathy (DR) is a common cause of vision loss in patients with diabetes, affecting approximately 22.27% (103.12 million) of the global diabetic population in 2020. This number is expected to increase further, reaching 160.5 million by 2024 [1]. Large clinical trials have shown that current strategies for managing DR, such as controlling hyperglycemia, hypertension, and dyslipidemia, can slow down, though not completely halt, disease progression over an extended period [2,3,4,5,6,7,8,9,10]. Furthermore, DR progression is more likely to occur in individuals with long-term diabetes, poor control of diabetes risk factors, and more severe existing DR at the time of treatment initiation [2,3,4,5,6,7,8,9,10]. While intraocular treatments, such as pan-retinal-photocoagulation (PRP) and vascular endothelial growth factor (VEGF) inhibitors, are useful in stopping active vascular leakage in the retina, they do not prevent the emergence of new leaks or progression of disrupted vascular integrity in DR [11,12]. In order to innovate novel interventions that can effectively stop disease progression, the mechanisms driving DR need to be identified and targeted.
Recent studies suggest that DR progression is associated with the nucleotide-binding oligomerization domain (NOD)-like receptor (NLR) protein 3 (NLRP3) inflammasome pathway, a component of the innate immune system found dysregulated in diabetes, contributing to chronic low-grade inflammation [13,14,15]. Activation of the inflammasome has been observed in human post-mortem retina even before the development of clinical DR signs, and levels of inflammasome-related proteins are heightened in the vitreous of patients with more severe DR [13]. Furthermore, targeting the inflammasome pathway has been shown to be protective in in vitro, in vivo, and ex vivo DR models [16,17,18,19]. In fact, fenofibrate, an oral medication for treating abnormal blood lipid levels, has been reported to reduce DR progression by modulating NLRP3 inflammasome activation [20]. Its benefit in halting DR progression was initially brought to light by the Fenofibrate Intervention and Event Lowering in Diabetes (FIELD) study [4], a multinational, randomized trial of 9795 patients with type 2 diabetes mellitus (T2DM). This study demonstrated a diminished requirement for laser photocoagulation in the group treated with fenofibrate as opposed to the placebo group. This was further confirmed in the Action to Control Cardiovascular Risk in Diabetes (ACCORD) study [9], which recruited patients with T2DM and existing cardiovascular risks. It showed a significant reduction in the rate of DR progression in the group taking a combination therapy of fenofibrate and simvastatin, compared to the group taking placebo and simvastatin. However, the ACCORD Follow-On Eye (ACCORDION) study found that the risks between the two groups eventually equalized when fenofibrate was stopped after the study was terminated, suggesting that continued fenofibrate was required to maintain the beneficial effect. Together with the role of fenofibrate in modulating NLRP3 inflammasome activation, these findings suggest continued control of inflammasome activation is essential to prevent DR progression.
Activation of NLRP3 inflammasome results in the release of pro-inflammatory cytokines, interleukin (IL)-1β, and IL-18, which promote downstream inflammatory cascades that compromise the neurovascular integrity of the retina [21]. Under high glucose, IL-1β has been shown to accelerate retinal capillary endothelial cell apoptosis by increasing NF-ĸB activation and also promoteoxidative stress and inflammation by inducing mitochondrial dysfunction [22]. Although clinical studies have demonstrated that inhibition of IL-1β using anakinra, an IL-1 receptor antagonist, in patients with T2DM, improved glycemic control and insulin production [23,24], the use of systemic canakinumab, a monoclonal antibody targeting IL-1β, demonstrated no statistically significant improvement in neovascularization and macular edema in patients with DR [25]. On the other hand, prospective studies in middle-aged men have shown that circulating IL-18 is a strong predictor of coronary heart disease [26,27]. It is also a biomarker in systemic juvenile idiopathic arthritis [28] and nephropathy in patients with T2DM [29]. While some studies have suggested that recombinant IL-18 can prevent choroidal neovascularization (CNV), the hallmark in wet age-related macular degeneration (AMD) [30,31], others have demonstrated that IL-18 is not anti-angiogenic and therefore not a suitable therapy for CNV in wet AMD [32]. Although IL-18 is increased in the plasma and vitreous of patients with more severe DR [14], the role of IL-18 in DR has remained elusive and requires further investigation.
Our recent systematic literature review demonstrated a correlation between systemic and vitreous inflammasome biomarkers but also identified a significant lack of longitudinal studies [14]. Therefore, the primary objective of this pilot study was to determine whether systemic inflammasome biomarker levels can be used to predict DR severity and progression. We examined this in patients with T2DM with varying grades of pre-surgery DR who underwent bariatric surgery. The bariatric cohort was selected because the DR phenotype could regress, remain stable, or progress following surgery, allowing for multidirectional assessment of the role of the inflammasome in DR progression. As inflammasome biomarkers, IL-1β and IL-18, are not part of a routine blood test. Therefore, the secondary objective was to investigate whether C-reactive protein (CRP), a commonly measured general marker of systemic inflammation, could be used as a surrogate inflammasome biomarker to predict DR severity and progression. In cross-sectional and case-control studies, higher blood CRP levels have been found in patients with more severe DR. Furthermore, patients treated with canakinumab have shown a greater reduction in cardiovascular risks if they achieved lower CRP levels, suggesting that CRP could be a suitable indicator for inflammasome activation [33]. DR screening results were analyzed in relation to weight, levels of glycated hemoglobin (HbA1c), and plasma levels of inflammasome biomarkers (IL-1β and IL-18), as well as general inflammation markers (CRP, IL-6, IL-8, tumor necrosis factor-alpha (TNF-α), and VEGF) in patients with T2DM at baseline and one year post-bariatric surgery.

2. Materials and Methods

2.1. Bariatric Surgery Cohort

Plasma samples were collected 1 week prior to surgery and 1 year post-surgery and frozen at −80 °C until required for further analysis. DR screening was performed by a registered ophthalmologist, and retinal screening data were extracted from clinical records. Pre-surgery retinal screening data were accepted up to 12 months prior to surgery. The 1 year post-surgical retinal screening data were accepted if they were recorded between 9 and 24 months post-surgery. There was no reported progression of other microvascular complications of diabetes within the study cohort [34].

2.2. Ethics

The original bariatric surgery study was a randomized clinical trial (NCT01486680) registered with the Australian New Zealand Clinical Trials Registry (ACTRN12611000751976) and approved by the New Zealand Regional Ethics Committee (NTY/11/07/082). The RCT commenced in September 2011 and completed recruitment in October 2014.

2.3. Participants

Inclusion criteria of participants in the original bariatric surgery study were: age 20–55 years, T2DM for at least 6 months, body mass index (BMI) of 35–65 kg/m2 for at least 5 years, being suitable for either of roux en Y gastric bypass (RYGB) or sleeve gastrectomy, able to give informed consent and committed to follow-up. Exclusion criteria included postprandial C peptide <350 pmol/L, pregnancy, type 1 diabetes or secondary diabetes, chronic pancreatitis, oral steroid therapy, current smoker, and those not suitable for general anesthesia.

2.4. DR Screening in New Zealand

DR screening was performed prior to surgery and 1 year post-surgery. The detailed screening procedure has previously been published [35]. DR was graded according to the New Zealand Diabetic Retinal Screening, Grading, Monitoring and Referral Guidance [36]. Based on retinal lesions captured in fundus photos, DR was graded as no DR (R0), minimal (R1), moderate (R2), severe (R3), and proliferative (R4) (Table 1). The retinopathy grade of the worse eye was used for analysis in this study.

2.5. Blood Collection

At each DR screening, blood samples were collected by a registered healthcare practitioner using a 22 G cannula into EDTA tubes, which were immediately inverted 10 times to ensure proper mixing with the anticoagulant. Following this, the plasma was isolated by centrifugation at 4 °C and 2000× g for 10 min, aliquoted into 1.5 mL tubes, and frozen at −80 °C until further analysis [37].

2.6. Luminex Multiplex Assay

Frozen plasma was thawed on ice and then centrifuged at 2000× g at 4 °C for 1 min to pellet unwanted debris [37]. Plasma levels of TNFα, IL-6, IL-8, IL-10, IL-18, IL-1β, and VEGF were assessed using a Luminex multiplex assay (Human Premixed Multi-Analyte Kit, #LXSAHM, R&D Systems, Minnneapolis, MN, USA) without diluting plasma samples. A separate kit was used to measure plasma CRP levels as it required a higher working dilution (1:200). Assay sensitivity was as follows: 0.8 pg/mL for IL-1β, 1.7 pg/mL for IL-6, 1.8 pg/mL for IL-8, 1.6 pg/mL for IL-10, 1.93 pg/mL for IL-18, 1.2 pg/mL for TNF-α, 2.1 pg/mL for VEGF, and 116 pg/mL for CRP. The assay was performed according to the manufacturer’s instructions [38]. Briefly, plasma samples were incubated with antibody-coated microparticles in the dark on a horizontal orbital microplate shaker at 800 rpm for 2 h, washed well with a wash buffer for 3 × 1 min on a shaker, and then incubated in a biotinylated-antibody cocktail in the dark for 1 h. Subsequently, each well was again washed with a wash buffer for 3 × 1 min on a shaker before incubating with phycoerythrin (PE)-conjugated streptavidin for 30 min. Lastly, each well was again washed with a wash buffer for 3 × 1 min on a shaker, and the microparticles in each well were resuspended in the wash buffer. The plate was read, and results were quantified based on fluorescence intensity (Luminex MAGPIX® Analyzer, Luminex, Austin, TX, USA).

2.7. Data Analysis

DR screening data and biomarker levels measured from plasma collected prior to surgery and 1 year post-surgery were pooled to assess the cross-sectional correlation between plasma biomarker levels and DR grades. Experimental data were analyzed using GraphPad Prism 9.3.1 (GraphPad Software, San Diego, CA, USA). A Kruskal–Wallis test was used for analysis, and multiple comparisons were corrected using Dunn’s statistical hypothesis testing. Patients were categorized into three groups (regressed, stable, or progressed) according to their DR screening results from pre-surgery and at 1 year post-surgery. Within each group, pre- and post-surgery biomarker levels were compared using a paired t-test. Between the groups, the change from pre- to post-surgery was investigated using one-way ANOVA and Dunnett’s multiple comparison test. The change in cytokine levels in those with and without DR post-surgery were compared using two-way ANOVA and Bonferroni’s multiple comparison test. A correlation between plasma CRP and inflammasome levels was assessed using simple linear regression. The significance of this correlation was assessed by computing Pearson’s correlation coefficient.

3. Results

3.1. Overall Patient Profile Pre-Surgery and 12 Months Post-Surgery

Overall, the common markers of successful bariatric surgery, weight and HbA1c, were significantly reduced at 1 year post-surgery compared to pre-surgery. CRP, a general inflammation marker, was significantly reduced (p < 0.0001), while plasma IL-18 showed no significant changes (p = 0.51) between pre- and post-surgery levels (Table 2). Since plasma levels of TNF-α, IL-6, IL-8, VEGF, IL-1β, and IL-10 were found to be below the detection threshold, they were excluded from further analysis (Table 2).

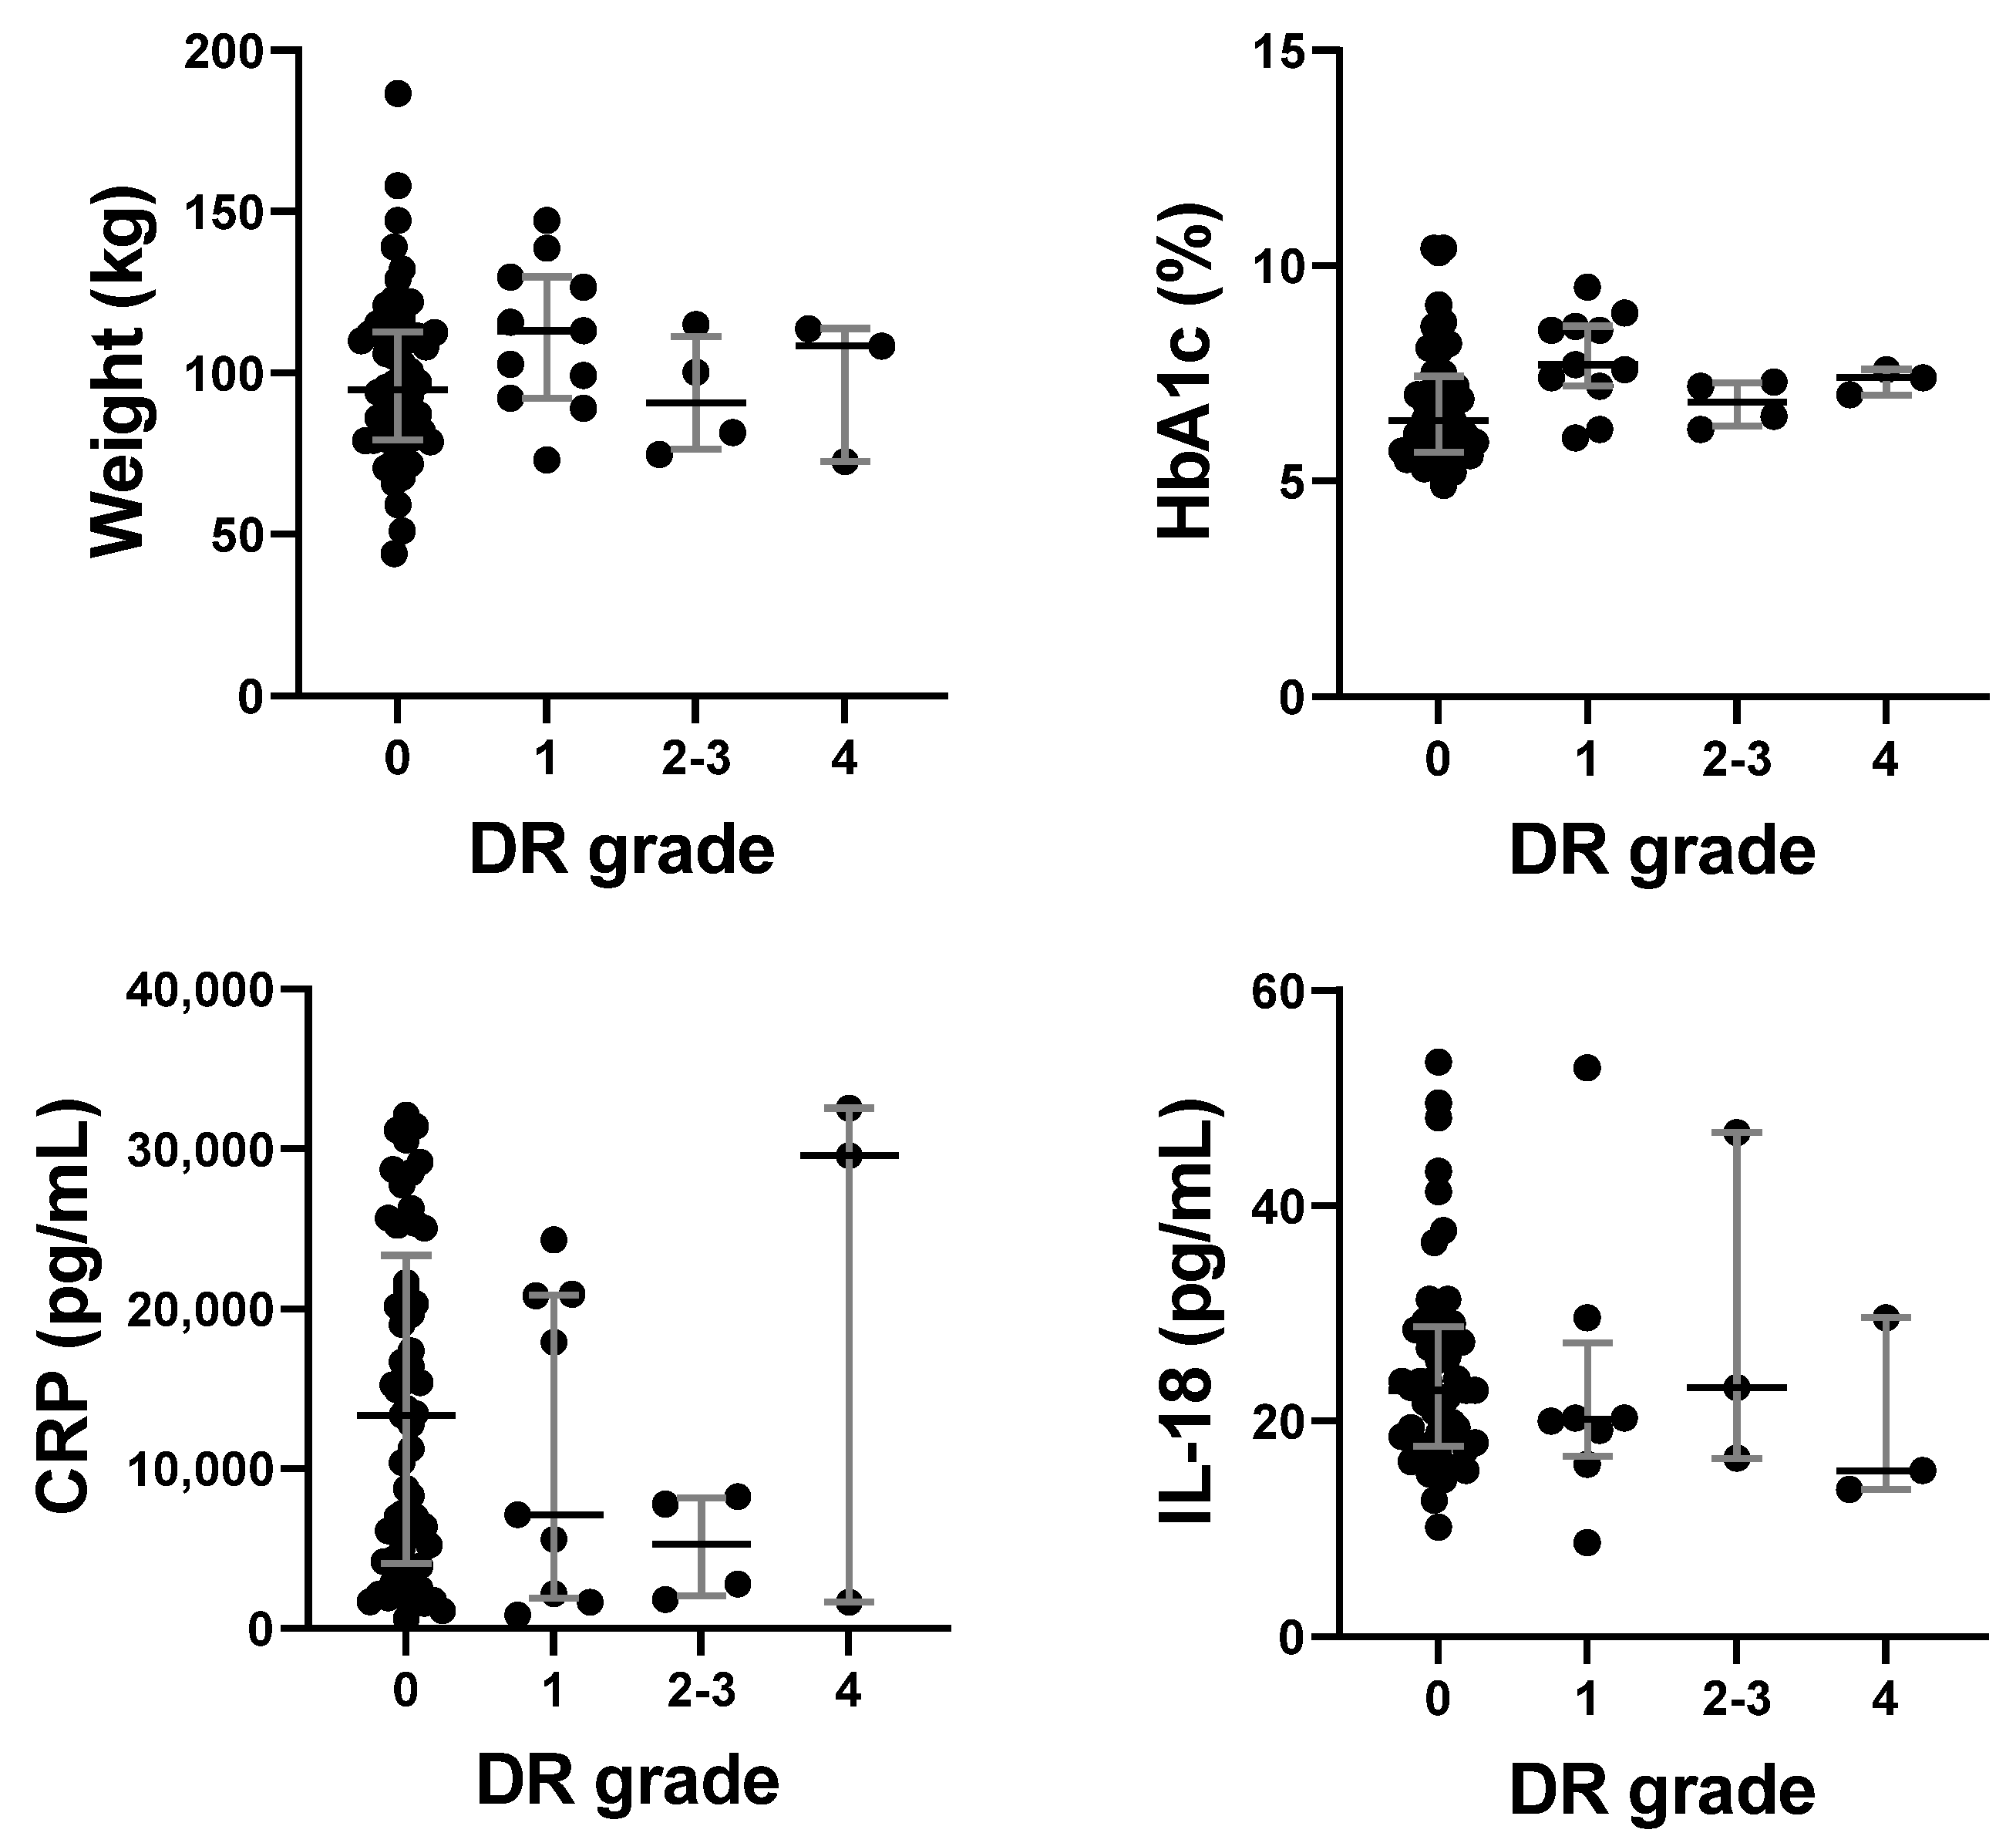
3.2. Inflammasome, Inflammation, and Clinical Biomarker Levels Did Not Correlate with DR Severity Cross-Sectionally

First, we investigated the cross-sectional correlation between inflammasome biomarker levels and DR severity. For cross-sectional analysis, levels of biomarkers pre-surgery and 1 year post-surgery were pooled and plotted against the DR grades (Figure 1). The common markers of successful bariatric surgery, including weight and HbA1c, did not correlate with DR severity. CRP, a general inflammation marker, and IL-18, a marker for inflammasome activation, did not correlate with DR severity.

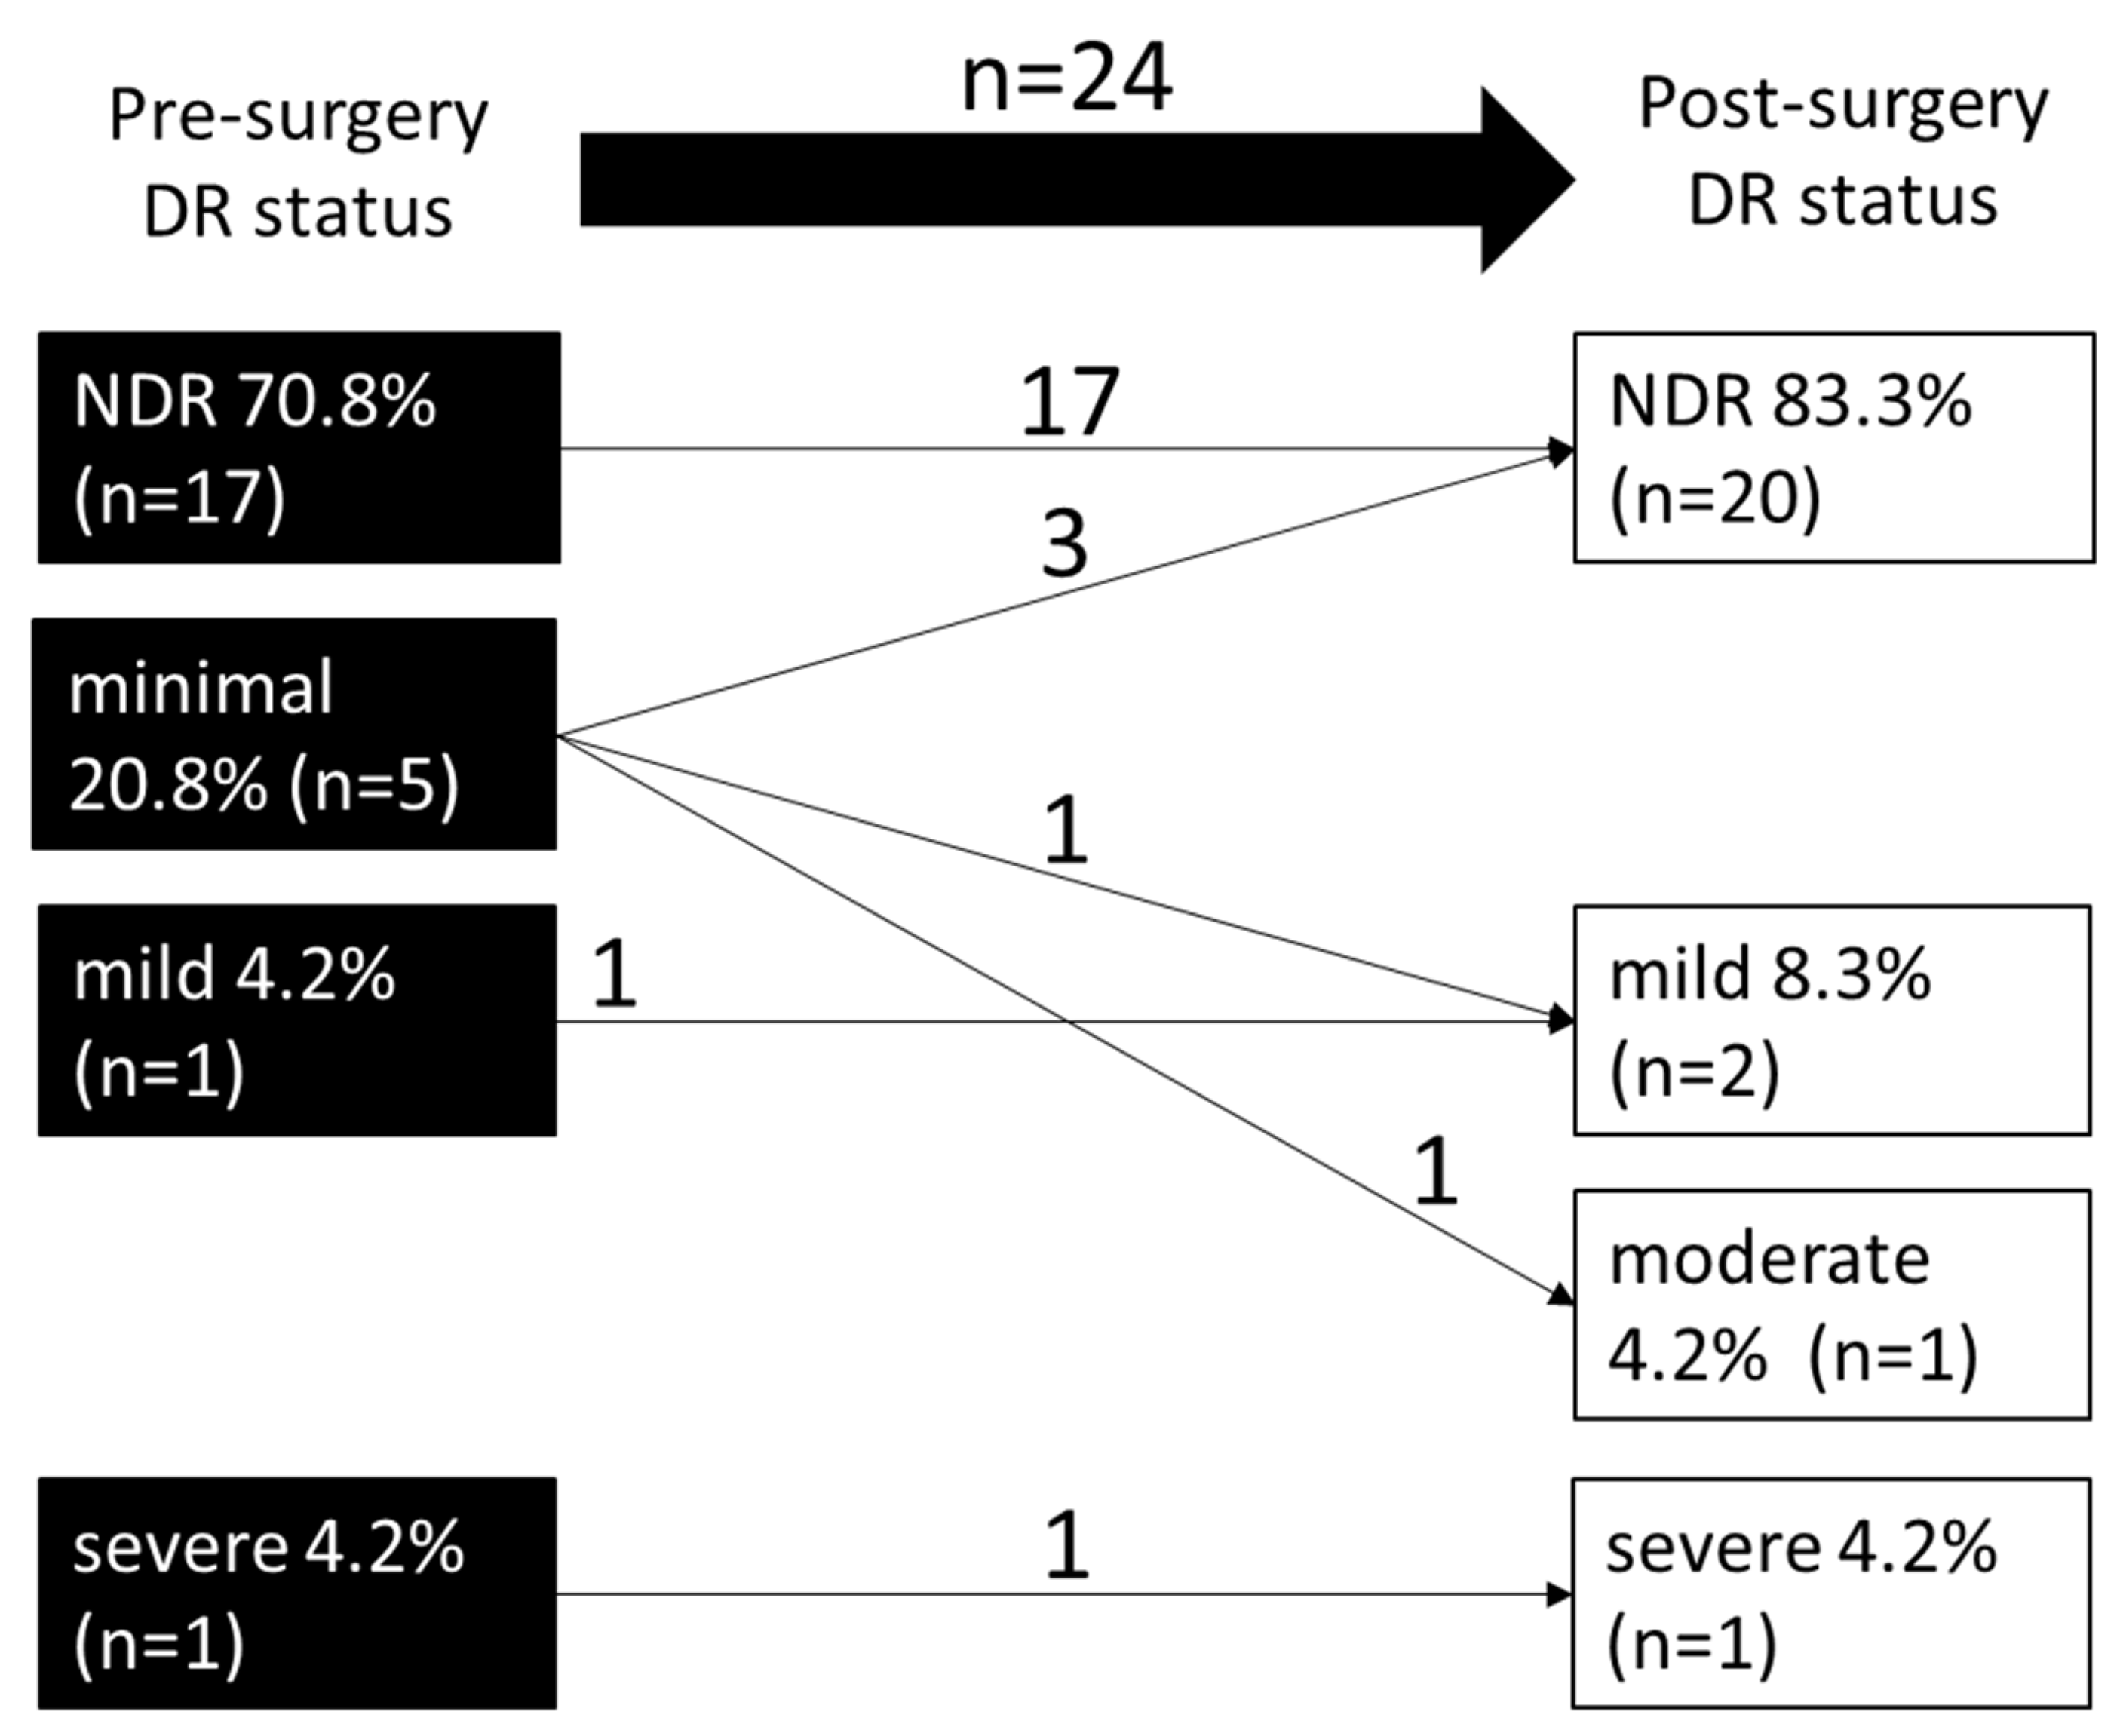
3.3. Change in DR Severity from Baseline to 1 Year Post-Surgery

Complete datasets, including pre-surgery and 1 year post-surgery DR screening results as well as plasma samples, were available for 24 patients.
In order to evaluate whether systemic inflammasome markers correlated with DR progression, patients were stratified into progressed, stable, and regressed groups based on the change in DR severity from pre-surgery to 1 year post-surgery (Figure 2). At pre-surgery, 17/24 (70.8%) patients had no DR (NDR), and none of them developed new DR post-surgery. Only 1/24 (4.2%) of patients with mild DR pre-surgery did not progress post-surgery. Only 1/24 (4.2%) of patients with severe DR pre-surgery did not progress post-surgery. These 19 patients were placed in the stable group. Of the 5/24 (20.8%) patients who had minimal DR pre-surgery, 3 regressed to NDR and were placed in the regressed group. Finally, one progressed from minimal to mild DR, and one progressed from minimal to moderate DR; these two were placed in the progressed group.

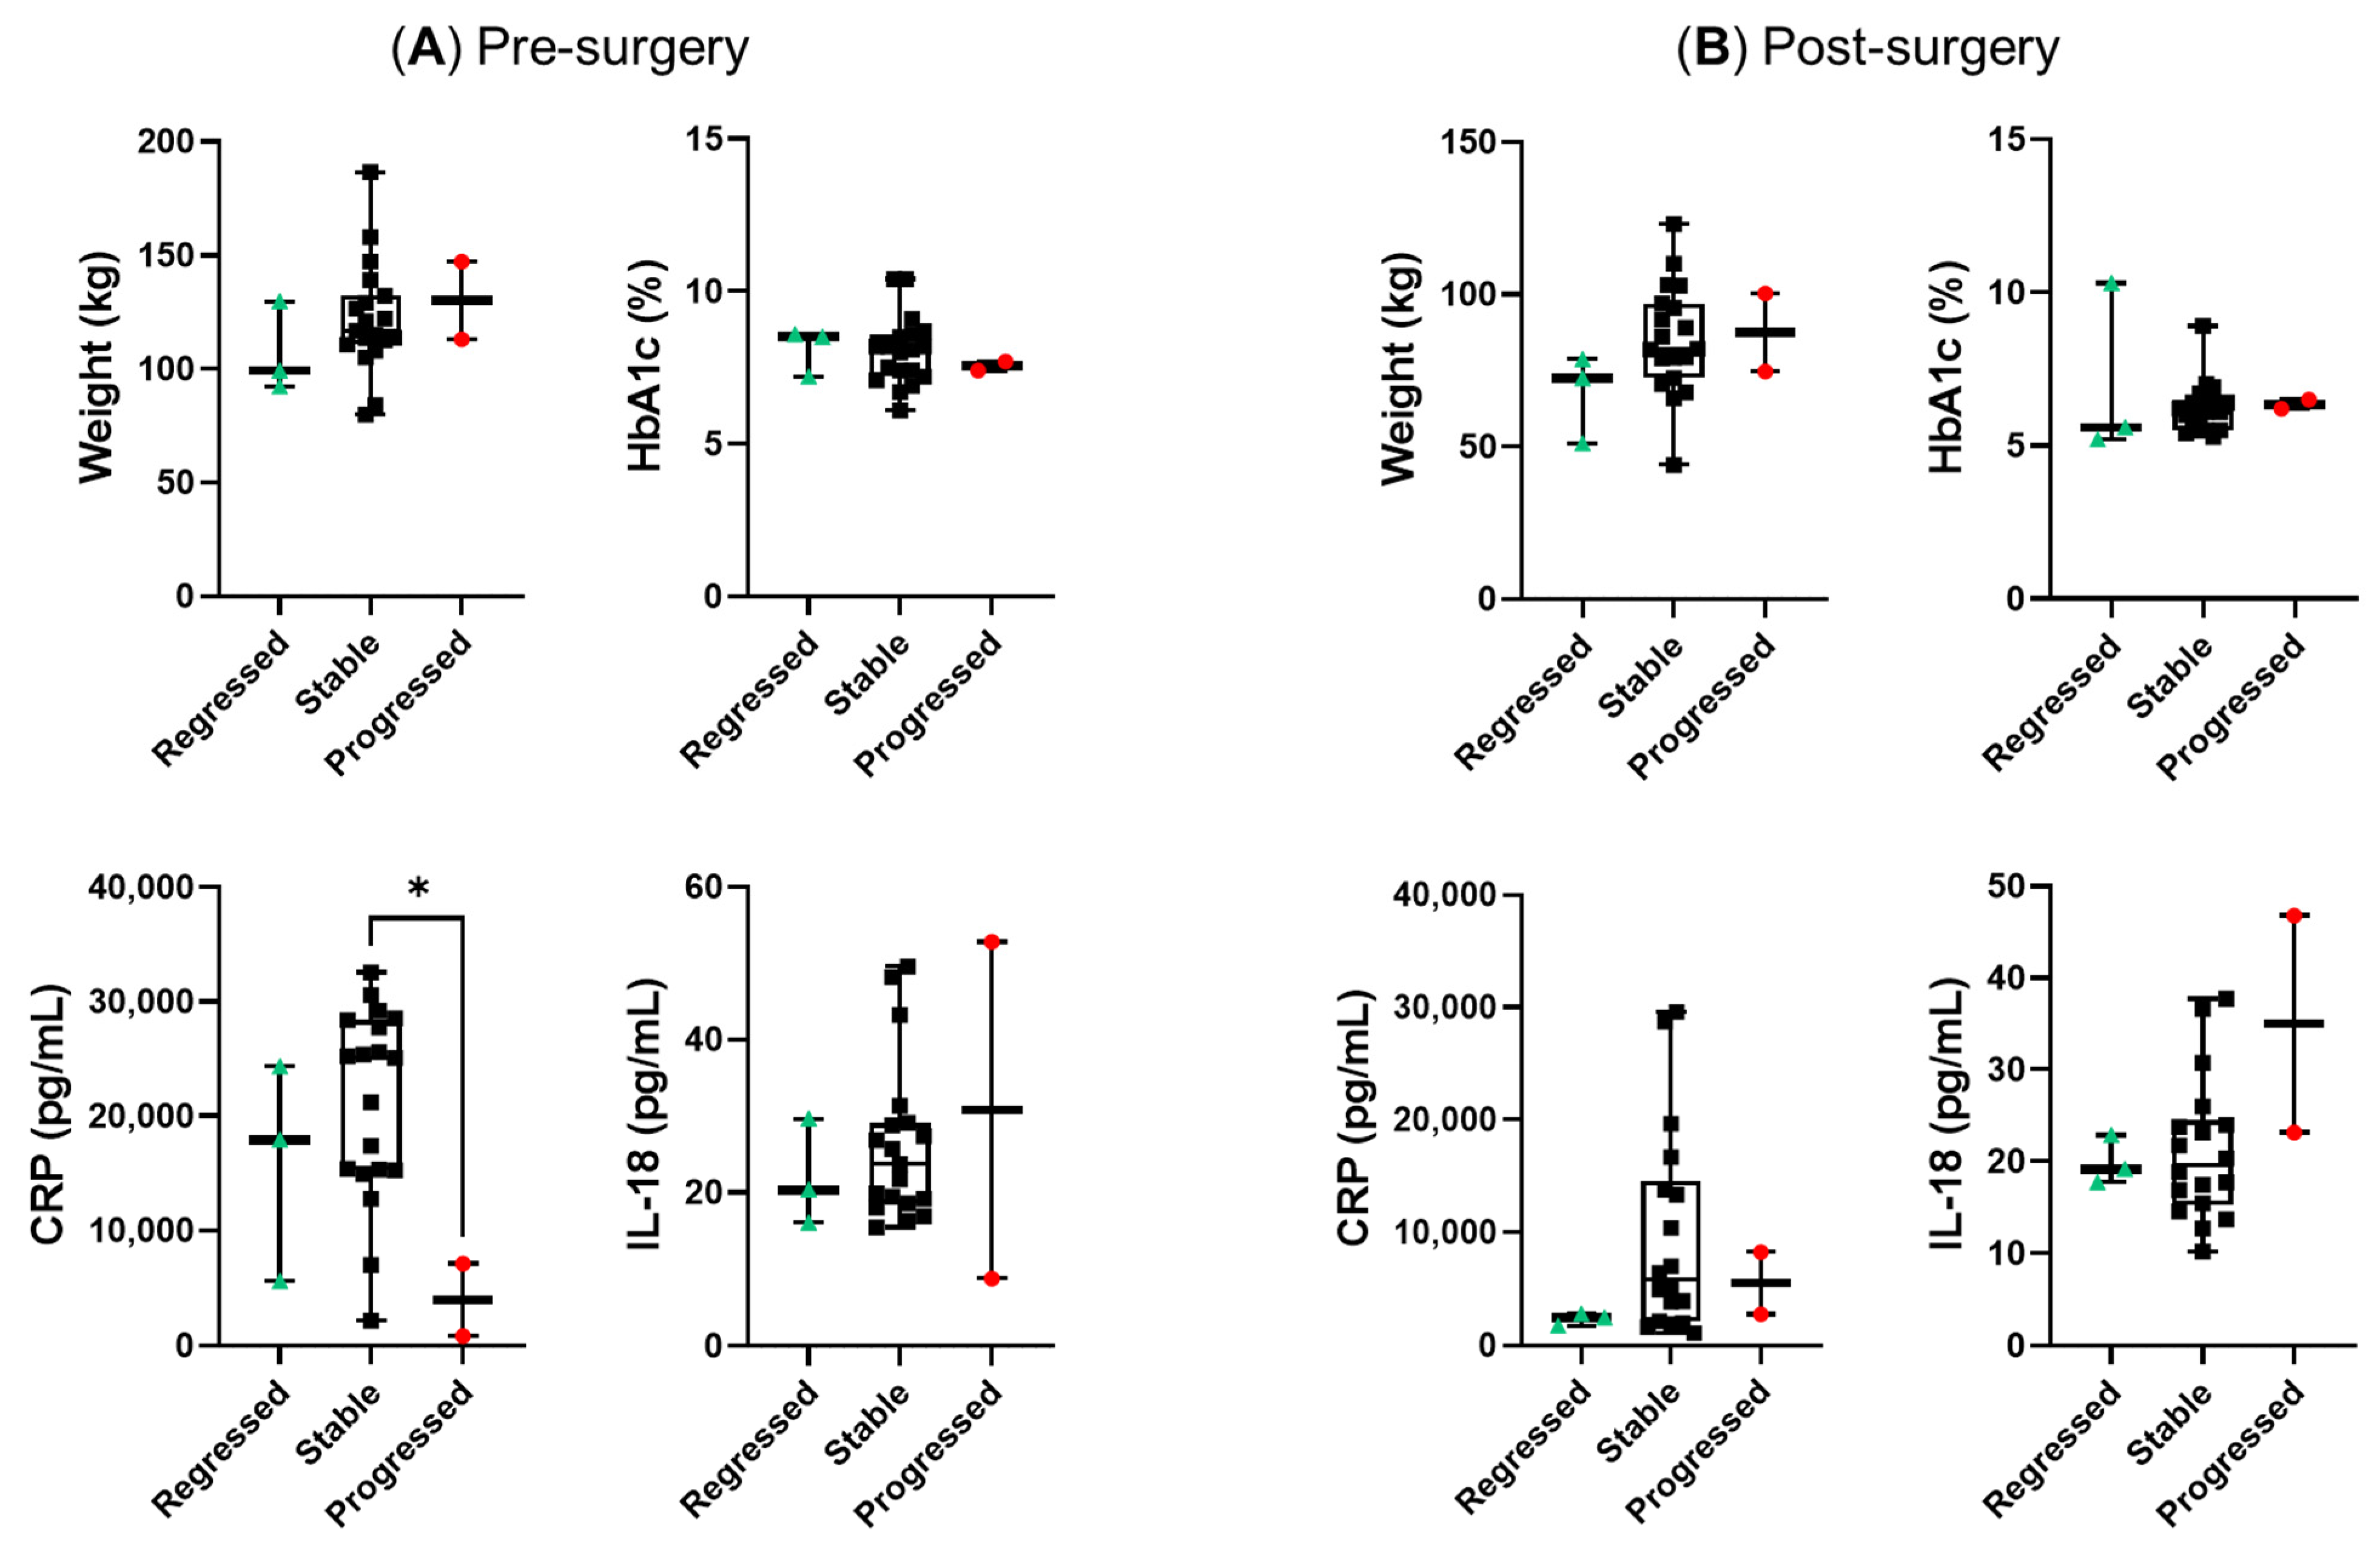
3.4. Comparison of Plasma Biomarkers between Regressed, Stable and Progressed Groups at Pre-Surgery and 1 Year Post-Surgery

To test for a correlation between biomarker levels and DR progression, we assessed the absolute levels of biomarkers pre-surgery and 1 year post-surgery in groups with regressed, stable, and progressed DR (Figure 3A,B). Weight appeared to increase from regressed to stable to progressed groups but without significant differences at both time points, while no trend was observed for HbA1c. A more distinct trend of increase from the regressed to stable to the progressed group was found in plasma IL-18 levels, the inflammasome biomarker, at pre-surgery and 1 year post-surgery, however, no significant difference was found. CRP levels, at pre-surgery only, were significantly higher in the group with stable DR, but not the regressed group, compared to the group that progressed (p = 0.0327).

3.5. The Progressed Group Showed a Substantial Increase in CRP Compared to the Regressed Group

After comparing the absolute values of biomarkers between groups that regressed, remained stable, or progressed in DR, we subsequently compared the relative change in the same biomarkers from pre-surgery to 1 year post-surgery in the same groups.
Similar trends were observed for IL-18 and CRP. The group that progressed in DR showed the highest relative change in CRP compared to the stable and regressed groups. The relative change in IL-18 was also higher in the progressed group, but not the regressed group, compared to the stable group (Supplementary Figure S1).
Due to limitations in the sample size, relative changes in IL-18 and CRP in the regressed and progressed groups were analyzed case by case (Table 3). Of the three patients who regressed from grade 1 to grade 0 DR, one showed a 12.68% reduction, one showed a 35.33% reduction, and one showed a 42.86% increase in plasma IL-18 levels at 1 year post-bariatric surgery. The patient who progressed from grade 1 to grade 2 DR showed an 11.40% reduction in IL-18. Interestingly, a marked 165.85% increase in IL-18 was found in the patient who showed greater progression from grade 1 to grade 3.
More consistently, all patients who regressed showed reduced CRP levels (by 49.60%, 89.82%, and 90.24% from grade 1 to grade 0 DR). A 15.96% increase in CRP was noted in the patient who progressed from grade 1 to grade 2 DR, while a substantial increase of 230.80% was observed in the patient who showed a greater progression from grade 1 to grade 3 DR during the same period.

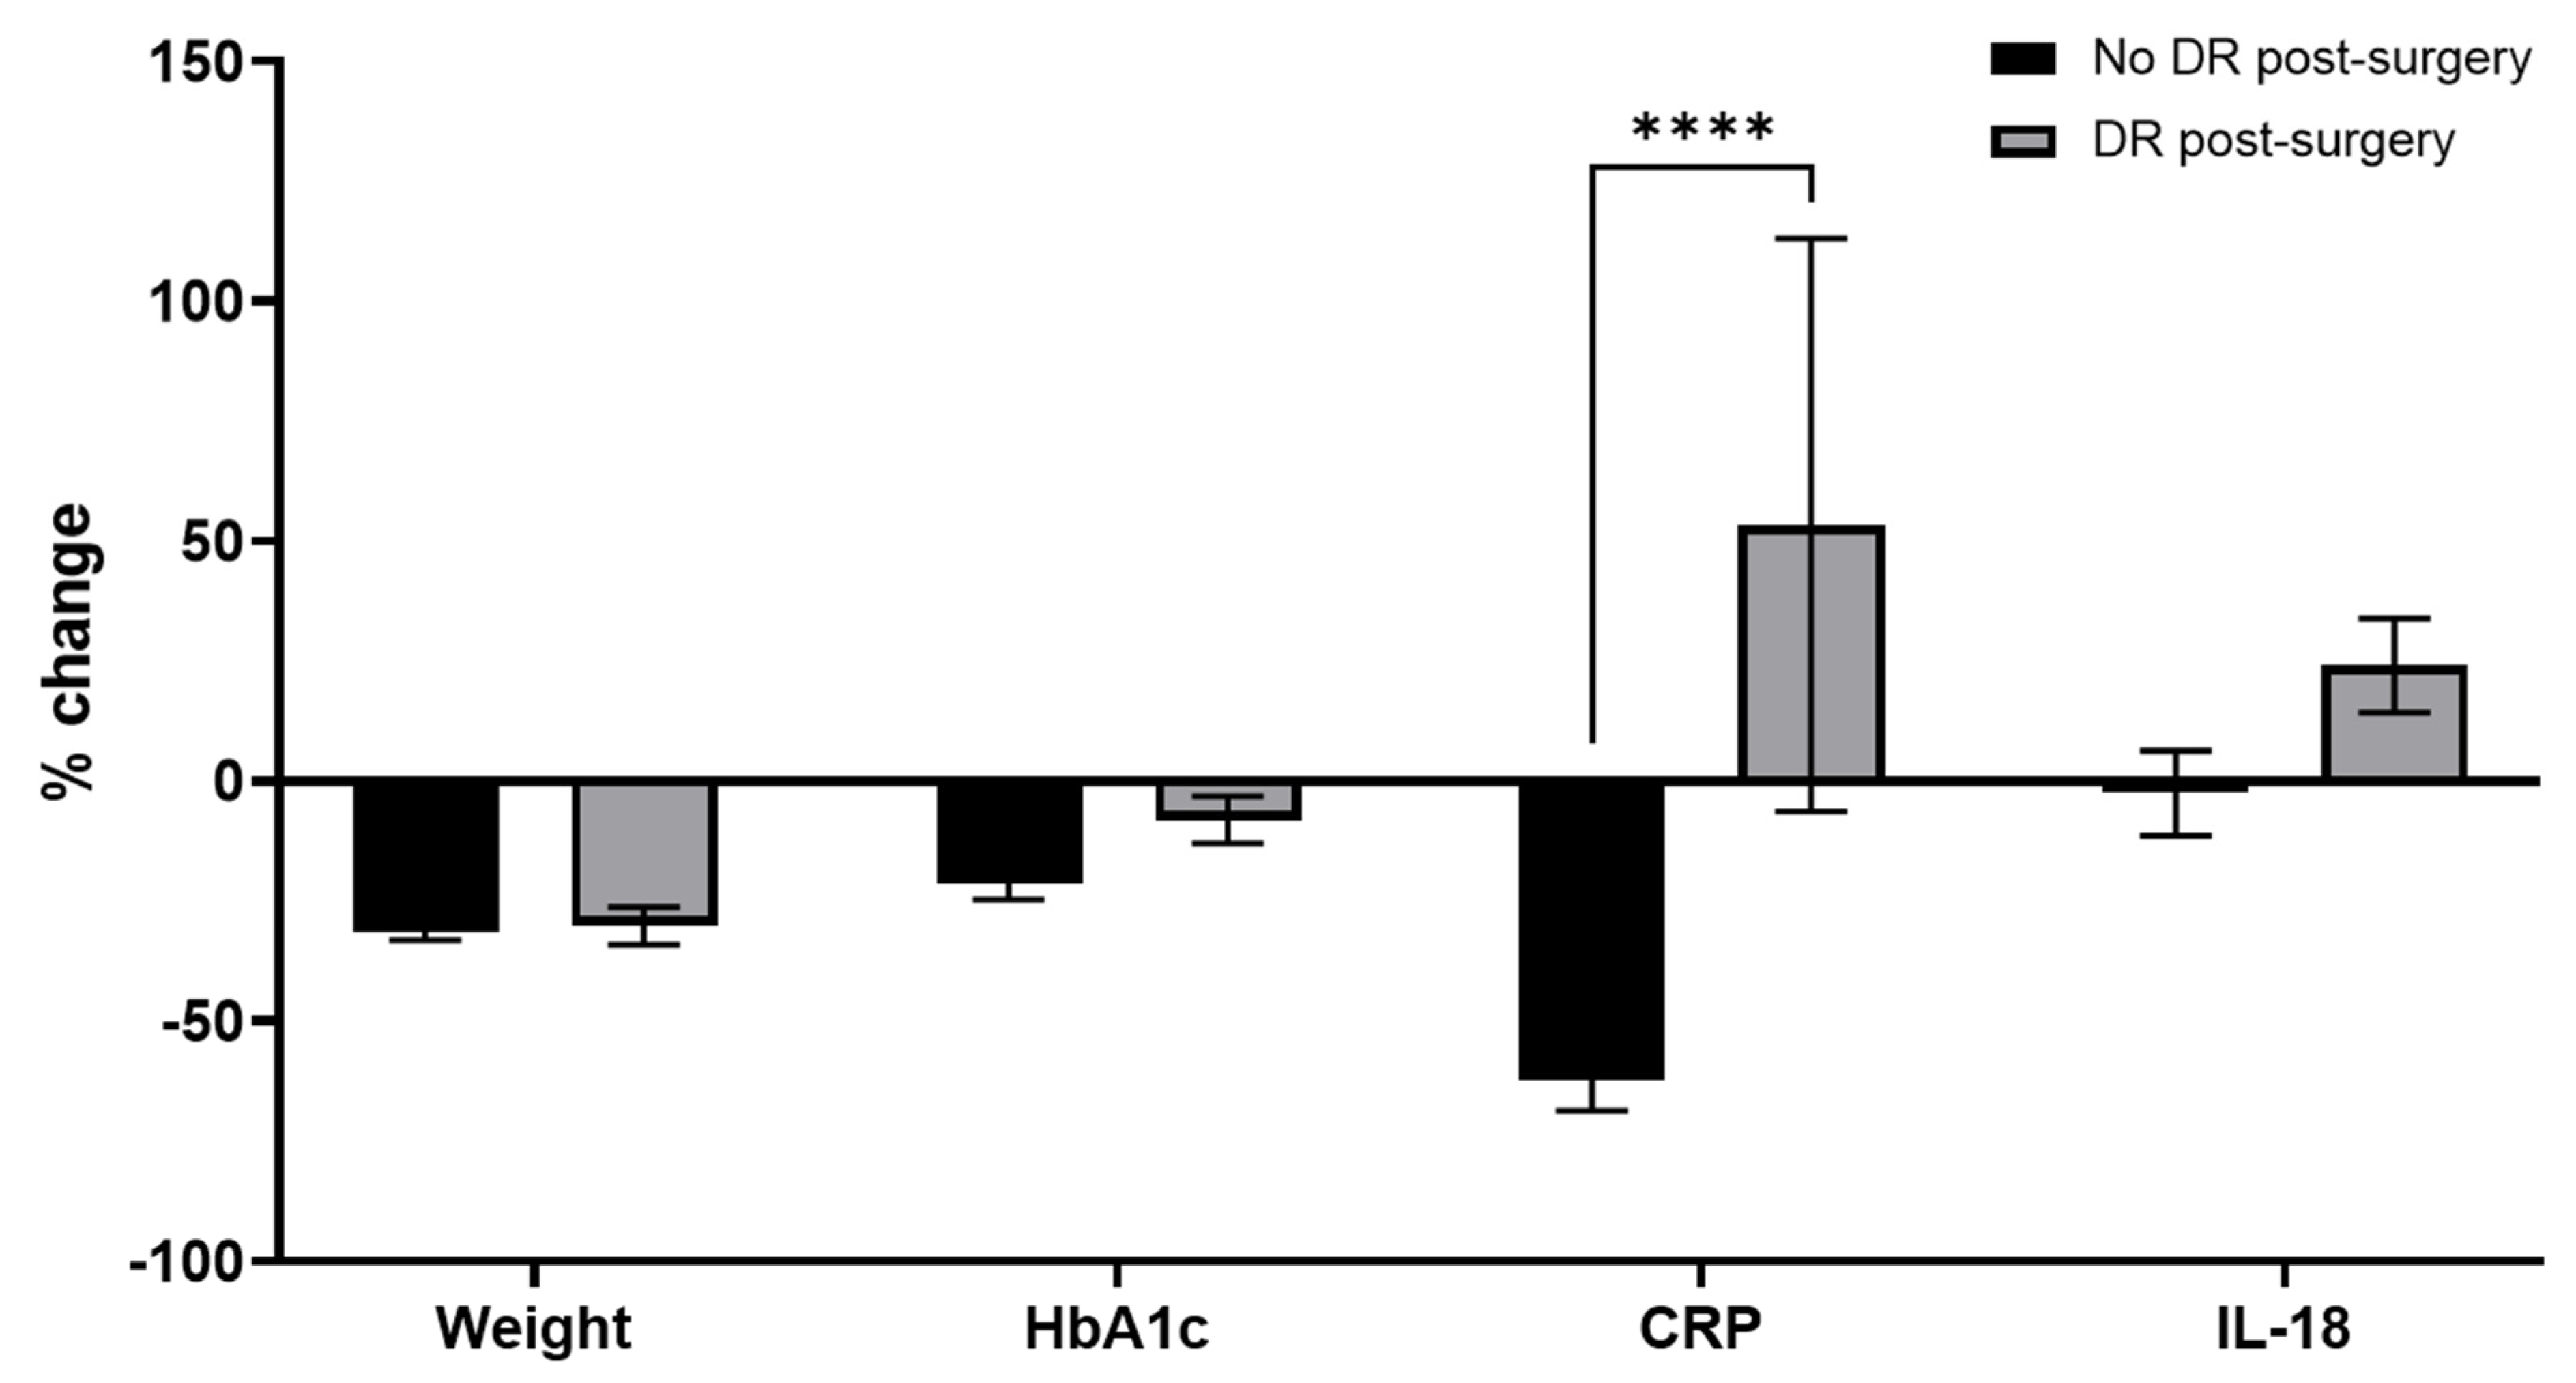
3.6. Relative Change in CRP Was Significantly Higher in the Group with No DR Compared to the Group with DR Post-Surgery

To see if relative changes in biomarkers can predict DR progression, patients were grouped into those without and with DR post-surgery. Between these groups, we compared the relative change in biomarker levels from pre-surgery to 1 year post-surgery. The degree of weight loss was similar in the groups without and with DR post-surgery. The reduction in HbA1c was higher in patients without DR post-surgery compared to the ones with DR, but the difference was not statistically significant. Plasma CRP levels significantly decreased in the group without DR post-surgery but increased in the group with DR post-surgery (p = 0.0108). Plasma IL-18 was marginally reduced in the group without DR post-surgery and increased in the group with DR post-surgery, but the difference was not statistically significant (Figure 4).

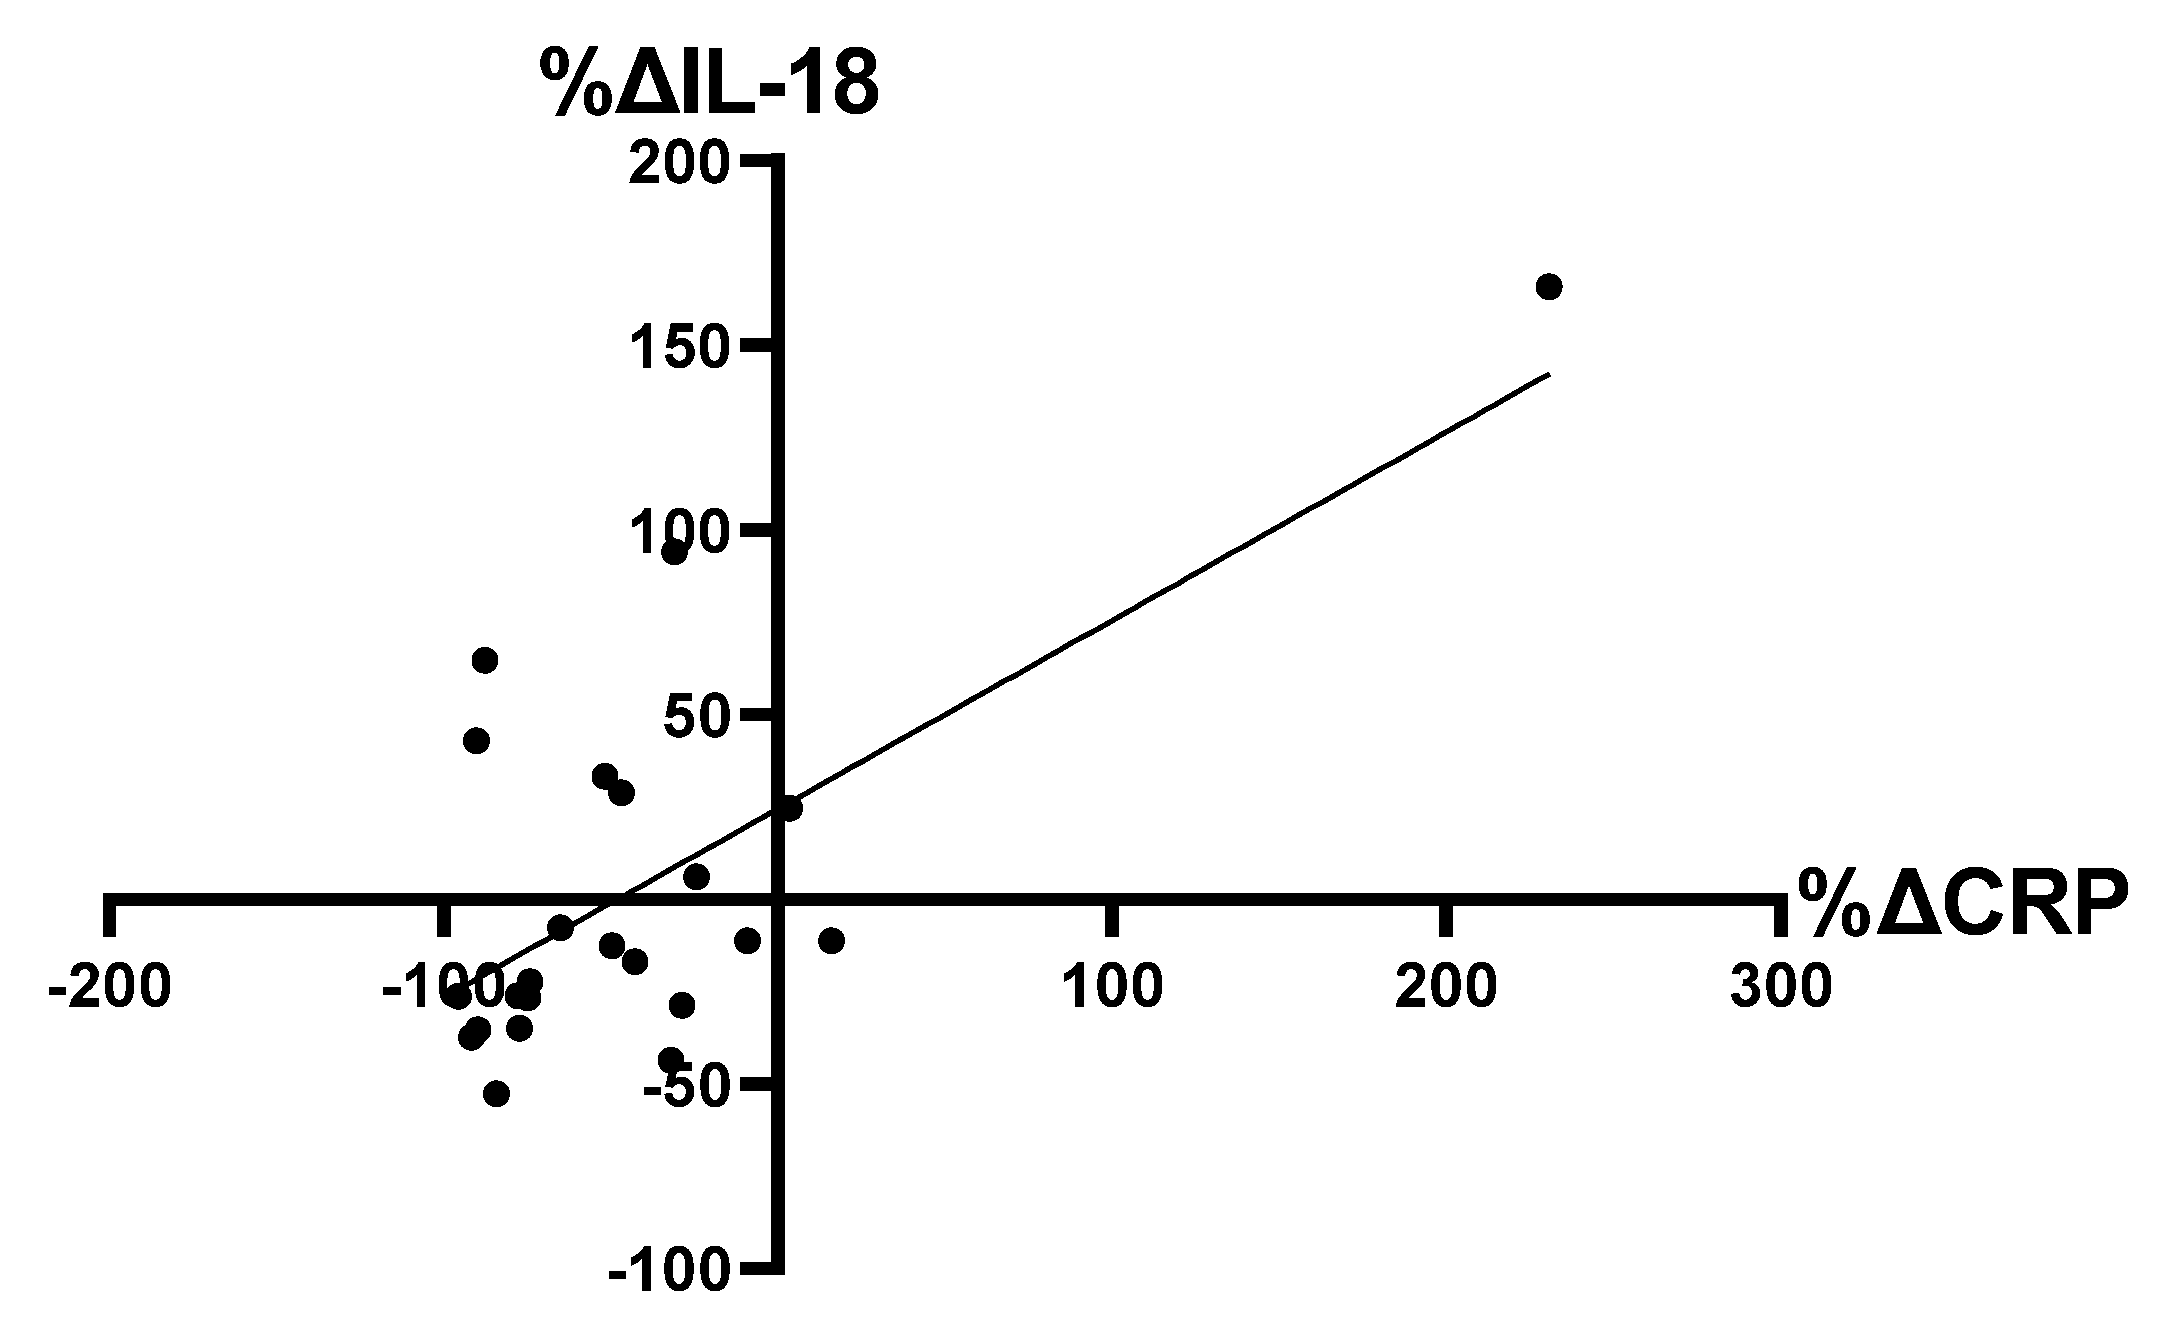
3.7. Correlation between Relative Changes in Plasma CRP and IL-18 Levels

Results in Table 3 showed a marked elevation in the relative changes in plasma CRP and IL-18 in the progressed group; thus, we investigated whether these changes correlated with each other. A significant positive linear correlation was found between the relative change in CRP and IL-18 (p = 0.004, R2 = 0.4568) (Figure 5).

4. Discussion

Our recent systematic literature review demonstrated a significant increase in inflammasome biomarkers, IL-1β and IL-18, from early- to late-stage DR in both vitreous and serum [14]. This suggests that the inflammasome pathway is involved in DR progression and that circulating inflammasome levels could be explored as potential biomarkers for DR progression. However, there has been a severe lack of longitudinal studies; thus, factors that change between patients, including age, sex, and baseline inflammation levels, could not be accounted for in the review. Addressing this gap, the pilot longitudinal study presented here aimed to investigate the potential of systemic inflammasome biomarker levels in predicting the severity and progression of DR.
Results demonstrated a correlation between the change in plasma inflammasome marker IL-18, as well as the downstream inflammation marker CRP, with DR progression. Although weight and HbA1c are managed clinically for slowing DR onset and progression, they did not appear to correlate with DR progression in our findings. Furthermore, the relative change in CRP correlated with the relative change in IL-18, a finding that has previously been reported in patients with coronary heart disease [39], rheumatoid arthritis [40], and myocardial infarction [41]. This suggests that NLRP3 inflammasome activation is a common pathway driving inflammation in both DR and other chronic vascular diseases. The Canakinumab Anti-Inflammatory Thrombosis Outcomes Study (CANTOS) [23,24] demonstrated that despite inhibiting the inflammasome biomarker, IL-1β, using canakinumab, plasma IL-18 was not affected. It further showed that elevated plasma IL-18 and CRP levels were strongly associated with an increased risk of recurrent cardiovascular events. The researchers in CANTOS proposed that the inflammasome pathway, where elevation in IL-18 results in a CRP increase, is associated with elevated cardiovascular risks and all-cause mortality in patients with myocardial infarction. It was not surprising to see heightened levels of inflammasome biomarkers in both cardiovascular diseases and DR pathogenesis, as DR is also strongly associated with increased cardiovascular events and all-cause mortality [42,43].
As an upstream biomarker in the inflammasome pathway, IL-18 is not amplified in the inflammatory cascades, and, therefore, it is not surprising to see smaller changes in IL-18 compared to the changes seen for CRP, as shown in our study. Furthermore, Trayhurn et al. [44] demonstrated that IL-18 is expressed in adipose tissues but cannot be detected in plasma or tissue culture, suggesting IL-18 is expressed locally in tissues and not released from cells. This could be attributed to the inhibitory effect of the IL-18-binding protein, hindering the release of IL-18 from cells [44]. Alternatively, IL-18 may operate within adipose tissues in an autocrine manner [45]. Nevertheless, the association between IL-18 and increased risks of cardiovascular diseases remains robust even after adjusting for high sensitivity CRP (hsCRP) levels [46,47], showing that IL-18 acts upstream of hsCRP. These findings align with the early involvement of IL-18 in the inflammasome pathway.
In this study, relative changes in CRP levels correlated with DR progression. Plasma CRP was reduced in the three patients with DR regression, increased mildly in the patient showing one-step progression, and increased even more in the patient showing a two-step progression over the same period. This is in line with Qiu et al. [48], who found that human CRP exacerbated retinal leukostasis and retinal neovascularization in vivo. They further showed that human CRP was associated with upregulation of CD32 and NF-ĸB signaling in the retina, suggesting that the hCRP-CD32-NF-κB pathway may be involved in an inflammatory cascade downstream of inflammasome activation. As such, increased plasma CRP levels may be clinically useful for predicting DR progression.
Several limitations need to be considered. Firstly, the small sample size, particularly in the progressed group, may limit the validity of the findings. However, this reflects the real-life scenario where the majority of DR cases remain stable post-bariatric surgery. To enhance clinical applicability, further validation with a larger, non-bariatric cohort is necessary to establish the correlation between DR progression and systemic inflammasome levels. Nevertheless, further studies in a larger bariatric cohort may provide valuable insight into managing DR post-surgery. Secondly, the lack of a control group prevented us from determining the influence of bariatric surgery on DR. Supporting this notion, a recent study showed that bariatric surgery had no impact on the risk of developing DR in both the long and short term [49]. Thirdly, the short 1 year follow-up period may not fully capture the progressive nature of DR. Lastly, the change in DR severity between baseline and 1 year post-surgery was up to two years in some patients, which may affect the overall results. In addition, data limitations, including missing DR screening results and blood samples at all time points, constrained our analysis. Furthermore, changes in medication pre- and post-surgery could impact systemic biomarker levels, but this was not accounted for due to the limited sample size.
In conclusion, this study suggests that the inflammasome pathway may play a role in triggering DR progression. As CRP is a downstream effector of the inflammasome pathway, CRP levels should be included when calculating screening interval for the detection of DR progression. As elevated levels of plasma CRP correlate with post-surgery DR progression, monitoring its levels could also aid in making informed decisions before patients with existing DR undergo bariatric surgery. Further validation of plasma CRP and inflammasome marker levels using larger, longitudinal cohorts may provide data to help improve current DR management strategies. Future research on pharmacological treatments halting DR progression could also take plasma CRP levels into account when assessing drug efficacy.

Supplementary Materials

The following supporting information can be downloaded at: https://www.mdpi.com/article/10.3390/futurepharmacol3030039/s1, Figure S1: The relative change in biomarkers at pre-surgery and 1 year post-surgery.

Author Contributions

Conceptualization, C.Y.-J.K., I.D.R., R.M. and O.O.M.; methodology, C.Y.-J.K. and M.B.; software, C.Y.-J.K.; validation, O.O.M.; formal analysis, C.Y.-J.K.; investigation, C.Y.-J.K. and O.O.M.; resources, I.D.R., R.M., M.B. and O.O.M.; data curation, C.Y.-J.K., M.B., R.M. and O.O.M.; writing—original draft preparation, C.Y.-J.K.; writing—review and editing, C.Y.-J.K., O.O.M., R.M. and I.D.R.; visualization, C.Y.-J.K. and O.O.M.; supervision, O.O.M., R.M. and I.D.R.; project administration, O.O.M.; funding acquisition, O.O.M., R.M. and I.D.R. All authors have read and agreed to the published version of the manuscript.

Funding

C.Y.-J.K. is funded by the New Zealand Association of Optometrists Education and Research Fund, the New Zealand Optometric Vision Research Foundation Research Grant, and the Vernon Tews Education Trust. O.O.M. is funded by the Neurological Foundation of New Zealand First Postdoctoral Fellowship (grant number: 2001 FFE), an Auckland Medical Research Foundation (AMRF) Project Grant (grant number: 1121013), and a Health Research Council Emerging Researcher First Grant (grant number: 22/546). I.D.R.’s directorship is supported by the Buchanan Charitable Foundation.

Institutional Review Board Statement

The original bariatric surgery study was a randomized clinical trial (RCT) (NCT01486680) registered with the Australian New Zealand Clinical Trials Registry (ACTRN12611000751976) and received approval from the New Zealand Regional Ethics Committee (NTY/11/07/082). The RCT commenced in September 2011 and completed recruitment in October 2014.

Informed Consent Statement

Informed consent was obtained from all subjects involved in the study.

Data Availability Statement

The data presented in this study are available within the article.

Acknowledgments

We would like to acknowledge David Kim and David Squirrell, who kindly assisted in collecting the missing hospital data used in this research.

Conflicts of Interest

O.O.M. is an inventor of patents relating to cytokine modulation in chronic diseases. C.Y.-J.K., I.D.R. and R.M. declare that there are no conflicts of interest. The funders had no role in the design of the study; in the collection, analyses, or interpretation of data; in the writing of the manuscript; or in the decision to publish the results.

References

  1. Teo, Z.L.; Tham, Y.-C.; Yu, M.; Chee, M.L.; Rim, T.H.; Cheung, N.; Bikbov, M.M.; Wang, Y.X.; Tang, Y.; Lu, Y. Global prevalence of diabetic retinopathy and projection of burden through 2045: Systematic review and meta-analysis. Ophthalmology 2021, 128, 1580–1591. [Google Scholar] [CrossRef] [PubMed]
  2. Azad, N.; Agrawal, L.; Emanuele, N.V.; Klein, R.; Bahn, G.D.; Reaven, P. Association of blood glucose control and pancreatic reserve with diabetic retinopathy in the Veterans Affairs Diabetes Trial (VADT). Diabetologia 2014, 57, 1124–1131. [Google Scholar] [CrossRef] [PubMed]
  3. Ipp, E.; Kumar, M. A Clinical Conundrum: Intensifying Glycemic Control in the Presence of Advanced Diabetic Retinopathy. Diabetes Care 2021, 44, 2192–2193. [Google Scholar] [CrossRef] [PubMed]
  4. Keech, A.C.; Mitchell, P.; Summanen, P.; O’Day, J.; Davis, T.M.; Moffitt, M.; Taskinen, M.-R.; Simes, R.J.; Tse, D.; Williamson, E. Effect of fenofibrate on the need for laser treatment for diabetic retinopathy (FIELD study): A randomised controlled trial. Lancet 2007, 370, 1687–1697. [Google Scholar] [CrossRef] [PubMed]
  5. The Action to Control Cardiovascular Risk in Diabetes Study Group. Effects of intensive glucose lowering in type 2 diabetes. N. Engl. J. Med. 2008, 358, 2545–2559. [Google Scholar] [CrossRef] [PubMed]
  6. Chew, E.Y.; Davis, M.D.; Danis, R.P.; Lovato, J.F.; Perdue, L.H.; Greven, C.; Genuth, S.; Goff, D.C.; Leiter, L.A.; Ismail-Beigi, F. The effects of medical management on the progression of diabetic retinopathy in persons with type 2 diabetes: The Action to Control Cardiovascular Risk in Diabetes (ACCORD) Eye Study. Ophthalmology 2014, 121, 2443–2451. [Google Scholar] [CrossRef] [PubMed]
  7. ADVANCE Collaborative Group. Intensive blood glucose control and vascular outcomes in patients with type 2 diabetes. N. Engl. J. Med. 2008, 358, 2560–2572. [Google Scholar] [CrossRef] [PubMed]
  8. UK Prospective Diabetes Study (UKPDS) Group. Intensive blood-glucose control with sulphonylureas or insulin compared with conventional treatment and risk of complications in patients with type 2 diabetes (UKPDS 33). Lancet 1998, 352, 837–853. [Google Scholar] [CrossRef]
  9. Action to Control Cardiovascular Risk in Diabetes Follow-On (ACCORDION) Eye Study Group; the Action to Control Cardiovascular Risk in Diabetes Follow-On (ACCORDION) Study Group. Persistent effects of intensive glycemic control on retinopathy in type 2 diabetes in the action to control cardiovascular risk in diabetes (ACCORD) follow-on study. Diabetes Care 2016, 39, 1089–1100. [Google Scholar] [CrossRef]
  10. Stratton, I.; Kohner, E.; Aldington, S.; Turner, R.; Holman, R.; Manley, S.; Matthews, D.; The UKPDS Group. UKPDS 50: Risk factors for incidence and progression of retinopathy in Type II diabetes over 6 years from diagnosis. Diabetologia 2001, 44, 156–163. [Google Scholar] [CrossRef]
  11. Kim, E.L.; Moshfeghi, A.A. Effect of Intravitreal Anti-VEGF Therapy on the Severity of Diabetic Retinopathy. Curr. Ophthalmol. Rep. 2016, 4, 61–70. [Google Scholar] [CrossRef]
  12. Nicholson, B.P.; Schachat, A.P. A review of clinical trials of anti-VEGF agents for diabetic retinopathy. Graefes Arch. Clin. Exp. Ophthalmol. 2010, 248, 915–930. [Google Scholar] [CrossRef] [PubMed]
  13. Kuo, C.Y.; Maran, J.J.; Jamieson, E.G.; Rupenthal, I.D.; Murphy, R.; Mugisho, O.O. Characterization of NLRP3 Inflammasome Activation in the Onset of Diabetic Retinopathy. Int. J. Mol. Sci. 2022, 23, 14471. [Google Scholar] [CrossRef] [PubMed]
  14. Kuo, C.Y.J.; Murphy, R.; Rupenthal, I.D.; Mugisho, O.O. Correlation between the progression of diabetic retinopathy and inflammasome biomarkers in vitreous and serum—A systematic review. BMC Ophthalmol. 2022, 22, 238. [Google Scholar] [CrossRef] [PubMed]
  15. Chen, H.; Zhang, X.; Liao, N.; Mi, L.; Peng, Y.; Liu, B.; Zhang, S.; Wen, F. Enhanced Expression of NLRP3 Inflammasome-Related Inflammation in Diabetic Retinopathy. Investig. Ophthalmol. Vis. Sci. 2018, 59, 978–985. [Google Scholar] [CrossRef]
  16. Louie, H.H.; Shome, A.; Kuo, C.Y.; Rupenthal, I.D.; Green, C.R.; Mugisho, O.O. Connexin43 hemichannel block inhibits NLRP3 inflammasome activation in a human retinal explant model of diabetic retinopathy. Exp. Eye Res. 2020, 202, 108384. [Google Scholar] [CrossRef] [PubMed]
  17. Lyon, H.; Shome, A.; Rupenthal, I.D.; Green, C.R.; Mugisho, O.O. Tonabersat Inhibits Connexin43 Hemichannel Opening and Inflammasome Activation in an In Vitro Retinal Epithelial Cell Model of Diabetic Retinopathy. Int. J. Mol. Sci. 2021, 22, 298. [Google Scholar] [CrossRef] [PubMed]
  18. Mugisho, O.O.; Green, C.R.; Squirrell, D.M.; Bould, S.; Danesh-Meyer, H.V.; Zhang, J.; Acosta, M.L.; Rupenthal, I.D. Connexin43 hemichannel block protects against the development of diabetic retinopathy signs in a mouse model of the disease. J. Mol. Med. 2019, 97, 215–229. [Google Scholar] [CrossRef]
  19. Mugisho, O.O.; Rupenthal, I.D.; Paquet-Durand, F.; Acosta, M.L.; Green, C.R. Targeting connexin hemichannels to control the inflammasome: The correlation between connexin43 and NLRP3 expression in chronic eye disease. Expert Opin. Ther. Targets 2019, 23, 855–863. [Google Scholar] [CrossRef]
  20. Wright, A.; Dodson, P. Medical management of diabetic retinopathy: Fenofibrate and ACCORD Eye studies. Eye 2011, 25, 843–849. [Google Scholar] [CrossRef]
  21. Swanson, K.V.; Deng, M.; Ting, J.P.-Y. The NLRP3 inflammasome: Molecular activation and regulation to therapeutics. Nat. Rev. Immunol. 2019, 19, 477–489. [Google Scholar] [CrossRef] [PubMed]
  22. Kowluru, R.A.; Mohammad, G.; Santos, J.M.; Tewari, S.; Zhong, Q. Interleukin-1β and mitochondria damage, and the development of diabetic retinopathy. J. Ocul. Biol. Dis. Infor. 2011, 4, 3–9. [Google Scholar] [CrossRef] [PubMed]
  23. Larsen, C.M.; Faulenbach, M.; Vaag, A.; Vølund, A.; Ehses, J.A.; Seifert, B.; Mandrup-Poulsen, T.; Donath, M.Y. Interleukin-1–receptor antagonist in type 2 diabetes mellitus. N. Engl. J. Med. 2007, 356, 1517–1526. [Google Scholar] [CrossRef] [PubMed]
  24. Larsen, C.M.; Faulenbach, M.; Vaag, A.; Ehses, J.A.; Donath, M.Y.; Mandrup-Poulsen, T. Sustained effects of interleukin-1 receptor antagonist treatment in type 2 diabetes. Diabetes Care 2009, 32, 1663–1668. [Google Scholar] [CrossRef] [PubMed]
  25. Stahel, M.; Becker, M.; Graf, N.; Michels, S. Systemic interleukin 1β inhibition in proliferative diabetic retinopathy: A prospective open-label study using canakinumab. Retina 2016, 36, 385. [Google Scholar] [CrossRef] [PubMed]
  26. Blankenberg, S.; Luc, G.; Ducimetière, P.; Arveiler, D.; Ferrières, J.; Amouyel, P.; Evans, A.; Cambien, F.o.; Tiret, L. Interleukin-18 and the risk of coronary heart disease in European men: The Prospective Epidemiological Study of Myocardial Infarction (PRIME). Circulation 2003, 108, 2453–2459. [Google Scholar] [CrossRef] [PubMed]
  27. Jefferis, B.J.; Papacosta, O.; Owen, C.G.; Wannamethee, S.G.; Humphries, S.E.; Woodward, M.; Lennon, L.T.; Thomson, A.; Welsh, P.; Rumley, A. Interleukin 18 and coronary heart disease: Prospective study and systematic review. Atherosclerosis 2011, 217, 227–233. [Google Scholar] [CrossRef] [PubMed]
  28. Yasin, S.; Fall, N.; Brown, R.A.; Henderlight, M.; Canna, S.W.; Girard-Guyonvarc’h, C.; Gabay, C.; Grom, A.A.; Schulert, G.S. IL-18 as a biomarker linking systemic juvenile idiopathic arthritis and macrophage activation syndrome. Rheumatology 2020, 59, 361–366. [Google Scholar] [CrossRef]
  29. Miyauchi, K.; Takiyama, Y.; Honjyo, J.; Tateno, M.; Haneda, M. Upregulated IL-18 expression in type 2 diabetic subjects with nephropathy: TGF-β1 enhanced IL-18 expression in human renal proximal tubular epithelial cells. Diabetes Res. Clin. Pract. 2009, 83, 190–199. [Google Scholar] [CrossRef]
  30. Doyle, S.L.; López, F.J.; Celkova, L.; Brennan, K.; Mulfaul, K.; Ozaki, E.; Kenna, P.F.; Kurali, E.; Hudson, N.; Doggett, T. IL-18 immunotherapy for neovascular AMD: Tolerability and efficacy in nonhuman primates. Investig. Ophthalmol. Vis. Sci. 2015, 56, 5424–5430. [Google Scholar] [CrossRef]
  31. Doyle, S.L.; Ozaki, E.; Brennan, K.; Humphries, M.M.; Mulfaul, K.; Keaney, J.; Kenna, P.F.; Maminishkis, A.; Kiang, A.-S.; Saunders, S.P. IL-18 attenuates experimental choroidal neovascularization as a potential therapy for wet age-related macular degeneration. Sci. Transl. Med. 2014, 6, 230ra244. [Google Scholar] [CrossRef] [PubMed]
  32. Hirano, Y.; Yasuma, T.; Mizutani, T.; Fowler, B.J.; Tarallo, V.; Yasuma, R.; Kim, Y.; Bastos-Carvalho, A.; Kerur, N.; Gelfand, B.D. IL-18 is not therapeutic for neovascular age-related macular degeneration. Nat. Med. 2014, 20, 1372–1375. [Google Scholar] [CrossRef] [PubMed]
  33. Ridker, P.M.; MacFadyen, J.G.; Everett, B.M.; Libby, P.; Thuren, T.; Glynn, R.J.; Kastelein, J.; Koenig, W.; Genest, J.; Lorenzatti, A. Relationship of C-reactive protein reduction to cardiovascular event reduction following treatment with canakinumab: A secondary analysis from the CANTOS randomised controlled trial. Lancet 2018, 391, 319–328. [Google Scholar] [CrossRef] [PubMed]
  34. Murphy, R.; Clarke, M.G.; Evennett, N.J.; John Robinson, S.; Lee Humphreys, M.; Hammodat, H.; Jones, B.; Kim, D.D.; Cutfield, R.; Johnson, M.H. Laparoscopic sleeve gastrectomy versus banded Roux-en-Y gastric bypass for diabetes and obesity: A prospective randomised double-blind trial. Obes. Surg. 2018, 28, 293–302. [Google Scholar] [CrossRef] [PubMed]
  35. Murphy, R.; Jiang, Y.; Booth, M.; Babor, R.; MacCormick, A.; Hammodat, H.; Beban, G.; Barnes, R.M.; Vincent, A.L. Progression of diabetic retinopathy after bariatric surgery. Diabet. Med. 2015, 32, 1212–1220. [Google Scholar] [CrossRef]
  36. Diabetic Retinal Screening, Grading, Monitoring and Referral Guidance; Ministry of Health: Wellington, New Zealand, 2016; pp. 16–17.
  37. Davies, N.K. Clinical, Metabolic, and Microbial Responses to Sleeve Gastrectomy and Roux-en-Y Gastric Bypass: Results from a Randomised Clinical Trial. Doctoral Thesis, The University of Auckland, Auckland, New Zealand, 1023. [Google Scholar]
  38. Luminex Assay Human Premixed Multi-Analyte Kit. Available online: https://resources.rndsystems.com/pdfs/datasheets/lxsahm.pdf (accessed on 8 September 2020).
  39. Koenig, W.; Khuseyinova, N.; Baumert, J.; Thorand, B.; Loewel, H.; Chambless, L.; Meisinger, C.; Schneider, A.; Martin, S.; Kolb, H. Increased concentrations of C-reactive protein and IL-6 but not IL-18 are independently associated with incident coronary events in middle-aged men and women: Results from the MONICA/KORA Augsburg case–cohort study, 1984–2002. Arterioscler. Thromb. Vasc. Biol. 2006, 26, 2745–2751. [Google Scholar] [CrossRef]
  40. Bresnihan, B.; Roux-Lombard, P.; Murphy, E.; Kane, D.; FitzGerald, O.; Dayer, J. Serum interleukin 18 and interleukin 18 binding protein in rheumatoid arthritis. Ann. Rheum. Dis. 2002, 61, 726–729. [Google Scholar] [CrossRef]
  41. Ridker, P.M.; MacFadyen, J.G.; Thuren, T.; Libby, P. Residual inflammatory risk associated with interleukin-18 and interleukin-6 after successful interleukin-1β inhibition with canakinumab: Further rationale for the development of targeted anti-cytokine therapies for the treatment of atherothrombosis. Eur. Heart J. 2020, 41, 2153–2163. [Google Scholar] [CrossRef]
  42. Gerstein, H.C.; Ambrosius, W.T.; Danis, R.; Ismail-Beigi, F.; Cushman, W.; Calles, J.; Banerji, M.; Schubart, U.; Chew, E.Y.; Group, A.S. Diabetic retinopathy, its progression, and incident cardiovascular events in the ACCORD trial. Diabetes Care 2013, 36, 1266–1271. [Google Scholar] [CrossRef]
  43. Kramer, C.K.; Rodrigues, T.C.; Canani, L.H.; Gross, J.L.; Azevedo, M.J. Diabetic retinopathy predicts all-cause mortality and cardiovascular events in both type 1 and 2 diabetes: Meta-analysis of observational studies. Diabetes Care 2011, 34, 1238–1244. [Google Scholar] [CrossRef]
  44. Wood, I.S.; Wang, B.; Jenkins, J.R.; Trayhurn, P. The pro-inflammatory cytokine IL-18 is expressed in human adipose tissue and strongly upregulated by TNFα in human adipocytes. Biochem. Biophys. Res. Commun. 2005, 337, 422–429. [Google Scholar] [CrossRef] [PubMed]
  45. Rooney, T.; Murphy, E.; Benito, M.; Roux-Lombard, P.; FitzGerald, O.; Dayer, J.; Bresnihan, B. Synovial tissue interleukin-18 expression and the response to treatment in patients with inflammatory arthritis. Ann. Rheum. Dis. 2004, 63, 1393–1398. [Google Scholar] [CrossRef] [PubMed]
  46. Blankenberg, S.; Tiret, L.; Bickel, C.; Peetz, D.; Cambien, F.; Meyer, J.; Rupprecht, H.J. Interleukin-18 is a strong predictor of cardiovascular death in stable and unstable angina. Circulation 2002, 106, 24–30. [Google Scholar] [CrossRef] [PubMed]
  47. Yamagami, H.; Kitagawa, K.; Hoshi, T.; Furukado, S.; Hougaku, H.; Nagai, Y.; Hori, M. Associations of serum IL-18 levels with carotid intima-media thickness. Arterioscler. Thromb. Vasc. Biol. 2005, 25, 1458–1462. [Google Scholar] [CrossRef] [PubMed]
  48. Qiu, F.; Ma, X.; Shin, Y.-H.; Chen, J.; Chen, Q.; Zhou, K.; Wu, W.; Liang, W.; Wu, Y.; Song, Q. Pathogenic role of human C-reactive protein in diabetic retinopathy. Clin. Sci. 2020, 134, 1613–1629. [Google Scholar] [CrossRef] [PubMed]
  49. Thykjær, A.S.; Rosengaard, L.; Andersen, N.; Andresen, J.; Bek, T.; Hajari, J.; Heegaard, S.; Højlund, K.; Kawasaki, R.; Laugesen, C.S. Bariatric surgery in individuals with type 2 diabetes is not associated with short or long-term risk of diabetic retinopathy progression: Results from a nationwide cohort study. Acta Diabetol. 2023. [Google Scholar] [CrossRef]
Figure 1. Cross-sectional comparison of plasma biomarker levels in patients with different DR grades, analyzed using the Kruskal–Wallis test and corrected for multiple comparisons using Dunn’s statistical hypothesis testing. Graphs show the median and interquartile range. No significant difference was found for weight, HbA1c, plasma CRP, or plasma IL-18 levels in patients with DR grade 0, 1, 2–3, and 4. For HbA1c and weight, n = 54, 11, 4, and 3 for grades 0, 1, 2–3, and 4, respectively. For CRP, n = 61, 9, 4, and 3 for grades 0, 1, 2–3, and 4, respectively. For IL-18, n = 53, 8, 3, and 3 for grades 0, 1, 2–3, and 4, respectively.
Futurepharmacol 03 00039 g001
Figure 2. Change in DR severity from pre- to post-surgery. All 17 patients with no DR (NDR) pre-surgery remained stable post-surgery. Of the 5 patients with minimal DR pre-surgery, 3 regressed to NDR, 1 progressed to mild DR, and 1 progressed to moderate DR. The only patient with severe DR pre-surgery remained at severe DR post-surgery.
Futurepharmacol 03 00039 g002
Figure 3. Cross-sectional comparison of plasma biomarker levels pre- and post-surgery. Data were analyzed using one-way ANOVA and corrected using Tukey’s multiple comparison test. (A) Pre-surgical measurement of biomarker levels in patients who regressed, remained stable, or progressed in DR at 1 year post-surgery. Pre-surgical CRP levels were significantly higher in the stable group but not in the regressed group compared to the progressed group. Moreover, no significant difference was found in pre-surgical weight, HbA1c, and plasma IL-18 levels between the three groups. (B) Post-surgical measurement of biomarker levels in patients who regressed, remained stable, or progressed in DR at 1 year post-surgery. No significant differences were found in post-surgical weight, HbA1c, CRP, and plasma IL-18 levels between patients who regressed, remained stable, or progressed. * p ≤ 0.05; graph shows median and interquartile range. n = 3 in regressed, 19 in stable, and 2 in progressed groups, respectively. Data point of each patient in regressed, stable and progressed groups were marked as green triangles, black squares, and red circles, respectively.
Futurepharmacol 03 00039 g003
Figure 4. Relative change in weight, HbA1c, plasma CRP, and plasma IL-18 levels between patients without and with DR post-surgery. Data was analyzed using two-way ANOVA and Bonferroni’s multiple comparisons test.The relative changes in weight, HbA1c, and plasma IL-18 levels were not significant between patients without and with DR post-surgery. Plasma CRP levels reduced in patients without DR post-surgery but increased in patients with DR post-surgery, showing a significant relative change between the two groups. **** p ≤ 0.0001; n = 20 in no DR and 4 in DR post-surgery group.
Futurepharmacol 03 00039 g004
Figure 5. Correlation between relative changes in plasma CRP and IL-18 levels. Correlation was assessed using simple linear regression and Pearson’s correlation coefficient.The relative change in plasma CRP levels correlated positively with the relative changes in plasma IL-18 levels. p = 0.004, R2 = 0.4568. n = 24.
Futurepharmacol 03 00039 g005
Table 1. Simplified version of Table C in the NZ DR Screening, Grading, Monitoring and Referral Guidance.
Grade and
Description
Clinical Signs
R0, no DRNo abnormalities
R1, minimalLess than 5 microaneurysms (MA) or dot hemorrhages
R2, mild>4 MAs or dot hemorrhages. Exudates more than 3 disc diameters from fovea. Some blots and larger hemorrhages acceptable. If more than 20 MAs or hemorrhages per photographic field, upgrade to R3 moderate
R3, moderateAny features of mild. Blot or large hemorrhages. Up to one quadrant of venous beading
R4, severeOne or more of (1) definite intra-retinal microvascular abnormalities, (2) two quadrants or more of venous beading, (3) four quadrants of blot or larger hemorrhages
R5, proliferativeOne or more of (1) neovascularization, (2) sub-hyaloid or vitreous hemorrhage, (3) tractional retinal detachment or retinal gliosis
Table 2. Clinical profiles of patients with T2DM pre-surgery and 1 year post-surgery.
Assay
Sensitivity
Pre-Surgery (n = 24)Post-Surgery (n = 24)p
Weight (kg)N/A115.90 (108.7–131.6)80.55 (72.43–96.65)<0.0001
HbA1c (%)N/A8.00 (7.20–8.50)6.10 (5.50–6.50)<0.0001
IL-18 (pg/mL)1.9322.72 (18.16–29.49)21.01 (17.01–25.48)0.51
CRP (pg/mL)11617,909 (12,775–27,742)4983 (2145–13,348)<0.0001
TNF-α (pg/mL)1.20.73 (0.48–1.09)0.61 (0.480.95)0.70
IL-6 (pg/mL)1.70.25 (0.12–0.46)0.12 (0.08–0.43)0.71
IL-8 (pg/mL)1.80.64 (0.48–1.09)0.65 (0.46–1.33)0.48
VEGF (pg/mL)2.11.69 (1.17–4.26)1.73 (1.00–3.67)0.43
IL-1β0.80.34 (0.18–0.65)0.34 (0.18–0.86)0.0677
IL-101.60.64 (0.49–0.78)0.97 (0.68–1.34)0.1609
Values are presented as median (interquartile range).
Table 3. Relative change in biomarker levels from pre-surgery to 1 year post-surgery.
DR Grade% Change
PrePostWeight HbA1cIL-18CRP
Regressed10−27.0221.18−12.68−49.60
10−39.32−27.78−35.33−89.82
10−44.64−34.8842.86−90.24
Progressed12−33.89−15.58−11.4015.96
13−31.91−16.22165.85230.80
Disclaimer/Publisher’s Note: The statements, opinions and data contained in all publications are solely those of the individual author(s) and contributor(s) and not of MDPI and/or the editor(s). MDPI and/or the editor(s) disclaim responsibility for any injury to people or property resulting from any ideas, methods, instructions or products referred to in the content.

