Article

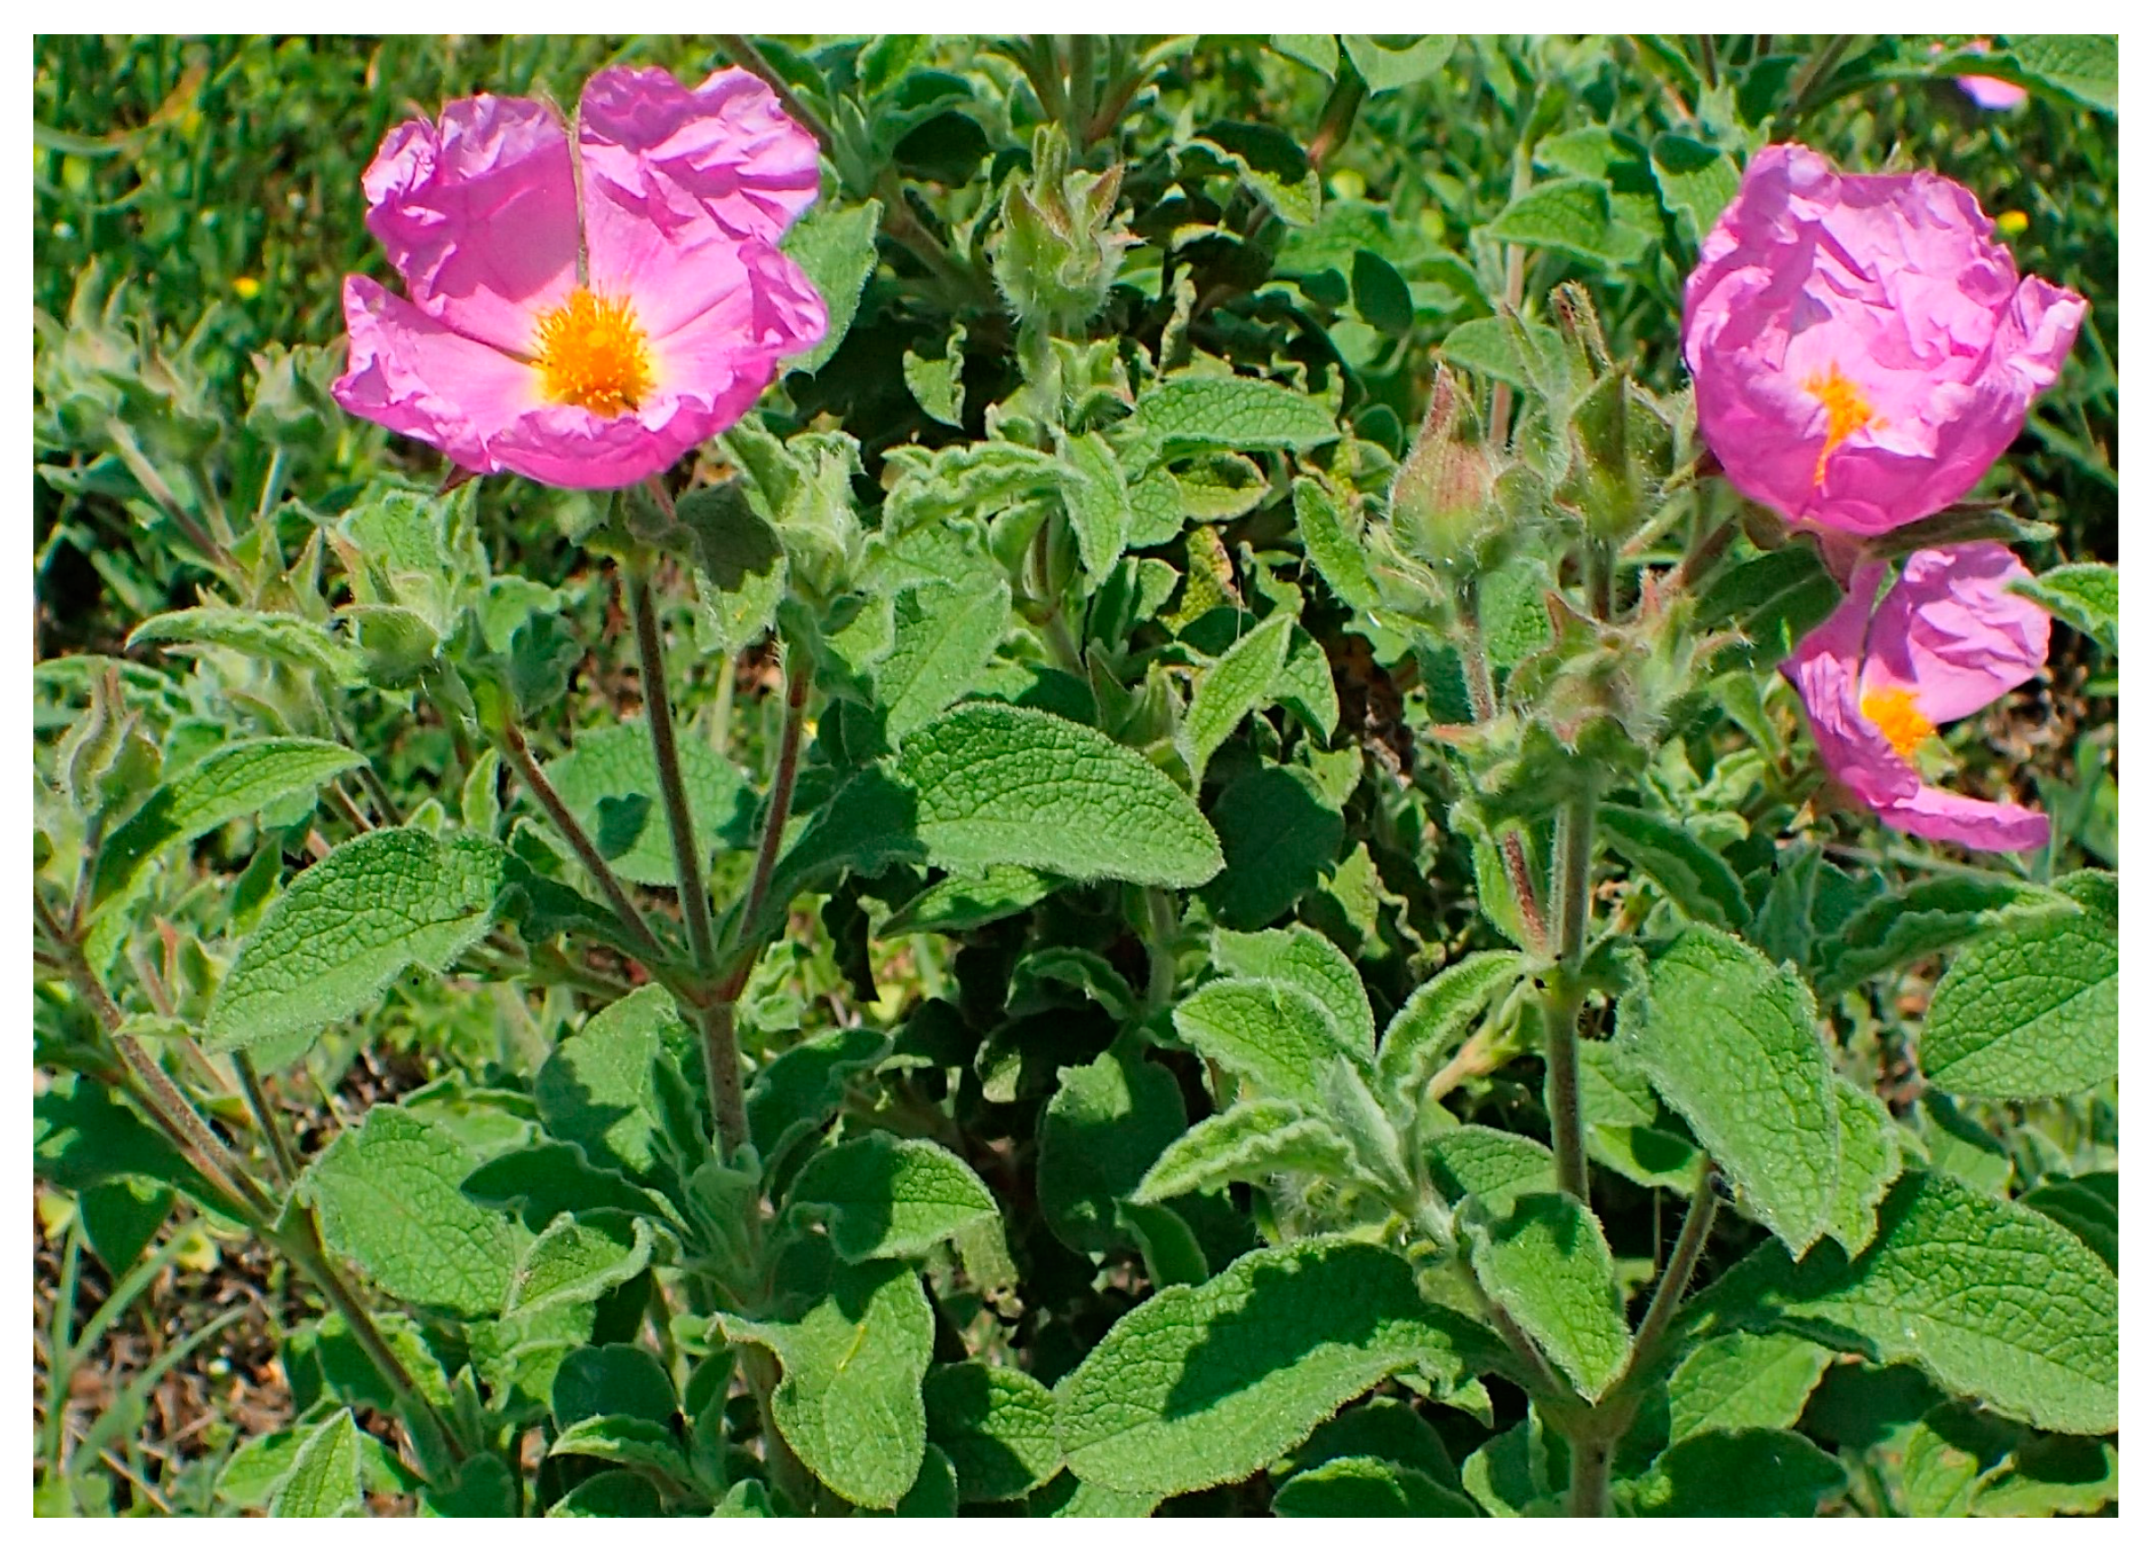
Extraction of Bioactive Compounds from Cistus creticus Leaves and Their Use in the Preparation of Yogurt Desserts

by
Dimitrios Palaiogiannis
,
Vassilis Athanasiadis
,
Theodoros Chatzimitakos
,
Martha Mantiniotou
,
Eleni Bozinou
,
Dimitris P. Makris
and
Stavros I. Lalas
*
Department of Food Science and Nutrition, University of Thessaly, Terma N. Temponera Street, 43100 Karditsa, Greece
*
Author to whom correspondence should be addressed.
Oxygen 2024, 4(1), 90-107; https://doi.org/10.3390/oxygen4010005
Submission received: 14 December 2023 / Revised: 22 January 2024 / Accepted: 10 February 2024 / Published: 12 February 2024
(This article belongs to the Special Issue Feature Papers in Oxygen Volume Ⅱ)

Abstract

:
The objective of this study was to determine the optimal conditions for the recovery of bioactive and antioxidant compounds in aqueous solutions of Cistus creticus leaves and then employ the optimal extract for the enrichment of yogurt samples. The optimal conditions were established by a response surface methodology and were determined to be a liquid-to-solid ratio of 48 mL/g at 76 °C for 41 min. The optimum extract yielded TPC 157.17 mg GAE/g dw and TFC 2.38 mg QE/g dw, while FRAP and DPPH values were 1258.52 and 933.67 μmol AAE/g dw, respectively. HPLC-DAD was utilized to identify and quantify specific polyphenols, like myricetin rhamnoside, in the extract. The optimal extract was then added to yogurt desserts during their preparation at three different concentrations to study how the physicochemical characteristics of the yogurt, as well as the antioxidant capacity added during enrichment, were affected. Statistical analysis of the results was carried out in order to obtain more valid data. It seems that the most suitable concentration for yogurt fortification was 0.1% w/v of the extract as, at this concentration, the yogurts exhibited higher antioxidant capacity, and their physicochemical characteristics were improved.

1. Introduction

Oxidative stress, which refers to the imbalance between reactive oxygen species and antioxidant compounds, has been associated with various pathological conditions such as neurodegenerative disorders, cardiovascular diseases, diabetes mellitus, and numerous other ailments [1]. Antioxidants are usually naturally occurring compounds that prevent the oxidation process of other molecules, thus ensuring cellular protection against oxidative stress. Due to their importance for safeguarding human health, much emphasis is being placed on increasing their consumption. In addition, naturally derived antioxidant compounds are gaining more and more interest. Considerable research has been devoted to the analysis of antioxidant compounds found in a variety of plant-based products [2]. Polyphenols, which are secondary bioactive compounds that exist naturally in plants, exhibit a variety of bioactive properties that contribute to the promotion of general well-being, with antioxidant potential being their major property [2,3,4]. The utilization of polyphenols has attracted significant interest across various industries, including food processing, preservation, and the pharmaceutical industry [5].
Cistus creticus is a Mediterranean perennial shrub of the Cistaceae family [6]. It is also known as rock rose and it is widely distributed in Europe, mainly in the Mediterranean region, in West Africa, and in Asia [7,8]. It is mainly native to the island of Crete in Greece [9]. The plant species thrives in arid, warm climates, ranging in altitude from sea level to eight hundred meters. It produces bisexual blossoms with multiple stamens and five violet petals. The fruit of C. creticus takes a capsule form, and it has small, water-resistant seeds [10]. These plants exhibit the ability to thrive in unfavorable environmental conditions, including adverse climates and poor soil quality [8]. In traditional medicine, various preparations are known and used primarily as anti-inflammatory, hemostatic, tonic, anti-diabetic, antispasmodic, and carminative agents [11]. Contemporary scientific investigations [9,12,13,14,15] have prioritized the process of isolating and identifying the compounds found in extracts and resins derived from Cistus species. Numerous studies [6,11,16,17,18,19,20,21] have also examined the biological and pharmacological activity of these compounds, which give rise to the therapeutic properties of the plant. Phytochemical investigations employing chromatographic and spectroscopic methodologies have demonstrated that Cistus possesses a variety of polyphenols [8]. Various terpenes, polyphenols, and flavonoids are also known to contribute to the chemical composition of the C. creticus species [6]. Furthermore, several investigations have demonstrated the capacity of Cistus species extracts to effectively impede the growth of leukemic and tumor human cell lines [6,22]. Flavonoid aglycones and glycosides are further secondary metabolites that can be found in Cistus species [22].
In recent years, humans have started to look for foods rich in antioxidant compounds of natural origin [23]. These foods can be classified as bioactive and offer many benefits to human health, as well as protection against various diseases [24]. Yogurts are dietary desserts that have many health benefits, as they contain lactic acid bacteria [25]. Current research suggests that lactic acid bacteria serve an essential role in human and animal health, including the ability to decrease the occurrence of chronic diseases, enhance nutritional status, boost immunity, facilitate growth, and alleviate stress [25,26,27]. Consequently, they hold significant importance in the food and pharmaceutical industries [28,29,30]. C. creticus is a plant that has a plethora of antioxidant and bioactive compounds, thus attracting interest. The aim of this work was dual. The first aim was to optimize the extraction conditions in order to maximize the extraction yield of bioactive compounds from the leaves of C. creticus. By carrying out the optimization process, optimum usage of resources was ensured, while the obtained extracts were rich in the extracted compounds. Since the as-prepared extracts held promise for usage in food product preparation, the second aim of this study was to utilize the obtained extracts in order to prepare yogurt desserts enriched with the extracted bioactive compounds. As such, the as-prepared yogurt desserts are expected to exhibit enhanced antioxidant activity, so that consumers can benefit from this bioactivity.

2. Materials and Methods

2.1. Chemicals, Materials and Reagents

Sodium acetate, aluminum chloride, iron chloride (hexahydrate), hydrochloric acid, L-ascorbic acid, phenol, ethanol, 2,4,6-tris(2-pyridyl)-s-triazine (TPTZ), DPPH (1,1-diphenyl-2-picrylhydrazyl), and all chemical standards used for HPLC-based analysis, namely, luteolin glucoside (≥98.0%), myricetin glucoside (≥98.0%), myricetin rhamnoside (≥99.0%), quercetin glucoside (≥98.0%), rutin (≥95.0%), and quercetin rhamnoside (≥95.0%) were purchased from Sigma-Aldrich (Steinheim, Germany). Gallic acid, sulfuric acid, Folin-Ciocalteu reagent, and anhydrous sodium carbonate were all obtained from Penta (Prague, Czech Republic).
Fresh leaves of C. creticus L. were collected in October 2022 from plants aged 2–3 years and grown in the Phthiotis region of Greece, specifically at the coordinates 38°58′22″ N and 22°19′09″ E and with an altitude of 510 m, as determined by Google Earth version 9.185.0.0. A typical C. creticus plant with its leaves is illustrated in Figure 1. The plant material was transported to the laboratory, where the leaves underwent a washing process using water, followed by drying using paper towels. Following this, the plant material was freeze-dried overnight at −60 °C for 24 h and subsequently ground into powder using a blender. The powder thus obtained exhibited an average particle diameter of 303 μm and was subsequently stored at −40 °C.

2.2. Extraction Procedure

An electronic analytical digital scale balance (Kern PLS 3100-2F, Kern & Sohn GmbH, Balingen, Germany) was used to weigh 1 g of C. creticus leaves in powder form. The powder was placed in a glass beaker along with water and the extraction procedure took place via stirring. The extraction was carried out at various liquid-to-solid ratios, temperatures, and time durations (Table 1). Following extraction, each sample was centrifuged in a NEYA centrifuge (Remi Elektrotechnik Ltd., Palghar, India) at 4500× g for 10 min. The supernatant was retracted and stored at −40 °C until further analysis.

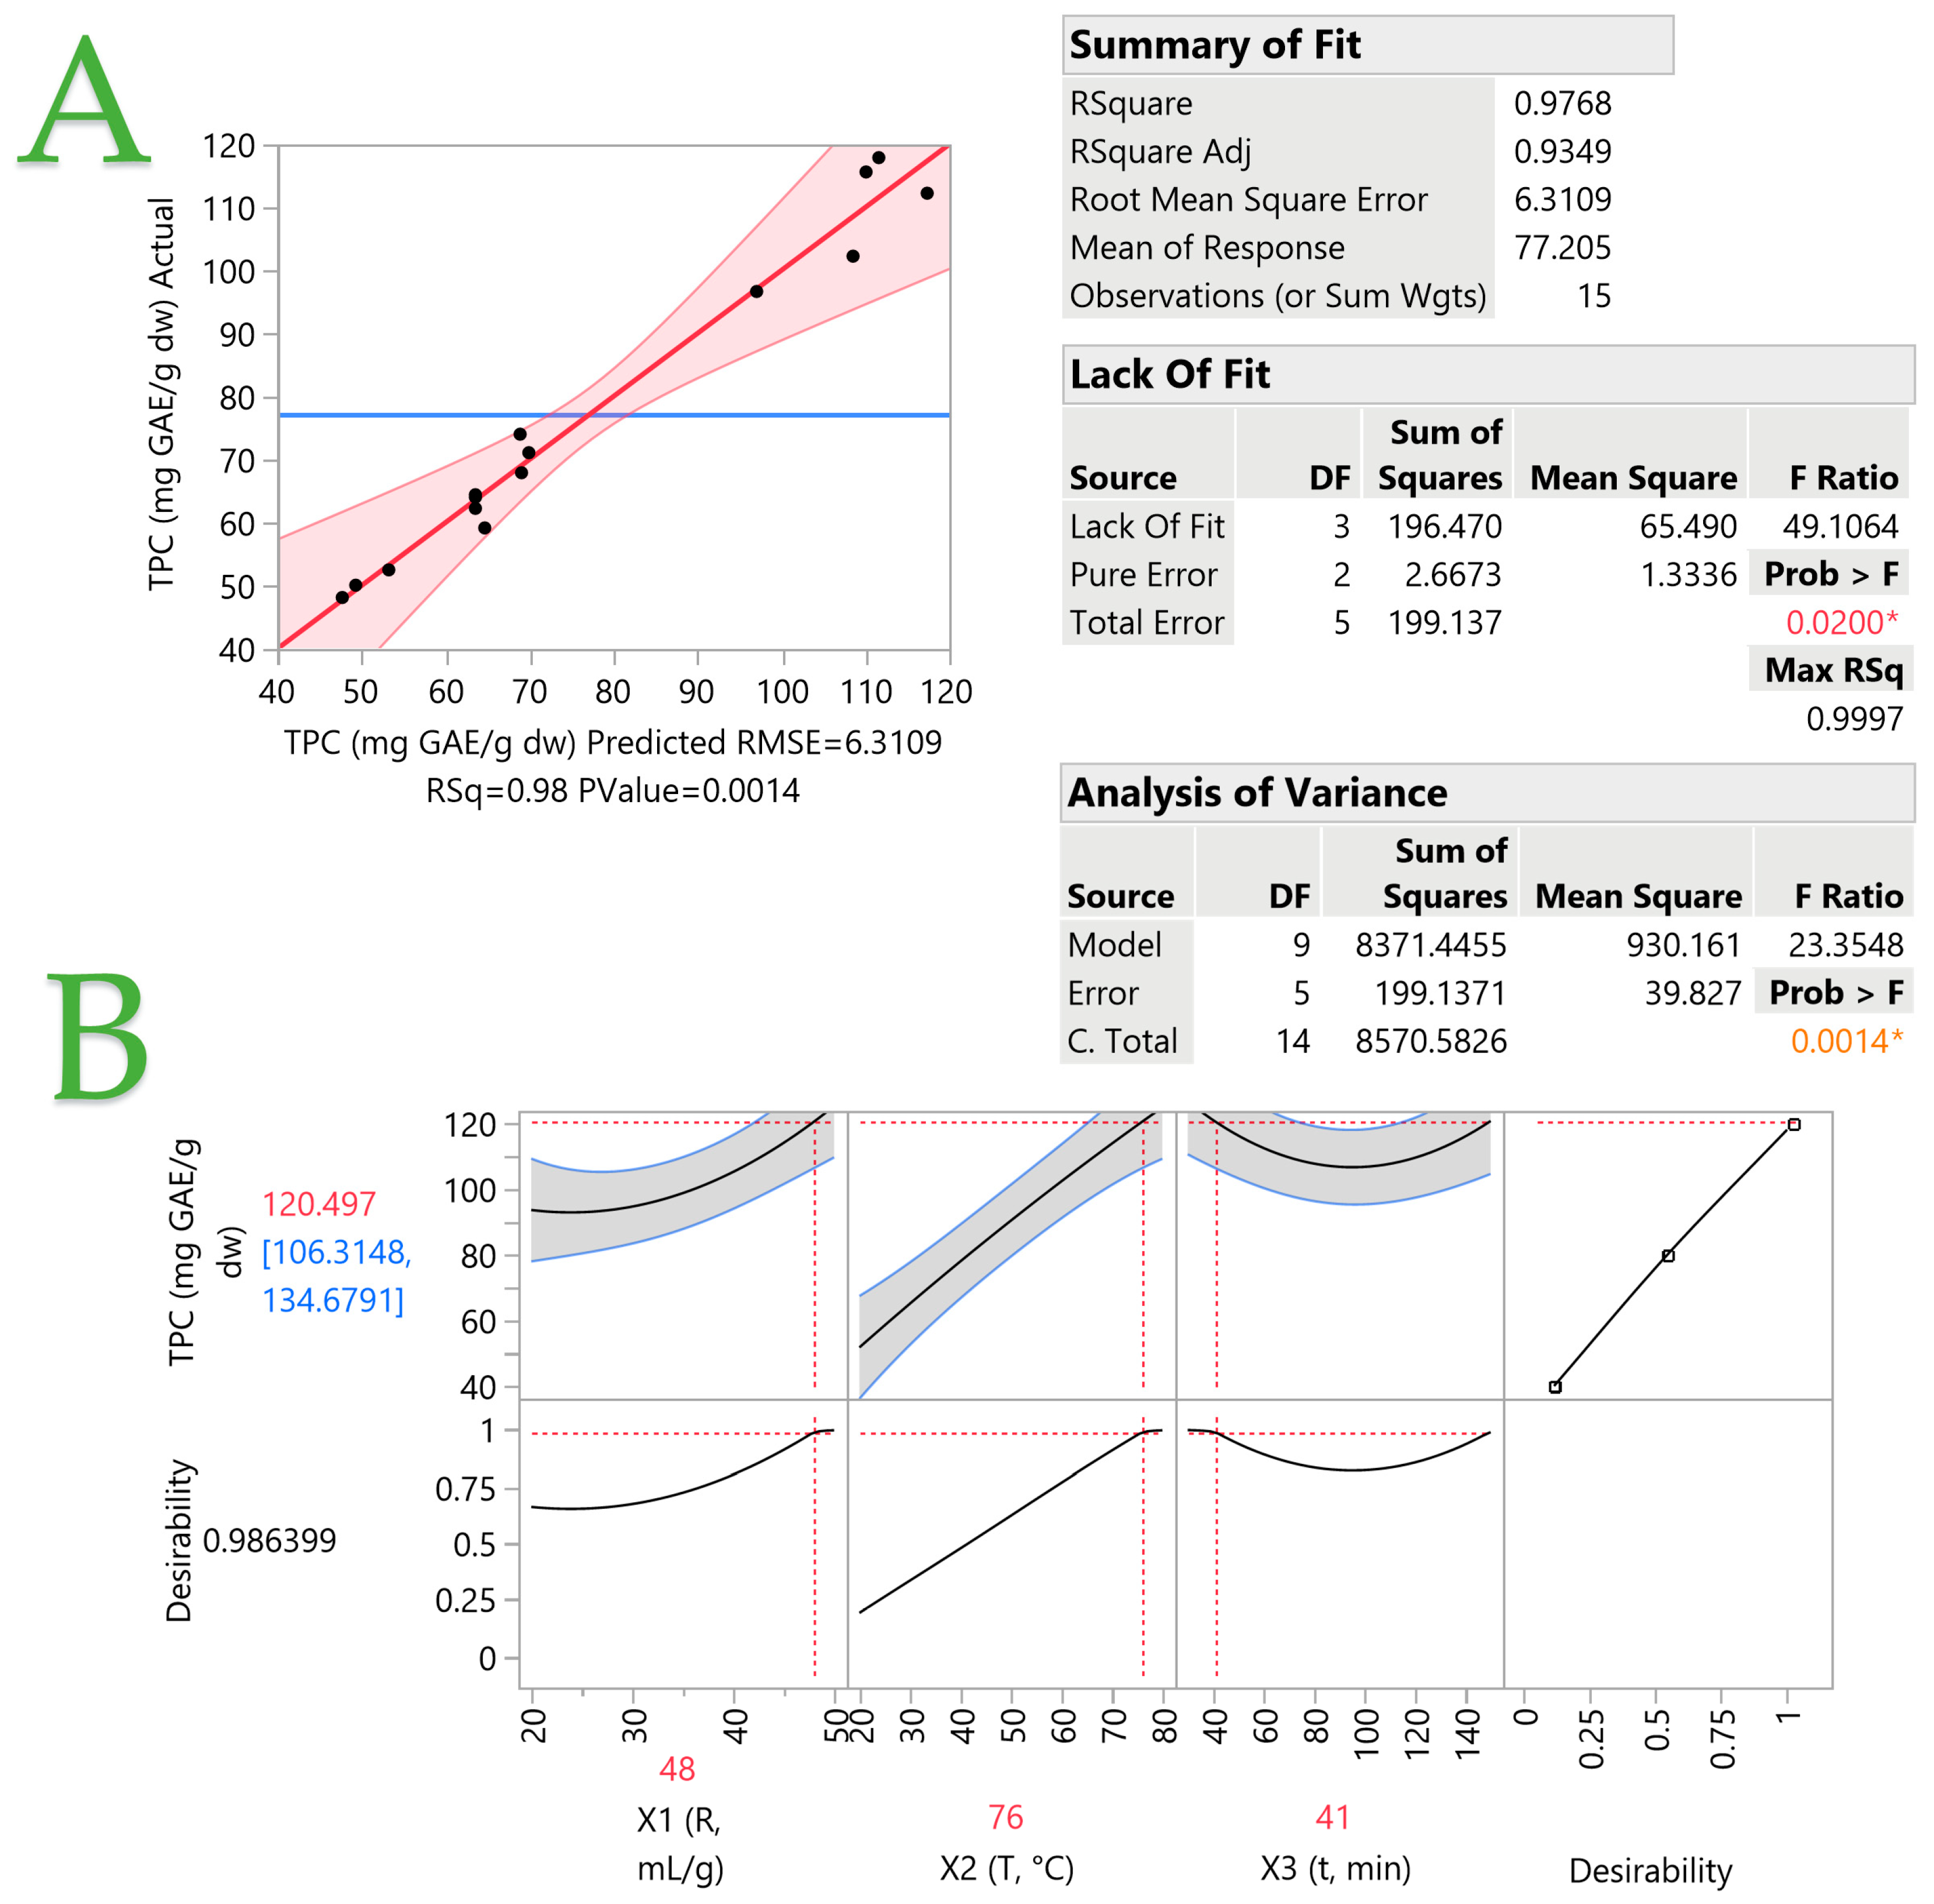
2.3. Response Surface Methodology (RSM) Optimization of Extraction and Experiment Design

Total polyphenol content (TPC) was extracted with the highest possible yield using RSM. An optimization process was conducted through a Box–Behnken design with a main effect screening layout and 15 design points, 3 of them acting as central points. The process variables were set up in 5 levels in accordance with the experimental design. Table 1 shows the coded independent variables and their values, examined to optimize the extraction. The significance of the model coefficients (equations) was determined at a minimum level of 95% using the analysis of variance (ANOVA), summary-of-fit and lack-of-fit tests.
The independent variables and their effects on the response variable were predicted using a second-order polynomial model, as shown in Equation (1) below:
Y k = β 0 + i = 1 2 β i X i + i = 1 2 β ii X i 2 + i = 1 2 j = i + 1 3 β ij X i X j
The predicted response variable appears as Yk, while the independent variables are Xi and Xj. The intercept and regression coefficients for the linear, quadratic, and interaction terms of the model are shown as β0, βi, βii, and βij, respectively.

2.4. Quantification of Total Polyphenol Content (TPC)

The determination of TPC was carried out using a previously described method [31]. Briefly, 100 μL of C. creticus extracts were combined with 100 μL of Folin-Ciocalteu reagent in a 1.5 mL Eppendorf tube. Following a 2-minute interval, 800 μL of 5% w/v sodium carbonate solution was introduced, followed by a 20-minute incubation at 40 °C. The measurement of absorbance was conducted at 740 nm in a UV-1700 Shimadzu spectrophotometer manufactured by Shimadzu Europa GmbH in Duisburg, Germany. A calibration curve (10–80 mg/L) was constructed utilizing gallic acid as the standard compound. Using the following Equation (2), the extraction yield in total polyphenols (YTP) was calculated as mg GAE per g of dry weight (dw):
Y TP ( mg GAE / g dw ) = C TP × V w
where C TP denotes the total polyphenol concentration (in mg GAE/L), V is the volume of the extraction medium (in L), and w is the dry weight of the sample (in g).

2.5. Determination of Total Flavonoid Content (TFC)

A previous methodology [32] was followed, in which 100 μL of the sample was combined with 860 μL of aqueous ethanol (35% v/v) and 40 μL of a reagent consisting of 0.5 M sodium acetate and 5% (w/v) aluminum chloride. After letting the mixture stand for 30 min at room temperature, the absorbance measurement at 415 nm was conducted. Total flavonoid concentration (CTFn) was determined with a quercetin calibration curve (30–300 mg/L in methanol). Using Equation (3), the extraction yield of total flavonoids (YTFn) is expressed as mg quercetin equivalents (QE) per g dry weight (dw):
Y TFn ( mg QE / g dw ) = C TFn × V w
where V is the volume of the extraction medium (in L), and w is the dry weight of the sample (in g).

2.6. Ferric-Reducing Antioxidant Power (FRAP) Assay

The FRAP assay was carried out in accordance with a previous method [33]. In an Eppendorf tube, 50 μL of the sample was combined with 50 μL of FeCl3 solution (4 mM in 0.05 M HCl). The resultant mixture was subsequently incubated at 37 °C for 30 min. Following the addition of 900 μL of TPTZ solution (1 mM in 0.05 M HCl), the absorbance at 620 nm was measured after 5 min. The determination of ferric-reducing power (PR) was determined as μmol ascorbic acid equivalents (AAE) per g of dw, using an ascorbic acid calibration curve (50–500 μmol/L in 0.05 M HCl). The quantification of the PR of the samples was conducted as described in Equation (4):
P R ( μ mol AAE / g dw ) = C A A × V w
where C A A denotes the measured concentration of ascorbic acid (in μmol/L), V is the volume of the extraction medium (in L), and w is the dry weight of the sample (in g).

2.7. Evaluation of Antiradical Activity (DPPH Assay)

A previously described assay for DPPH scavenging was used [34]. Following the addition of 975 μL of DPPH solution (100 μmol/L in methanol) to 25 μL of diluted sample extract (1:5), the absorbance at 515 nm was immediately measured (A515(i)), then again 30 min later (A515(f)). The expression for the radical scavenging capacity of DPPH is given in Equation (5):
Inhibition % = A 515 i A 515 f A 515 i × 100
Antiradical activity (AAR) was expressed as μmol ascorbic acid equivalents (AAE) per liter, using an ascorbic acid calibration curve. The AAR was computed utilizing Equation (6):
A AR ( μ mol DPPH / g dw ) = C A A × V w
where C A A denotes the measured concentration of ascorbic acid (in μmol/L), V is the volume of the extraction medium (in L), and w is the dry weight of the sample (in g).

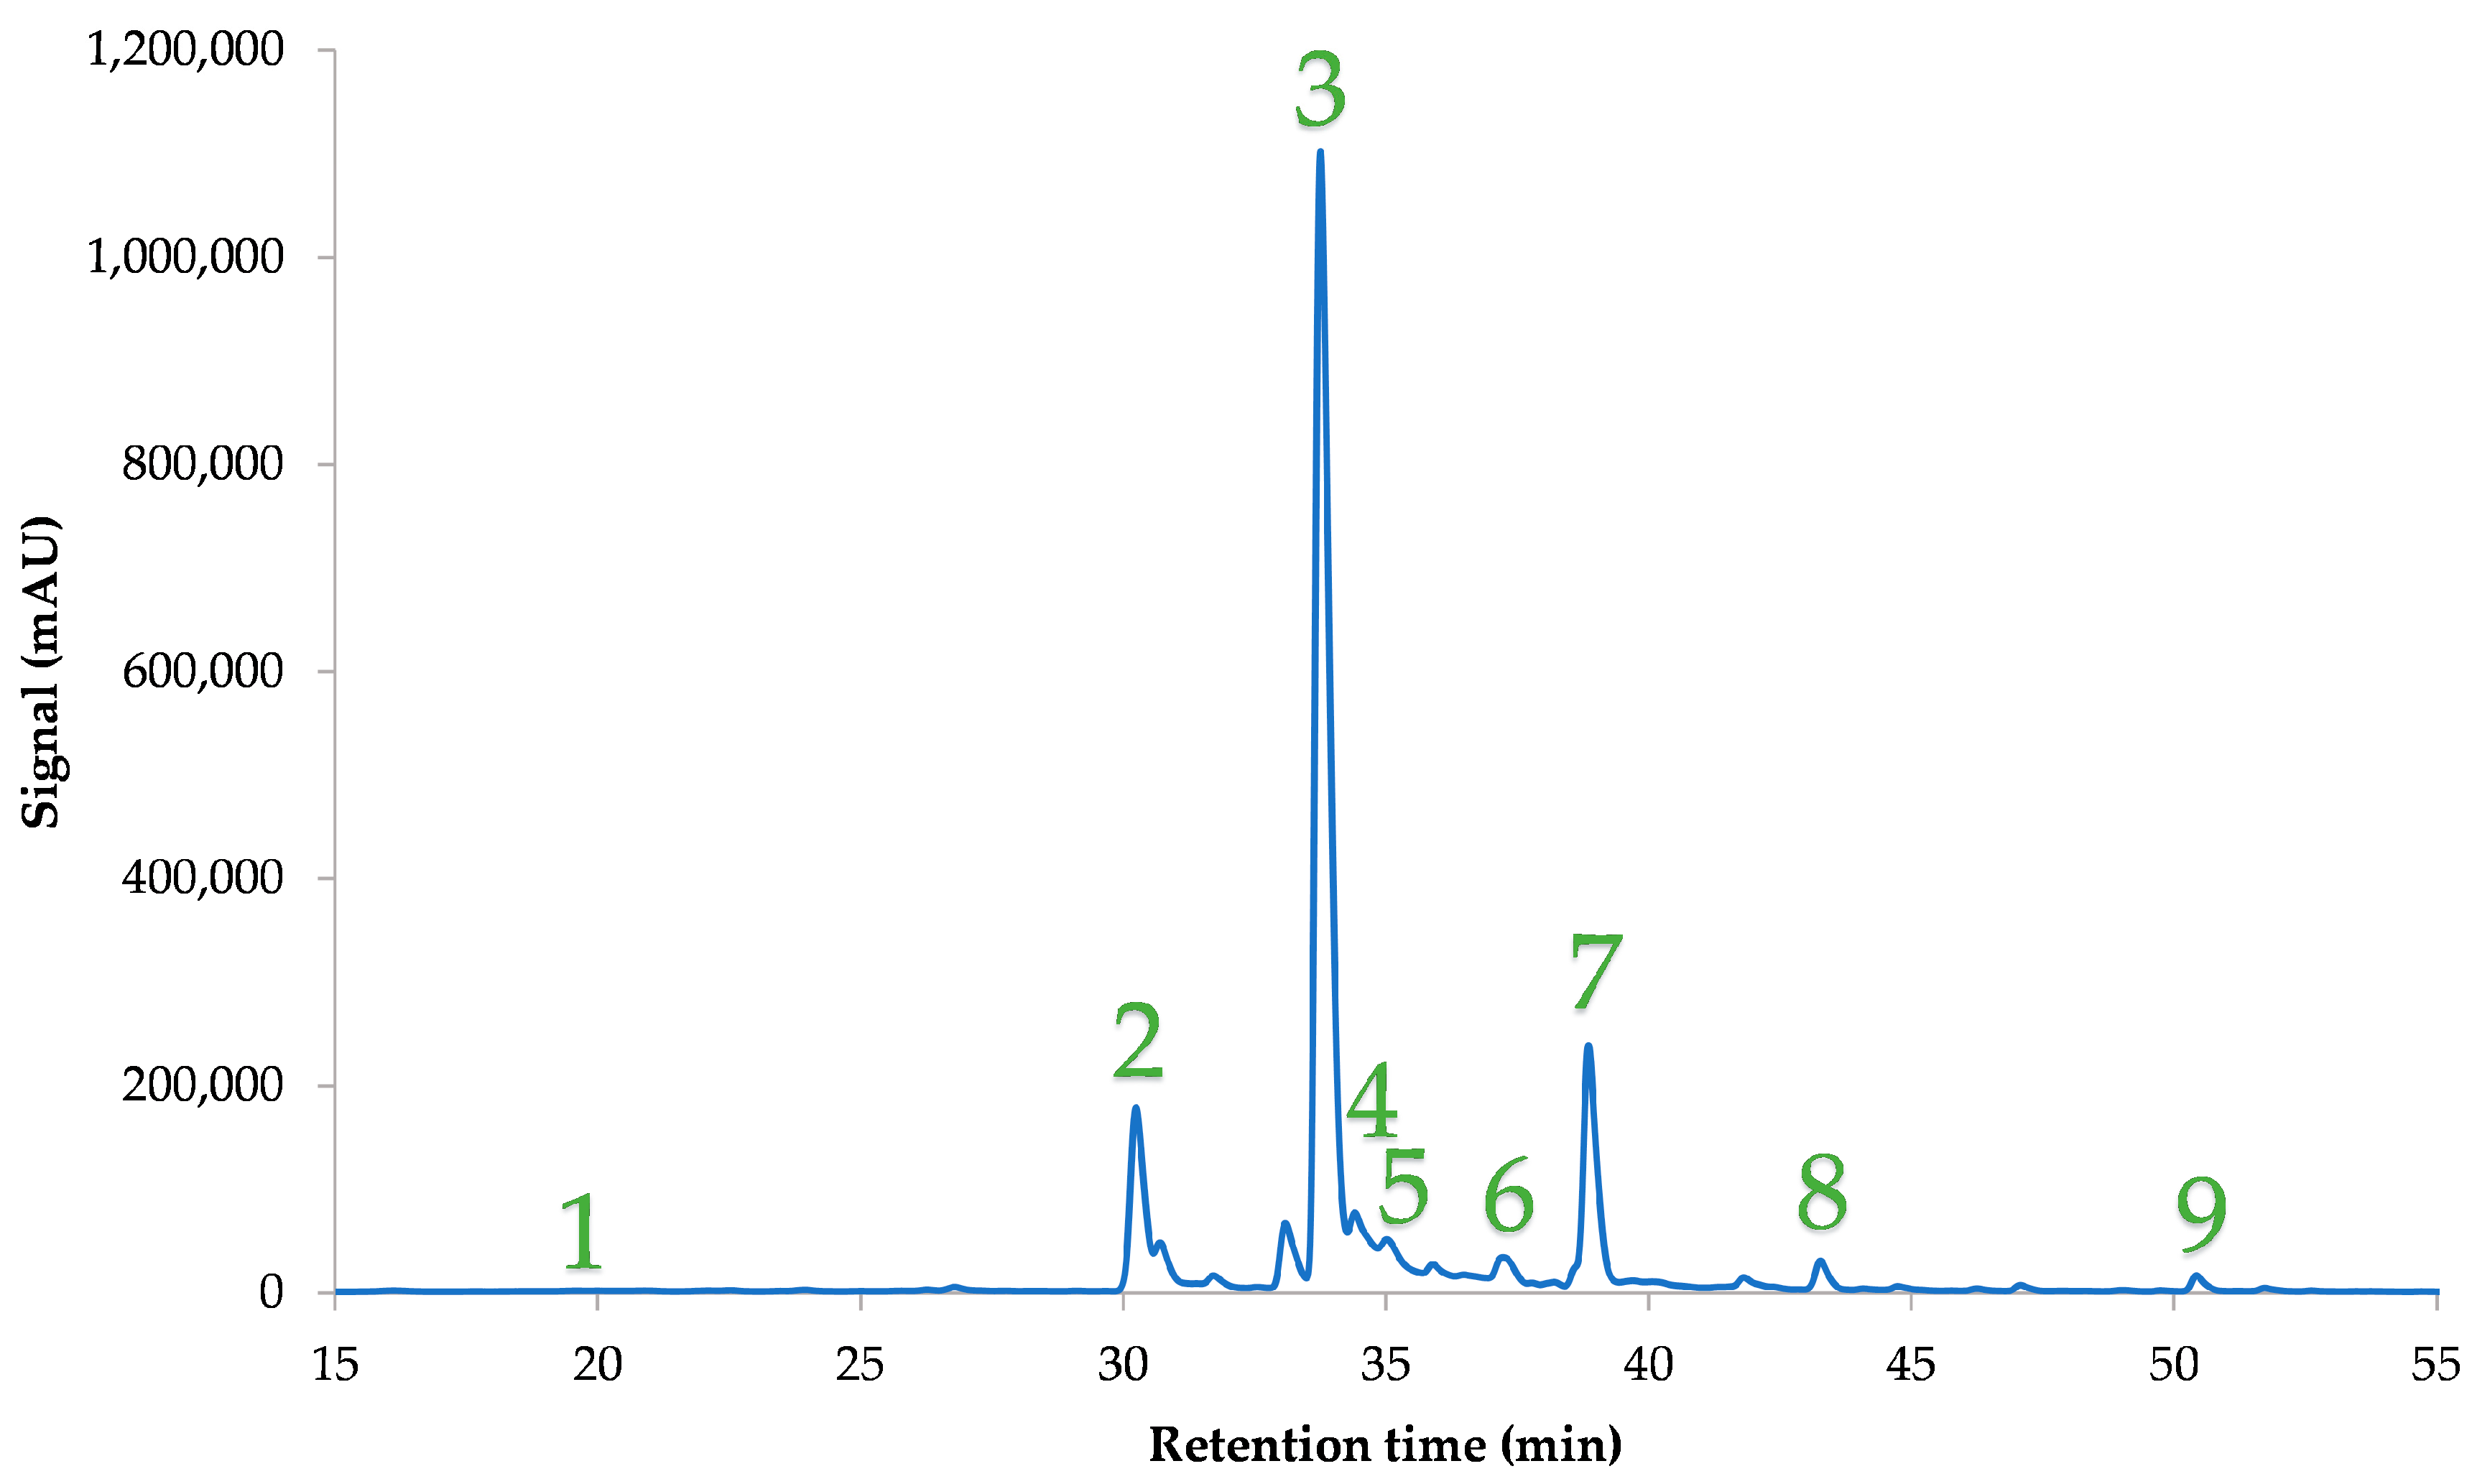
2.8. HPLC–DAD Analysis

A previously described process [35] was followed. Briefly, a Shimadzu CBM-20A liquid chromatograph and a Shimadzu SPD-M20A diode array detector (DAD) (both purchased from Shimadzu Europa GmbH, Duisburg, Germany) were used for the analysis of C. creticus extracts. The compounds were separated into a Luna C18(2) column from Phenomenex Inc. (Torrance, California) at 40 °C (100 Å, 5 μm, 4.6 mm × 250 mm). The mobile phase consisted of 0.5% aqueous formic acid (A) and 0.5% formic acid in acetonitrile/water (3:2) (B). The gradient program included an initial 0 to 40% B, then to 50% B in 10 min, to 70% B in another 10 min, and then constant for 10 min. The flow rate of the mobile phase was constant at 1 mL/min. Polyphenols were identified through a comparison of their absorbance spectrum and retention time to pure standards. Finally, they were quantified using calibration curves (0–50 μg/mL). Identifications of polyphenols derivatives and Luteolin 7-(2”-p-coumaroyl glucoside) were based on our previous study, after transferring, adapting, and validating the analysis method from an HPLC–DAD–MS (mass spectrometry) system to the current HPLC-DAD system [35].

2.9. Yogurt Preparation and Preliminary Sensory Evaluation

For the solid-structure yogurt dessert preparation, 1 L of full-fat cow’s milk, obtained from a local supermarket, was heated for 20 min at 85 °C. These conditions were chosen according to the literature as they are characterized as optimal yogurt dessert production conditions, leading to products with a low degree of syneresis [36]. The mixture was allowed to cool to 43 °C and the starter culture (Lactobacillus bulgaricus and Streptococcus thermophilus) was added, along with the C. creticus extract. The yogurt used for the starter culture was Greek traditional sheep yogurt and was also purchased from a local supermarket. The ratio of yogurt was 5 g for every 500 mL of milk. The extract was added in 5 different ratios of 0.01, 0.05, 0.10, 0.15, and 0.20% w/v. The mixture was stirred, covered airtight, and incubated at 38 °C for 4 h. The mixture was then placed in the refrigerator overnight to coagulate.
The enriched yogurt desserts were given to ten experienced trained panelists to evaluate their organoleptic characteristics (texture, aroma, and taste). The added extract concentrations tested were 0.01, 0.05, 0.10, 0.15 and 0.20% w/v. The panelists liked yogurt desserts enriched with 0.05 and 0.1% w/v of extract, while 0.01% w/v seemed to give no added flavor. Moreover, the two higher concentrations, 0.15 and 0.20% w/v, were not accepted by the panelists as they had too strong an added flavor and taste due to the extract. The texture of the yogurt dessert did not change significantly in any of the above cases, while the yogurt desserts with the two highest concentrations exhibited a yellowish hue and a strong flavor due to the extract. For this reason, only the three lowest concentrations of extract were further examined.

2.10. Determination of Lactose in Yogurt Dessert Samples

The Montgomery method [37] was employed with certain adaptations to determine the concentration of lactose. Specifically, 0.2 g of the sample was diluted in 100 mL of distilled water. Next, the mixture was centrifuged for 5 min at 4500× g (at room temperature) and the supernatant was collected. A volume of 0.1 mL of an aqueous phenol solution with a concentration of 80% w/v was added into the supernatant, followed by the immediate addition of 5 mL of concentrated sulfuric acid. The solution was subsequently agitated thoroughly and left for 30 min at room temperature. The absorbances of the samples were then measured with a spectrophotometer at 489 nm.

2.11. Determination of the Degree of Syneresis

The determination of syneresis in solid-structure yogurt desserts was conducted using the drainage method. This involved measuring the volume and weight of the serum after cutting and filtering a 100-gram sample. The volume of the sample was initially divided into quartiles and subsequently subjected to filtration using filter paper for a duration of 24 h. The serum was collected using a volumetric cylinder, and the weight of the serum at 24 h was measured and recorded. This measurement allowed for the calculation of the weight percentage (% w/w) deduction. The assessment of the extraction was conducted on the first and twenty-first day after the production of the yogurt desserts. The analyses were conducted in triplicate.

2.12. Determination of the Water-Holding Capacity

The assessment of the water-holding capacity of yogurt desserts was conducted using the approach established by Akalin et al. [38]. A total of 20 g of each sample was carefully transferred into test tubes that had been pre-weighed. The test tubes were then subjected to centrifugation at a speed of 6000× g for 10 min at a temperature of 20 °C. Subsequently, the weight of serum in g was determined by weighing the test tubes using a precision balance. The water-holding capacity of the yogurt desserts was assessed on two different days: day 1 and day 21 following their preparation. The percentage water-holding capacity was determined using Equation (7):
Water - holding capacity ( % ) = yogurt weight - serum weight yogurt weight × 100
This value was then expressed as a weight percentage relative to the yogurt weight. The analyses were conducted in triplicate.

2.13. Statistical Analysis

The statistical analysis related to the response surface methodology and distribution analysis, which were applicable through JMP® Pro 16 software (SAS, Cary, NC, USA). The Kolmogorov–Smirnov test was utilized to assess the normality of the data. A one-way analysis of variance (ANOVA) was carried out. The quantitative analysis was performed in triplicate, and the extraction procedures were repeated at least twice for each batch of C. creticus extract. The results are represented in the form of means and standard deviations. A significance level of p < 0.05 was applied to evaluate the statistical significance. Principal component analysis (PCA) was conducted using JMP® Pro 16 software.

3. Results and Discussion

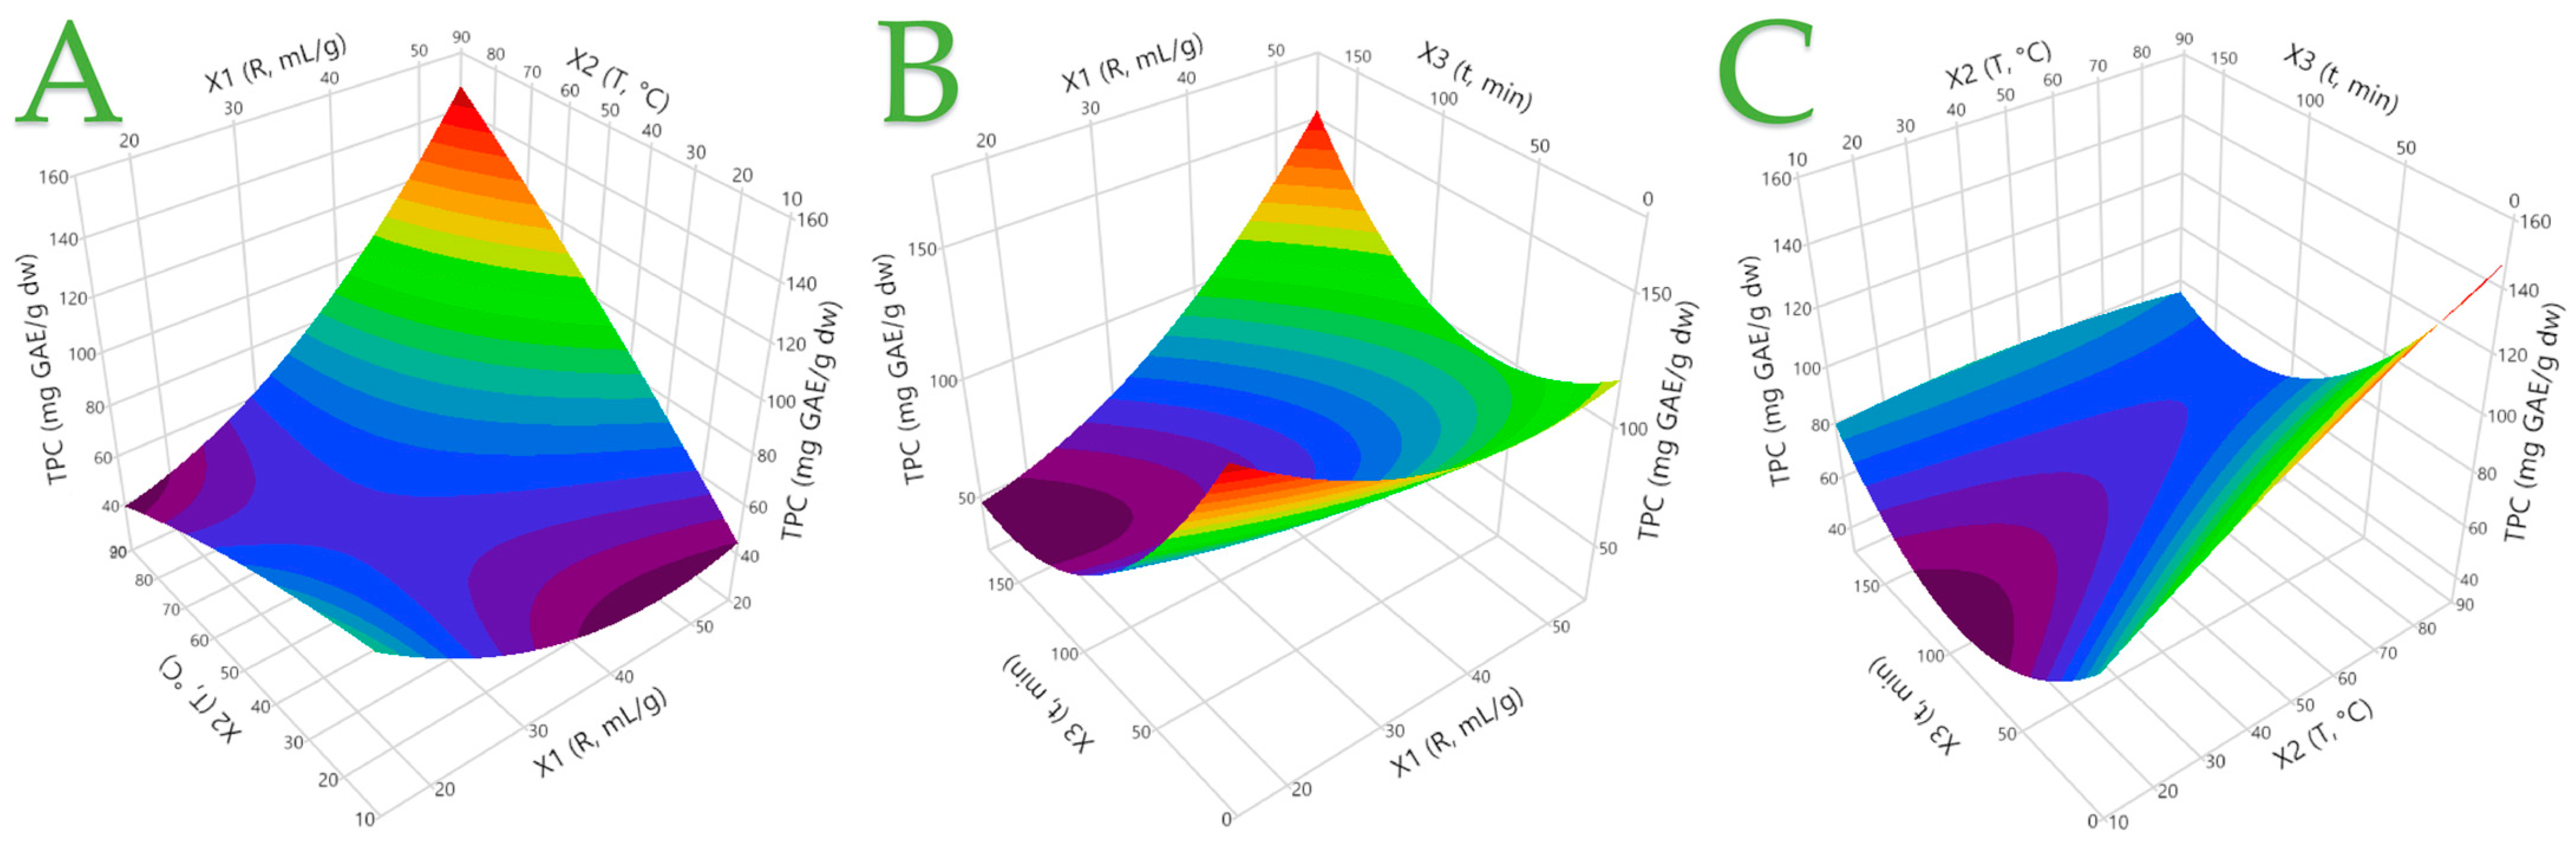
3.1. Extraction Optimization

To examine the impact of various extraction parameters, including the liquid-to-solid ratio, temperature, and time duration, and to enhance the efficiency of the extraction procedure, an RSM approach was utilized. One parameter that is often evaluated is the liquid-to-solid ratio. Regardless of the solvent used, the amount of extracted compounds increases as the liquid-to-solid ratio increases, according to the principles of mass transfer [39]. It is also important to optimize the extraction time and temperature in order to increase the efficiency of the extraction process. Since higher temperatures increase the solubility of solutes, it could be concluded that these two factors could synergistically improve the extraction process. However, it should be mentioned that there is a temperature limit beyond which polyphenolic compounds could undergo degradation [39]. Furthermore, previous research has indicated that both short [40] and long [41] extraction times are effective [39], so it is essential to carefully consider how time influences the extraction of specific compounds. A certain limitation, however, can be considered to be the duration of the extraction process, which does not exceed 150 min. However, this time was chosen so as to make feasible obtaining an extract rich in polyphenols within a reasonable amount of time. Water was the only extraction medium tested as the extracts would be used to enrich yogurt desserts and any traces of organic solvents could have a negative impact on the viability of the bacteria. The measured response encompassed the TPC. In addition, HPLC-DAD was employed for the identification and quantification of various polyphenolic compounds. Table 2 provides the experimental parameters utilized for extract preparation and the corresponding measured responses. The TPC values ranged from 48.12 to 117.86 mg GAE/g dw, indicating a variance of up to 144.93% among the samples. In Figure 2, a comparison between the observed and predicted responses (TPC, mg GAE/g dw) in the optimization of the extraction process of C. creticus from aqueous solutions is depicted. As shown in plot A, the predicted value has a positive correlation with the actual one, while the p-value is 0.0014 and the R2 (R square) has a value of 0.98, which enhances the validity of this result. It is evident that the highest TPC values occurred at design points 4, 7, and 12, where it appears that the higher liquid-to-solid ratio has a significant effect on the extraction of polyphenols. The extraction temperature seems to have an equally important role in increased polyphenol recovery. A temperature of at least or above 50 °C is considered necessary. These results are further verified below, as the desirability function for the optimization of the extraction process revealed a positive correlation between the X1 (liquid-to-solid ratio) and X2 (temperature) parameters with TPC. An increase in both, particularly X2, results in an increase in TPC. The correlation between the X3 (time) parameter and TPC appears to be low. However, it appears that the influence of X3 on TPC becomes more noticeable at shorter or longer time durations, while intermediate time durations do not significantly impact the response. These findings are also supported by the three-dimensional graphs in Figure 3. Once again, the positive correlation between X1 and X2 is highlighted, while in plot C, it is obvious that a shorter time duration and a high temperature result in higher TPC values. The desirability function (with a value of 0.9864) revealed that the optimal conditions for the maximum TPC recovery were a liquid-to-solid ratio of 48 mL/g at 76 °C for 41 min.

3.2. Optimal Extract Analysis

After the optimization of the extraction, various analyses were performed on the optimum extract to evaluate its polyphenol and flavonoid contents, as well as its antioxidant capacity. The results of the analyses are reported in Table 3. The TPC was 157.17 mg GAE/g dw, a value that is 30% higher than that obtained from the desirability function (Figure 2B). The TPC obtained in our study is ~40% and ~37% higher than the ones obtained by Abu-Orabi et al. [42] and Piluzza and Bullitta [43], who obtained 112.40 and 114.52 mg GAE/g dw, respectively, from C. creticus leaves. Moreover, the TPC determined in our study exceeds by ~138% the one reported by Ghalia et al. [44], who determined 65.99 mg GAE/g dw in C. creticus aerial parts (stems, flowers, and leaves). The total flavonoid value determined in the optimal extract was 2.38 mg QE/g dw, which is in line with Viapiana et al. [45], who determined the flavonoids in Cistus incanus hydromethanolic extracts. The antioxidant capacity of the extract was determined by two assays, FRAP and DPPH. The FRAP method yielded a value of 1258.52 μmol AAE/g dw, which is higher than the values determined in other Cistus plants. More specifically, Hitl et al. [46] found values ~99% and ~96% lower than the one obtained in the present study on aqueous extracts from Cistus salviifolius from two different locations, while Sayah et al. [47] determined FRAP values in aqueous extracts from C. salviifolius and Cistus monspeliensis that were 93.54% and 140.12% lower than ours, respectively.
In Figure 4 an indicative chromatogram of the optimum extract is presented, while Table 4 depicts the compounds identified via HPLC-DAD, along with their concentrations. Compounds denoted as “derivatives” were putatively annotated, based on their chromatographic behavior and UV absorbance patterns. In the Supplementary Materials, we provide the spectra of the compounds we identified in this study. Figure S1 shows the spectral data for each compound, including the maximum wavelength. However, they require further confirmation through more advanced techniques. The results obtained in our research are worth comparing with those from our previous study [31], given that the same analyses were conducted in both cases, in which solvents of increasing polarity were employed to extract bioactive compounds from C. creticus leaves. The same compounds were determined in the aqueous solutions, but since the extraction conditions were not optimized, the concentrations differed between the two studies. More specifically, the 1_myricetin glucoside derivative was quantified in an amount ~17% higher in the present study, while quercetin rhamnoside derivative, 2_quercetin glucoside derivative, and myricetin rhamnoside had higher concentrations after optimization in the present study, by ~19%, ~21%, and ~23%, respectively. Likewise, the luteolin 7-(2′′-p-coumaroylglucoside) and luteolin glucoside derivatives were ~31% and 40% higher, respectively. The greatest increase in the concentration of polyphenols occurred in rutin and the 1_quercetin glucoside derivative, where, in the first case, it was increased by ~84% and, in the second case, by 92%. On both occasions, the most abundant polyphenol was myricetin rhamnoside, followed by the quercetin rhamnoside derivative and 1_myricetin glucoside derivative. Lukas et al. [15] also established myricetin rhamnoside as the most abundant polyphenol in C. creticus plants from different regions. Furthermore, the same research team [15] also identified rutin in the C. creticus plant. Mastino et al. [48] also identified rutin via HPLC-MS in some Cistus plant extracts, such as from C. creticus subsp. creticus, C. creticus subsp. corsicus, and C. creticus subsp. eriocephalus. Moreover, Maggi et al. [22] determined the presence of rutin and myricetin rhamnoside through HPLC-MS in extracts from the C. creticus subsp. eriocephalus aerial parts. Rutin was also present in other Cistus species, such as C. incanus and C. monspeliensis, as reported by Santagati et al. [49]. However, there is a substantial difference between the yield of polyphenols quantified through the Folin-Ciocalteu method and through HPLC analysis. Some other polyphenolic compounds that could account for this difference, according to the literature [9], could be gallocatechin dimer, naringenin, apigenin, quinic acid, catechin, and gallocatechin catechin.

3.3. Analysis of the Enriched Yogurt Samples

The optimal extract of C. creticus was added to the yogurt desserts at three different ratios, namely, 0.01, 0.05, and 0.1% w/v. As a preliminary step, aqueous solutions of the extract at the three abovementioned concentrations were prepared and examined for their antioxidant properties. Table 5 provides the antioxidant characteristics (YTP, YTFn, PR, AAR) of the three aqueous extracts. In each case, the antioxidant properties were statistically different (p < 0.05), with the highest concentration exhibiting the greatest activity in each case. It is seen that in the lowest added concentration of the extract, no flavonoids were detected.
The physicochemical properties of yogurt enhanced with the C. creticus dry extract in various concentrations (C: control, E1: 0.01% extract, E2: 0.05% extract, and E3: 0.1% extract) at days 1, 10, and 21 are displayed in Table 6. Regarding the syneresis, it appears that the degree of syneresis in yogurt desserts decreased as the concentration of the added extract increased. This is a desirable result as syneresis negatively affects the acceptance level of the yogurt dessert among consumers [36]. Additives can function as stabilizers to decrease the level of syneresis in yogurt desserts. Essentially, they elevate the overall solid content of the yogurt dessert mixture, in order to reduce syneresis by around 14% w/w [36,50]. The C and the E1 exhibited considerable differences (p > 0.05) among the samples. Both E2 and E3 yogurts showed a low syneresis degree (p < 0.05) from day 1 to day 10 but their syneresis degree did differ (p > 0.05) from day 10 to day 21. Enhancing the water-holding capacity of yogurt desserts has been proven to reduce their susceptibility to syneresis during storage [51]. Regarding the water-holding capacity, the only significant difference (p > 0.05) occurred on the 21st day among the different yogurts. It appeared that the higher extract concentration enhanced the water-holding capacity of the yogurt more than the other ones [36]. In general, it seems that the C. creticus extract positively influenced the water-holding capacity, reducing the degree of syneresis. E3, in particular, showed several improved characteristics compared to the C sample.
The lactose content of the yogurts was also affected by enriching the yogurts with the optimal extract. As anticipated, the lactose concentration declined in all yogurt desserts during the storage period [52]. The concentration of microorganisms added to the yogurt dessert did not show a statistically significant difference with the addition of the leachate and the passage of days. Moreover, in the C sample, there were statistically significant differences (p > 0.05) in lactose content on all three different sampling days, which is not the case with the enriched yogurts. The two higher concentrations contributed to the delay in the rate of lactose decomposition from lactic acid bacteria in the enriched samples. The pH value showed slight differences (p < 0.05) within all samples. The pH was minimally affected by the addition of different concentrations of C. creticus optimal extract since on day 1, all samples had close pH values (4.22–4.24), on day 21, they had values between 3.89–3.97, while on day 21, little alteration was observed in the pH values (varying from 3.77 to 3.89). This was also the case in the work published by Sanz et al. [53], who used functional asparagus fiber extracts to enrich yogurt samples. Furthermore, Akalan et al. [54] reported that yogurt desserts enriched with stevia extracts exhibited lower pH values throughout the storage period. The acidity of all tested yogurt desserts increased progressively with time. This increase in acidity during storage may be attributed to the conversion of lactose into lactic acid by lactic acid bacteria [55,56].
The TPC of the samples had significant statistical differences (p > 0.05) in all samples on all days. While the C yogurt on the 1st day had a TPC of 1.46 mg GAE/100 g, the E1, E2, and E3 yogurts had ~120, ~1035, and ~2042% higher TPC, respectively. On the 10th day, the TPC yields of E1, E2, and E3 differed from C by ~98, ~991 and ~2164%. On the 21st day, the yields were ~51, ~1043, and ~2531% higher than the control sample. Flavonoids have been identified in only the E2 and E3 yogurt samples. In E2, no flavonoids were measured on day 21, and the values on days 1 and 10 showed a statistically significant difference (p > 0.05). E3 exhibited significant differences (p > 0.05) on all three sampling days. The antioxidant capacity of the yogurts was determined by both the FRAP and DPPH methods, and the results of the two tests were similar to one another. There were statistically significant differences, not only between the four yogurts on the three different sampling days but also between the values of the same yogurt measured on the three different sampling days. In both cases, E3 showed the highest antioxidant capacity of all the yogurts. Marchiani et al. [52], who enriched yogurt with grape pomace, established that the enriched yogurts exhibited higher TPC and TFC values and greater antioxidant capacity than the control.
It is safe to conclude that the enrichment of yogurt with C. creticus improves both the physicochemical characteristics of yogurt and its antioxidant capacity, especially at higher concentrations of the added extract. During the storage period of the yogurts, the optimal extract not only helped to reduce the degree of syneresis and lactose degradation to lactic acid, enhancing the water-holding capacity and lowering the acidity of the yogurts, but they also exhibited higher antioxidant capacity.

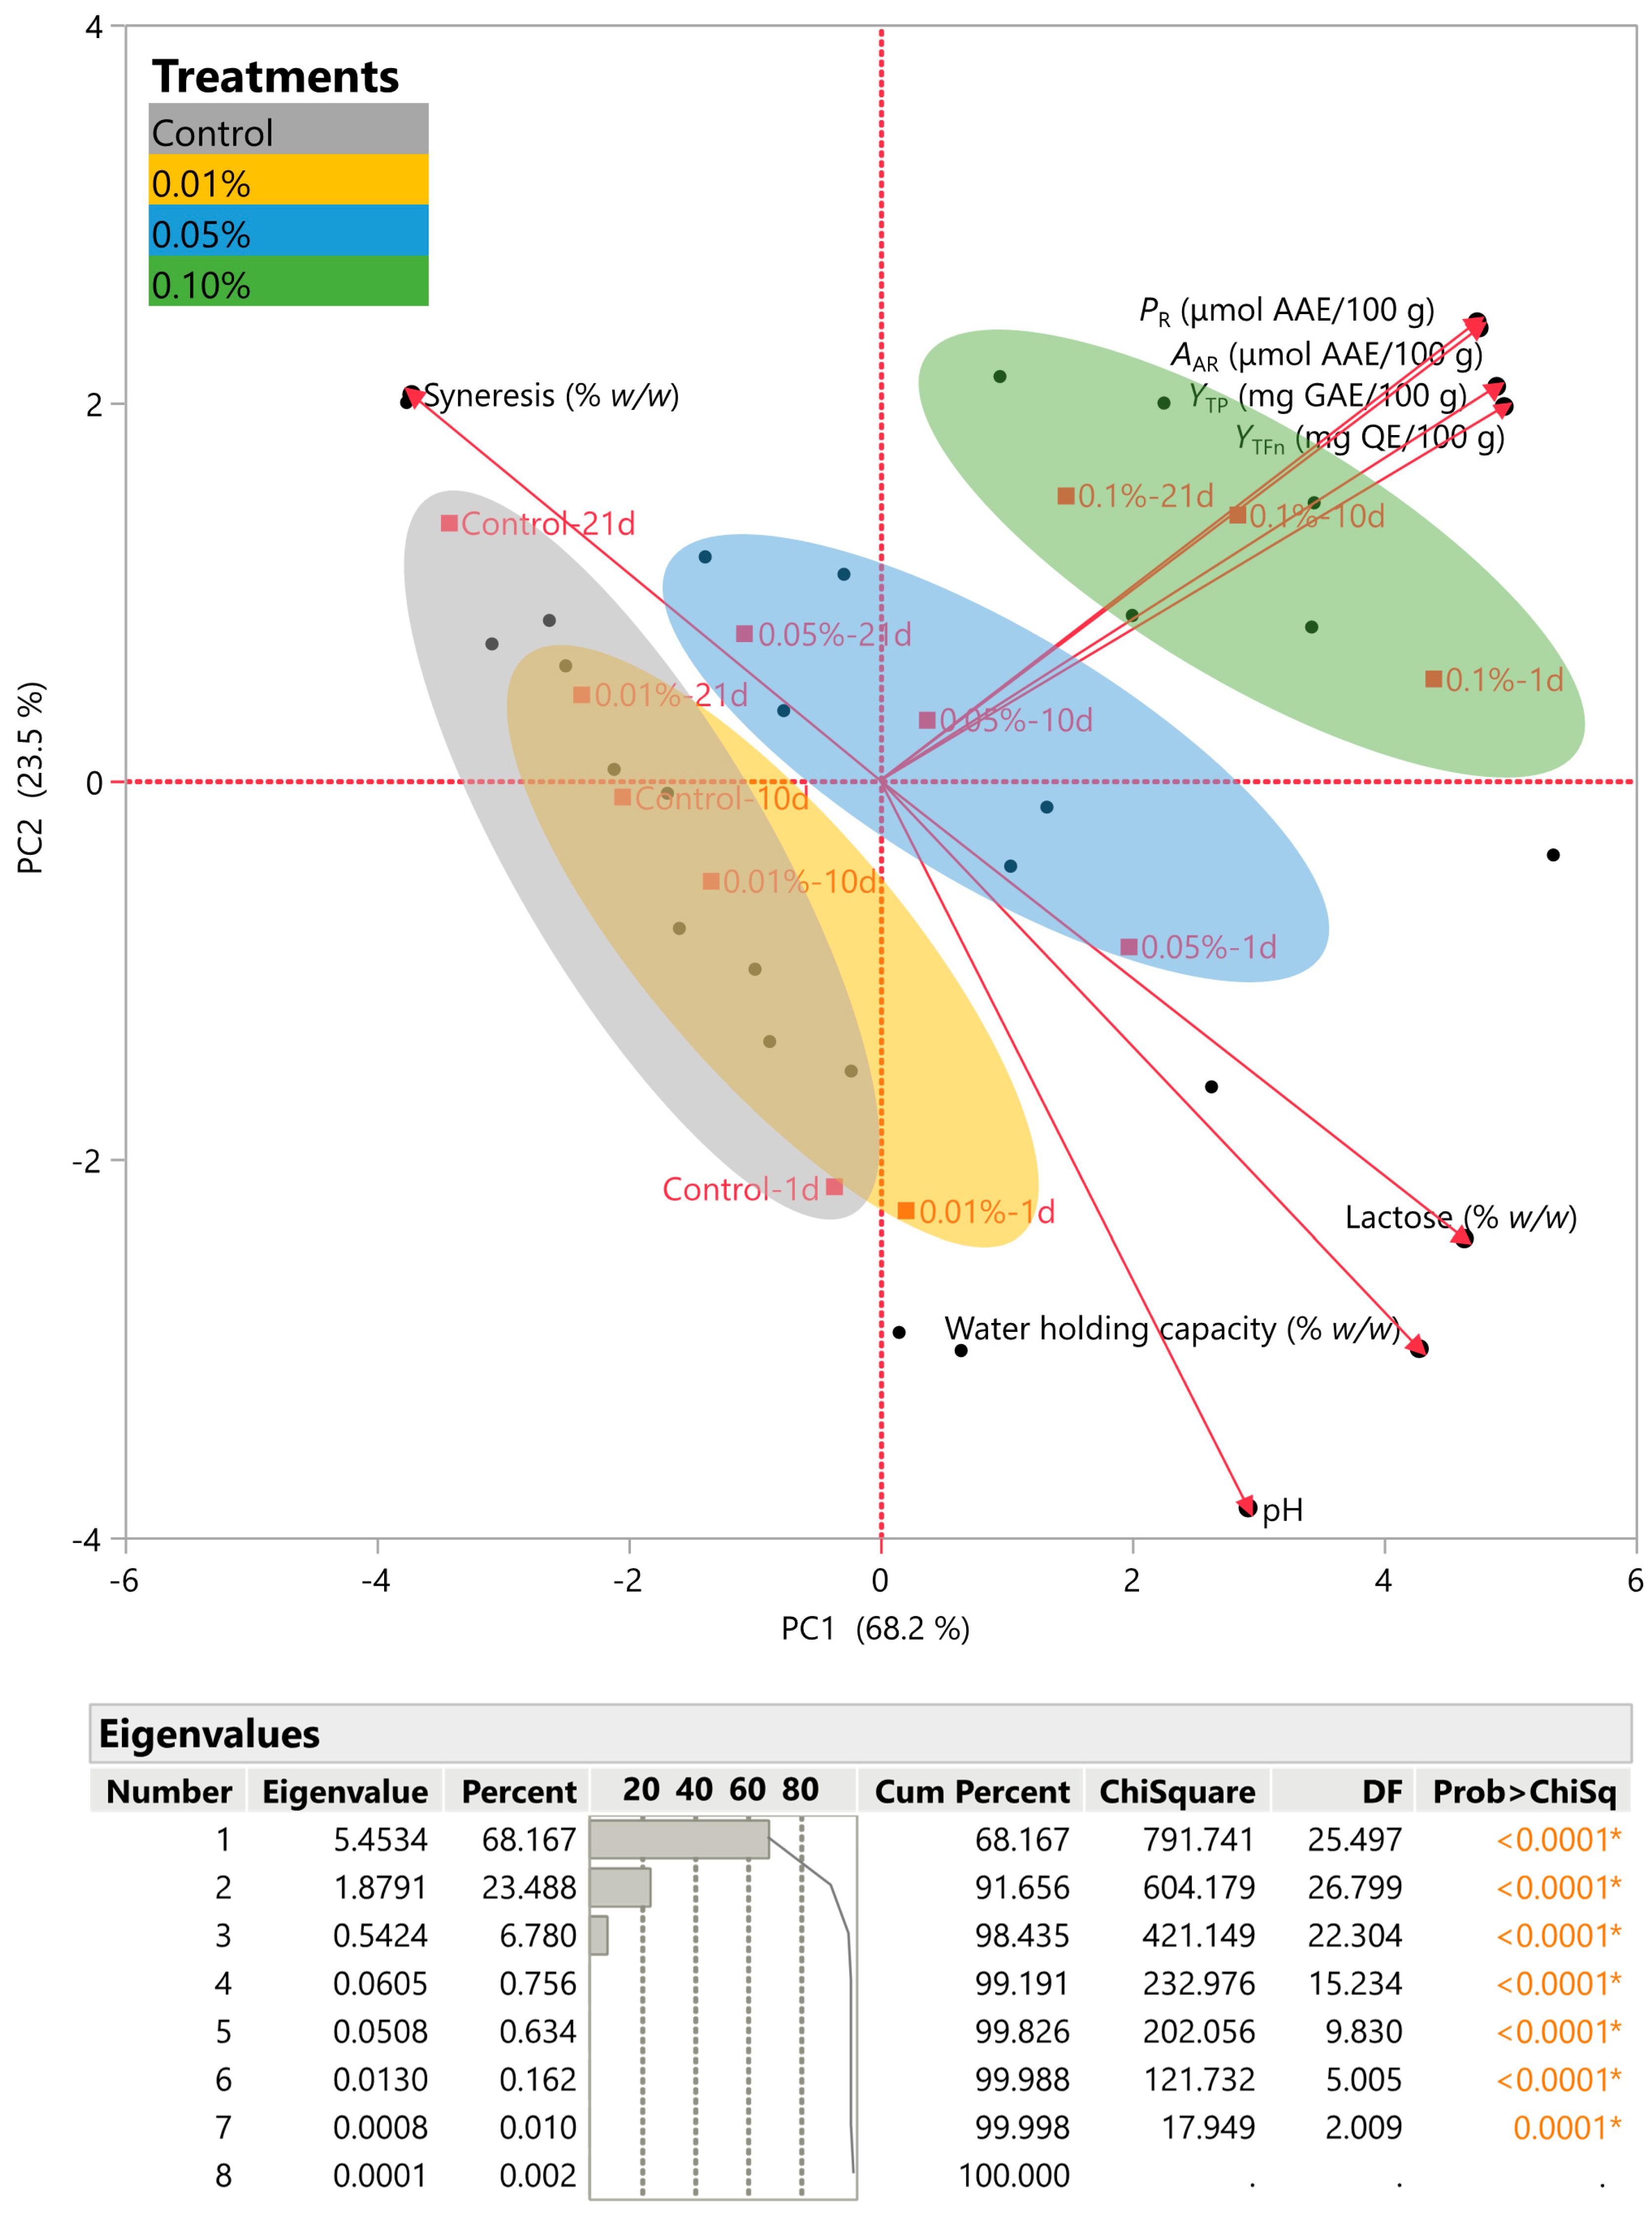
3.4. Principal Component Analysis (PCA)

PCA was utilized to perform a more complete analysis of the data and to obtain further information from the variables. The point was to investigate the potential correlation between various concentrations of C. creticus extracts and their TPC, TFC, FRAP assay, and DPPH radical scavenging activity. Additionally, it was intended that we examine the correlation of the physicochemical characteristics of the yogurt, including syneresis, water-holding capacity, and lactose concentration. Figure 5 illustrates the determination of two primary components, which collectively explain ~92% of the variance, as indicated by their eigenvalues. PC1 represented ~68% of the variance, while PC2 accounted for ~24% of the variance. Variables such as PR, AAR, YTP, YTFn, lactose, pH, and water-holding capacity exhibited positive correlations with the principal component 1 (PC1). In contrast, an inverse relationship was observed between PC1 and syneresis. Similarly, a significant positive correlation was observed between PC2 and the variables of syneresis, PR, AAR, YTP, and YTFn. Furthermore, a negative correlation was observed between syneresis and pH, water-holding capacity, and lactose. One last point of equal interest concerns the relative placement of the yogurt samples enriched with different concentrations (0.01, 0.05, and 0.1% w/v) of the optimum extract. The control sample after 21 days was close to syneresis, while the 0.1% w/v-enriched yogurt (1, 10, and 21 days) was close to PR, AAR, YTP, and YTFn, especially on day 10. All the enriched yogurt dessert samples were placed far from the syneresis factor.

4. Conclusions

In this study, the optimal conditions for the extraction of polyphenols and flavonoids, from C. creticus leaves were explored. The optimal conditions were determined by RSM and were a liquid-to-solid ratio of 48 mL/g at 76 °C for 41 min. The optimum extract yielded TPC 157.17 mg GAE/g dw and TFC 2.38 mg QE/g dw, while the FRAP and DPPH values were 1258.52 and 933.67 μmol AAE/g dw, respectively. Under optimal conditions, three different ratios were chosen to be added to the yogurt during the sample preparation. Based on the findings, it appears that a concentration of 0.1% w/v of the extract proved to be the most appropriate for yogurt enrichment. This concentration resulted in enhanced antioxidant capacity. Furthermore, the physicochemical characteristics of the yogurts were improved. More specifically, the addition of 0.1% w/v C. creticus extract to yogurt contributed to increasing the water-holding capacity of yogurt and consequently reduced the degree of syneresis, making the food more stable for a longer period. This could contribute to the longer shelf-life of the yogurt dessert. In addition, its addition helped reduce the rate of pH reduction, making yogurt desserts less acidic over the passing days. Finally, yogurt enriched with this concentration exhibited a stronger antioxidant activity compared to the other yogurt desserts. The findings of this study indicate that C. creticus leaf extracts have the potential to serve as a viable and secure source of antioxidants in regular dietary intake. They also serve as a good food additive as they add beneficial health properties to yogurt desserts. In the future, the extracts could be further utilized to enrich other foods, such as juices, creams, biscuits, cereal bars, and even various beverages. Furthermore, green techniques such as microwave-assisted extraction, pulsed electric field extraction, cloud point extraction, and ultrasound-assisted extraction, etc., could be investigated as possible techniques that can be utilized for the extraction of bioactive compounds from the leaves of C. creticus, or even other plants, for the enrichment of various foods.

Supplementary Materials

The following supporting information can be downloaded at: https://www.mdpi.com/article/10.3390/oxygen4010005/s1. Figure S1 shows the spectral data for each identified compound, including the maximum wavelength.

Author Contributions

Conceptualization, T.C., V.A. and S.I.L.; methodology, T.C., V.A. and E.B.; software, V.A.; validation, D.P., T.C. and V.A.; formal analysis, D.P., V.A., E.B. and T.C.; investigation, D.P.; resources, S.I.L.; data curation, D.P.; writing—original draft preparation, Μ.Μ.; writing—review and editing, V.A., T.C., M.M., D.P., E.B., D.P.M. and S.I.L.; visualization, V.A.; supervision, D.P.M. and S.I.L.; project administration, S.I.L. All authors have read and agreed to the published version of the manuscript.

Funding

This research received no external funding.

Institutional Review Board Statement

Not applicable.

Informed Consent Statement

Not applicable.

Data Availability Statement

All related data and methods are presented in this paper. Additional inquiries should be addressed to the corresponding author.

Conflicts of Interest

The authors declare no conflicts of interest.

References

  1. Hayes, J.D.; Dinkova-Kostova, A.T.; Tew, K.D. Oxidative Stress in Cancer. Cancer Cell 2020, 38, 167–197. [Google Scholar] [CrossRef] [PubMed]
  2. Rathod, N.B.; Kulawik, P.; Ozogul, F.; Regenstein, J.M.; Ozogul, Y. Biological Activity of Plant-Based Carvacrol and Thymol and Their Impact on Human Health and Food Quality. Trends Food Sci. Technol. 2021, 116, 733–748. [Google Scholar] [CrossRef]
  3. Rathod, N.B.; Ranveer, R.C.; Benjakul, S.; Kim, S.-K.; Pagarkar, A.U.; Patange, S.; Ozogul, F. Recent Developments of Natural Antimicrobials and Antioxidants on Fish and Fishery Food Products. Compr. Rev. Food Sci. Food Saf. 2021, 20, 4182–4210. [Google Scholar] [CrossRef]
  4. Usman, I.; Hussain, M.; Imran, A.; Afzaal, M.; Saeed, F.; Javed, M.; Afzal, A.; Ashfaq, I.; Al Jbawi, E.; Saewan, S.A. Traditional and Innovative Approaches for the Extraction of Bioactive Compounds. Int. J. Food Prop. 2022, 25, 1215–1233. [Google Scholar] [CrossRef]
  5. Rathod, N.B.; Elabed, N.; Punia, S.; Ozogul, F.; Kim, S.-K.; Rocha, J.M. Recent Developments in Polyphenol Applications on Human Health: A Review with Current Knowledge. Plants 2023, 12, 1217. [Google Scholar] [CrossRef] [PubMed]
  6. Skorić, M.; Todorović, S.; Gligorijević, N.; Janković, R.; Živković, S.; Ristić, M.; Radulović, S. Cytotoxic Activity of Ethanol Extracts of in Vitro Grown Cistus creticus Subsp. Creticus L. on Human Cancer Cell Lines. Ind. Crops Prod. 2012, 38, 153–159. [Google Scholar] [CrossRef]
  7. Pamuk, A.; Gedikoğlu, A.; Sökmen, M. Use of a Natural Antioxidant, Cistus creticus Extract, on Lipid Oxidation and Shelf Life of Ready-to-Eat Beef Cocktail Sausages. J. Food Process. Preserv. 2022, 46, e16913. [Google Scholar] [CrossRef]
  8. Agnieszka Stępień, A.; David Aebisher, D.; Dorota Bartusik-Aebisher, D. Biological Properties of Cistus Species. Eur. J. Clin. Exp. Med. 2018, 16, 127–132. [Google Scholar] [CrossRef]
  9. Skorić, M.; Ćirić, A.; Budimir, S.; Janošević, D.; Anđelković, B.; Todosijević, M.; Todorović, S.; Soković, M.; Glamočlija, J.; Tešević, V.; et al. Bioactivity-Guided Identification and Isolation of a Major Antimicrobial Compound in Cistus creticus Subsp. Creticus Leaves and Resin “Ladano”. Ind. Crops Prod. 2022, 184, 114992. [Google Scholar] [CrossRef]
  10. Christodoulakis, N.S.; Georgoudi, M.; Fasseas, C. Leaf Structure of Cistus creticus L. (Rock Rose), a Medicinal Plant Widely Used in Folk Remedies Since Ancient Times. J. Herbs Spices Med. Plants 2014, 20, 103–114. [Google Scholar] [CrossRef]
  11. Karadağ, A.E.; Çaşkurlu, A.; Okur, M.E.; Guzelmeric, E.; Okur, N.Ü.; Tosun, F.; Yesilada, E.; Demirci, F. Hemostatic Activity of Cistus creticus Extract in Wistar Albino Rats. Rev. Bras. Farmacogn. 2020, 30, 844–847. [Google Scholar] [CrossRef]
  12. Atsalakis, E.; Chinou, I.; Makropoulou, M.; Karabournioti, S.; Graikou, K. Evaluation of Phenolic Compounds in Cistus creticus Bee Pollen from Greece. Antioxidant and Antimicrobial Properties. Nat. Prod. Commun. 2017, 12, 1934578X1701201141. [Google Scholar] [CrossRef]
  13. Matłok, N.; Lachowicz, S.; Gorzelany, J.; Balawejder, M. Influence of Drying Method on Some Bioactive Compounds and the Composition of Volatile Components in Dried Pink Rock Rose (Cistus creticus L.). Molecules 2020, 25, 2596. [Google Scholar] [CrossRef] [PubMed]
  14. Düz, M.; Yakut, Ö. Microwave-Assisted Green Synthesis, Characterization, and Antioxidant Activity of Silver Nanoparticles Using the Aqueous Extract of Cistus Creticus. Part. Sci. Technol. 2023, 41, 589–599. [Google Scholar] [CrossRef]
  15. Lukas, B.; Bragagna, L.; Starzyk, K.; Labedz, K.; Stolze, K.; Novak, J. Polyphenol Diversity and Antioxidant Activity of European Cistus creticus L. (Cistaceae) Compared to Six Further, Partly Sympatric Cistus Species. Plants 2021, 10, 615. [Google Scholar] [CrossRef]
  16. Kiliç, D.D.; Siriken, B.; Ertürk, Ö.; Tanrikulu, G.; Gül, M.; Baskan, C. Antibacterial, Antioxidant and DNA Interaction Properties of Cistus creticus L. Extracts. J. Int. Environ. Appl. Sci. 2019, 14, 110–115. [Google Scholar]
  17. Ait Lahcen, S.; El Hattabi, L.; Benkaddour, R.; Chahboun, N.; Ghanmi, M.; Satrani, B.; Tabyaoui, M.; Zarrouk, A. Chemical Composition, Antioxidant, Antimicrobial and Antifungal Activity of Moroccan Cistus creticus Leaves. Chem. Data Collect. 2020, 26, 100346. [Google Scholar] [CrossRef]
  18. Paolessi, P.; Nicoletti, M.; Catoni, R.; Puglielli, G.; Toniolo, C.; Gratani, L. Cistus creticus Subsp. Eriocephalus as a Model for Studying Plant Physiological and Metabolic Responses to Environmental Stress Factors. Chem. Biodivers. 2015, 12, 1862–1870. [Google Scholar] [CrossRef]
  19. Jankovics, I.; Borsos, M.; Mirani, S.; Dénes, B. Early Use of Polyphenol-Rich Cistus creticus Extract Containing Nasopharyngeal Spray Is Associated with Significantly Shorter Duration of Symptoms in Mild COVID-19 Patients: A Retrospective Case-Control Study. J. Community Med. Public Health Rep. 2021, 2, 1–5. [Google Scholar] [CrossRef]
  20. Lo Bianco, M.; Grillo, O.; Cañadas, E.; Venora, G.; Bacchetta, G. Inter- and Intraspecific Diversity in Cistus L. (Cistaceae) Seeds, Analysed with Computer Vision Techniques. Plant Biol. 2017, 19, 183–190. [Google Scholar] [CrossRef] [PubMed]
  21. Kuchta, K.; Tung, N.H.; Ohta, T.; Uto, T.; Raekiansyah, M.; Grötzinger, K.; Rausch, H.; Shoyama, Y.; Rauwald, H.W.; Morita, K. The Old Pharmaceutical Oleoresin Labdanum of Cistus creticus L. Exerts Pronounced in Vitro Anti-Dengue Virus Activity. J. Ethnopharmacol. 2020, 257, 112316. [Google Scholar] [CrossRef] [PubMed]
  22. Maggi, F.; Lucarini, D.; Papa, F.; Peron, G.; Dall’Acqua, S. Phytochemical Analysis of the Labdanum-Poor Cistus creticus Subsp. Eriocephalus (Viv.) Greuter et Burdet Growing in Central Italy. Biochem. Syst. Ecol. 2016, 66, 50–57. [Google Scholar] [CrossRef]
  23. Favela-González, K.M.; Hernández-Almanza, A.Y.; De la Fuente-Salcido, N.M. The Value of Bioactive Compounds of Cruciferous Vegetables (Brassica) as Antimicrobials and Antioxidants: A Review. J. Food Biochem. 2020, 44, e13414. [Google Scholar] [CrossRef]
  24. Ben-Othman, S.; Jõudu, I.; Bhat, R. Bioactives from Agri-Food Wastes: Present Insights and Future Challenges. Molecules 2020, 25, 510. [Google Scholar] [CrossRef] [PubMed]
  25. Huang, Y.-Y.; Lu, Y.-H.; Liu, X.-T.; Wu, W.-T.; Li, W.-Q.; Lai, S.-Q.; Aadil, R.M.; Riaz Rajoka, M.S.; Wang, L.-H.; Zeng, X.-A. Metabolic Properties, Functional Characteristics, and Practical Application of Streptococcus Thermophilus. Food Rev. Int. 2023, 1–22. [Google Scholar] [CrossRef]
  26. Riaz Rajoka, M.S.; Mehwish, H.M.; Siddiq, M.; Haobin, Z.; Zhu, J.; Yan, L.; Shao, D.; Xu, X.; Shi, J. Identification, Characterization, and Probiotic Potential of Lactobacillus Rhamnosus Isolated from Human Milk. LWT 2017, 84, 271–280. [Google Scholar] [CrossRef]
  27. Tang, W.; Dong, M.; Wang, W.; Han, S.; Rui, X.; Chen, X.; Jiang, M.; Zhang, Q.; Wu, J.; Li, W. Structural Characterization and Antioxidant Property of Released Exopolysaccharides from Lactobacillus Delbrueckii ssp. Bulgaricus SRFM-1. Carbohydr. Polym. 2017, 173, 654–664. [Google Scholar] [CrossRef] [PubMed]
  28. De Simone, C. The Unregulated Probiotic Market. Clin. Gastroenterol. Hepatol. 2019, 17, 809–817. [Google Scholar] [CrossRef]
  29. Dowarah, R.; Verma, A.K.; Agarwal, N.; Singh, P.; Singh, B.R. Selection and Characterization of Probiotic Lactic Acid Bacteria and Its Impact on Growth, Nutrient Digestibility, Health and Antioxidant Status in Weaned Piglets. PLoS ONE 2018, 13, e0192978. [Google Scholar] [CrossRef]
  30. Tsai, Y.-L.; Lin, T.-L.; Chang, C.-J.; Wu, T.-R.; Lai, W.-F.; Lu, C.-C.; Lai, H.-C. Probiotics, Prebiotics and Amelioration of Diseases. J. Biomed. Sci. 2019, 26, 3. [Google Scholar] [CrossRef]
  31. Palaiogiannis, D.; Chatzimitakos, T.; Athanasiadis, V.; Bozinou, E.; Makris, D.P.; Lalas, S.I. Successive Solvent Extraction of Polyphenols and Flavonoids from Cistus creticus L. Leaves. Oxygen 2023, 3, 274–286. [Google Scholar] [CrossRef]
  32. Chatzimitakos, T.; Athanasiadis, V.; Makrygiannis, I.; Kalompatsios, D.; Bozinou, E.; Lalas, S.I. An Investigation into Crithmum Maritimum L. Leaves as a Source of Antioxidant Polyphenols. Compounds 2023, 3, 532–551. [Google Scholar] [CrossRef]
  33. Manousaki, A.; Jancheva, M.; Grigorakis, S.; Makris, D.P. Extraction of Antioxidant Phenolics from Agri-Food Waste Biomass Using a Newly Designed Glycerol-Based Natural Low-Transition Temperature Mixture: A Comparison with Conventional Eco-Friendly Solvents. Recycling 2016, 1, 194–204. [Google Scholar] [CrossRef]
  34. Shehata, E.; Grigorakis, S.; Loupassaki, S.; Makris, D.P. Extraction Optimisation Using Water/Glycerol for the Efficient Recovery of Polyphenolic Antioxidants from Two Artemisia Species. Sep. Purif. Technol. 2015, 149, 462–469. [Google Scholar] [CrossRef]
  35. Palaiogiannis, D.; Athanasiadis, V.; Bozinou, E.; Chatzimitakos, T.; Makris, D.P.; Lalas, S.I. Extraction of Polyphenolic and Volatile Compounds from Cistus creticus Using Deep Eutectic Solvents and Pulsed Electric Fields. Compounds 2022, 2, 311–320. [Google Scholar] [CrossRef]
  36. Arab, M.; Yousefi, M.; Khanniri, E.; Azari, M.; Ghasemzadeh-Mohammadi, V.; Mollakhalili-Meybodi, N. A Comprehensive Review on Yogurt Syneresis: Effect of Processing Conditions and Added Additives. J. Food Sci. Technol. 2023, 60, 1656–1665. [Google Scholar] [CrossRef] [PubMed]
  37. Montgomery, R. Further studies of the phenolsulfuric acid reagent for carbohydrates. Biochim. Biophys. Acta 1961, 48, 591–593. [Google Scholar] [CrossRef] [PubMed]
  38. Akalın, A.S.; Unal, G.; Dinkci, N.; Hayaloglu, A.A. Microstructural, Textural, and Sensory Characteristics of Probiotic Yogurts Fortified with Sodium Calcium Caseinate or Whey Protein Concentrate. J. Dairy Sci. 2012, 95, 3617–3628. [Google Scholar] [CrossRef]
  39. Spigno, G.; Tramelli, L.; De Faveri, D.M. Effects of Extraction Time, Temperature and Solvent on Concentration and Antioxidant Activity of Grape Marc Phenolics. J. Food Eng. 2007, 81, 200–208. [Google Scholar] [CrossRef]
  40. Yilmaz, Y.; Toledo, R.T. Oxygen Radical Absorbance Capacities of Grape/Wine Industry Byproducts and Effect of Solvent Type on Extraction of Grape Seed Polyphenols. J. Food Compos. Anal. 2006, 19, 41–48. [Google Scholar] [CrossRef]
  41. Lapornik, B.; Prošek, M.; Golc Wondra, A. Comparison of Extracts Prepared from Plant By-Products Using Different Solvents and Extraction Time. J. Food Eng. 2005, 71, 214–222. [Google Scholar] [CrossRef]
  42. Abu-Orabi, S.T.; Al-Qudah, M.A.; Saleh, N.R.; Bataineh, T.T.; Obeidat, S.M.; Al-Sheraideh, M.S.; Al-Jaber, H.I.; Tashtoush, H.I.; Lahham, J.N. Antioxidant Activity of Crude Extracts and Essential Oils from Flower Buds and Leaves of Cistus creticus and Cistus Salviifolius. Arab. J. Chem. 2020, 13, 6256–6266. [Google Scholar] [CrossRef]
  43. Piluzza, G.; Bullitta, S. Correlations between Phenolic Content and Antioxidant Properties in Twenty-Four Plant Species of Traditional Ethnoveterinary Use in the Mediterranean Area. Pharm. Biol. 2011, 49, 240–247. [Google Scholar] [CrossRef] [PubMed]
  44. Ghalia, S.; Kitaz, A.; Waed, A. Evaluation of Radical Scavenging Activity, Total Phenolics and Total Flavonoids Contents of Cistus Species in Syria. Int. J. Pharmacogn. Phytochem. Res. 2016, 8, 1071–1077. [Google Scholar]
  45. Viapiana, A.; Konopacka, A.; Waleron, K.; Wesolowski, M. Cistus Incanus L. Commercial Products as a Good Source of Polyphenols in Human Diet. Ind. Crops Prod. 2017, 107, 297–304. [Google Scholar] [CrossRef]
  46. Hitl, M.; Bijelić, K.; Stilinović, N.; Božin, B.; Srđenović-Čonić, B.; Torović, L.; Kladar, N. Phytochemistry and Antihyperglycemic Potential of Cistus Salviifolius L., Cistaceae. Molecules 2022, 27, 8003. [Google Scholar] [CrossRef] [PubMed]
  47. Sayah, K.; Marmouzi, I.; Naceiri Mrabti, H.; Cherrah, Y.; Faouzi, M.E.A. Antioxidant Activity and Inhibitory Potential of Cistus Salviifolius (L.) and Cistus Monspeliensis (L.) Aerial Parts Extracts against Key Enzymes Linked to Hyperglycemia. BioMed Res. Int. 2017, 2017, e2789482. [Google Scholar] [CrossRef]
  48. Mastino, P.M.; Mauro, M.; Jean, C.; Juliano, C.; Marianna, U. Analysis and Potential Antimicrobial Activity of Phenolic Compounds in the Extracts of Cistus creticus Subspecies from Sardinia. Nat. Prod. J. 2018, 8, 166–174. [Google Scholar] [CrossRef]
  49. Santagati, N.A.; Salerno, L.; Attaguile, G.; Savoca, F.; Ronsisvalle, G. Simultaneous Determination of Catechins, Rutin, and Gallic Acid in Cistus Species Extracts by HPLC with Diode Array Detection. J. Chromatogr. Sci. 2008, 46, 150–156. [Google Scholar] [CrossRef]
  50. Zamberlin, Š.; Samaržija, D. The Effect of Non-Standard Heat Treatment of Sheep’s Milk on Physico-Chemical Properties, Sensory Characteristics, and the Bacterial Viability of Classical and Probiotic Yogurt. Food Chem. 2017, 225, 62–68. [Google Scholar] [CrossRef]
  51. Sánchez, L.; Pérez, M.D.; Parrón, J.A. HPP in Dairy Products: Impact on Quality and Applications. In Present and Future of High Pressure Processing; Barba, F.J., Tonello-Samson, C., Puértolas, E., Lavilla, M., Eds.; Elsevier: Amsterdam, The Netherlands, 2020; pp. 245–272. ISBN 978-0-12-816405-1. [Google Scholar]
  52. Marchiani, R.; Bertolino, M.; Belviso, S.; Giordano, M.; Ghirardello, D.; Torri, L.; Piochi, M.; Zeppa, G. Yogurt Enrichment with Grape Pomace: Effect of Grape Cultivar on Physicochemical, Microbiological and Sensory Properties. J. Food Qual. 2015, 39, 77–89. [Google Scholar] [CrossRef]
  53. Sanz, T.; Salvador, A.; Jiménez, A.; Fiszman, S.M. Yogurt Enrichment with Functional Asparagus Fibre. Effect of Fibre Extraction Method on Rheological Properties, Colour, and Sensory Acceptance. Eur. Food Res. Technol. 2008, 227, 1515–1521. [Google Scholar] [CrossRef]
  54. Akalan, M.; Bayrak Akay, K.; Başyiğit, B.; Karakuş, M.Ş.; Yücetepe, M.; Karaaslan, A.; Karaaslan, M. Instant Stevia Powder as a Novel Potential Additive for Enhancing Nutritional Value and Quality Characteristics of Yogurt. J. Food Sci. Technol. 2023, 1–11. [Google Scholar] [CrossRef]
  55. Karki, S.; Prajapati, S.; Bhattarai, S. Preparation and Quality Evaluation of Yogurt by Incorporation with Moringa Oleifera Leaves Powder. Acta Sci. Nutr. Health 2020, 4, 2–8. [Google Scholar] [CrossRef]
  56. Wang, Y.; Wu, J.; Lv, M.; Shao, Z.; Hungwe, M.; Wang, J.; Bai, X.; Xie, J.; Wang, Y.; Geng, W. Metabolism Characteristics of Lactic Acid Bacteria and the Expanding Applications in Food Industry. Front. Bioeng. Biotechnol. 2021, 9, 612285. [Google Scholar] [CrossRef]
Figure 1. A typical C. creticus plant.
Oxygen 04 00005 g001
Figure 2. Plot (A) displays the actual versus the predicted response (TPC, mg GAE/g dw) for the optimization of the extraction of C. creticus, performed with water solutions. The inset tables provide statistics related to the evaluation of the resulting model. Values in color and with asterisks are statistically significant. The desirability function for the optimization of the extraction of C. creticus performed with water solutions is displayed in Plot (B).
Oxygen 04 00005 g002
Figure 3. Three-dimensional graphs depicting the effect of the process variables considered on the response (TPC, mg GAE/g dw) for the optimization of the extraction of C. creticus performed in water solutions. Plot (A) shows the covariation of X1 (R, mL/g) and X2 (T, °C); plot (B) shows the covariation of X1 (R, mL/g) and X3 (t, min); plot (C) shows the covariation of X2 (T, °C) and X3 (t, min).
Oxygen 04 00005 g003
Figure 4. Representative chromatogram at 360 nm for the optimum C. creticus aqueous extract. A gradient elution program was applied, as described in Section 2.8. 1: luteolin glucoside derivative, 2: 1_myricetin glucoside derivative, 3: myricetin rhamnoside, 4: 1_quercetin glucoside derivative, 5: rutin, 6: 2_quercetin glucoside derivative, 7: quercetin rhamnoside derivative, 8: 2_myricetin glucoside derivative, and 9: luteolin 7-(2′′-p-coumaroylglucoside).
Oxygen 04 00005 g004
Figure 5. Principal component analysis (PCA) for the measured variables. The inset table includes the eigenvalues. Asterisks and colored values denote statistically significant values.
Oxygen 04 00005 g005
Table 1. Optimization of the process by incorporating both the coded and actual levels of the independent variables.
Independent VariablesCoded UnitsCoded Levels
−101
Liquid-to-solid ratio (mL/g)X1203550
T (°C)X2205080
t (min)X33090150
Table 2. The experimental results for the four investigated independent variables and the responses of the dependent variable (TPC).
Design PointIndependent VariablesResponse (TPC, mg GAE/g dw)
X1 (Liquid-to-Solid Ratio, mL/g)X2 (T, °C)X3 (t, min)ActualPredicted
1 −1 (20) −1 (20) 0 (90) 74.0168.89
2 −1 (20) 1 (80) 0 (90) 50.0749.32
3 1 (50) −1 (20) 0 (90) 52.5053.25
4 1 (50) 1 (80) 0 (90) 112.22117.34
5 0 (35) −1 (20) −1 (30) 71.0869.93
6 0 (35) −1 (20) 1 (150) 59.1564.68
7 0 (35) 1 (80) −1 (30) 115.59110.07
8 0 (35) 1 (80) 1 (150) 67.9069.06
9 −1 (20) 0 (50) −1 (30) 102.24108.52
10 1 (50) 0 (50) −1 (30) 96.6497.04
11 −1 (20) 0 (50) 1 (150) 48.1247.72
12 1 (50) 0 (50) 1 (150) 117.86111.58
13 0 (35) 0 (50) 0 (90) 62.2563.56
14 0 (35) 0 (50) 0 (90) 64.4263.56
15 0 (35) 0 (50) 0 (90) 64.0263.56
Table 3. Extraction yields and antioxidant characteristics of the optimum C. creticus aqueous extract.
ParametersOptimum Aqueous Extract
YTP (mg GAE/g dw) 1157.17 ± 10.37
YTFn (mg QE/g dw) 22.38 ± 0.14
PR (μmol AAE/g dw) 31258.52 ± 36.5
AAR (μmol AAE/g dw) 3933.67 ± 52.29
1 GAE (gallic acid equivalents); 2 QE (quercetin equivalents); 3 AAE (ascorbic acid equivalents).
Table 4. The quantitative data on the major polyphenols detected in the optimum C. creticus aqueous extract.
A/AIdentified PolyphenolMaximum Wavelength
(nm)
Optimum Aqueous Extract (mg/g)
1Luteolin glucoside derivative2720.28 ± 0.02
21_Myricetin glucoside derivative2643.27 ± 0.1
3Myricetin rhamnoside26216.36 ± 0.44
41_Quercetin glucoside derivative2650.05 ± 0
5Rutin2670.08 ± 0
62_Quercetin glucoside derivative2670.64 ± 0.05
7Quercetin rhamnoside derivative2625.47 ± 0.17
82_Myricetin glucoside derivative2680.41 ± 0.02
9Luteolin 7-(2”-p-coumaroylglucoside)3100.55 ± 0.02
Total identified polyphenols 27.09 ± 1.34
Values are expressed as the mean values of triplicates (± standard deviation).
Table 5. Extraction yields and antioxidant characteristics of the optimum C. creticus aqueous extract equivalent to extract enrichment rates in yogurts.
Parametersw/v % Optimum Aqueous Extract
0.010.050.1
YTP (mg GAE/100 mL) 13.38 ± 0.09 c17.03 ± 0.7 b34.08 ± 1.19 a
YTFn (mg QE/100 mL) 2-0.25 ± 0.02 b0.51 ± 0.02 a
PR (μmol AAE/100 mL) 322.08 ± 0.6 c110.1 ± 7.71 b219.57 ± 12.74 a
AAR (μmol AAE/100 mL) 316.81 ± 0.62 c82.82 ± 2.32 b165.18 ± 9.42 a
Values are expressed as the mean values of triplicates (±standard deviation). Within each row, statistically significant differences (p < 0.05) are denoted by different superscript letters (e.g., a–c). 1 GAE (gallic acid equivalents); 2 QE (quercetin equivalents); 3 AAE (ascorbic acid equivalents).
Table 6. Physicochemical properties of yogurt enhanced with C. creticus dry extract at different concentrations.
ParametersTreatmentsStorage Period
1 Day10 Days21 Days
Syneresis (% w/w)Control60.58 ± 2.06 A,c73.58 ± 2.35 A,b90.58 ± 2.9 A,a
0.01%56.05 ± 1.35 A,c66.18 ± 3.9 A,B,b83.64 ± 3.76 A,B,a
0.05%58.78 ± 4.06 A,b64.02 ± 1.98 B,b77.64 ± 4.66 B,a
0.10%58.06 ± 1.22 A,b63.46 ± 3.11 B,a,b67.86 ± 2.38 C,a
Water holding
capacity (% w/w)
Control85.4 ± 6.41 A,a72.5 ± 3.99 A,b65.2 ± 1.43 C,b
0.01%86.8 ± 3.39 A,a74.2 ± 2.52 A,b71.1 ± 1.49 B,b
0.05%87.2 ± 5.76 A,a75 ± 4.5 A,b72.7 ± 2.04 B,b
0.10%90.3 ± 5.6 A,a80.2 ± 2.73 A,b78.9 ± 2.37 A,b
Lactose (% w/w)Control3.53 ± 0.13 A,a3.04 ± 0.17 B,b2.54 ± 0.12 B,c
0.01%3.67 ± 0.07 A,a3.22 ± 0.24 A,B,b2.98 ± 0.17 A,b
0.05%3.71 ± 0.22 A,a3.41 ± 0.25 A,B,a,b3.12 ± 0.15 A,b
0.10%3.82 ± 0.29 A,a3.68 ± 0.12 A,a,b3.29 ± 0.12 A,b
pHControl4.22 ± 0.19 A,a3.89 ± 0.2 A,a3.77 ± 0.26 A,a
0.01%4.23 ± 0.27 A,a3.97 ± 0.12 A,a3.85 ± 0.13 A,a
0.05%4.24 ± 0.22 A,a3.98 ± 0.22 A,a3.88 ± 0.17 A,a
0.10%4.24 ± 0.29 A,a3.97 ± 0.28 A,a3.89 ± 0.28 A,a
YTP (mg GAE1/100 g)Control1.46 ± 0.05 D,a1.15 ± 0.03 D,b0.74 ± 0.05 D,c
0.01%3.21 ± 0.07 C,a2.25 ± 0.11 C,b1.12 ± 0.05 C,c
0.05%16.52 ± 0.93 B,a12.55 ± 0.72 B,b8.64 ± 0.64 B,c
0.10%31.28 ± 2.03 A,a26.04 ± 1.25 A,b19.47 ± 1.34 A,c
YTFn (mg QE2/100 g)Control---
0.01%---
0.05%0.21 ± 0.01 B,a0.15 ± 0.01 B,b-
0.10%0.47 ± 0.01 A,a0.39 ± 0.01 A,b0.26 ± 0.02 c
PR (μmol AAE3/100 g)Control3.08 ± 0.22 D,a2.45 ± 0.18 D,b1.74 ± 0.07 D,c
0.01%21.04 ± 1.14 C,a16.65 ± 0.95 C,b12.35 ± 0.9 C,c
0.05%105.25 ± 7.47 B,a90.25 ± 2.35 B,b74.65 ± 4.11 B,c
0.10%211.36 ± 7.19 A,a189.36 ± 12.69 A,a165.37 ± 4.63 A,b
AAR (μmol AAE/100 g)Control2.44 ± 0.17 D,a1.85 ± 0.06 D,b1.11 ± 0.05 D,c
0.01%15.65 ± 1.11 C,a12.36 ± 0.51 C,b9.36 ± 0.66 C,c
0.05%80.25 ± 3.21 B,a67.85 ± 4.14 B,b55.54 ± 2.22 B,c
0.10%161.36 ± 11.3 A,a142.35 ± 7.26 A,a,b124.87 ± 3.12 A,b
Values are expressed as the mean values of triplicates (±standard deviation). Within each column and parameter, statistically significant differences (p < 0.05) are denoted with different capital letters (e.g., A–D). Within each row, statistically significant differences (p < 0.05) are denoted with different small letters (e.g., a–c). 1 GAE (gallic acid equivalents); 2 QE (quercetin equivalents); 3 AAE (ascorbic acid equivalents).
Disclaimer/Publisher’s Note: The statements, opinions and data contained in all publications are solely those of the individual author(s) and contributor(s) and not of MDPI and/or the editor(s). MDPI and/or the editor(s) disclaim responsibility for any injury to people or property resulting from any ideas, methods, instructions or products referred to in the content.

