

Physics of the Earth’s Glacial Cycle
Joint Institute for High Temperatures of Russian Academy Sciences, Izhorskaya 13/19, 125412 Moscow, Russia
Foundations 2022, 2(4), 1114-1128; https://doi.org/10.3390/foundations2040073
Submission received: 18 August 2022
/
Revised: 27 October 2022
/
Accepted: 9 November 2022
/
Published: 7 December 2022
(This article belongs to the Special Issue Advances in Fundamental Physics II)
Abstract
:The evolution of the atmospheric temperature in the past, resulted from the EPICA project (European Project for Ice Coring in Antarctica) for the analysis of air bubbles in ice deposits near three weather stations in Antarctica, includes several glacial cycles. According to these studies, the glacial cycle consists of a slow cooling of the Earth’s surface at a rate of about C per year for almost the entire time of a single cycle (about 100 thousand years) and of a fast process of heating the planet, similar to a thermal explosion. The observed cooling of the planet follows from the imbalance of energy fluxes absorbed by the Earth and going into its surrounding space, and this imbalance is four orders of magnitude less than the accuracy of determination of the fluxes themselves. The inconsistency of the popular Milankovich theory is shown, according to which glacial cycles in the evolution of the Earth’s thermal state are associated with changes in the Earth’s orbit relative to the Sun. In considering the glacial cycle as the transition between the warm (contemporary) and cold thermal states of the Earth with a difference in their temperatures of 12 C according to measurements, we construct the energetic balance for each of Earth’s states. The fast transition between the Earth’s cold and warm states results from the change of the Earth’s albedo due to the different volcano activity in these states. There is the feedback between the aggregate state of water covering the Earth’s surface and volcanic eruptions, which become intense when ice covers approximately of the Earth’s surface. Dust measurements in ice deposits within the framework of the EPICA project confirms roughly a heightened volcano eruption during the cold phase of the glacial cycle. Numerical parameters of processes related to the glacial cycle are analyzed.
1. Introduction
Glacial cycles are long-term, almost periodic, changes in the Earth’s temperature. The period of these changes is approximately hundreds of thousands of years; the difference between the maximum and minimum temperatures reaches 15 C. Currently, the warm stage period of the glacial cycle is occurring. Moreover, all of human civilization has existed during the warm phase of the glacial cycle.
The most reliable information about the evolution of the Earth’s temperature during the glacial cycle follows from the study of ice deposits of Antarctica within the framework of the EPICA project (European Project for Ice Coring in Antarctica). These studies allow one to restore a temporary evolution of the Earth’s temperature of an Antarctica region, which has an almost periodic character and within a single period can roughly be divided into two stages. The first stage includes a sharp rise in the temperature over a short time compared to the period of the glacial cycle, whereas a slow decrease in the temperature during the second period lasts almost the entire cycle. The task of the analysis carried out in this paper is to treat the data of the EPICA project to understand the nature of the evolution of the Earth’s thermal state.
2. Variation of the Earth’s Temperature in Glacial Cycle
To study the Earth’s thermal state, a set of paleontology methods has been created based on the study of sediments (for example, [1,2,3,4]). In this way, the most productive is the analysis of air bubbles in ice deposits. This program was implemented in the most detailed way during the study of temperature evolution in the Antarctic region within the framework of the EPICA project. The main results are based on ice deposits near the Antarctic weather stations Vostok [5,6,7] and Dome C [8,9,10]. The data obtained on the basis of ice deposits near the Dome F [11] weather station are close to the results of these two weather stations.
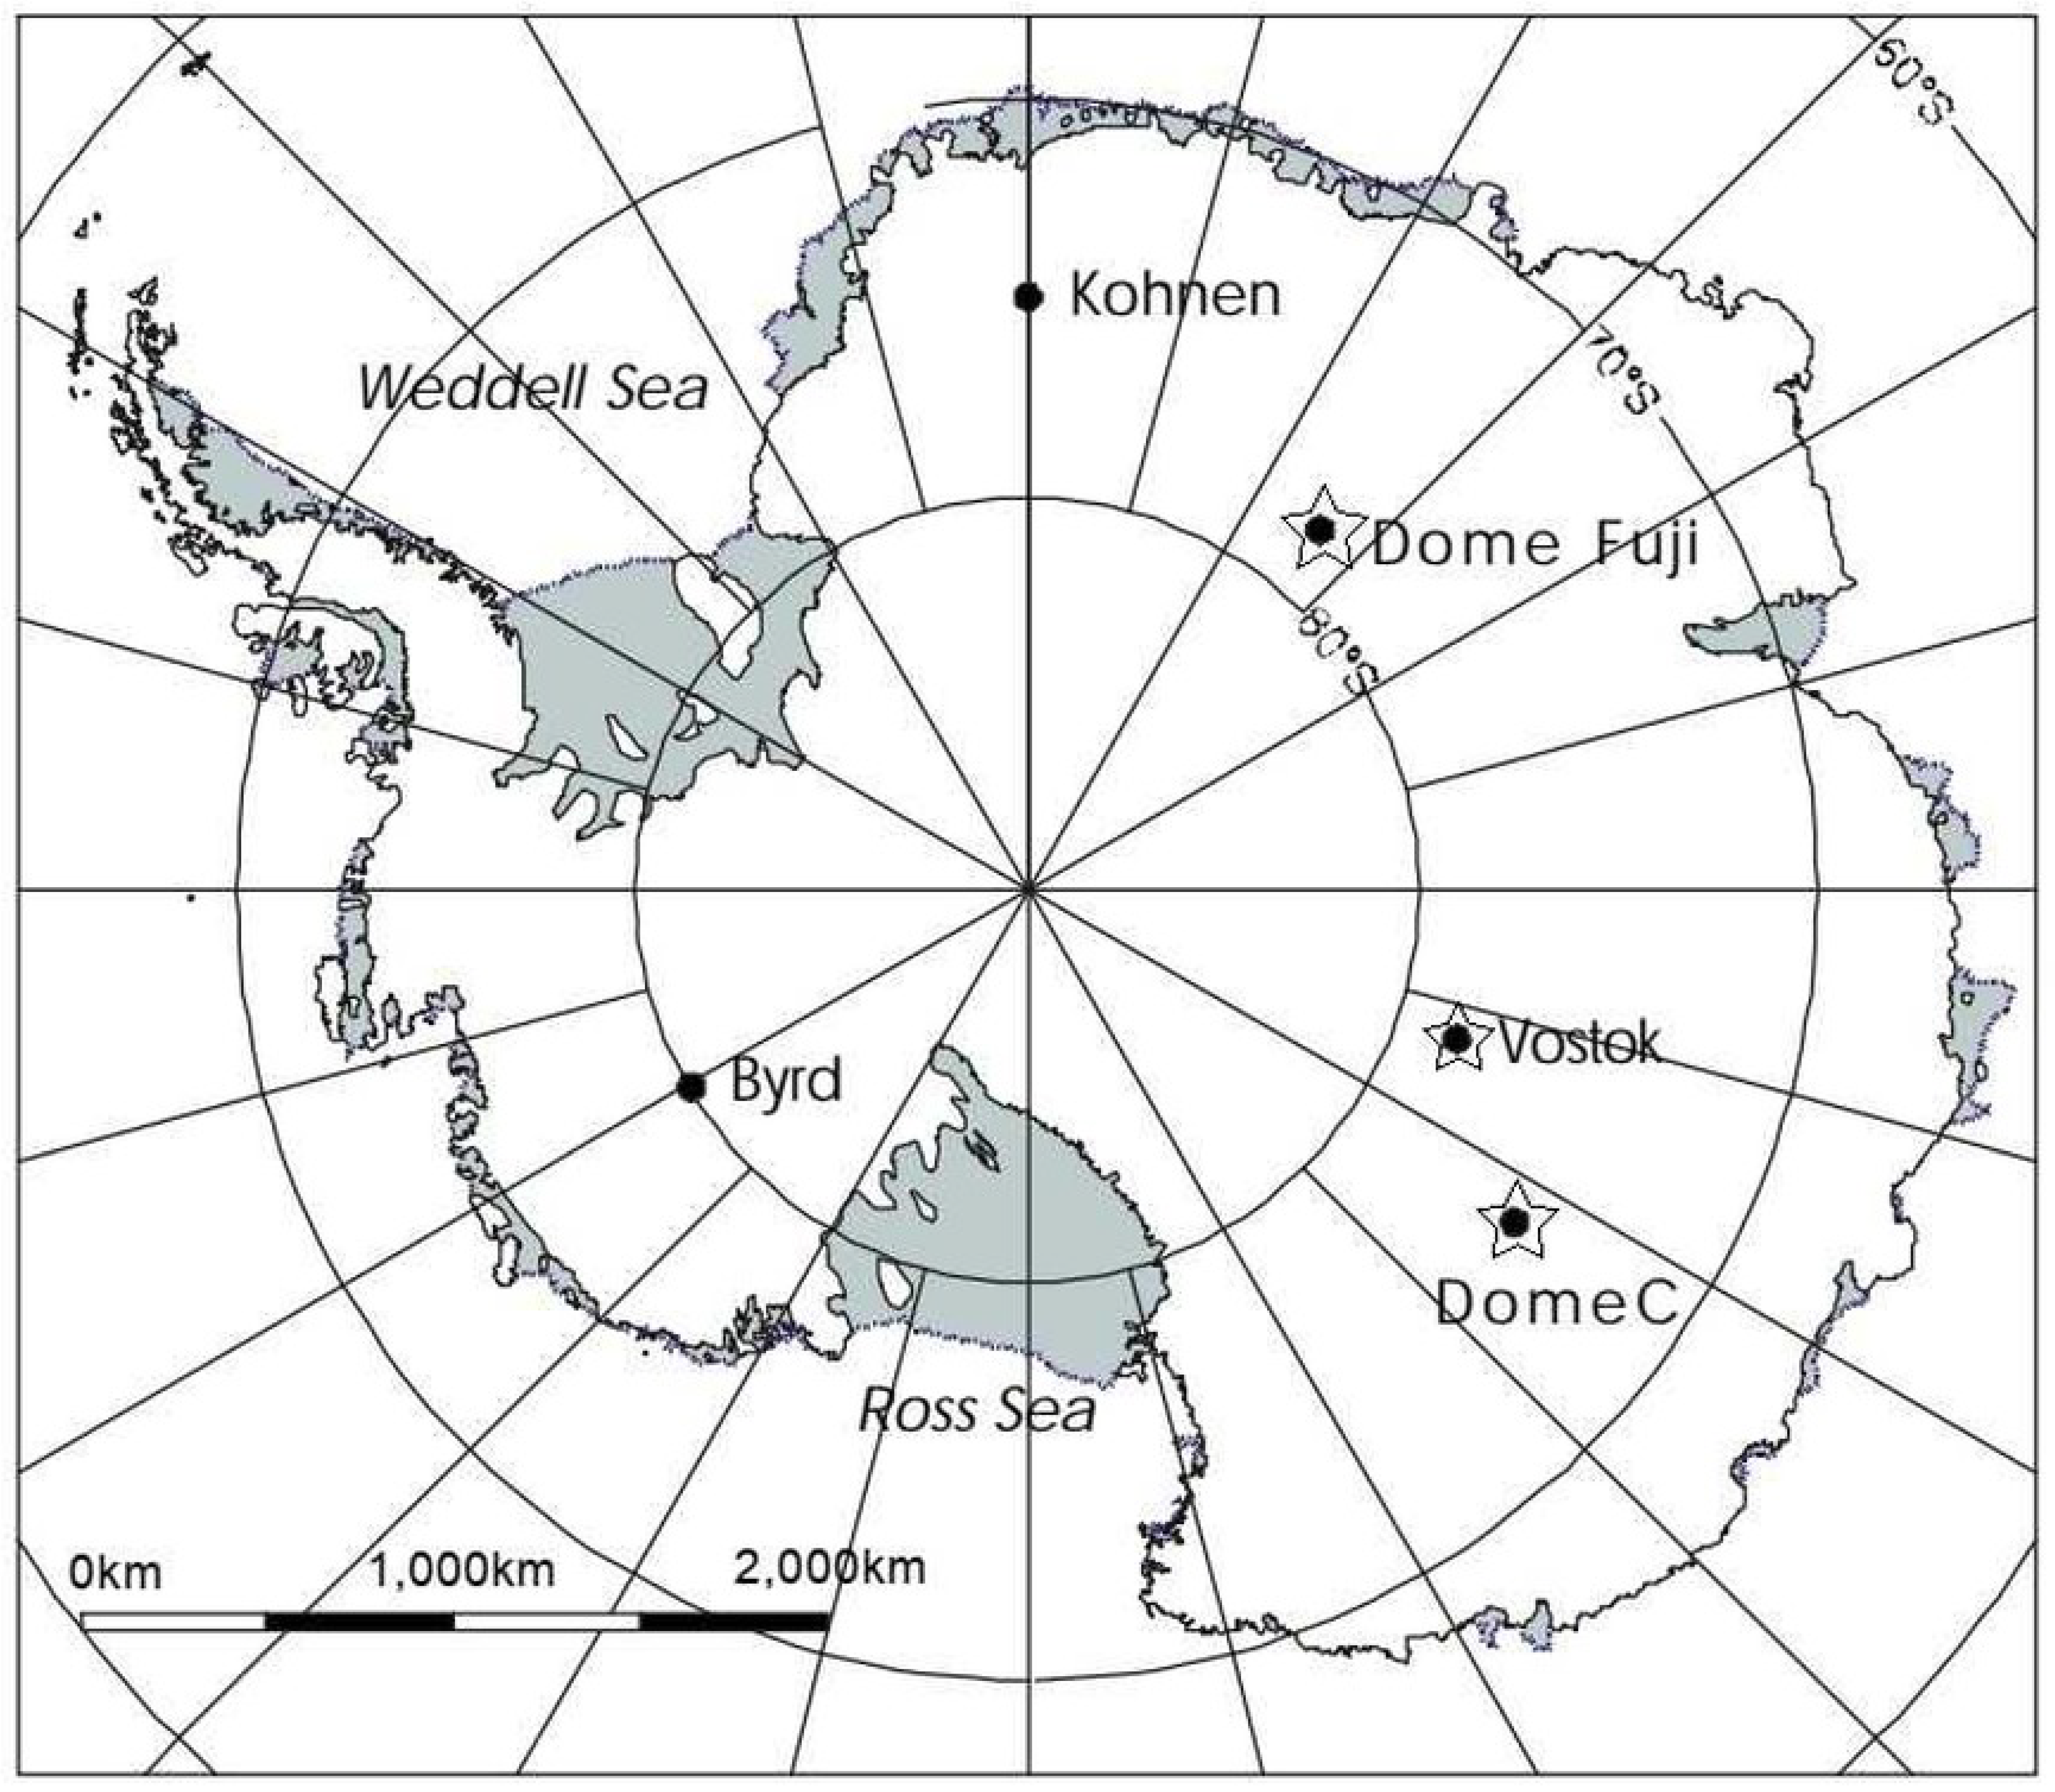
Figure 1 gives a map of Antarctica, and the positions of the weather stations are indicated from where the samples for measurements are taken. They are mainly taken near the Vostok and Dome C weather stations. As is seen from the map in Figure 1, ice samples for research are taken from nearby areas.
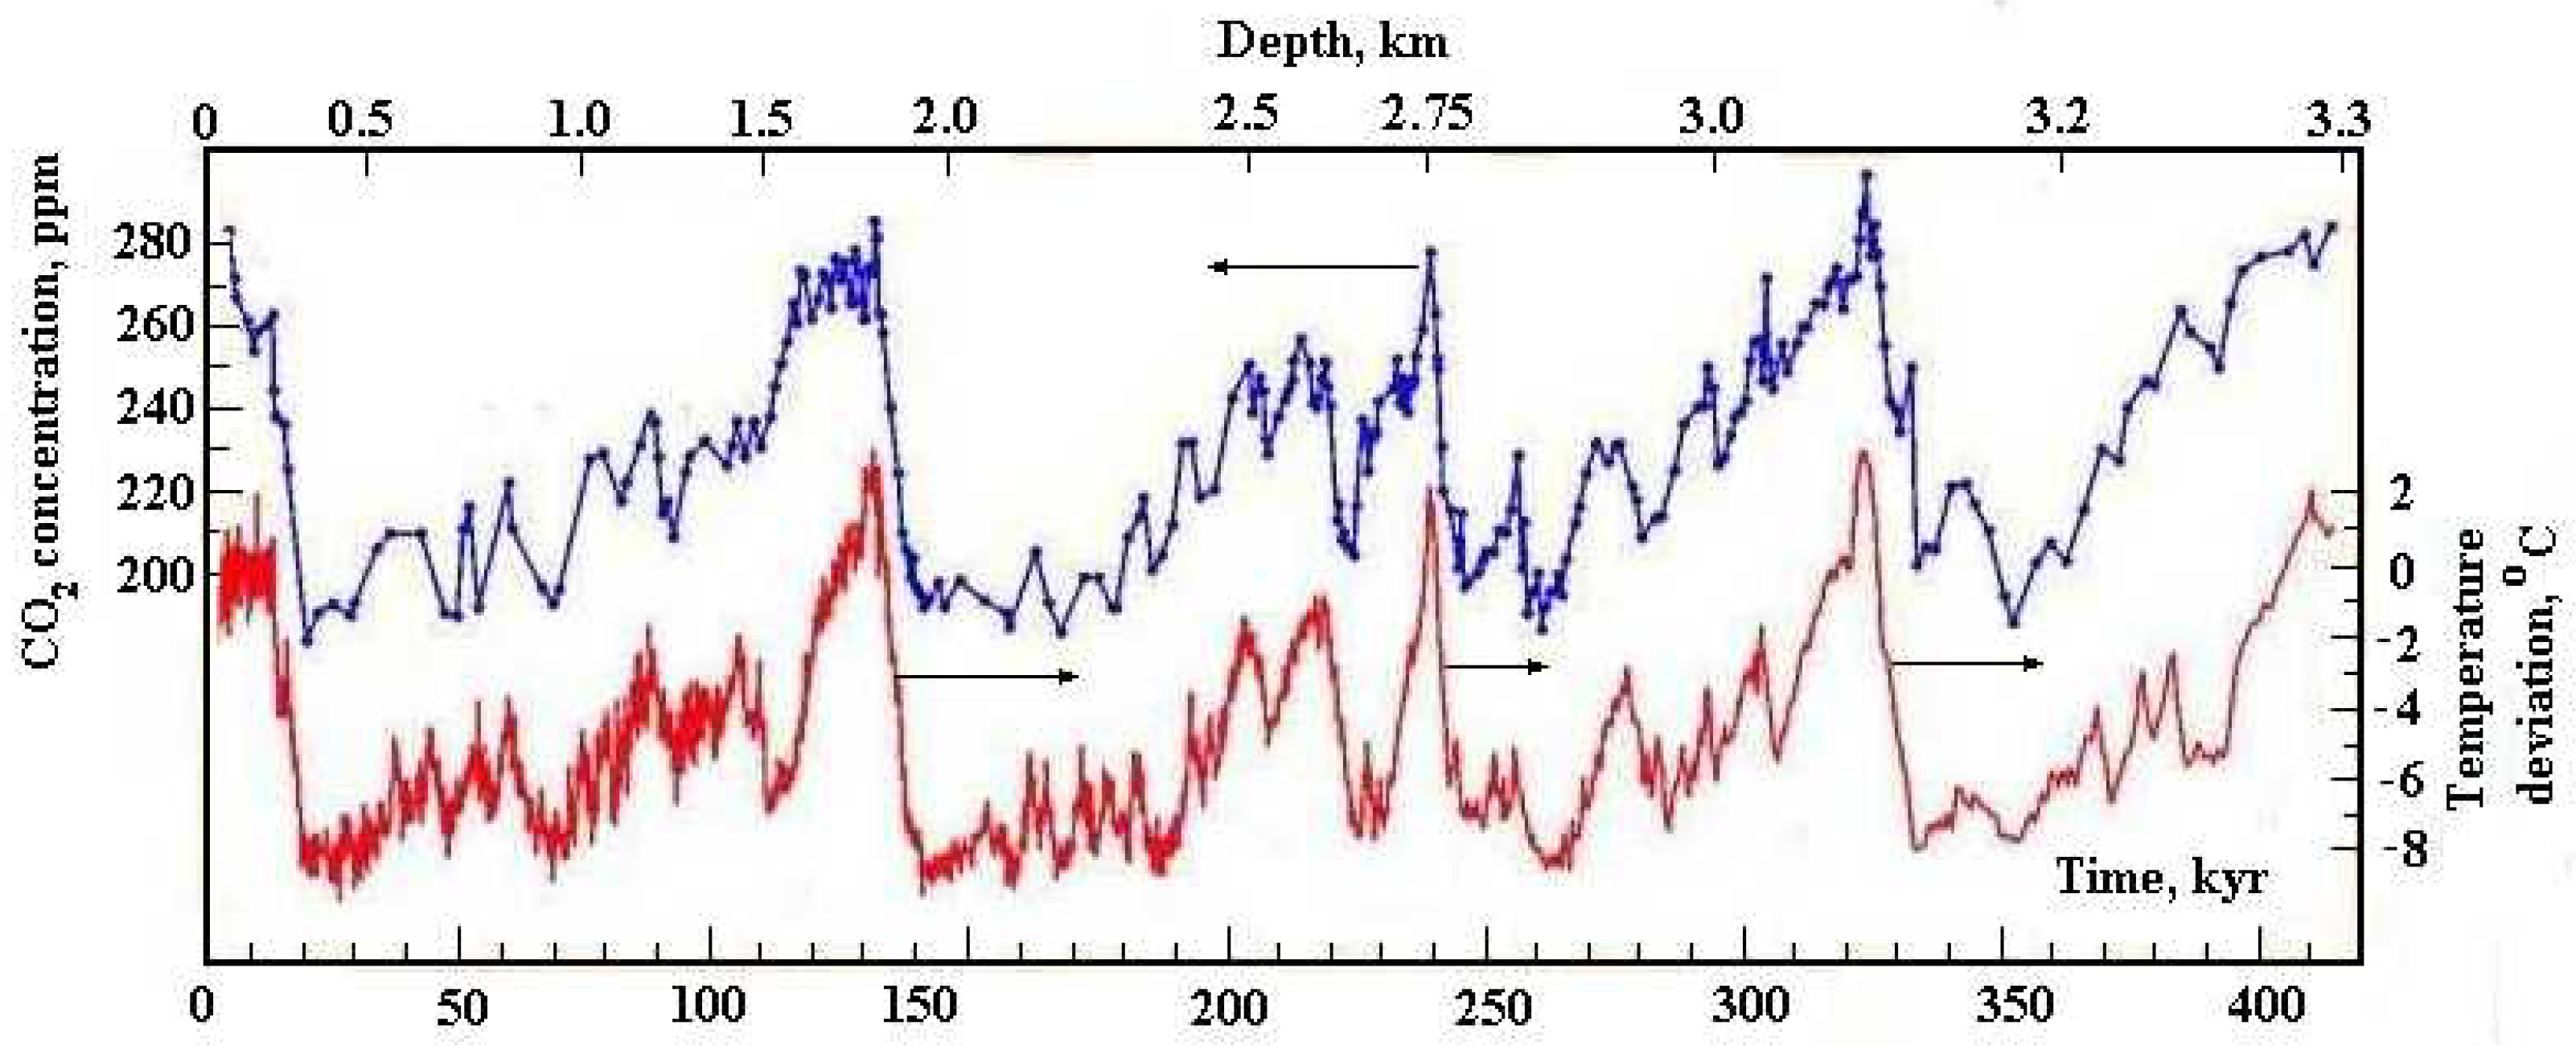
Figure 2 characterizes the evolution of the air temperature and carbon dioxide concentration in the surrounding atmosphere over the past hundreds of millennia in Antarctica. These data are obtained from the analysis of air bubbles located in samples of ice deposits, which were extracted from a pit near the Dome C weather station [8,9,10]. Since the measurement results from samples, obtained from different weather stations, are nearby, we will consider them to be identical later. The above analysis allows us to determine the considered parameters of the atmosphere in the past up to 800 thousand years ago.
In analyzing air bubbles extracted from pieces of ice, the depth of ice samples allows one to determine a time of their formation. The time of bubble residence inside the ice is confirmed by the relative concentration of the deuterium isotope in it. In addition, the concentration of carbon dioxide in the bubbles is of that during the formation of these samples in this Antarctic region.
The air temperature in the bubbles at a time of their formation is determined from the analysis of the isotopic composition of oxygen-contained molecules. In the Earth’s crust, the oxygen isotopes and are present in the proportion and [12], correspondingly. However, since the energy of zero oscillations in carbon dioxide and oxygen molecules differs slightly for these isotopes of the oxygen atom, then under thermodynamic equilibrium in atmospheric air, the concentration of the oxygen isotope in and molecules is different.
Because of the difference in the energies of zero-oscillations for oxygen and carbon dioxide molecules, the concentration of the isotope in these molecules depends on the temperature. Of course, this difference is small, but isotopic methods are characterized by a high accuracy. One can estimate the accuracy of this method by the coincidence of results of measurements from different weather stations. Evidently, the question arises of what temperature of which area these measurements give. However, it is clear that for different times, the temperature relates to the same area.
Indeed, the isotope equilibrium is established through the oxygen isotope formed under the action of cosmic rays and proceeds according to the scheme
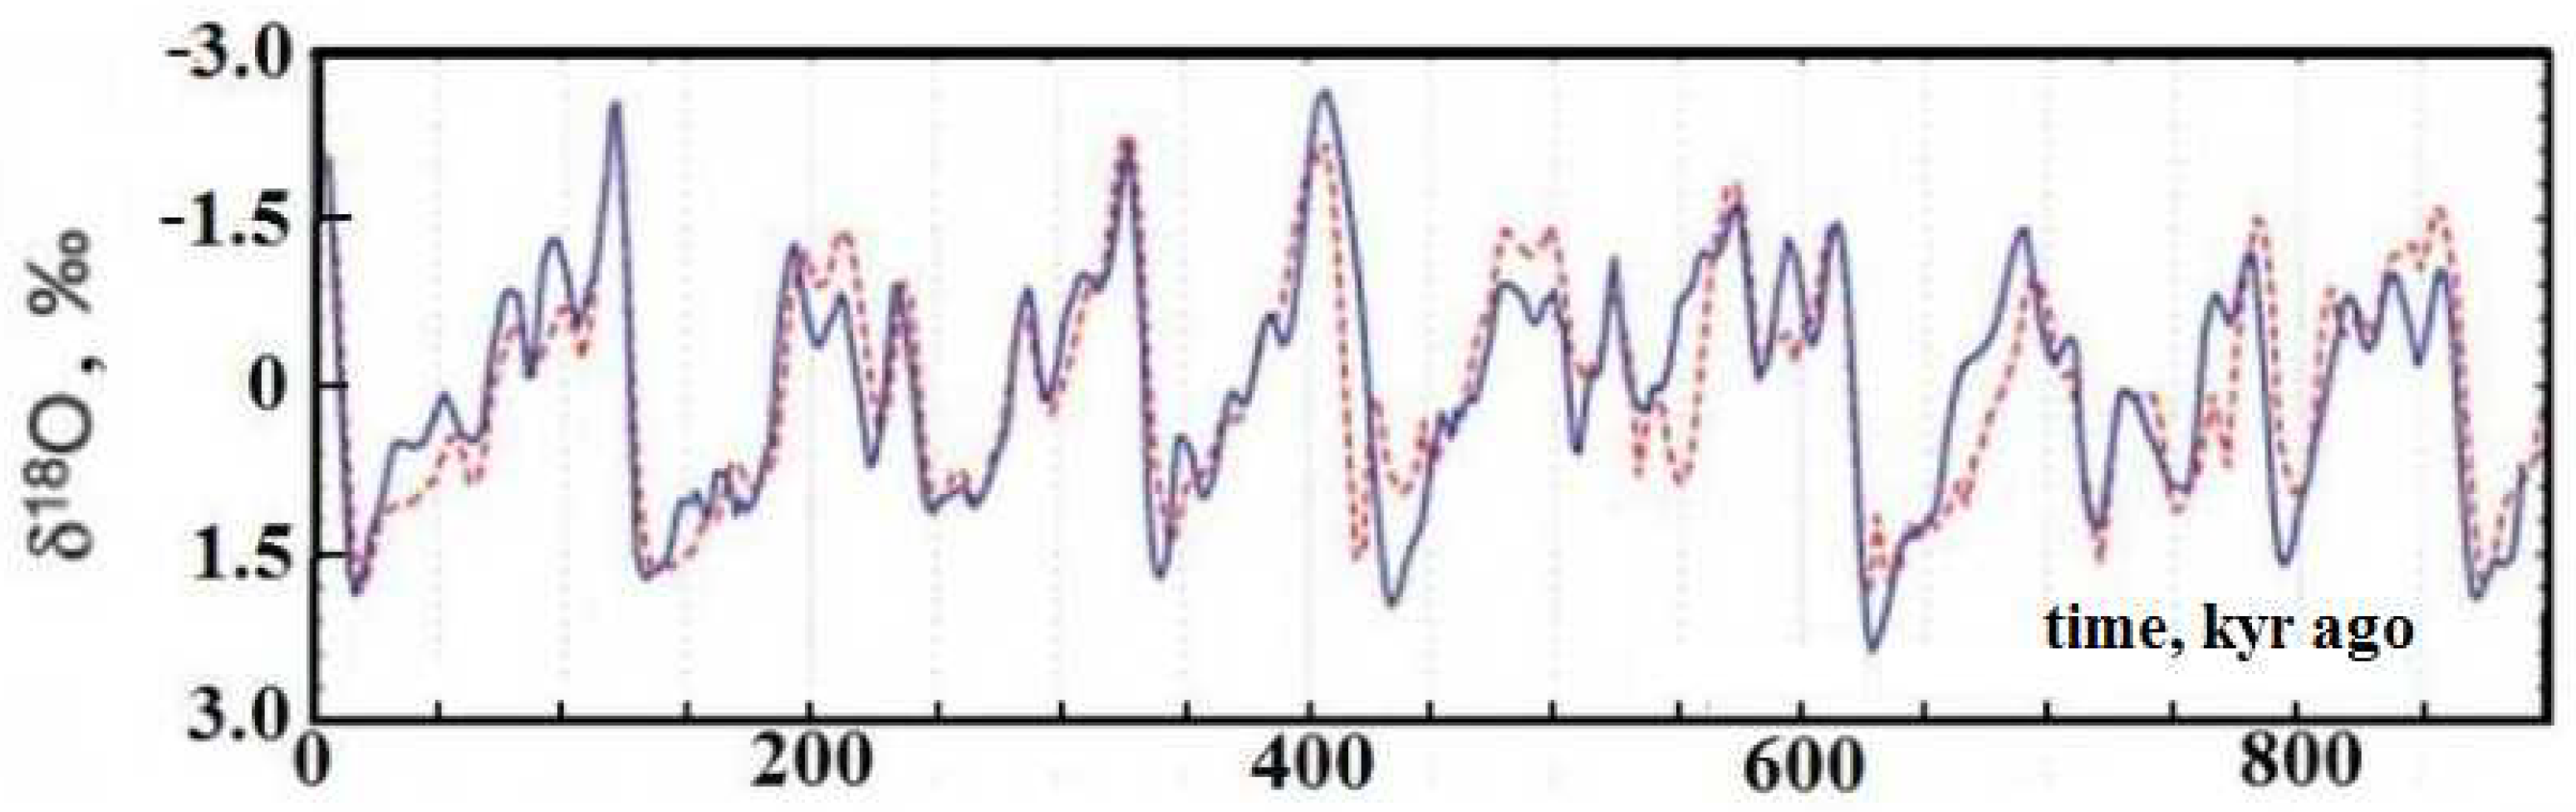
Isotopic equilibrium between the oxygen atoms of carbon dioxide and oxygen molecules is established as a result of the exchange reactions involving oxygen atoms formed under the action of cosmic rays. Then the isotopic distribution for carbon dioxide molecules and oxygen molecules is determined by the temperature that is realized in these processes. Although, due to the low intensity of cosmic rays, the time for establishing isotopic equilibrium is long, the temperature analysis of the atmosphere is also associated with long times of the processes taking place. Figure 3 contains the relative deviation for the concentration of the oxygen isotope in carbon dioxide molecules for the atmosphere near the corresponding Antarctic weather stations. The value difference from the two weather stations characterizes the accuracy of the measurements.
As it follows from the data of Figure 2, the concentration of atmospheric carbon dioxide in the course of the past half a million years has varied from 172 to 280 ppm. In particular, this is also confirmed by the study of deposits in the Sierra Leone area in the Atlantic Ocean near the west coast of Africa, according to which the concentration of atmospheric carbon dioxide was between 213 ppm and 283 ppm in the time period between 900 thousand years and 2.1 million years ago [13]. Currently, the concentration of atmospheric carbon dioxide molecules is now approximately 416 ppm according to measurements from the Mauna Loa observatory, which is noticeably higher than this value in the past.
From the data of Figure 2, the correlation follows between the change in the temperature and the concentration of atmospheric carbon dioxide. Data of Figure 2 indicate the periodic character of evolution of these parameters in time, and in Figure 2, at least four glacial cycles are included. The maximum difference between the maximum and minimum temperatures reaches 15 C [9]. Below, we use the value 12 C as a typical amplitude of the Earth’s temperature change during the glacial cycle. As is seen, this contradicts the main statement of the Paris agreement 2015 on climate change [14], according to which 2 C is the maximum value of the global temperature change, and its exceeding leads to irreversible changes in the thermal Earth’s state.
Note other features of the evolution of the global temperature, shown in Figure 2. The glacial cycle, the period of which is approximately 100 thousand years, includes a sharp transition from a cold state of the Earth to a warm one and a slow decrease in the temperature as a result of the transition from a warm thermal state to a cold one. At the same time, the evolution of the Earth’s temperature is not monotonous, and consists of a large number of small jumps.
Being guided by the above data obtained on the basis of some measurements, we will further assume that a current value of the global temperature, i.e., the average temperature of the Earth’s surface, is K [15]. Transferring from a change in the temperature to a change in the energy flux that falls on the Earth’s surface, we use the translation coefficient, the so-called climate sensitivity S [16]. This value is characterized by a low accuracy, and we will use an average value over some papers as K· m/W [17]. This results in a change in the average energy flux absorbed by the Earth’s surface during one glacial period to be 24 W/m. At the same time, due to a low accuracy, the results obtained further should be considered as estimates.
3. Solar Radiation in the Glacial Cycle
The energetic processes occurring in the Earth’s atmosphere and on its surface begin from solar radiation entering the Earth’s atmosphere. Therefore, first of all, it is necessary to analyze the role of solar radiation in changing the thermal state of the Earth, leading to the glacial cycle. Then changes in the thermal state of the Earth should be associated with a change in the flux of solar radiation interacted the Earth. Let us first consider the change in solar radiative fluxes during past centuries. Such changes are oscillatory in nature and, in particular, the solar activity oscillates with a period of 11 years. Although this was established from the analysis of the number of sunspots in 1801 [18], even earlier, this value followed from the periodicity of grain prices presented by the economist Adam Smith in 1776 [19].
Since solar radiation is the basis of energetic atmospheric processes and determines the Earth’s thermal state, the climate change may be a result of processes associated with changes in solar radiation. First of all, we will analyze the change in the global temperature owing to natural oscillations of the solar radiative flux entering the Earth’s atmosphere.
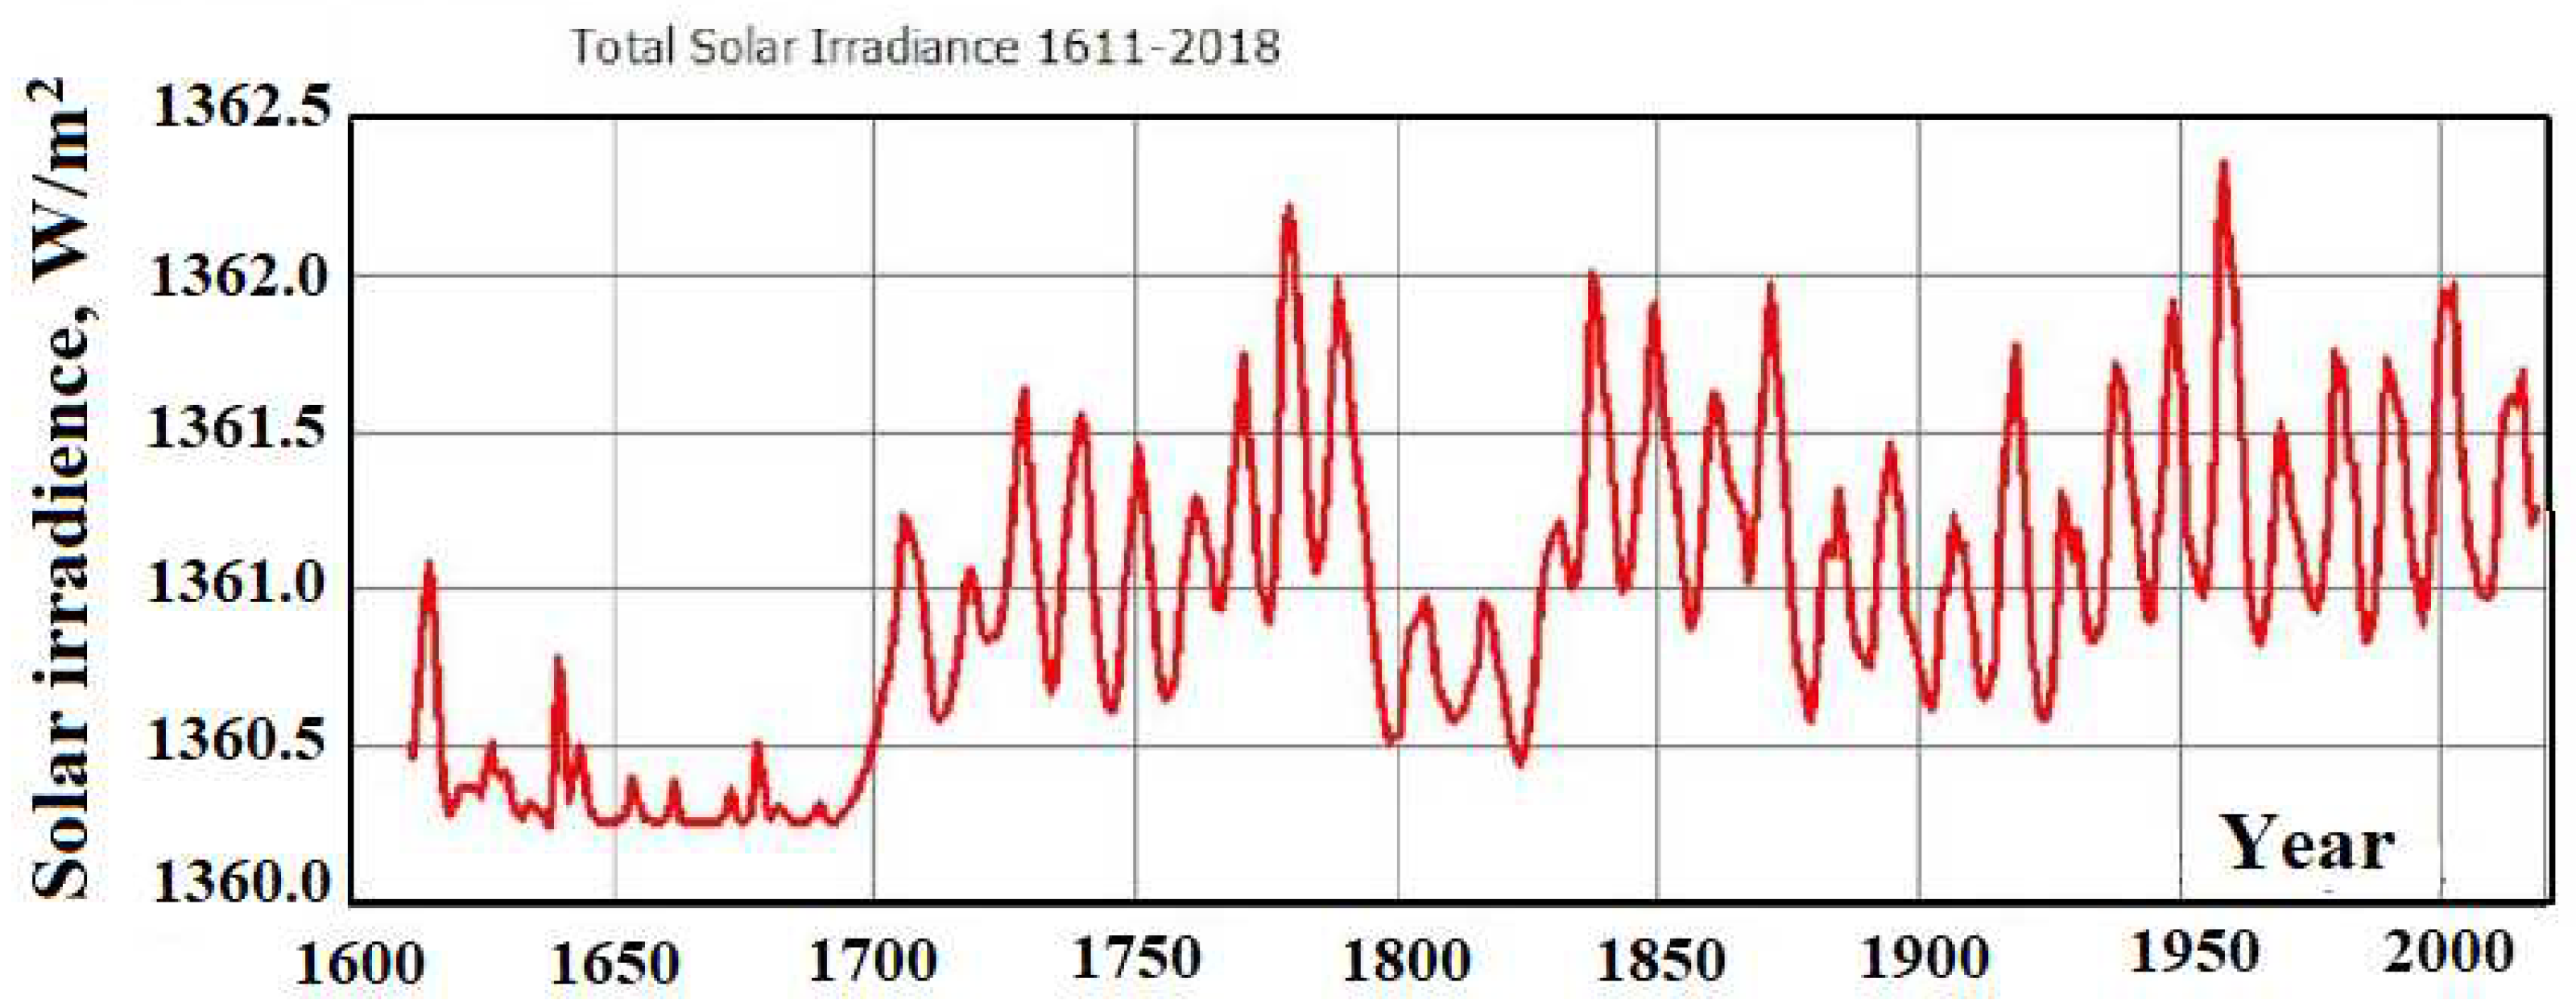
Precise measurements of variations in the solar radiative flux at near-ground atmospheric layers over two periods of solar activity in the 21st century based on satellite measurements showed that variations in the solar radiative flux during this time did not exceed 0.3 W/m [20,21]. In accordance with the magnitude of climate sensitivity, this change corresponds to global temperature variations of 0.15 K, which is less than the global temperature change observed in our time. Therefore, the present warming is not associated with variations in the solar activity. The recent change in the flux of solar radiation passing through the Earth’s atmosphere is shown in Figure 4.
The trajectory of the Earth as it rotates around the Sun is an ellipse that is close to the circle [24]. The distance from the Earth to the Sun varies from 147.1 million km to 152.1 million km, which corresponds to the eccentricity of its trajectory as an ellipse [24]. Since the solar radiative flux at the ground level is inversely proportional to the square of the distance to the Sun, the relative seasonal change in the radiation flux is and corresponds to a change in the average flux by 10 W/m, which is comparable to, although somewhat less than, the change in the energy flux to the surface of the Earth during the ice cycle.
The long-term change in the average flux of solar radiation incident on the Earth’s surface can be associated with the theory of Milankovich [25,26]. Indeed, the elliptical orbit of the Earth itself, along which the Earth moves around the Sun, is stable, and its small perturbations will further lead to the return of the orbit to a stable state. As a result of these disturbances, three types of oscillations of the elliptical orbit along which the Earth is moving can occur. Namely, the three types of oscillations include the oscillation of the trajectory plane, the angle between the axis of the Earth and the plane of its orbit, as well as the eccentricity of the orbit, which is characterized by the minimum and maximum distances between the Sun and the Earth when it moves along the orbit. The analysis of long-term variations in the trajectory of the Earth’s motion around the Sun allows us to track climate changes over a long time.
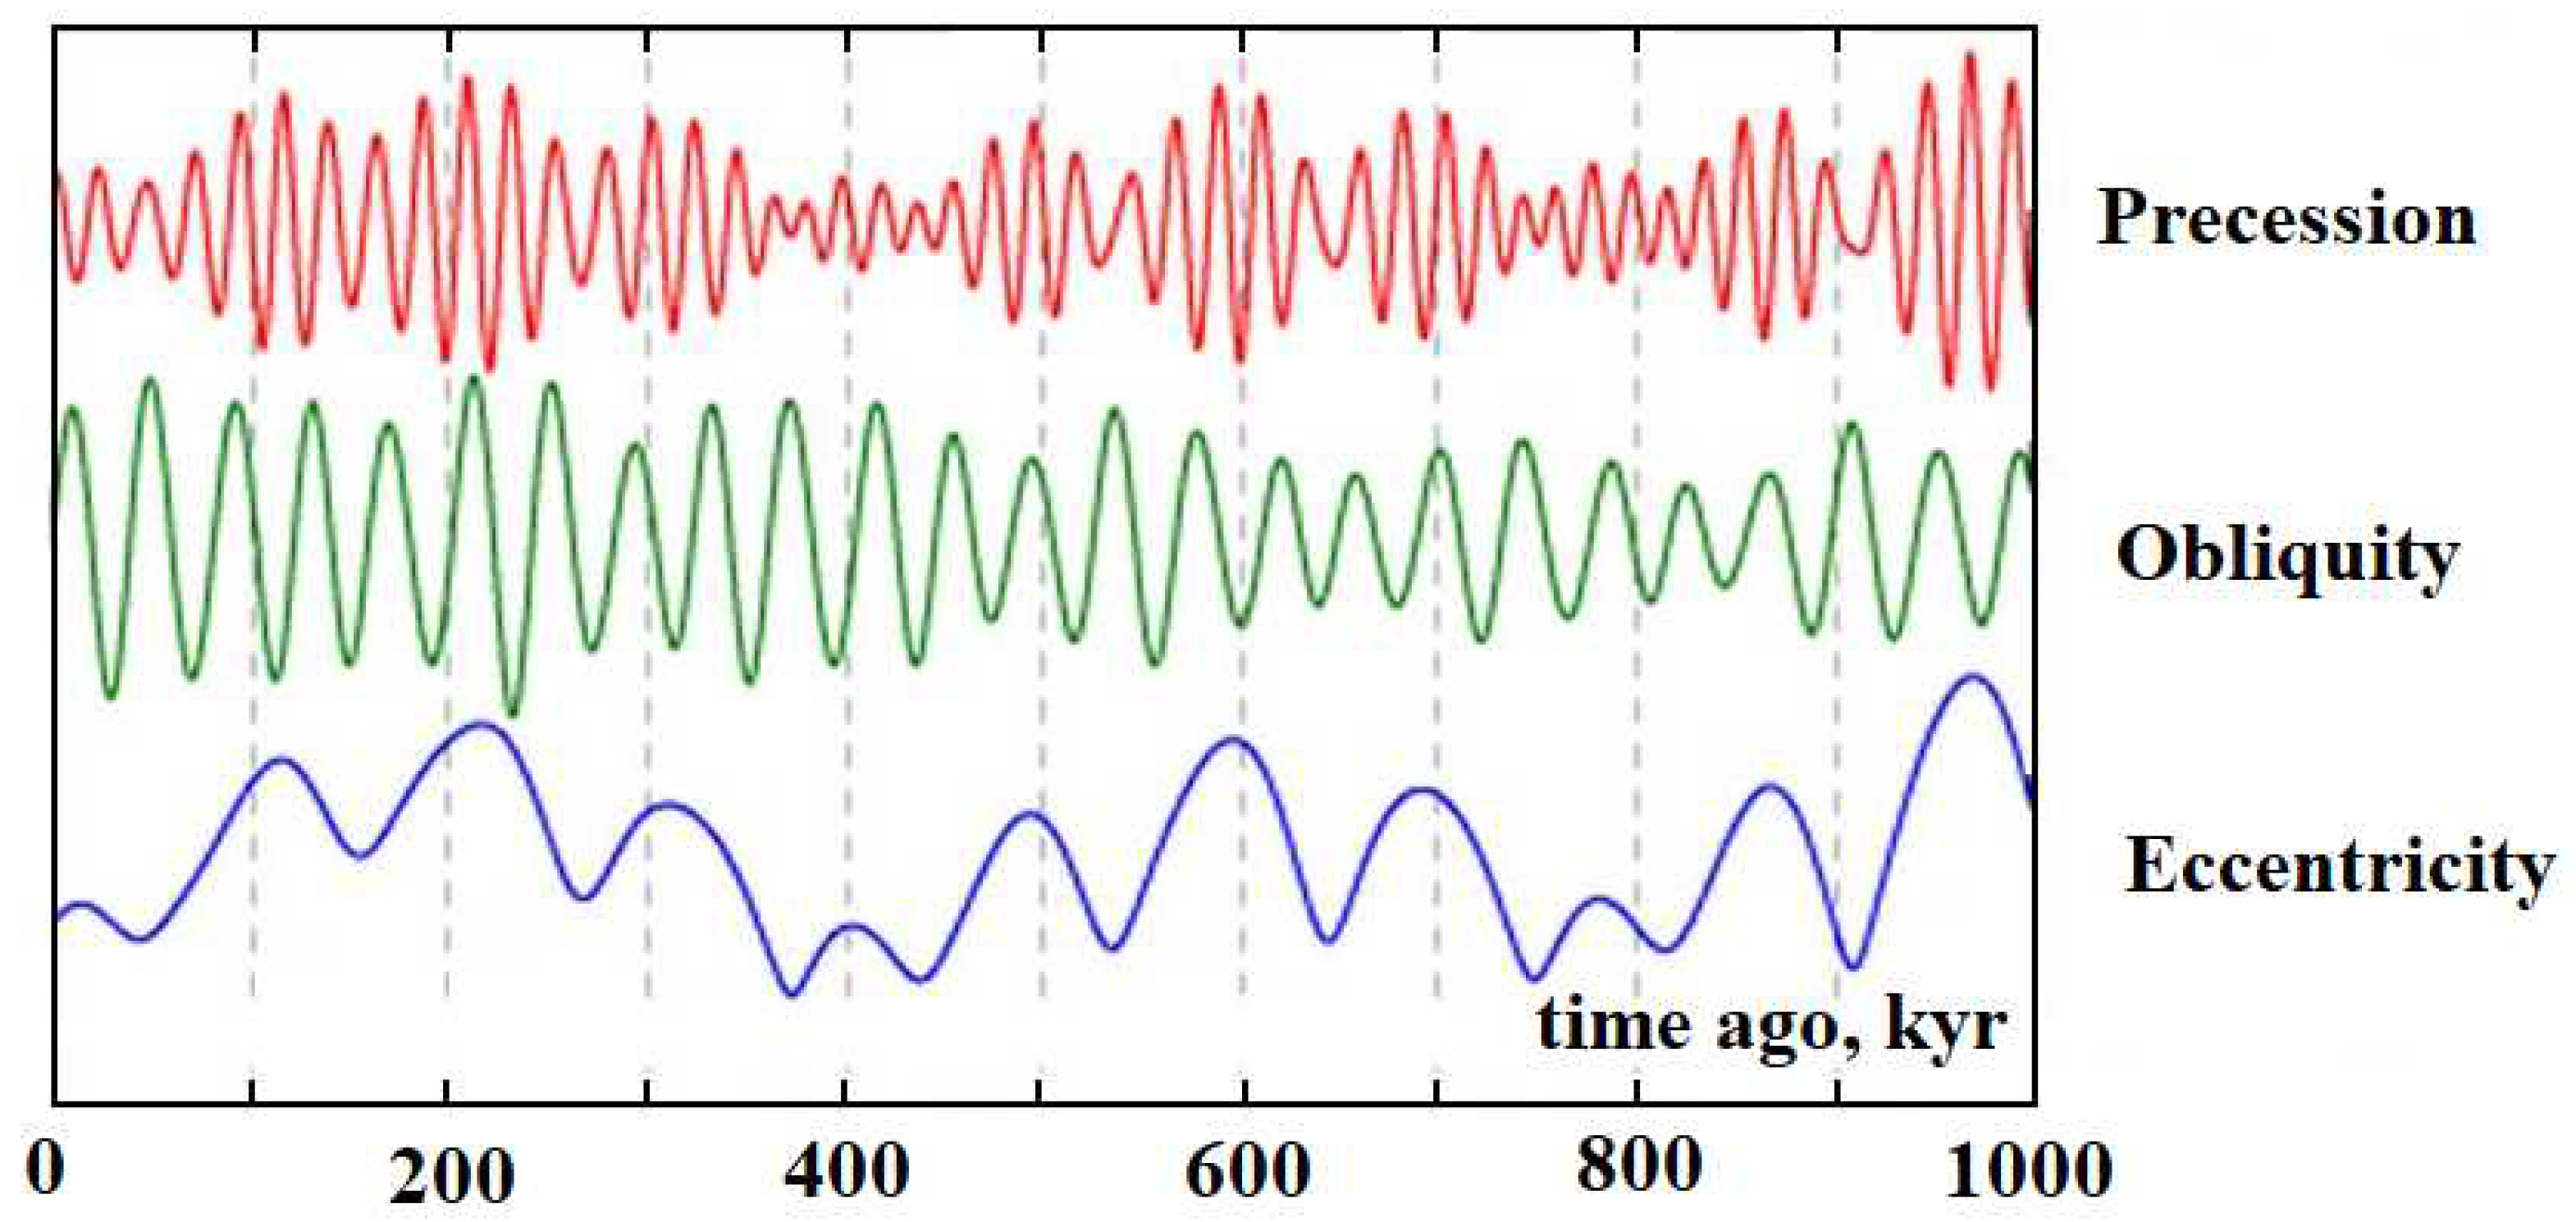
The character of change in radiative fluxes to the Earth’s surface in the course of oscillations of the Earth’s orbit is shown in Figure 5. From the point of view of the Earth’s long-range climate change, the most important are the oscillations of the seasonal average distance from the Earth to the Sun. The oscillation period for this parameter is approximately one hundred thousand years, which more or less corresponds to the period of the glacial cycle. The fastest type of oscillations due to changes in the Earth’s orbit corresponds to a change in the angle of inclination of the Earth’s axis to the plane of its orbit, which varies from to , and the period of such oscillations is 41 thousand years. The current angle of inclination of the Earth’s axis to the plane of the orbit is . Changes in radiation fluxes due to each type of oscillations are shown in Figure 5.
Let us return to Milankovich’s theory, according to which the periodic change in the Earth’s temperature over time is associated with the perturbation of the Earth’s orbit under the action of other celestial bodies. Let us compare the forces acting from different celestial bodies on the Earth. This force is proportional to the parameter
where M is the mass of a celestial body interacting with the Earth, and R is the distance between them. Obviously, among the planets of the solar system, Jupiter can have the strongest influence on Earth’s trajectory. Its distance from the Sun is 4.95 times greater than the distance from the Earth to the Sun, and the mass of Jupiter is 1047 times less than the mass of the Sun [28]. Accordingly, the ratio of the parameters (1) for the Jupiter and the Sun with respect to the Earth is about . For the Moon, this ratio is greater and is [29]. However, the parameters of the glacial cycle require a change in the distance between the Earth and Sun by an amount of about 10 million km, i.e., the Moon cannot be responsible for the changes under consideration. From Figure 2 follows another feature of the evolution of the Earth’s thermal state during the glacial age, according to which the evolution of the Earth’s temperature is asymmetric in the case of an increase and decrease in the Earth’s temperature during the glacial cycle. This is an additional argument for the failure of Milankovich’s theory.
4. Energetic Balance between the Earth and Its Atmosphere
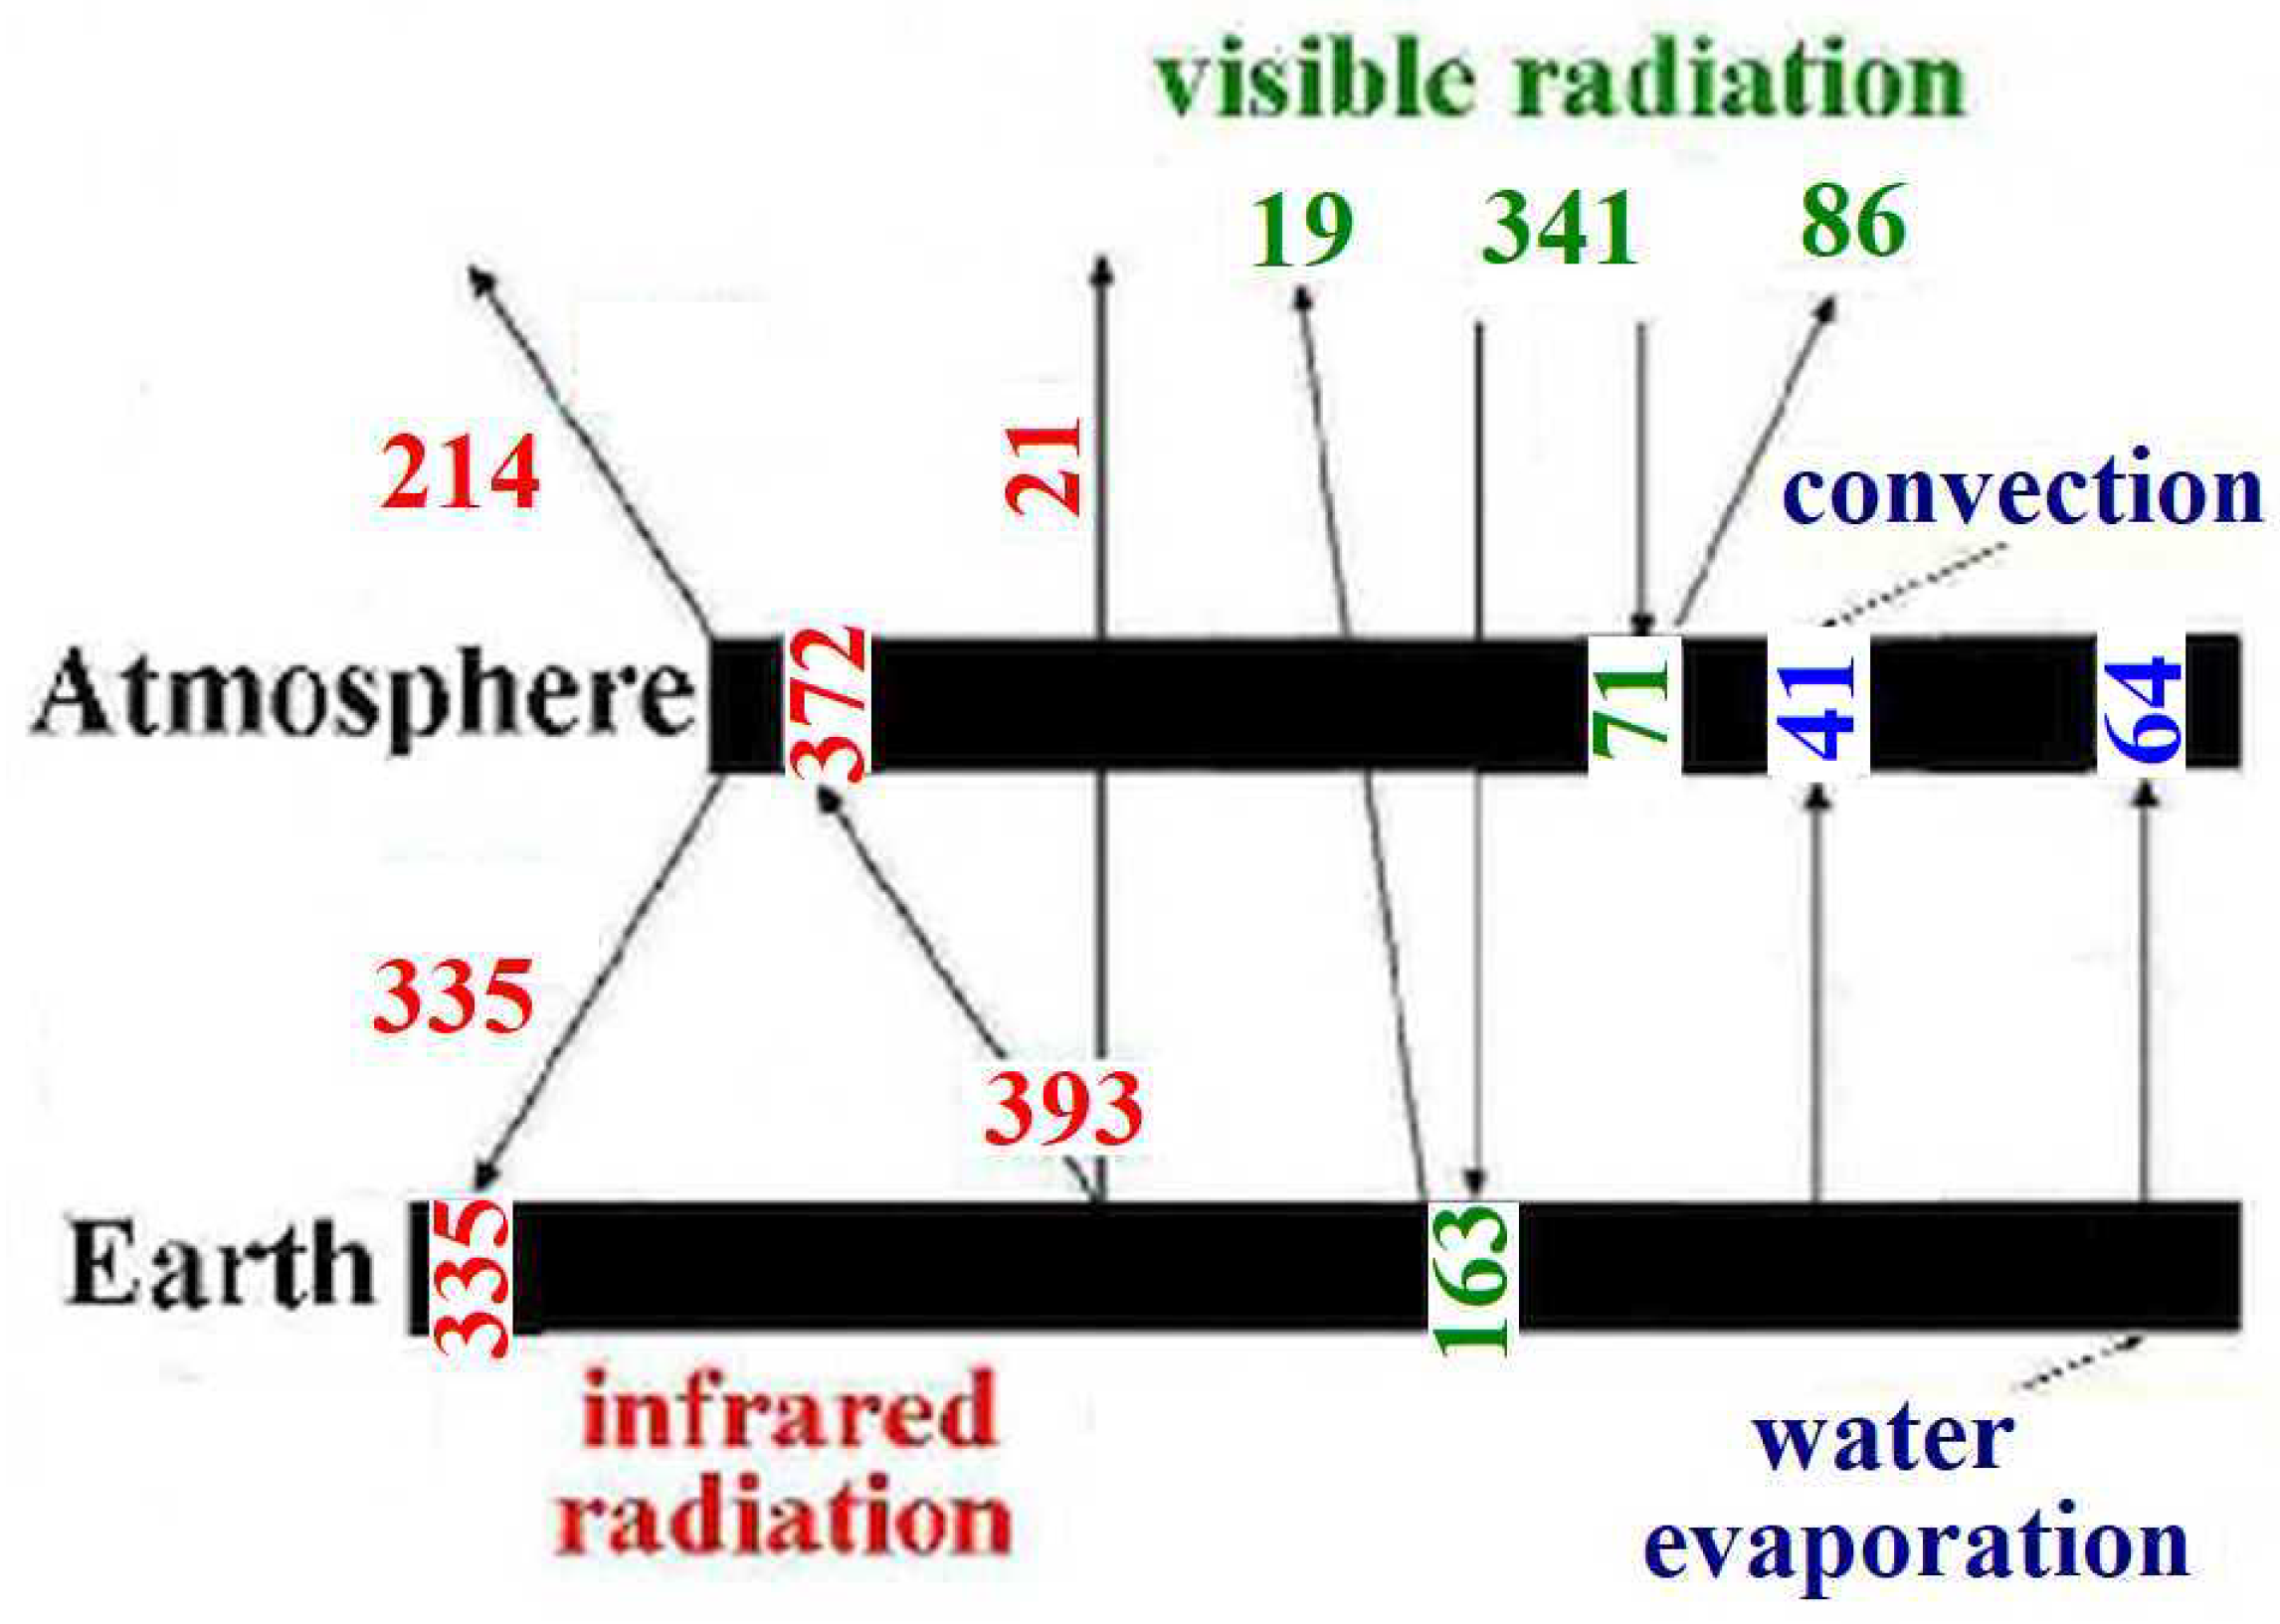
The glacial cycle is the result of a long-term change in the thermal state of the Earth, during which an energy equilibrium is maintained with the participation of the Earth and the atmosphere. In Figure 6, the energy equilibrium between the Earth and the atmosphere is presented within the framework of the standard atmosphere model [15], which uses averaging of atmospheric parameters over the surface of the globe and time. In this case, the parameters of the atmosphere depend only on the altitude above the Earth’s surface, and the time to establish this equilibrium does not exceed one year [17] such that the energy state of the Earth and its atmosphere can be considered stationary if they change slightly over several years.
Shown in Figure 6, the energetic balance is based on different sources of this information; the error in energy fluxes exceeds 1 W/m. This equilibrium indicates its stationary nature during times significantly exceeding the season time. In reality, the stationarity of the equilibrium given in Figure 6 means the fulfillment of three conservation laws for energy fluxes. Namely, the average energy fluxes absorbed and emitted by the Earth, the atmosphere and the surrounding space coincide with the accuracy of about 1 W/m. For example, for a surrounding space, this means that the average flux of solar radiation penetrating the Earth’s atmosphere is equal to the sum of the average fluxes of reflected solar radiation from the atmosphere and the Earth’s surface, as well as the sum of fluxes of thermal radiation that are emitted into the surrounding space by the atmosphere and the Earth’s surface.
The energetic equilibrium for the Earth’s surface and atmosphere, shown in Figure 6, includes energy fluxes which are initiated by solar radiation. Typical energy fluxes in this case are tens and hundreds of W/m. We now consider the energy exchange between the inner and surface parts of the Earth. The energy flux from the Earth’s interior to the outside is approximately 0.09 W/m [31,32]. This flux results from the decay of radioactive nuclei in the Earth’s crust, as well as resulting from the restructuring of the inner part of the Earth as a continuation of the process of Earth’s formation. The decay of radioactive nuclei , , , creates approximately 50% of the energy flux from the Earth’s bowels to the surface [33]. Processes which are responsible for the creation of these fluxes determine the nature of evolution of the Earth’s interior in the past [34,35]. This heat flux does not play a role in the development of the glacial cycle since it changes slightly during one period of the glacial cycle.
One can add to this the anthropogenic energy flux, which is created by burning fossil fuels. In reality, the internal energy of the Earth in this case is transported to its surface and then is converted into thermal energy on the Earth’s surface. The total power generated by burning fossil fuels is W, which corresponds to the average energy flux, which is slightly less than W/m.
However, it is impossible to summarize these energy fluxes to obtain the total one because of a low accuracy of the imbalance between incoming and outgoing energy fluxes. This imbalance for each object is less than 1 W/m and is less than the accuracy of determination of basic energy fluxes. In particular, measurements [36] show that the imbalance of energy fluxes from the surrounding space and back was W/m for the period 1985–1999, as well as W/m for the period of 2000–2012 years. Note that the positive value of the imbalance for energy fluxes corresponds to the heating of the Earth.
In any case, the positive imbalance of average energy fluxes currently leads to the melting of glaciers. If the melting ice is uniformly distributed over the Earth’s surface, as a result of the totality of measurements, the layer of the annually melting ice layer is approximately 7 mm [30]. This ice melting rate requires an energy flux of 0.08 W/m. It should be noted that, at present, the total energy flux as a result of industrial human activity is half of this value.
It should be noted that in the above analysis of the energetic balance, we deal with the average energy fluxes. Hence, we implicitly assume that the powers of processes under consideration relate to the entire surface of the Earth. This is more or less true for basic fluxes presented in Figure 6. Low energy fluxes involving the near-surface interior of the Earth have a local character. This takes place in the case of energy release during the decay of radioactive nuclei, which occurs only in specific structures, such as granite, the melting of glaciers, as well as a result of industrial human activity. In these cases, average energy fluxes are used only for comparison with other ones.
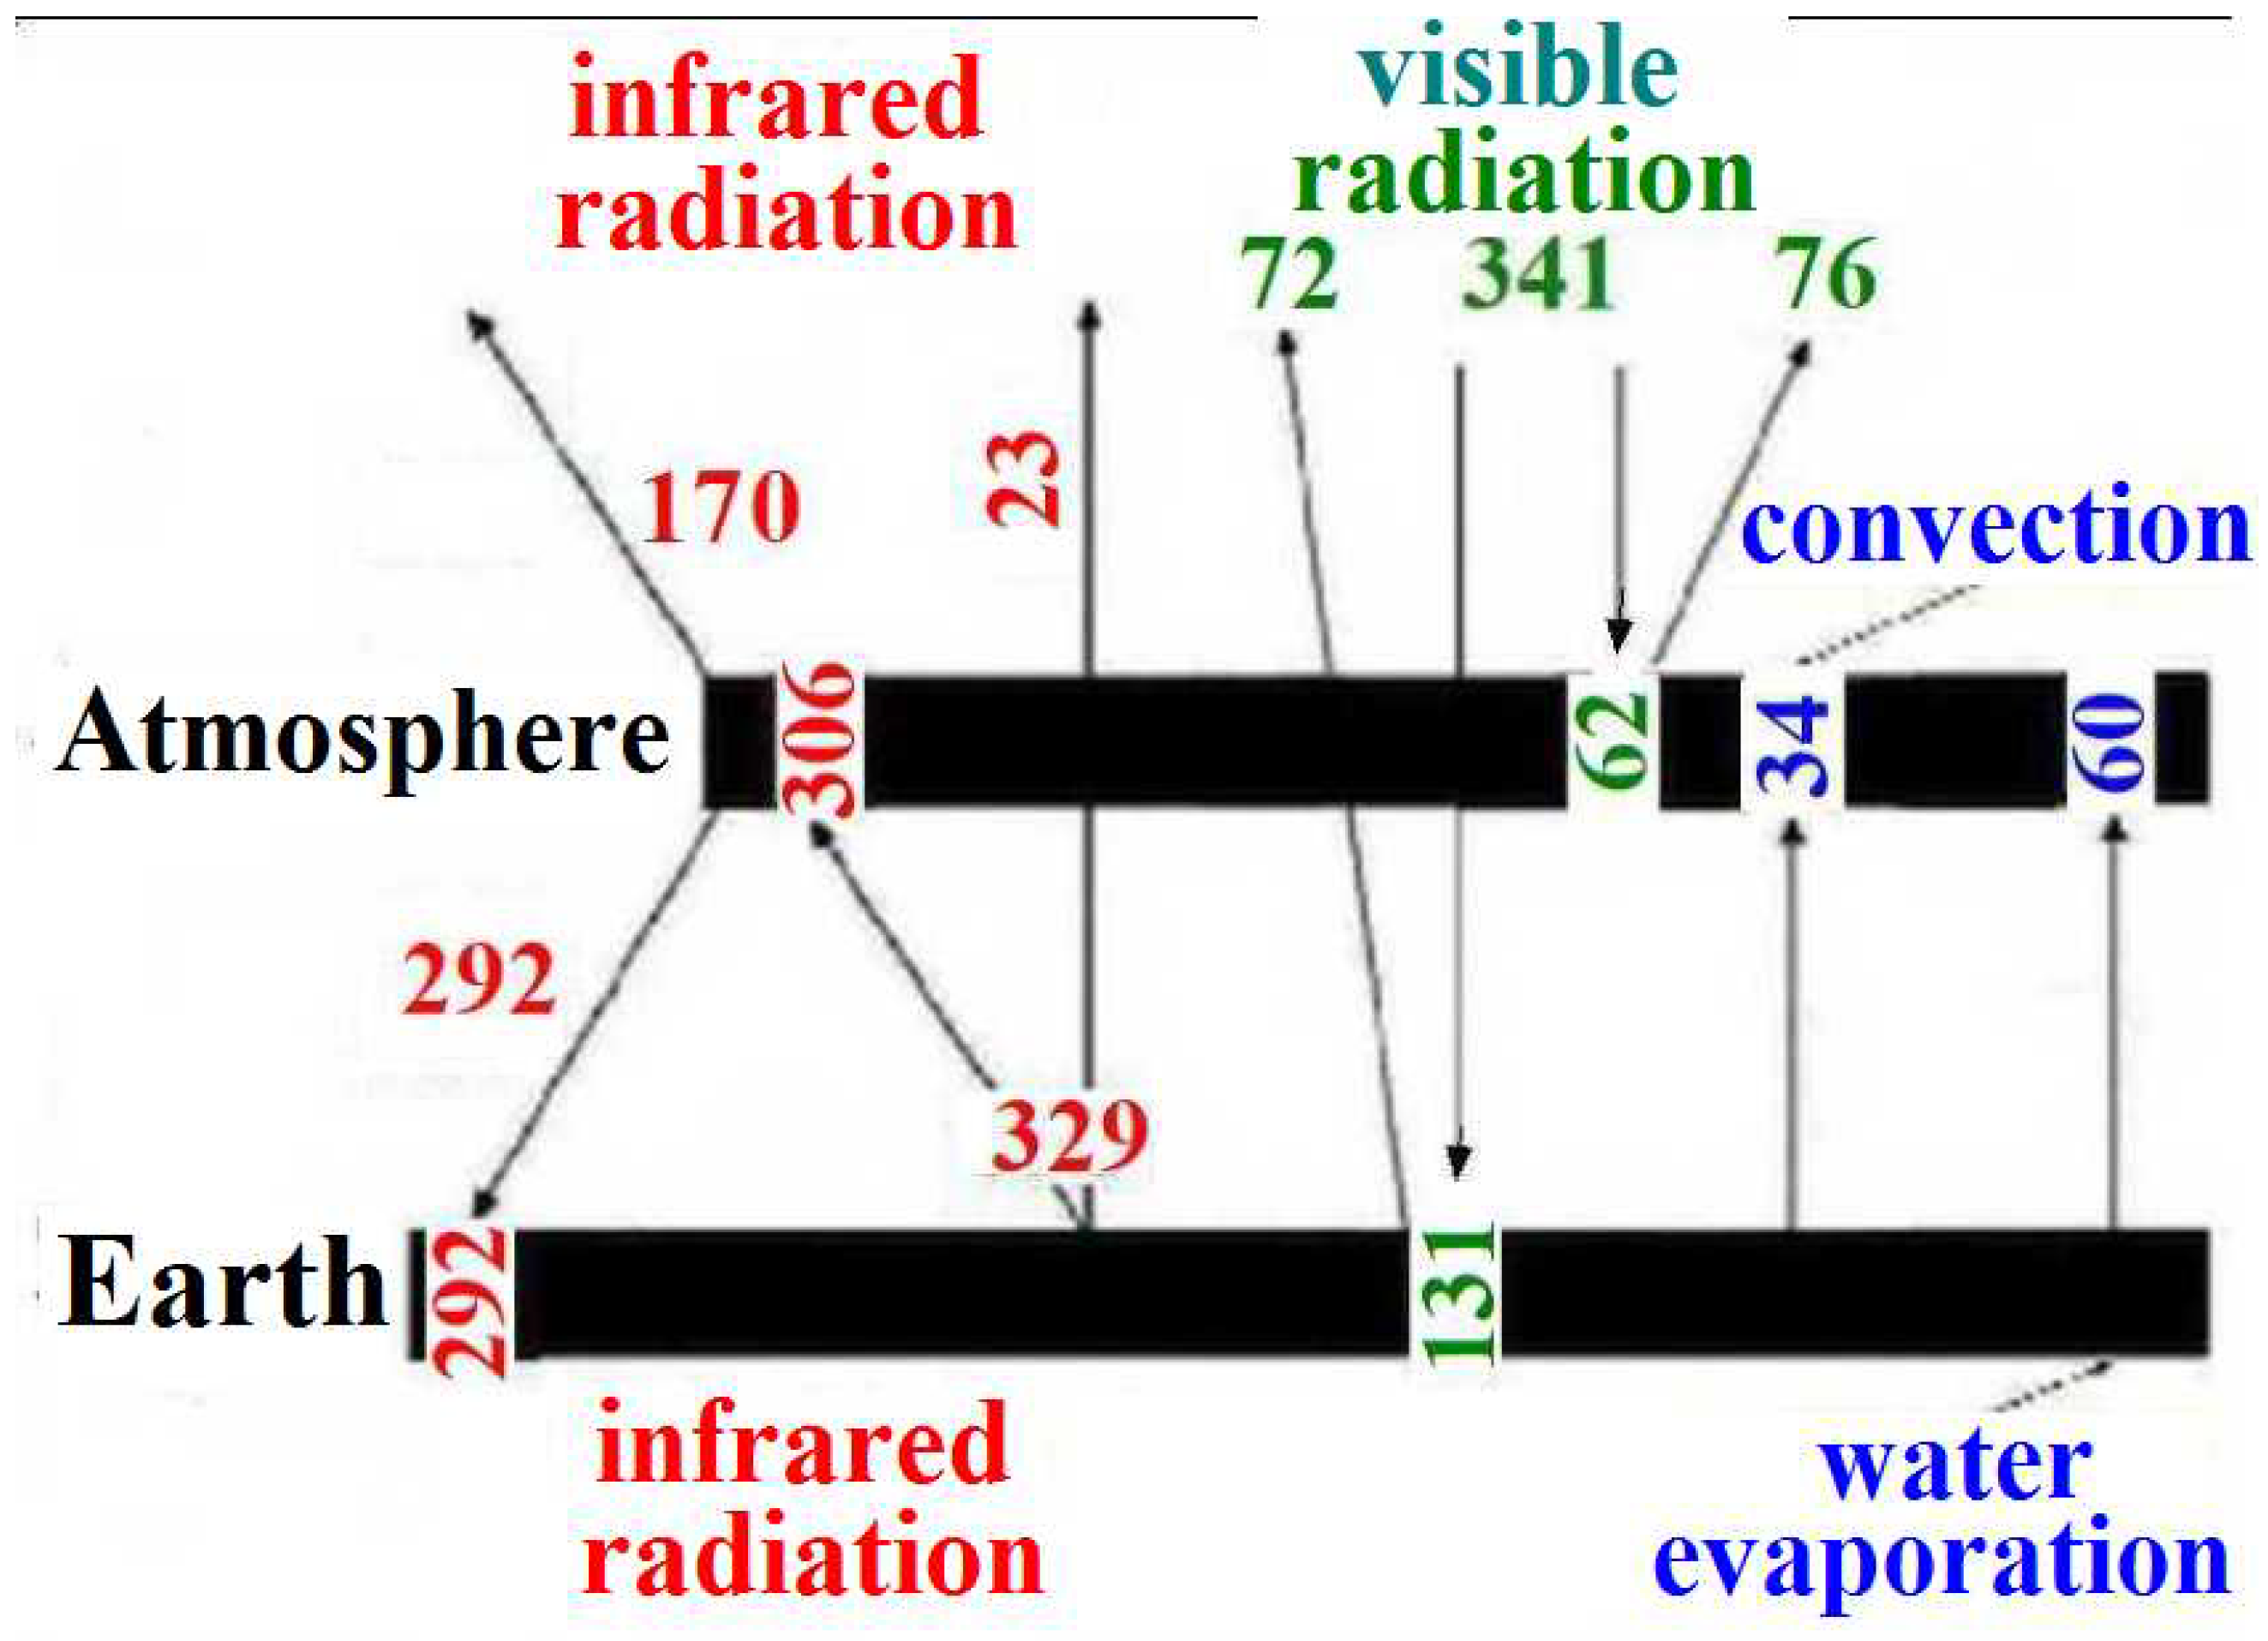
In addition to the diagram of Figure 6, we construct also the energetic balance related to the cold phase of the glacial circle on the basis of the Antarctica data. Let us assume that the global temperature during the cold period of the glacial cycle is 12 C lower than its current value, i.e., for the model of standard atmosphere, it is equal to K. In addition, for the sake of certainty, we assume the concentration of carbon dioxide molecules in a cold phase of the glacial cycle to be less twice compared with the contemporary value. The error of energy fluxes for the cold phase of the glacial circle is larger than that for the warm period, where this error is 1 W/m. The reliability of the data obtained below is determined by the proximity of parameters of the energetic balance for the warm and cold periods of the glacial cycle.
Parameters of the energetic balance for the Earth, the atmosphere and a surrounding space are shown in Figure 7. The method to obtain these parameters is given below. We assume that the Earth’s surface emits as a black body. Then, in accordance with the Stephan–Boltzmann law, we obtain for the average radiative flux from the Earth’s surface the value of 329 W/m instead of the value of 393 W/m for the warm period of the glacial cycle. We assume that, as in the case of the standard atmosphere model, the temperature gradient remains constant up to the boundary of the troposphere, located at the altitude of 11 km. Then this atmospheric temperature gradient for the cold phase will be K/km instead of K/km for the warm time of the glacial cycle. Assuming that the coefficient of convective thermal conductivity is linear with respect to the temperature gradient, we obtain for the average heat flux transferred from the Earth’s surface to the atmosphere as 34 W/m. For the warm period of the glacial cycle, this value is 41 W/m.
In analyzing the processes involving water, we use the following model [37] for the distribution of atmospheric water. Namely, the number density of water molecules is connected with its number density at the saturated vapor pressure so that in the cold period of the glacial cycle, the number density of atmospheric water molecules is about lower than that in the warm period. We obtain for the average energy flux from the Earth’s surface to the atmosphere as a result of water evaporation the value of 60 W/m instead of 64 W/m in the warm period.
An important component in the energetic balance of the Earth and its atmosphere is clouds, consisting mainly of water microdroplets. The mass of atmospheric water contained in clouds is a small part of atmospheric water (approximately for the contemporary atmosphere). This smallness is determined by the nature of water condensation in the atmosphere [37], which occurs as a result of mixing for jets of warm air from the near-surface atmosphere and cold air from higher layers of the atmosphere. Assuming that the mass of condensed water in the atmosphere is proportional to the square of the density of water molecules in the near-surface atmosphere, we obtain that the mass of condensed atmospheric water for the cold phase of the glacial cycle is about less than this value for the warm stage. Let us take into account that the radiation emitted by the Earth and leaving the atmosphere is mainly determined by passing through clouds in the frequency range corresponding to the atmospheric transparency window [30]. Then we obtain for the average radiative flux emitted by the Earth’s surface and going beyond the atmosphere the value of 23 W/m instead of 21 W/m in the warm phase of the glacial cycle. Accordingly, the infrared radiative flux emitted by the Earth’s surface and absorbed by the atmosphere is 306 W/m instead of 372 W/m in the warm phase of the glacial cycle.
Atmospheric water microdroplets play a primary role in the absorption and scattering of solar radiation by the atmosphere. We assume that the corresponding fluxes are proportional to the mass of condensed water in the atmosphere. Then we obtain for the average flux of solar radiation reflected from the atmosphere the value of 76 W/m instead of 86 W/m in the warm period of the glacial cycle, and for the average flux of solar radiation absorbed by the atmosphere, the value of 62 W/m instead of 71 W/m, which refers to the warm period of the glacial cycle.
Atmospheric emission in the infrared spectrum range is created mainly by three greenhouse components, namely, water and carbon dioxide molecules, as well as water microdroplets that form clouds. Changes in the radiative fluxes of the atmosphere towards the Earth during the transition between warm and cold glacial stages are determined by changes in the concentration of greenhouse components, as well as changes in the temperature of the atmosphere, and the second factor dominates. In particular, a twice decrease in the concentration of carbon dioxide in the atmosphere leads to a change in the average radiative flux from the atmosphere to the Earth’s surface by about 1 W/m, whereas we obtain the change of the total radiative flux from the warm stage to the cold one as 43 W/m on the basis of the computer code [38] for the greenhouse effect.
Other parameters of the energetic balance of the Earth and atmosphere in the cold phase of the glacial cycle, which are given in Figure 7, follow from the energy equilibrium for each of the three objects, the Earth’s surface, the atmosphere and a surrounding space. The average energy flux generated by the Earth’s surface is the sum of fluxes of thermal radiation, heat transfer due to convection, and as a result of extraction of the hidden energy from water condensation in the atmosphere. This total energy flux for the emission of the Earth’s surface is 423 W/m. Requiring the total absorption flux to be equal to this value, one can find that the average solar radiation flux absorbed by the Earth’s surface is 131 W/m.
The energetic balance of the Earth’s atmosphere in the cold glacial period uses the total energy flux absorbed by the atmosphere, which is equal to 462 W/m. Equating the total energy flux created by the atmosphere to this value, we find the average radiative flux of 170 W/m going beyond the atmosphere. Next, from the surrounding space comes the average energy flux in the form of solar radiation, equal to 341 W/m. We equate it to the average outgoing energy flux, which consists of the flux of thermal radiation generated by both the atmosphere and the Earth’s surface, and going beyond the atmosphere, as well as reflected solar radiative fluxes from the Earth’s surface and atmosphere. Hence, we find that the average solar radiative flux reflected from the Earth’s surface is 72 W/m instead of 19 W/m, which refers to the warm phase of the glacial cycle. From the values obtained above, the energetic balance of the Earth’s surface and atmosphere is formed during the cold stage of the glacial cycle, which is presented in Figure 7.
5. Processes of Glacial Cycle
The character of evolution resulted from the glacial cycle is based on Antarctic measurements, including the data of Figure 2. A simplified version for this character of the glacial cycle consists of a transition between the warm and cold thermal states of the Earth and a reverse transition. The Earth’s cooling is slow and can be explained by a small imbalance between the energy fluxes which are determined by processes involving the Earth’s surface. The energy loss of the Earth–atmosphere system is accumulated and leads to a slow temperature decrease of the Earth.
Another stage of the Earth’s evolution in the course of the glacial cycle is a sharp transition from a cold thermal state of the Earth to a warm one. This stage resembles a thermal explosion, which is accompanied by a sharp increase in the temperature of the system as a result of intense heat release. In this case, we cannot associate a sharp increase in the temperature with an intense heat release. The transition under consideration occurs as a result of changes in the optical properties of the Earth’s surface. In other words, the ice surface of the Earth is covered with the products of a volcanic eruption, which changes the energy balance of the Earth and the atmosphere. The process of glaciation of the Earth’s surface is slow, taking into account the seasonal nature of formation and melting of snow. On average, during the cold stage, its boundary moves from the poles to the equator.
In order to determine numerical parameters of the processes under consideration, we analyze the change in the albedo of the Earth’s surface as a result of transition between the warm and cold thermal states of the Earth over the course of the glacial cycle. On the basis of the Earth’s energetic balance for the warm and cold stage of the glacial cycle, given in Figure 6 and Figure 7, we have that the atmospheric albedo changes from 0.25 to 0.22, and the albedo of the Earth’s surface changes from 0.11 to 0.36 on average in the transition from the warm thermal state of the Earth to the cold one. As is seen, the albedo of the atmosphere varies slightly in the course of development of the glacial cycle, while the reflectivity of the Earth’s surface changes significantly. Therefore, the change in the thermal state of the Earth during the glacial cycle is associated with the evolution of the ice covering the Earth’s surface, and not with a change in the atmosphere covering of clouds.
Let us compare the observed albedo of the Earth’s surface with the albedo of some materials. If the Earth’s surface is covered with ice completely, its albedo would be 0.84, and if it was covered with a green forest, the albedo would be 0.14 [39]. The albedo of open ocean water is 0.06, and the albedo of green grass is 0.25 [40]. Since land occupies of the Earth’s surface area, one can consider the cold state of the Earth during the glacial cycle, when the entire land and an additional of the ocean surface are covered with ice. As is seen, about of the Earth’s surface is covered with ice in the cold thermal state of the Earth, i.e., the cooling process of the glacial cycle is over when the Earth’s surface is covered with ice partially. Because the cooling stage of the glacial cycle stops when a restricted part of the Earth’s surface is covered with ice, the limit of the cooling process is not connected with this process. From this, one can conclude that the transition from the cold state of the Earth to the warm one during the glacial cycle occurs as a result of energy release inside the Earth.
One would expect that the cold state of the Earth corresponds to the complete glaciation of the Earth, and evidently, it is formed as a result of an imbalance of energy fluxes for the most intensive processes of the Earth’s energetic balance, shown in Figure 6 and Figure 7. A sharp increase in the Earth’s temperature during the stage of its growth results from volcano eruptions when the Earth’s surface is covered with ash, which leads to a change in the energetic balance for some area of the Earth’s surface. Since the surface ice is transformed into water, subsequently, the solid products of volcano eruption go under water, and glaciation may recur. Because in addition to hard rocks, volcanic eruption products contain salts that are dissolved in surface water, this increases the temperature of water solidification. Therefore volcano eruptions stop the glaciation process on the Earth.
Thus, because the glaciation process, due to the imbalance of incident and outgoing energy fluxes for the Earth, stops when the Earth’s surface is covered partially with ice, there is the feedback between the surface and inner Earth’s energetic processes. The more probable version of inner Earth’s processes corresponds to volcano explosions. Definitely, an explanation of the character of the glacial cycle may be followed from the dependence of the probability of a volcanic eruption on the penetration of water into the Earth’s interior where the volcanic eruption is preparing. One can assume that water penetration in the magma and subsequent evaporation of this water reduces the magma temperature that slows down the volcanic eruption. If the area over the region of eruption is covered with ice, the penetration of water into the Earth’s interior becomes difficult. This establishes the feedback between the probability of a volcanic eruption and the aggregate state of water located over the region of eruption. Therefore, one can explain the glacial cycle as the transition between the warm and cold thermal states of the Earth.
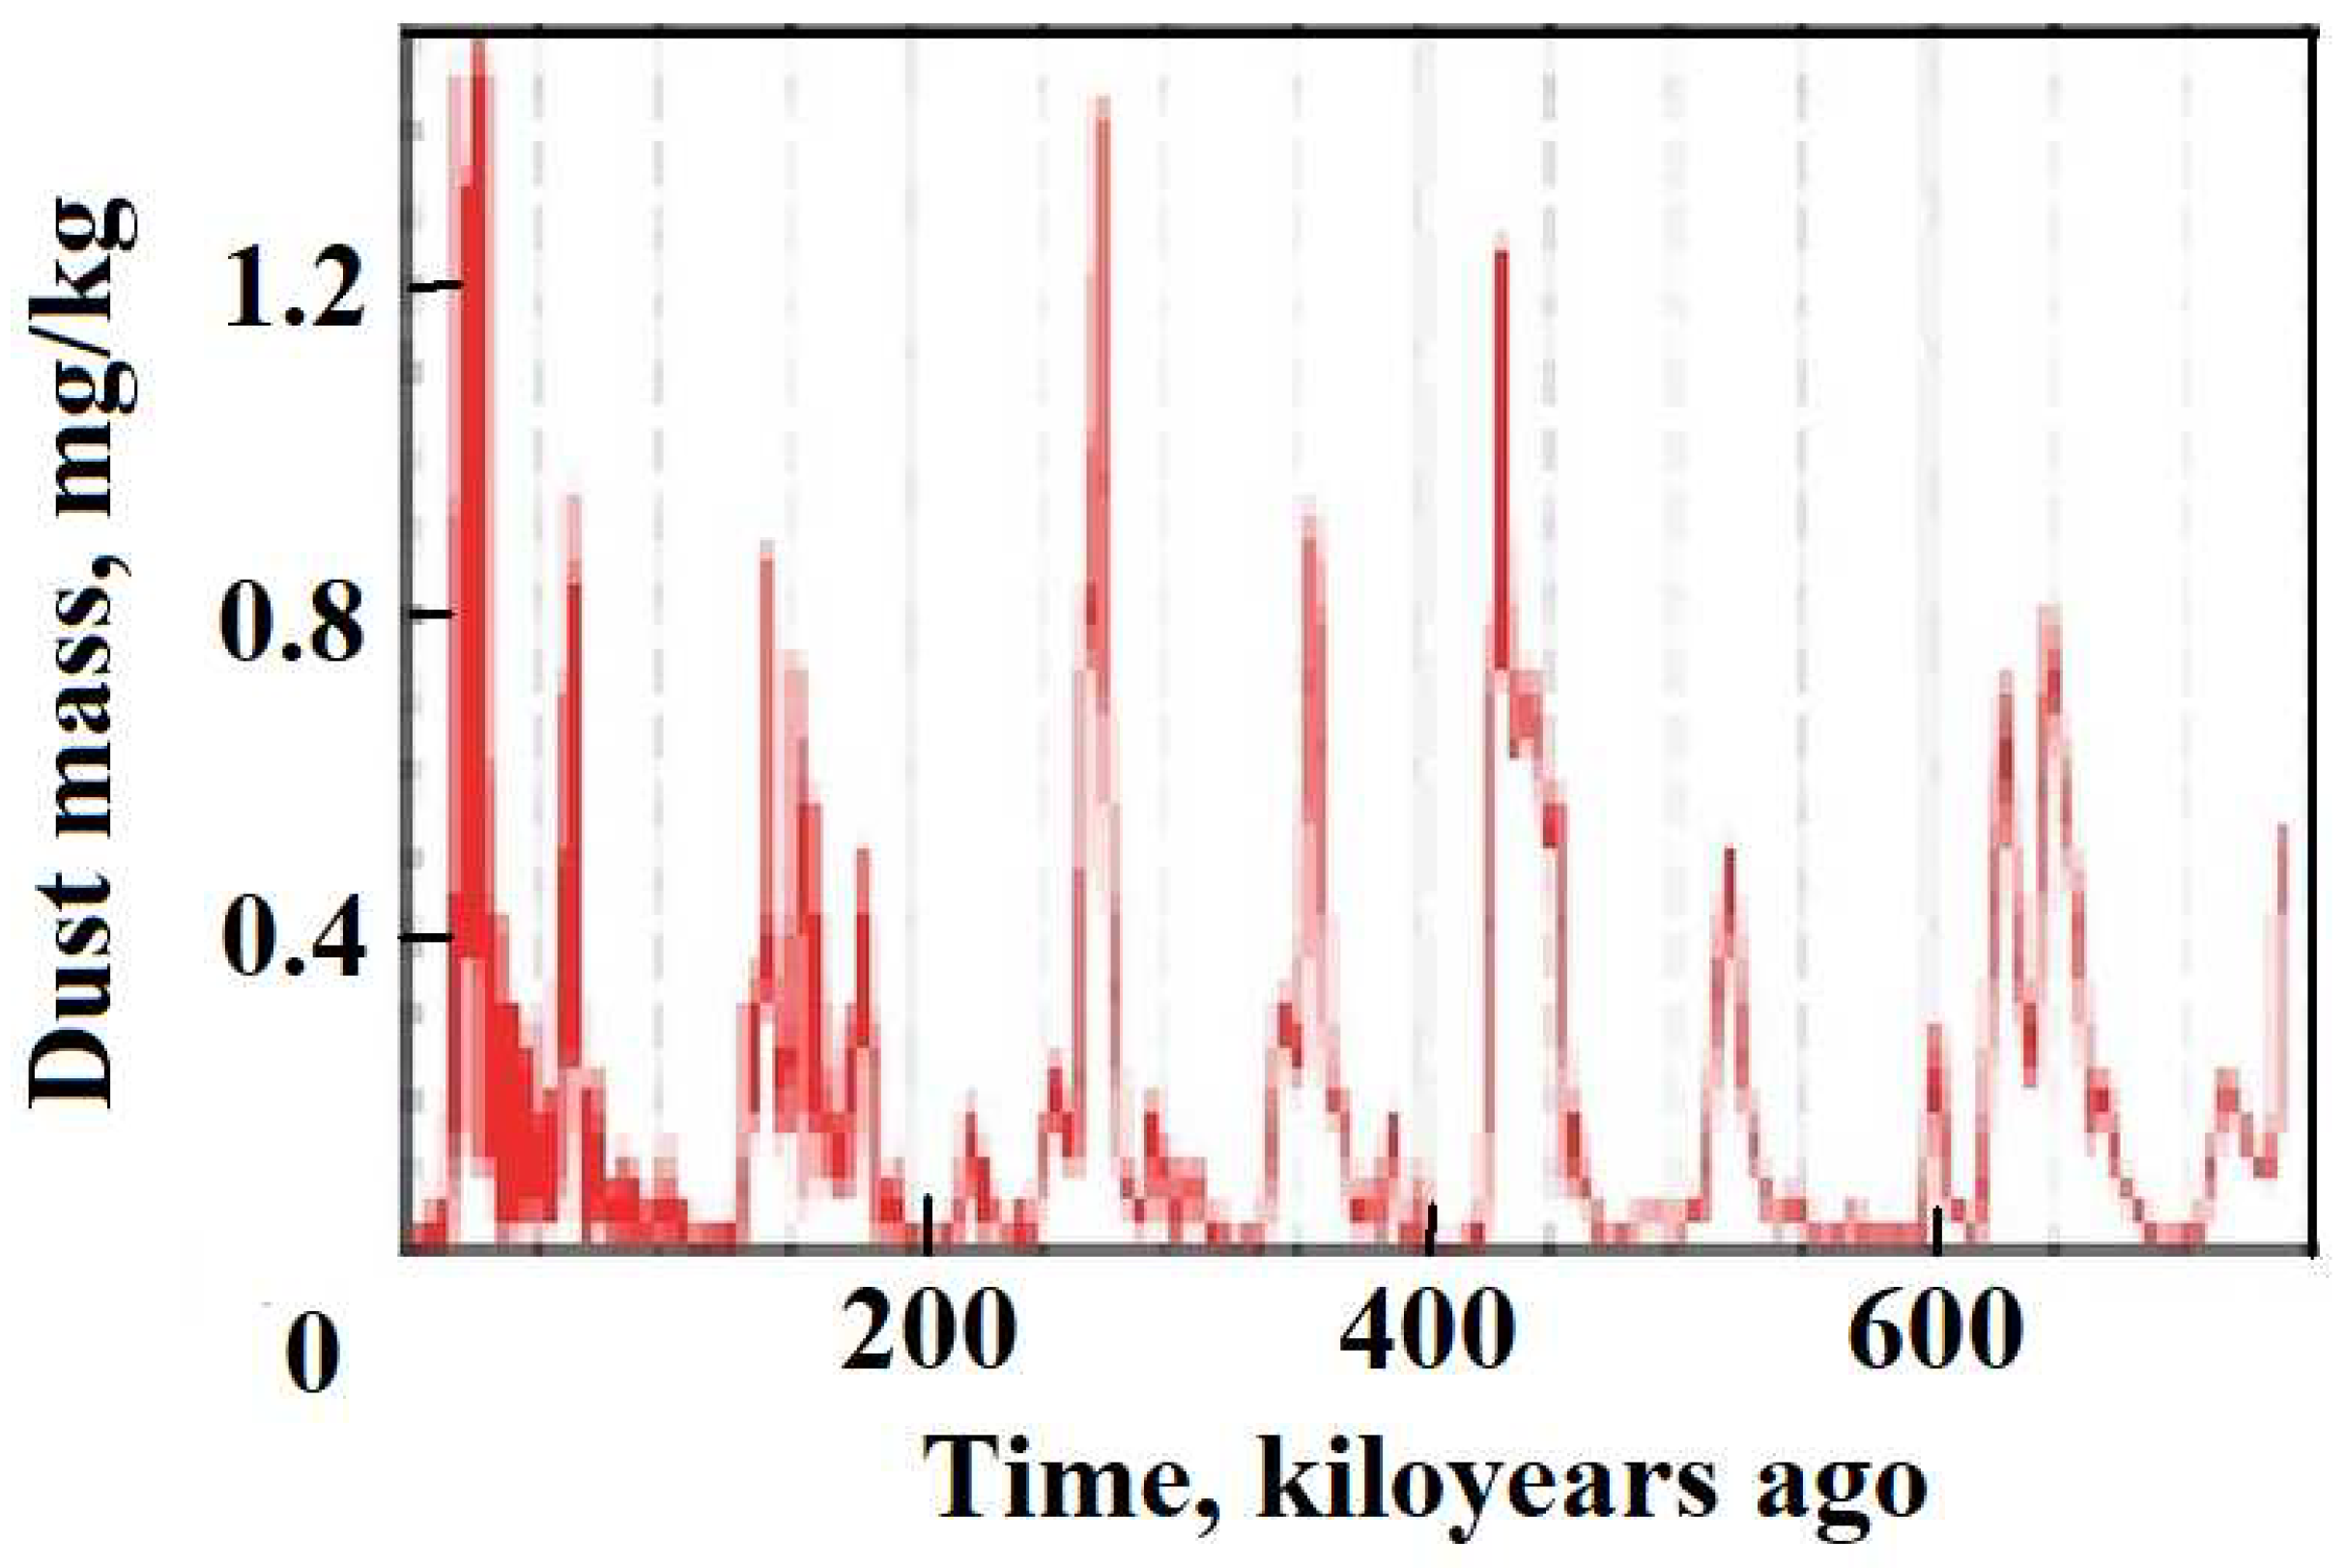
Note that according to the above analysis, the transition from the cold stage of the glacial cycle to the warm one is caused by the eruption of volcanoes. At the same time, the maximum activity of volcanoes refers to a small time interval when this transition is carried out. Since the eruption of volcanoes is accompanied by the release of a large mass of material from the near-surface interior of the Earth, and then their products cover the Earth’s surface, this process should manifest itself in sediments so that the solid rock in these sediments is associated with the eruption of volcanoes. Then the time dependence for the dust mass in ice deposits has a resonant character, and the resonances themselves are due to a high activity of volcanoes when the transition from the cold phase of the glacial cycle to the warm one occurs. This character is confirmed more or less by the data of Figure 8 [41,42,43], where the relative amount of dust in ice deposits is given.
Let us pay attention to another feature of the analysis. The temperature of the near-surface atmosphere and the concentration of carbon dioxide molecules, obtained on the basis of the analysis of deposits in the glaciers of Antarctica, we attributed to the whole globe. This is not entirely correct, but because of the qualitative character of the analysis, this fact does not affect the reliability of the conclusions.
6. Discussion and Conclusions
The experience of this work shows that thorough research allows one to gain a deeper understanding of the object. In this case, research within the EPICA project leads to contradictions with the simple description of the glacial cycle and allows us to obtain a more correct scheme of this phenomenon.
In this case, the air temperature near the Earth’s surface in the Antarctic region in the past follows from the analysis of air bubbles located in the ice deposits of Antarctica. This analysis allows one to describe the glacial cycle as the evolution of the thermal state of the Earth. According to the measurements carried out, our planet has been slowly cooling during almost the entire glacial cycle, which lasts about one hundred thousand years, and the rate of the temperature decrease of the planet during this period slightly exceeds C.
This value is more than an order of magnitude lower than the energy flux currently generated by burning fossil fuels in the energy industry of the contemporary world. Since this value is small, when analyzing it, the internal energy of the Earth must be included in the energy balance of the Earth and the atmosphere. Then, there is a sharp increase in temperature, in its form resembling a thermal explosion. According to measurements, this behavior of glacial cycles has been observed for at least 1 million years.
At present, glacial cycles in the evolution of the Earth are explained by the Milankovich theory [25,26], according to which the evolution of the Earth’s temperature is associated with a change in the Earth’s orbit relative to the Sun. However, the observed change in the temperature of the Earth’s surface during the glacial cycle requires a strong impact on the Earth of other celestial bodies, which is unrealistic. In addition, the rates of temperature rise and fall during the glacial cycle within the Milankovich theory have the same order of magnitude, which contradicts the observed data.
The analysis carried out above shows that the transition from a cold thermal state of the Earth to a warm one during the glacial cycle can be explained by a change in the albedo of a part of the Earth’s surface, which is first covered with ice, and then byproducts of volcanic eruptions. The latter leads to a change in the energy balance of the Earth as a result of changes in the albedo of the Earth’s surface. This transition causes a sharp increase in the temperature of the Earth.
The cooling of the Earth is due to a slight imbalance between the energy flux of solar radiation penetrating the Earth’s atmosphere and the energy flux of radiation leaving the atmosphere. This imbalance of energy fluxes leads to a change in the average temperature at a rate of C/year. According to the measurements, our planet has slowly cooled during almost the entire glacial cycle, which lasts about one hundred thousand years, and the decrease in the planet temperature during this period has slightly exceeded 10 C. Then there was a sharp increase in the temperature, in its form resembling a thermal explosion. According to measurements, this behavior of glacial cycles has been observed for at least 1 million years.
However, the process of glaciation of the Earth’s surface ends at the moment when a limited part of the Earth’s surface is covered with ice. It follows from this that the end of the glaciation of the Earth’s surface is determined by other processes, and not by the process of glaciation. If the process of glaciation of the Earth’s surface continued further and the entire surface of the Earth was covered with ice, photosynthesis would end, and life on Earth would cease. Thus, the limited coverage of the Earth’s surface by ice as a result of volcanic activity of the Earth plays an important role in the development of life on Earth.
In addition, we note that the Earth has been in the warm phase of the glacial cycle for about the last ten thousand years. All of human civilization has existed in this time. Since the cooling of the Earth and the process of glaciation are characterized by low energy consumption, human civilizations have changed this process. Obviously, the imbalance of the Earth’s energy was compensated for by human activity at the beginning of our era. Therefore, the glacial cycle of the evolution of the Earth’s temperature will not continue in the future.
Next, the dependence of the degree of glaciation of the Earth on time shows that only a part (about 40%) of the Earth’s surface is covered with ice at the coldest stage of the process. This leads to the conclusion that the end of glaciation is determined by additional thermal processes, rather than by the process of the glaciation of the Earth. Finally, the abrupt nature of the heating of the Earth can be explained only by changing the parameters that determine the thermal balance of the Earth. The only such parameter is the albedo of the Earth, and we associate the change in the albedo of the Earth to be a result of volcanic activity of the Earth with the glacial cycle.
Note that the connection of the volcanic activity with the covering of the Earth’s surface with water or ice is the only suitable explanation for the measurements. Thus, from the observed nature of the quasi-periodic change in the Earth’s temperature during the glacial cycle, it follows that the volcanic activity of the Earth depends on the covering of its surface with water or ice. In other words, careful measurements of the evolution of Earth’s temperature in the past within the framework of the EPICA project suggest a connection between the phase state of water on the Earth’s surface and volcanic activity.
Some confirmation of this follows from the data of the EPICA project itself, concerning the amount of dust in glaciers depending on the time of its precipitation. The dependence of this value on time is quasi-periodic, as is the temperature of the Earth. In any case, the results of the project provide a direction for further research to better understand the evolution of the Earth’s thermal state in the past and the processes that are responsible for this. In the first place, it is necessary to establish the correlation between the glacial cycle and volcanic activity.
Thus, the measurements of the Earth’s temperature in the past based on the analysis of air bubbles located in the ice deposits of Antarctica allow a deeper understanding of some aspects of the glacial cycle as evolution of the thermal state of the Earth. According to these measurements, our planet has slowly cooled during almost the entire glacial cycle, which lasts about one hundred thousand years, and the decrease in the planet temperature during this period slightly exceeds 10 C. Then there was a sharp increase in the temperature, in its form resembling a thermal explosion. According to measurements, this behavior of glacial cycles has been observed for at least 1 million years.
At present, glacial cycles in the evolution of the Earth are explained by the Milankovich theory [25,26], according to which glacial cycles in the evolution of the Earth’s temperature are associated with a change in the Earth’s orbit relative to the Sun. However, the observed change in the temperature of the Earth’s surface in the course of the glacial cycle requires a strong impact on the Earth of other celestial bodies, which is unrealistic. In addition, rates of temperature rise and its fall during the glacial cycle within the framework of the Milankovich theory are of the same order of magnitude, that contradicts to the observed data.
Next, in the end of the glaciation process, only a part (about 40%) of the Earth’s surface is covered with ice during the coldest stage of the process. This leads to the conclusion that the end of glaciation is determined by additional processes established the thermal state of the Earth, rather the process of the Earth’s glaciation. Finally, the abrupt nature of the Earth’s heating can only be explained by a change in the parameters that determine the Earth’s thermal balance. The only such parameter is the albedo of the Earth, which allows one to associate a change of the Earth’s albedo as a result of the Earth’s volcanic activity with the glacial cycle.
We note that the connection of volcanic activity with the covering of the Earth’s surface with water or ice is the only suitable explanation of measurements. Thus, the observed character of a quasi-periodical change in the Earth’s temperature during the glacial cycle shows that the volcanic activity of the Earth depends on the covering of its surface with water or ice. In other words, careful measurements of the evolution of the Earth’s temperature in past within the framework of the EPICA project suggest a connection between the phase state of water on the Earth’s surface and volcanic activity.
Some confirmation of this follows from the data of the project EPICA itself, relating to the amount of dust in glaciers, depending on the time of its precipitation. The dependence of this value on time is quasi-periodic, as is the temperature of the Earth. In any case, the results of the project provide a direction for further research in order to better understand the evolution of the Earth’s thermal state in the past and the processes which are responsible for this. In particular, in the first place, the correlation must be established between the temperature change in the course of glaciation cycle and volcanic eruptions.
Funding
This research received no external funding.
Institutional Review Board Statement
Not applicable.
Informed Consent Statement
Not applicable.
Conflicts of Interest
The author declare no conflict of interest.
References
- Zubakov, V.A.; Borzenkova, I.I. Global Palaeoclimate of the Late Cenozoic; Elsevier: Amsterdam, The Netherlands, 1990. [Google Scholar]
- Benton, M.; Harper, D.A.T. Introduction to Paleontology and the Fossil Record; Wiley-Blackwell: Chichester, UK, 2009. [Google Scholar]
- Cronin, T.M. Paleoclimates: Understanding Climate Change Past and Present; Columbia University Press: New York, NY, USA, 2010. [Google Scholar]
- Bender, M.L. Paleoclimate; Princeton University Press: Princeton, NJ, USA, 2013. [Google Scholar]
- Petit, J.R.; Jouzel, J.; Raynaud, D.; Barkov, N.I.; Barnola, J.M.; Basile, I.; Bender, M.; Chappellaz, J.; Davis, M.; Delaygue, G.; et al. Climate and atmospheric history of the past 420,000 years from the Vostok ice core, Antarctica. Nature 1999, 399, 429. [Google Scholar] [CrossRef] [Green Version]
- Raynaud, D.; Barnola, J.M.; Souchez, R.; Lorrain, R.; Petit, J.R.; Duval, P.; Lipenkov, V.Y. The record for marine isotopic stage 11. Nature 2005, 436, 39. [Google Scholar] [CrossRef] [PubMed]
- Available online: https://www.co2.earth/21-co2-past (accessed on 27 September 2022).
- Augustin, L.; Barbante, C.; Barnes, P.R.; Barnola, J.M.; Bigler, M.; Castellano, E.; Cattani, O.; Chappellaz, J.; Dahl-Jensen, D.; Delmonte, B.; et al. Eight glacial cycles from an Antarctic ice core. Nature 2004, 429, 623–628. [Google Scholar] [PubMed] [Green Version]
- Jouzel, J.; Masson-Delmotte, V.; Cattani, O.; Dreyfus, G.; Falourd, S.; Hoffmann, G.; Minster, B.; Nouet, J.; Barnola, J.M. Orbital and Millennial Antarctic Climate Variability over the Past 800,000 Years. Science 2007, 317, 793. [Google Scholar] [CrossRef] [PubMed] [Green Version]
- Lüthi, D.; Le Floch, M.; Bereiter, B.; Blunier, T.; Barnola, J.M.; Siegenthaler, U.; Raynaud, D.; Jouzel, J.; Fischer, H.; Kawamura, K.; et al. High-resolution carbon dioxide concentration record 650,000–800,000 years before present. Nature 2008, 453, 379. [Google Scholar] [CrossRef] [PubMed] [Green Version]
- Watanabe, O.; Jouzel, J.; Johnsen, S.; Parrenin, F.; Shoji, H.; Yoshida, N. Homogeneous climate variability across East Antarctica over the past three glacial cycles. Nature 2003, 422, 509. [Google Scholar] [CrossRef] [PubMed]
- Faure, G.; Mensing, D. Isotopes—Principles and Applications; Wiley: Hoboken, NJ, USA, 2005. [Google Scholar]
- Hönisch, B.; Hemming, N.G.; Archer, D.; Siddall, M.; McManus, J.F. Atmospheric Carbon Dioxide Concentration across the Mid-Pleistocene Transition. Science 2009, 324, 1551. [Google Scholar] [CrossRef] [PubMed]
- Available online: http://unfccc.int/resource/docs/2015/cop21 (accessed on 27 September 2022).
- U.S. Standard Atmosphere; U.S. Government Printing Office: Washington, DC, USA, 1976.
- PALAEOSENS Project Members. Making sense of palaeoclimate sensitivity Palaeosens. Nature 2012, 491, 683. [Google Scholar] [CrossRef] [PubMed] [Green Version]
- Smirnov, B.M. Transport of Infrared Atmospheric Radiation; De Gruyter: Berlin, Germany, 2020. [Google Scholar]
- Henschel, W. Observations Tending to Investigate the Nature of the Sun, in Order to Find the Causes or Symptoms of Its Variable Emission of Light and Heat; With Remarks on the Use That May Possibly Be Drawn from Solar Observations. Philos. Trans. R. Soc. 1801, 91, 265–318. [Google Scholar]
- Smith, A. An Inquiry into the Nature and Causes of the Wealth of Nations, 1st ed.; Liberty Fund: London, UK, 1776. [Google Scholar]
- Shapiro, A.I.; Schmutz, W.; Rozanov, E.; Schoell, M.; Haberreiter, M.; Shapiro, A.V.; Nyeki, S. A new approach to the long-term reconstruction of the solar irradiance leads to large historical solar forcing. Astron. Astrophys. 2011, 529, A67. [Google Scholar] [CrossRef] [Green Version]
- Dorman, L.I. Cosmic rays and space weather: Effects on global climate change. Ann. Geophys. 2012, 30, 9. [Google Scholar] [CrossRef]
- Dudok de Wit, T.; Kopp, G.; Fröhlich, C.; Schöll, M. Methodology to create a new total solar irradiance record: Making a composite out of multiple data records. Geophys. Res. Lett. 2017, 44, 1196. [Google Scholar] [CrossRef] [Green Version]
- Available online: https://www.google.ru/search?q=Greg’s+TSI+reconstruction+Dudok+de+Wit+2017+Solar+Irradiance (accessed on 27 September 2022).
- Available online: https://en.wikipedia.org/wiki/Earth (accessed on 27 September 2022).
- Milankovich, M. Theorie Mathematique des Phenomenes Thermiques Produits par la Radiation Solaire; Gauthier-Villars: Paris, France, 1920. [Google Scholar]
- Milankovich, M. Canon of Insolation and the Ice Age Problem; Royal Serbian Academy of Sciences: Belgrade, Serbia, 1941. [Google Scholar]
- Available online: https://en.wikipedia.org/wiki/Solar-irradiance/media/File:Milankovitch (accessed on 27 September 2022).
- Available online: https://en.wikipedia.org/wiki/Jupiter (accessed on 27 September 2022).
- Available online: https://en.wikipedia.org/wiki/Moon (accessed on 27 September 2022).
- Smirnov, B.M. Global Energetics of the Atmosphere; Springer Atmospheric Series; Springer: Cham, Switzerland, 2021. [Google Scholar]
- Pollak, H.N.; Hurter, S.; Johnson, J.R. Heat flow from the Earth’s interior: Analysis of the global data set. Rev. Geophys. 1993, 31, 267. [Google Scholar] [CrossRef]
- Available online: https://en.wikipedia.org/wiki/Earth-internal-heat-budget (accessed on 27 September 2022).
- Available online: https://wiki2.org/en/Earth’s-internal-heat-budget (accessed on 27 September 2022).
- Turcotte, D.L.; Schubert, G. Geodynamics; Cambridge University Press: Cambridge, UK, 2002. [Google Scholar]
- Davies, J.H.; Davies, D.R. Earth’s surface heat flux. Solid Earth 2010, 1, 5. [Google Scholar] [CrossRef] [Green Version]
- Allan, R.P.; Liu, C.; Loeb, N.G.; Palmer, M.D.; Roberts, M.; Smith, D.; Vidale, P.L. Changes in global net radiative imbalance 1985–2012. Geophys. Res. Lett. 2014, 41, 5588. [Google Scholar] [CrossRef] [PubMed]
- Smirnov, B.M. Global Atmospheric Phenomena Involving Water; Springer Atmospheric Series; Springer: Cham, Switzerland, 2020. [Google Scholar]
- Smirnov, B.M.; Zhilyaev, D.A. Greenhouse effect in the standard atmosphere. Foundations 2021, 1, 184–199. [Google Scholar] [CrossRef]
- Available online: https://earthobservatory.nasa.gov/images/84499/measuring-earths-albedo (accessed on 27 September 2022).
- Available online: https://en.wikipedia.org/wiki/Albedo (accessed on 27 September 2022).
- Delmonte, B.; Basile-Doelsch, I.; Petit, J.R.; Maggi, V.; Revel-Rolland, M.; Michard, A.; Jagoutz, E.; Grousset, F. Comparing the EPICA and Vostok dustrecords during the last 220,000 years: Stratigraphical correlation andprovenance in glacial periods. Earth Sci. Rev. 2004, 66, 63. [Google Scholar] [CrossRef]
- Delmonte, B.; Petit, J.R.; Andersen, K.K.; Basile-Doelsch, I.; Maggi, V.; Ya Lipenkov, V. Dust size evidence for opposite regional atmospheric circulation changes over East Antarctica during the last climatic transition. Clim. Dyn. 2004, 23, 427. [Google Scholar] [CrossRef]
- Lambert, F.; Delmonte, B.; Petit, J.R.; Bigler, M.; Kaufmann, P.R.; Hutterli, M.A.; Stocker, T.F.; Ruth, U.; Steffensen, J.P.; Maggi, V. Dust-climate couplings over the past 800,000 years from the EPICA Dome C ice core. Nature 2008, 452, 616. [Google Scholar] [CrossRef] [PubMed]
Figure 1.
Map of the Antarctica region [9]. The positions of the weather stations, where the ice samples studied subsequently were taken, are marked with stars.
Figure 1.
Map of the Antarctica region [9]. The positions of the weather stations, where the ice samples studied subsequently were taken, are marked with stars.

Figure 2.
Evolution of the atmospheric carbon dioxide concentration and Earth’s surface temperature in past near Antarctica, obtained by analyzing ice deposits in Antarctica near the weather station Dome C [8,9,10].

Figure 3.
Relative change in the concentration of the oxygen isotope in carbon dioxide molecules located in bubbles according to measurements in ice deposits near the Dom C weather station (solid line) and the Vostok weather station (dots) in past near Antarctica [8].
Figure 3.
Relative change in the concentration of the oxygen isotope in carbon dioxide molecules located in bubbles according to measurements in ice deposits near the Dom C weather station (solid line) and the Vostok weather station (dots) in past near Antarctica [8].

Figure 4.
Evolution of the radiation flux generated by the Sun and entered in the Earth’s atmosphere over the past centuries [22,23].

Figure 5.
Evolution of the solar radiation flux in the visible range of spectrum as a result of oscillations of the Earth’s orbit relative to the Sun. The time dependence for the flux of solar radiation entering the Earth’s atmosphere is presented in the case of each of oscillation types for the Earth’s orbit relative to the Sun within the framework of the Milankovich model [27].

Figure 6.
Energetic balance of the Earth and its atmosphere in the form of average energy fluxes expressed in W/m for indicated channels [30]. The absorbed energy fluxes are given inside the corresponding rectangles. The values of the energy fluxes themselves are given near the arrows.
Figure 6.
Energetic balance of the Earth and its atmosphere in the form of average energy fluxes expressed in W/m for indicated channels [30]. The absorbed energy fluxes are given inside the corresponding rectangles. The values of the energy fluxes themselves are given near the arrows.

Figure 7.
Energetic balance of the Earth and atmosphere for the cold period of the glacial cycle. The presented average energy fluxes are expressed in W/m for these processes. Absorbed energy fluxes are given inside the corresponding rectangles, and the values of energy fluxes themselves are given near the arrows.

Figure 8.
The relative mass of dust in ice deposits near the weather station Dome C [8]. The value of mg/kg means the mass of dust of 1 mg per 1 kg of ice.
Figure 8.
The relative mass of dust in ice deposits near the weather station Dome C [8]. The value of mg/kg means the mass of dust of 1 mg per 1 kg of ice.

Publisher’s Note: MDPI stays neutral with regard to jurisdictional claims in published maps and institutional affiliations. |
© 2022 by the author. Licensee MDPI, Basel, Switzerland. This article is an open access article distributed under the terms and conditions of the Creative Commons Attribution (CC BY) license (https://creativecommons.org/licenses/by/4.0/).
Share and Cite
MDPI and ACS Style
Smirnov, B.M. Physics of the Earth’s Glacial Cycle. Foundations 2022, 2, 1114-1128. https://doi.org/10.3390/foundations2040073
AMA Style
Smirnov BM. Physics of the Earth’s Glacial Cycle. Foundations. 2022; 2(4):1114-1128. https://doi.org/10.3390/foundations2040073
Chicago/Turabian StyleSmirnov, Boris M. 2022. "Physics of the Earth’s Glacial Cycle" Foundations 2, no. 4: 1114-1128. https://doi.org/10.3390/foundations2040073