Article

Elemental Laser-Plasma Analysis of Pointed Gourd Leaves for Diabetes Management

1
Laser Spectroscopy Laboratory, Department of Physics, University of Allahabad, Prayagraj 211 002, India
2
Alternative Therapeutics Unit, Drug Development Division, Medicinal Research Laboratory, Department of Chemistry, University of Allahabad, Prayagraj 211 002, India
3
Department of Earth and Planetary Sciences, University of Allahabad, Prayagraj 211 002, India
4
Department of Physics, Chowdhary Mahadev Prasad Degree College, Prayagraj 211 002, India
5
Physics and Astronomy Department, University of Tennessee, University of Tennessee Space Institute, Center for Laser Applications, 411 B.H. Goethert Parkway, Tullahoma, TN 37388-9700, USA
6
Department of Chemistry, Swami Shraddhanand College, University of Delhi, Alipur, New Delhi 110 036, India
*
Author to whom correspondence should be addressed.
Foundations 2022, 2(4), 981-998; https://doi.org/10.3390/foundations2040066
Submission received: 22 September 2022 / Revised: 14 October 2022 / Accepted: 20 October 2022 / Published: 26 October 2022
(This article belongs to the Special Issue Advances in Fundamental Physics II)

Abstract

:
This interdisciplinary work communicates the identification and quantification of elements responsible for the bioactive potency of leaves from pointed gourd, trichosanthes dioica, using laser-induced breakdown spectroscopy (LIBS). Calibration-free LIBS determines the presence of various trace and major elements, their concentrations, and ratios in which they are present in the leaves. The presence of specific elemental ratios of magnesium/sodium and magnesium/potassium could be promising for managing diabetes mellitus. Variable doses of aqueous extract from trichosanthes dioica leaves are administered for determination of the most effective one. Based on encouraging results, the extract could be harvested to serve as anti-diabetic medication for diabetes and associated symptoms.

1. Introduction

Natural remedies offer alternative or complementary treatments for various diseases and are usually considered to be safe. For specific diseases that require lifelong pharmaceutical medication, therapeutic safety is important. For example, diabetes mellitus can be a lifelong disease and is globally of serious concern due to its complications. Several medicinal plants have been studied and scientifically proven to be beneficial for the treatment of diabetes mellitus [1,2,3,4]. Plant-based natural medicines are safe and cost-effective. In fact, in addition to bioactive phytochemicals, medicinal plants do have bioactive elements in appropriate ratios, and thus, they are helpful in maintaining a balance of trace elements in disturbed metabolic processes diabetic mellitus [5]. However, medicinal plants need to be scientifically explored for assessment of efficacy and safety. In addition to phytochemical analysis, the detection of phyto-elemental composition and elemental ratios of medicinal plants is expected to play a pivotal role in evaluation of probable medicinal activity [6,7,8,9,10,11,12,13,14,15,16,17,18,19].
Recently, laser-induced breakdown spectroscopy (LIBS) has emerged as a promising analytical spectroscopy for the elemental analysis of samples of interest [20,21,22,23,24,25,26,27,28]. Although other conventional analytical spectroscopic techniques such as inductively-coupled plasma mass spectroscopy (ICP-MS), X-ray photoelectron spectroscopy (XPS) [29], atomic absorption spectroscopy (AAS), inductively-coupled plasma optical emission spectrometry (ICP-OES), and flame atomic absorption apectroscopy (FAAS) are available for elemental analysis, LIBS shows several advantages. Particularly, LIBS can be rapid, shows minimal environmental loads, requires minimal efforts in sample preparation, and provides in situ real-time analysis of the sample in solid, liquid, or gas phases [30]. Furthermore, LIBS is capable of simultaneous multi-elements detection and evaluation of their concentration and intensity ratios, which help for establishing a correlation of a particular bioactivity of any part of a plant with their specific elemental composition.
The current study addresses the generation of the bio-active profile of leaves of thrichosantes dioica from the evaluation of elemental ratios with laser-plasma spectroscopy and the interpretation of the results in view of the anti-diabetic potency for in vivo models. Trichosanthes dioica, or t. dioica, is a vegetable of the cucurbitaceae family. It is widely grown throughout India and to a lesser extent in other parts of South Asia [31]. It is also known as ’Parwal’ in Hindi, or colloquially, the pointed gourd is called a green potato. In addition to the fruit, its leaves are also used as a vegetable. Leaves of t. dioica of weight 100 g contain 9.0 mg of magnesium, 2.6 mg of sodium, 83.0 mg of potassium, 1.1 mg of copper, and 17.0 mg of sulfur [32]. Its pointed gourd leaves and delicate shoots are applied in traditional medicinal therapy. The literature reveals that the effect of feeding shade-dried leaves to animals impacts their blood glucose level and lipid profile [33,34]. The plant seeds are commonly used to treat acid reflux symptoms and display antifungal and antibacterial activities [35]. The present study was conducted to evaluate the glycemic potency of aqueous extract of t. dioica leaves on blood glucose levels (BGLs) of normal and streptozotocin-induced subdiabetic, mildly diabetic and severely diabetic models. For a complete biomedical profile of the aqueous extract of t. dioica leaves, several other parameters were monitored, including TC, HDL, LDL, VLDL, TG, AST, ALT, ALKP, and CRTN. Based on the parameter ranges, and especially the LFT (liver function test) and KFT (kidney function test), one can infer that t. dioica leaves should be developed as a promising anti-diabetic agent for the management of diabetes type II and associated complications.
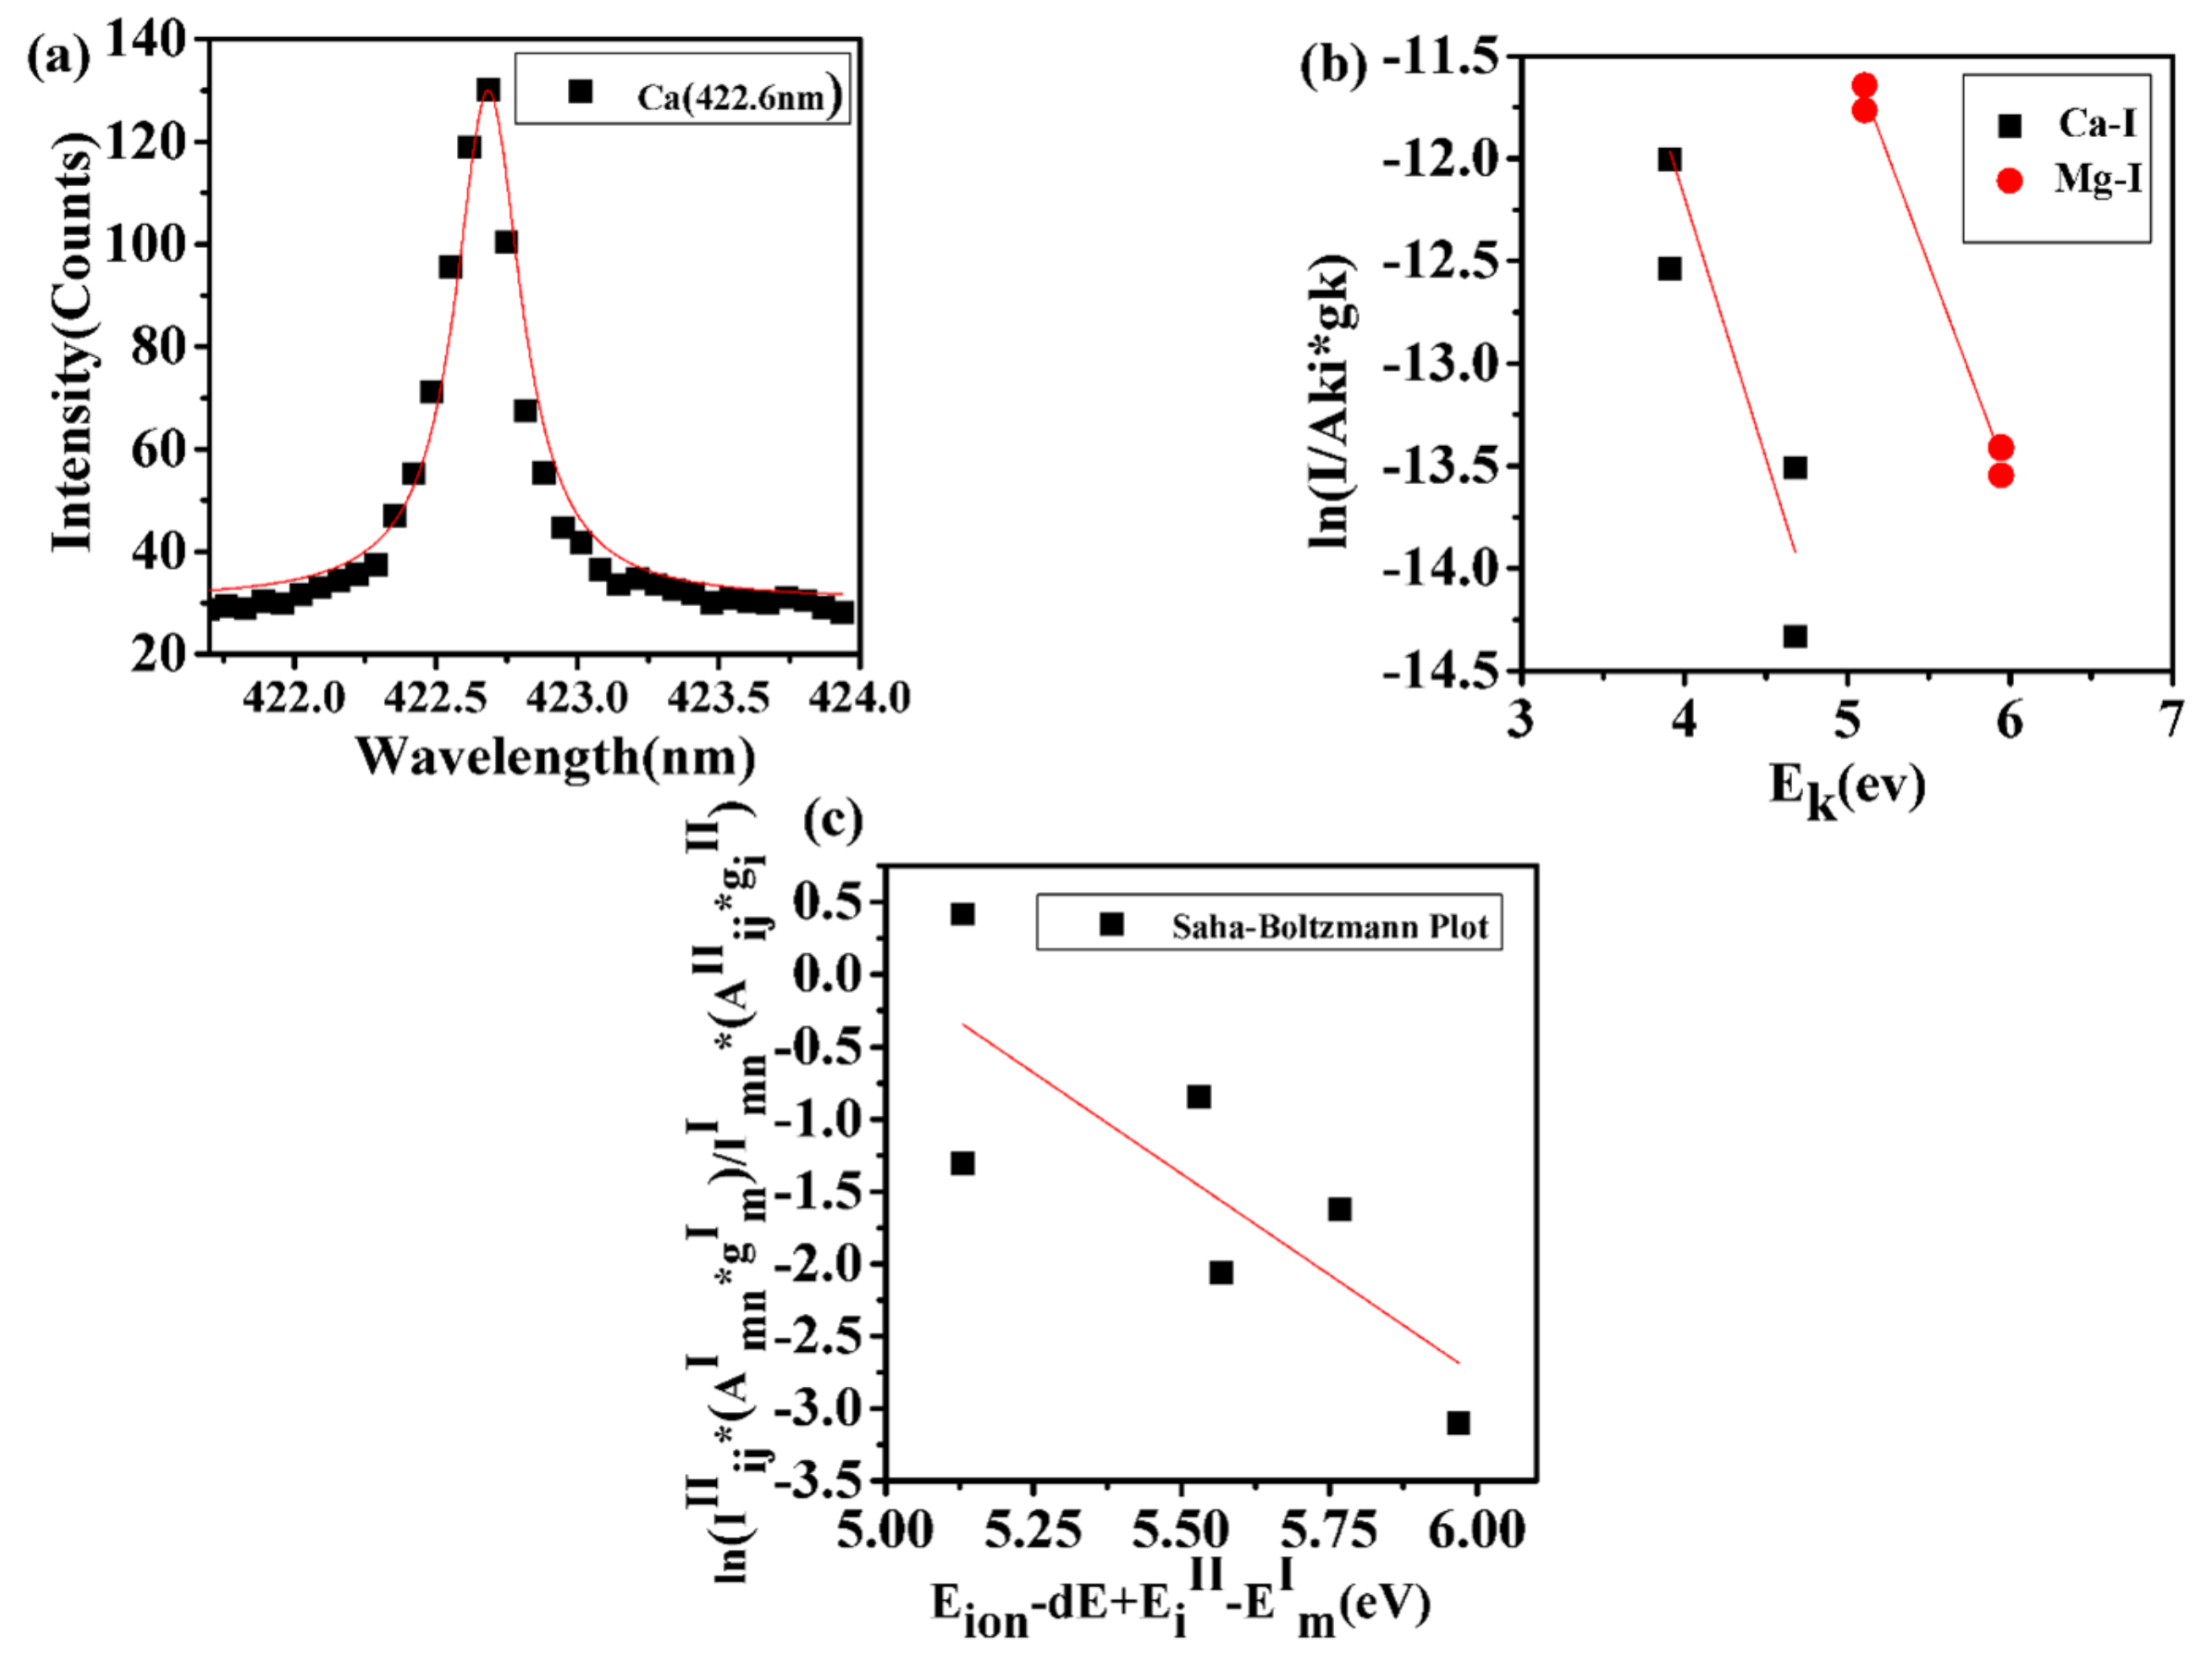
The present study includes the LIBS-based detection of the elemental composition of t. dioica leaves. A calibration-free LIBS, or CF-LIBS, algorithm was applied for the recorded LIBS spectra of t. diocia leaves to determine their elemental ratios of Na/K, Mg/Na, and Mg/K. The anti-diabetic behavior of T. diocia leaves has been correlated with these elemental ratios. The same intensity ratios of the elements Na, K and Mg were observed in LIBS spectra as for ayurvedic medicines prescribed for the treatment of diabetes mellitus. The anti-diabetic effect of t. diocia leaves extract was reconfirmed by conducting in vivo studies on normal, subdiabetic, mildly diabetic and severely diabetic models. Variable doses of the extract were given orally, and the impact on the BGL of selected animals is investigated in this work. The novelty/innovative aspects of this research work include (i) the herbal medicine, t. diocia leaves, contains specific a elemental ratio of sodium, Na, potassium, K, and magnesium, Mg, that is desirable for diabetes type II management, and (ii) the in vivo study on rats and biochemical analysis yield effective results for the management of diabetes type II.

2. Materials and Methods

2.1. Experimental Arrangement for LIBS Instrumentation

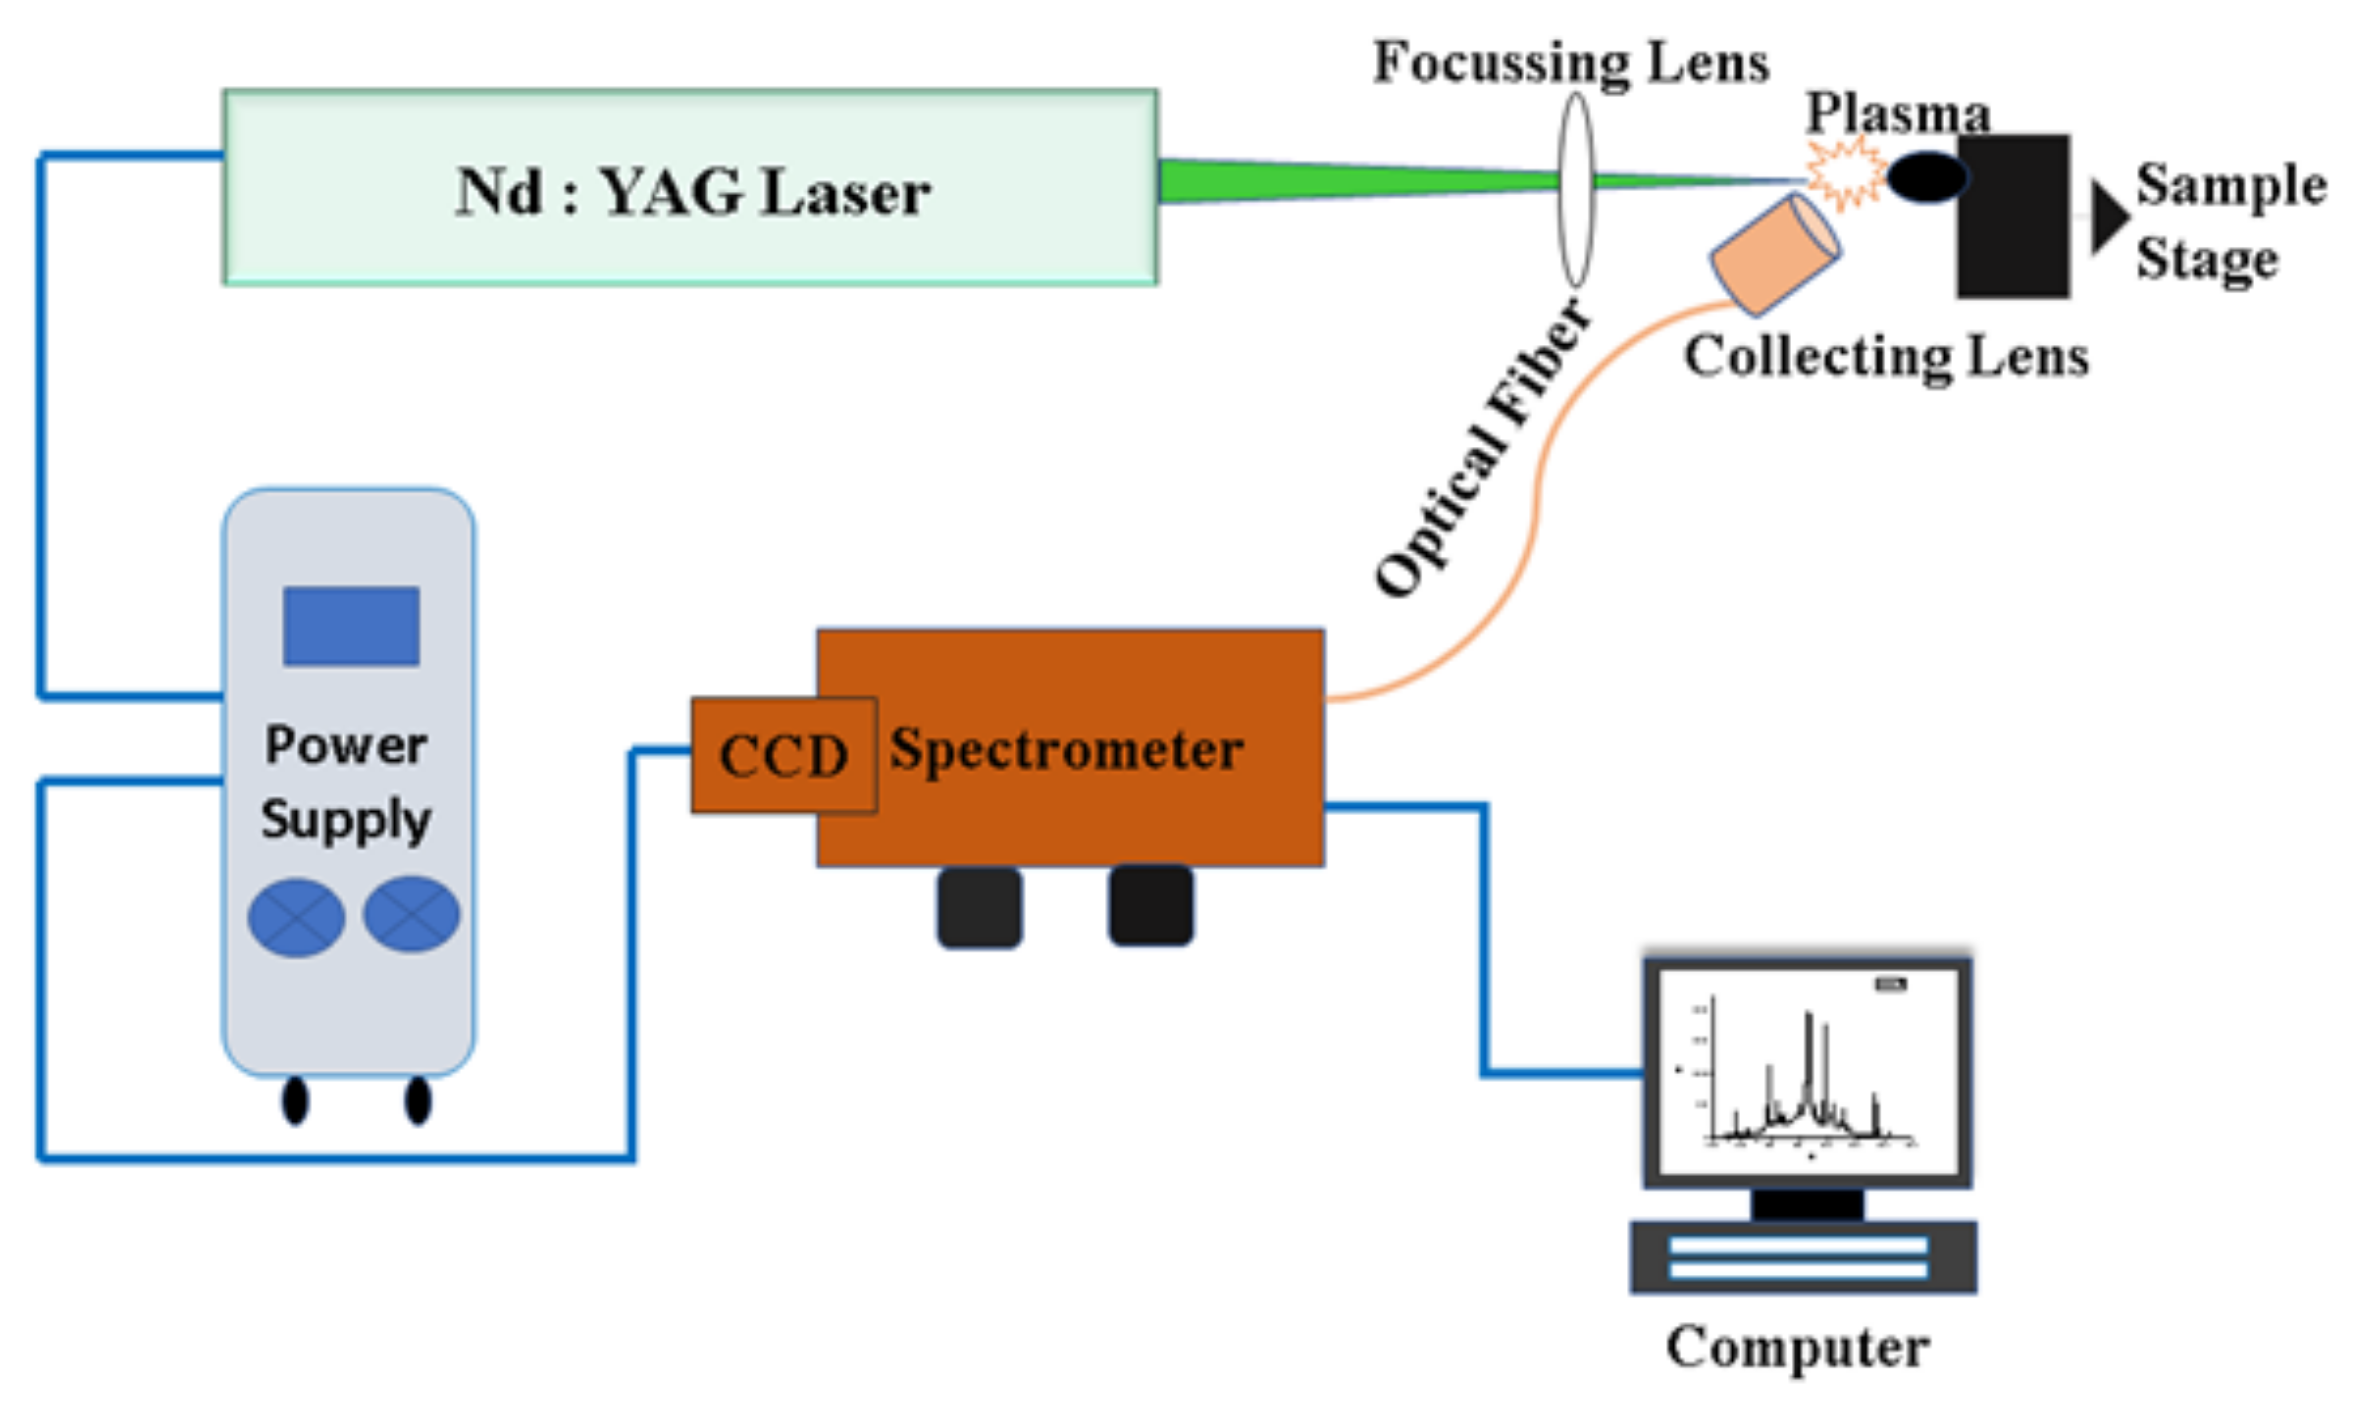
Figure 1 illustrates the design of LIBS experiments. The Nd:YAG laser device (Continuum Surelite III-10, San Jose, CA, USA) is operated at a repetition rate of 10 Hz, delivering pulses of full-width-half-maximum 4 ns and maximum laser energy up to 425 mJ at the second harmonic wavelength of 532 nm. The laser beam is focused onto the sample with a 30 cm focal length lens to achieve an irradiance of the order of 1 TW/cm2. The light emitted from the plasma was collected by a small lens on the tip of the optical fiber that is connected to the entrance slit of an echelle-grating spectrometer equipped with a charge-coupled device (CCD). The lens at the tip of the fiber is positioned 1 cm distance from the laser–plasma. To avoid craters formed by an individual laser–sample interaction, the sample is mounted on a translational stage and moved so that a fresh sample surface is available for each laser–plasma generation.

2.2. Sample Preparation

Fresh leaves of t. dioica in the amount of 5 kg were purchased at a local market in Allahabad, India, and were subsequently verified by Prof. Satya Narayan, Taxonomist, Department of Botany, University of Allahabad. A voucher specimen (Allahabad University 321) was also submitted. Leaves were washed, chopped, shade dried, and then crushed into powder. The Soxhlet technique [36] was employed with distilled water for 36 h for the extraction of dried powder at 100 °C. The aqueous extract was filtered and concentrated in a rotatory evaporator at a temperature of 35 °C under reduced pressure to produce semi-solid material, which was subsequently lyophilized to obtain the powder with a 25.1% weight-to-weight yield.

2.3. Animals for the Study

Healthy male albino, Wistar rats at an age range of 6 to 8 weeks and at a weight in the range of 0.15 to 0.2 kg served as the subjects in the experiments. Animals were obtained from the Luknow, India, Central Drug Research Institute. The rats were housed in standard ambient conditions, namely, 25 °C temperature, 50% humidity, 12 h of darkness and light per day, and with free access to water and standard laboratory diet composed of carbohydrates: 30%, proteins: 22%, lipids: 12%, and vitamins: 3%). The study was approved by the Allahabad University Institutional Ethical Committee, 83a/a/04/CPCSEA—Committee for the Purpose of Control and Supervision of Experiments on Animals. Prior to the animal work, in vitro studies have been performed: only enzymatic studies were carried out on certain enzymes that are involved in the carbohydrate metabolism. The administration of variable doses to each group of animals was based on our previous studies of t. dioica fruit extract.

2.4. Induction of Diabetes

In a group of overnight fasted rats, a single intra-peritoneal injection of freshly produced streptozotocin (bought from Sigma Aldrich Chemical Company, St. Louis, MO, USA) at a dose of 55 mg per kg body weight was given to induce diabetes [37]. The FBG level was checked after 3 days, and the PPG was continuously monitored up to stable hyperglycemia, which occurred a week later. Animals with significant hyperglycemia (FBG > 250 mg/dL) were selected for the study.

2.5. Blood Glucose Level Measurements

Standard kits from Bayer Diagnostics India, Limited were used to estimate blood glucose level (BGL) based on the glucose oxidase method [38] and serum levels of TC (total cholesterol), TG (triglycerides), and HDL (high-density lipoprotein) spectrophotometrically in accordance with the manufacturer’s instructions based on enzymatic studies [39,40]. However, Friedwald’s formula, VLDL = TG/5, was used to determine the amount of VLDL (very low-density lipoprotein), and similarly, another Friedwald’s formula, LDL = TC − VLDL + HDL, was used to determine the amount of LDL (low-density lipoprotein) [41]. Serum levels of LFT (liver function tests) [42] viz. AST (aspartate transferase), ALT (alanine transferase), ALKP (alkaline phosphatase) [43] and KFT (kidney function tests) viz. CRTN (creatinine) [44] and TPR (total protein) [45] were also estimated using standard kits from Bayer Diagnostics India Limited. Total Hb (total hemoglobin) was also measured before and after the therapy [46]. Reagent-based Uristix from Bayer Diagnostics was used to identify US (urine sugar). All parameters were assessed regularly throughout the long-term treatment.

2.6. Experimental Design

FBG and GTT experiments were performed with variable doses of aqueous extract of leaves in normal, subdiabetic, and mild diabetic rats to assess hypoglycemic and anti-diabetic effects. The most effective dose identified was used for the long-term treatment of severely diabetic rats to assess the hypo-lipidemic-, hepato-protective-, and renal-protective efficacies of the extract.

2.6.1. Assessment of Hypoglycemic Activity in Normal Healthy Rats

Five groups of six rats each were employed in the experiments. Animals in groups II, III, IV, and V received variable doses of aqueous extract viz. 500, 750, 1000, and 1250 mg/kg bw, respectively. In contrast, group I served as the control group and received vehicle distilled water only. After administering the extract, blood samples were taken from the tail vein after 1.5, 3, 4.5, and 6 h.

2.6.2. Assessment of Hypoglycemic Activity with the Glucose Tolerance Test in Normal Healthy Rats

A different group of healthy, normal animals received the aqueous extract orally in the same manner as above, and the effects on FBG were observed hourly for up to two hours. The BGL value at 2 h was treated as ‘0’ h value for the Glucose Tolerance Test (GTT). The animals were then orally administrated with 4 g/kg of glucose, and their glucose tolerance was studied at a 1 h interval for another 3 h. Thus, the total time for collecting the blood was up to 5 h.

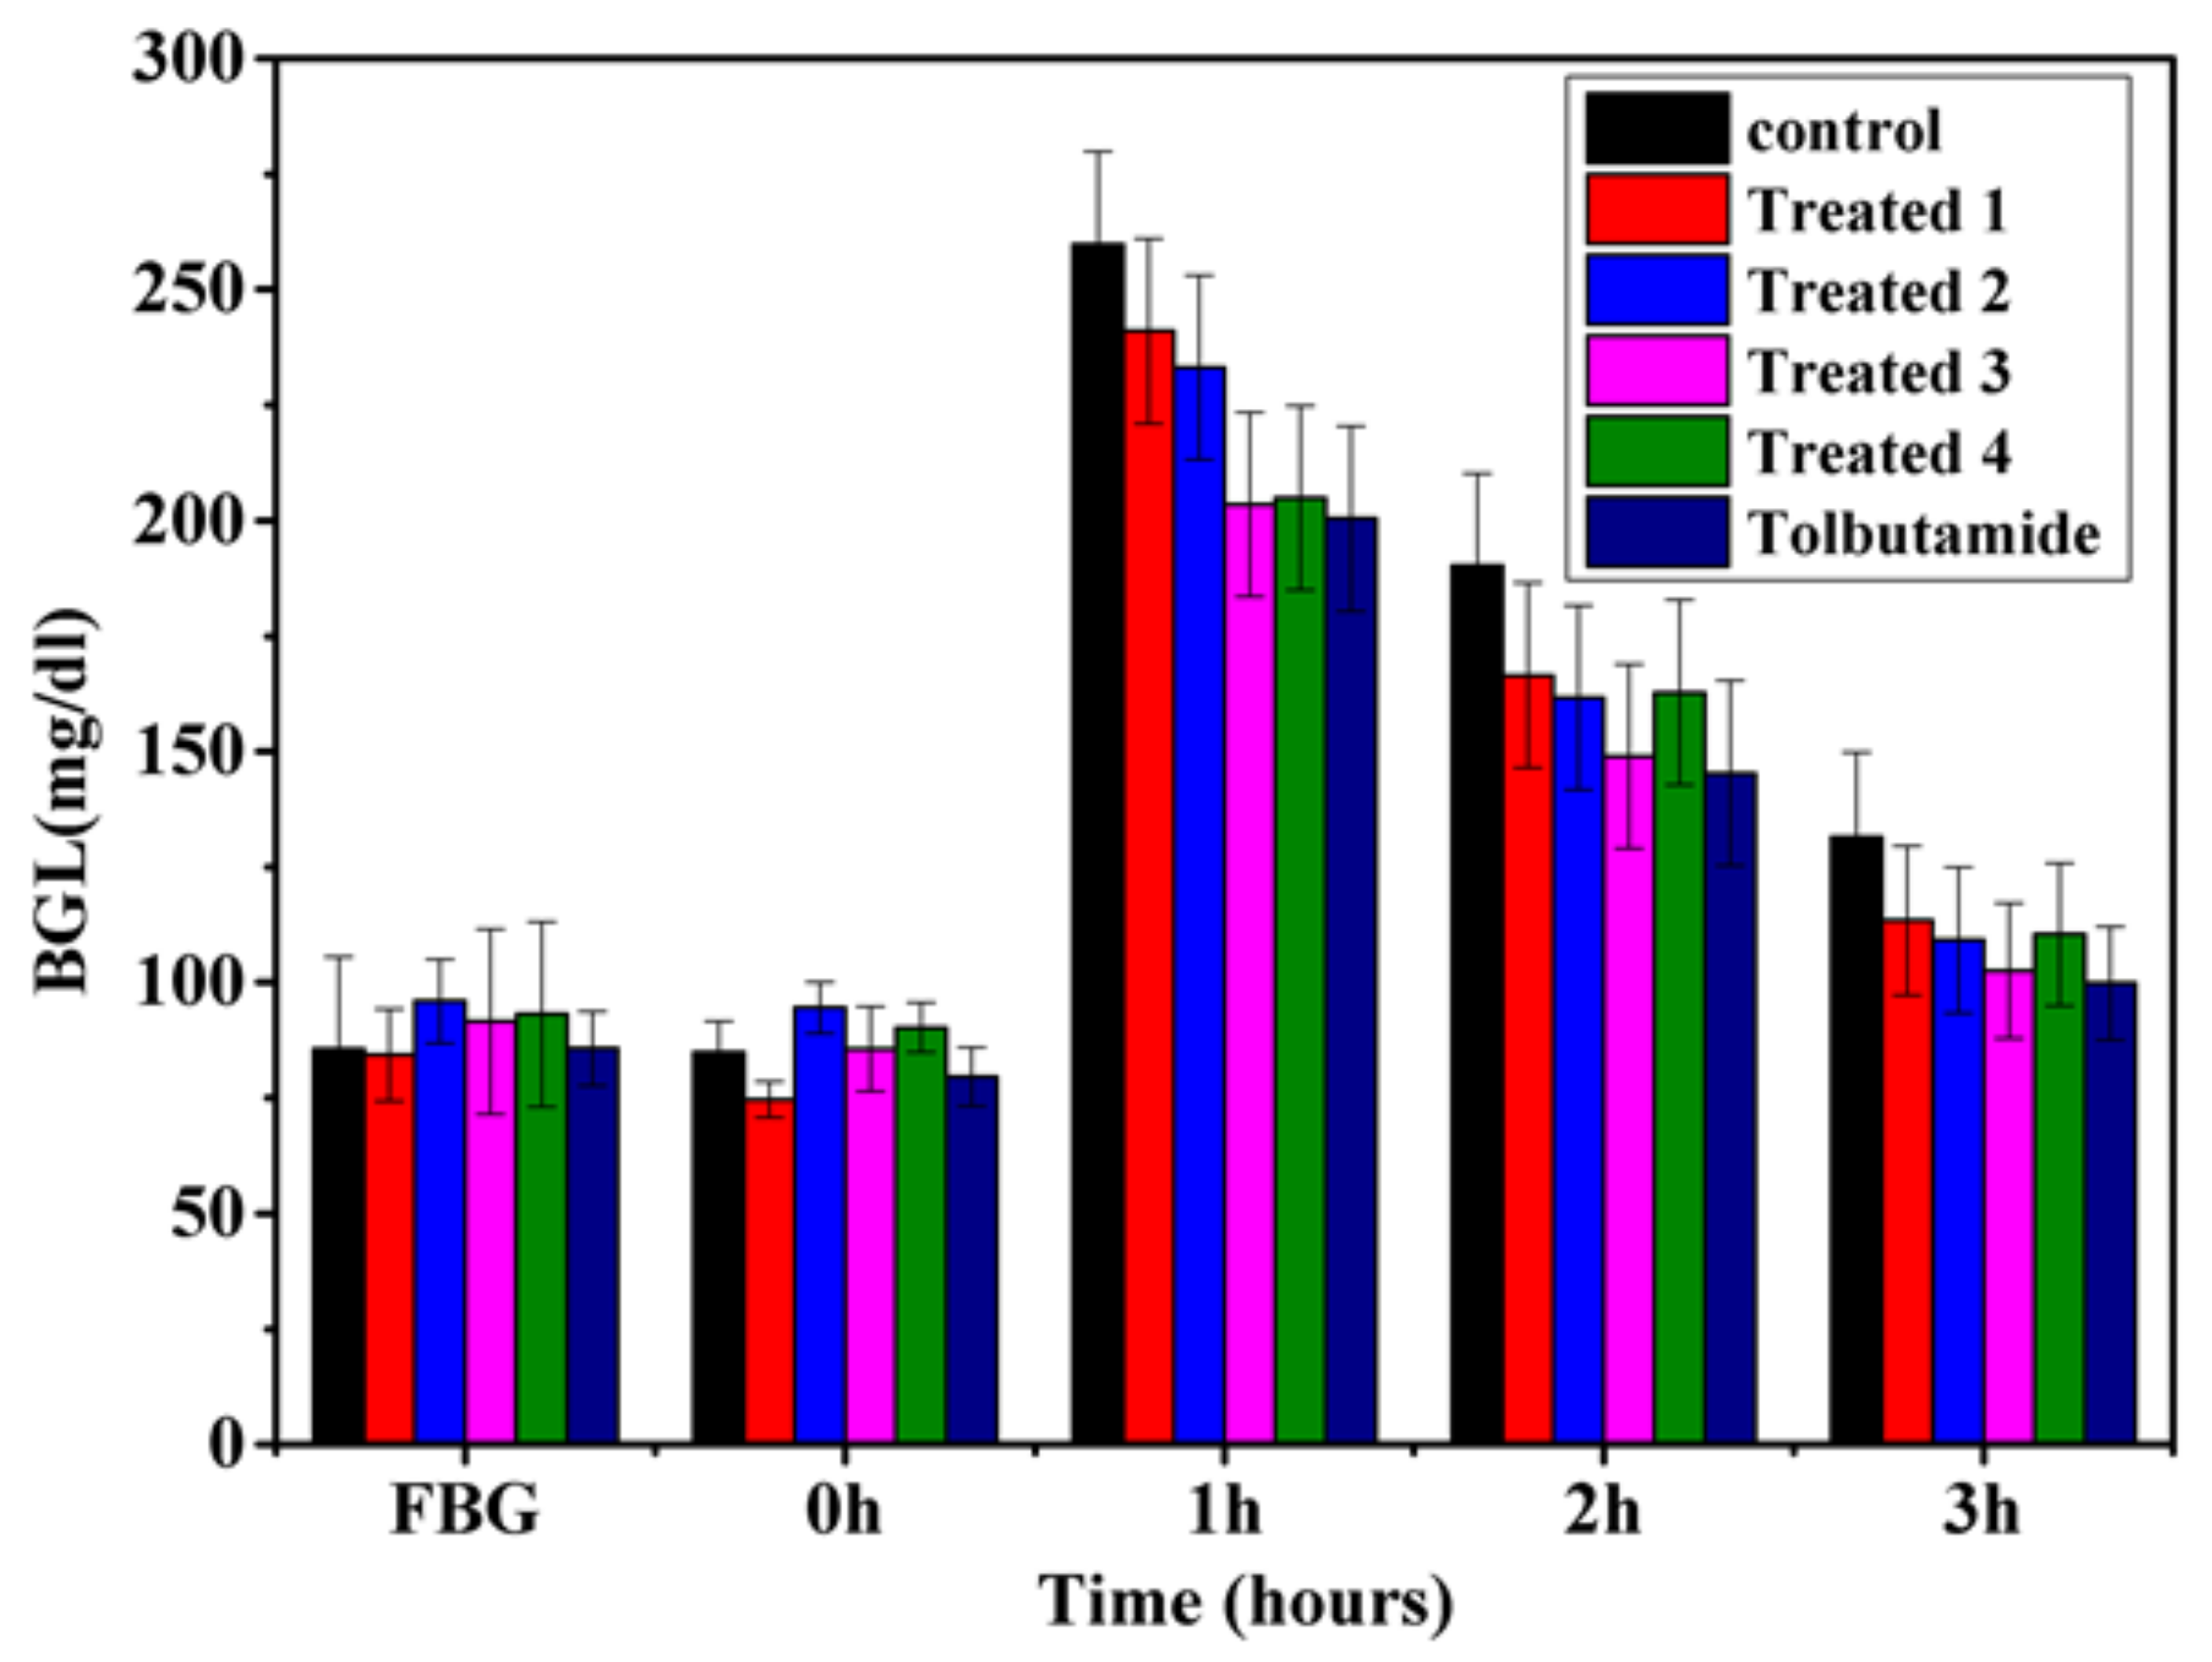
2.6.3. Assessment of Anti-Diabetic Activity with the Glucose Tolerance Test in Sub- and Mild-Diabetic Rats

The improvement of glucose tolerance in subdiabetic and mildly diabetic rats was another way to measure the anti-diabetic impact of the aqueous extract of t. dioica leaves. The rats were divided in to six groups. Group I served as the control and received the vehicle (distilled water) only, whereas groups II, III, IV, and V received variable doses of the leaf extract—500, 750, 1000, and 1250 mg/kg bw, respectively. Blood glucose levels were checked firstly after 90 min of treatment, which was considered as the ‘0’ h value, and then, 2 g/kg glucose was given orally to all the groups. Blood glucose levels were further checked up to three hours at regular intervals of 1 h each, which were considered as 1 h, 2 h, and 3 h values. The results were compared with the group IV rats, which were treated with 250 mg/kg of tolbutamide (hypoglycemic agent).

2.6.4. Assessment of Anti-Diabetic Activity in Severely Diabetic Rats

For normal, subdiabetic and mild diabetic models, the most effective dose was determined to be 1000 mg/kg. A number of biochemical parameters related to antidiabetic attribute viz. FBG, PPG, Lipid profiles, Total Protein, Haemoglobin and Enzymatic assays were taken into consideration for obtaining a complete biomedical profile of aqeous extract of t. dioica leaves. Two groups of 6 rats each were used in the experiment. Group I served as the control group, whereas group II was treated daily with a single oral administration of the above-mentioned dose. Body weight and urine sugar were also estimated weekly along with other biochemical parameters up to 30 days.

2.6.5. Lethal Dose 50 Experiment

The lethal dose 50, LD50, experiment was designed to assess the extract’s toxicity. Two variable doses of 10 g and 15 g of the aqueous extract of t. dioica leaves were given once, orally to two different groups of rats of both sexes, weighing between 180 and 200 g. Afterwards, rats were continuously monitored for gross behavioral, neurologic, autonomic, and toxic consequences. Food intake, face, and urine were also analyzed every two hours for the first six hours during a period of 24 h.

2.7. Statistical Analysis

The one-way analysis of variance, ANOVA, was utilized in the statistical analysis of the data. The Statistical Package for the Social Sciences, SPSS, version 7.5 assessed the post hoc Scheffe test. When the p values were less than 0.05, p < 0.05, results were deemed significant.

3. Results

3.1. LIBS Experiment

In the present experiment, quantitative LIBS analysis evaluated the elemental composition of the prepared samples of t. dioica leaves that were prepared as discussed in Section 2.2.

3.1.1. Determination of the Elemental Composition

For the evaluation of the elemental composition of t. dioica leaves, the recorded LIBS spectra illustrated in Figure 2 were analyzed. The wavelengths of spectral lines in the LIBS data were identified using the National Institute of Standards and Technology (NIST) atomic spectroscopic database [47]. The LIBS spectra reveal the presence of the spectral signature of a volley of elements in the t. dioica leaves. For analysis and discussion, the LIBS spectra of the sample are displayed in four different spectral regions. The spectra clearly reveal the presence of spectral elements including C, H, N, O, Na, K, Mg, Fe, Si, Sr, and Ca. Table 1 collates identified elements and their wavelengths.
The concentration of elements present in t. dioica leaves samples has been determined using calibration-free laser-induced breakdown spectroscopy (CF-LIBS) methods. It is difficult to locate research articles in the literature that address the quantitative analysis of the samples used in this manuscript. For further evaluation of the concentrations, the areas of the recorded spectral lines are investigated, and subsequently, the areas are correlated with the peak intensity of the recorded spectral lines. The correlation is in good agreement with CF-LIBS data; in other words, the concentrations are directly proportional to the peak intensities of the spectral lines. However, the focus of this work is on the application of CF-LIBS for analytical diagnosis in favor of other methods that are mentioned in the introduction.

3.1.2. Semi-Quantitative Analysis

It is important to determine the concentration of trace elements present in any dietary supplement for the evaluation of the ratios of their consumable amounts. Knowing dietary supplement ratios is helpful for maintaining a healthy balance and proper regulation of the physiological processes in the human body. Therefore, it is essential to evaluate the actual concentration and ratios of elements present in any medicine in order to correlate their specific bioactivity with specific elemental ratios. Kumari et al. evaluated the ratio of minerals helpful in diabetic management and concluded that in most ayurvedic anti-diabetic medicine, the ratio of Mg/Na and Mg/K are approximately the same [48]. The present work also confirms, as shown in Figure 3, that the ratios of spectral intensity of Mg/Na and Mg/K are the same in the t. dioica sample. The elements Ca, Fe, and Mg are present in carbohydrate metabolism and also play a vital role in the cellular uptake of the glucose molecule. A low Mg level could be risky for diabetes patients because of the Mg involvement in insulin activation. Potassium, K, activates beta cells of the pancreas and helps in the production of insulin in the human body. Thus, low potassium levels could be risky as well for developing diabetes due to persistent high blood glucose levels. Hence, the presence of elements such as Mg, K, and Na in the sample could be correlated well with the observed significant efficacy of t. dioica leaves in insulin-dependent diabetes mellitus (IDDM) [48,49].

3.1.3. Quantitative Analysis

The importance of various bio-elements in the medicinal activity of plants cannot be ignored, and thus, it becomes imperative to detect their presence, concentrations, and the ratios in which they are present in the t. dioica leaves sample. Hence, the anti-diabetic activity of t. dioica leaves could be correlated not only with the presence of Na, K, and Mg but also with the assessment of specific ratios of Mg/Na and Mg/K, which are just the same as in the earlier results of other anti-diabetic ayurvedic medicines [48]. For CF-LIBS, one utilizes recorded intensities of different spectral lines of the elements; however, the laser-induced plasma needs to fulfill three cconditions that must be verified: (i) plasma must be stoichiometric, (ii) plasma must be optically thin, and (iii) plasma must show local thermal equilibrium [50,51,52,53,54]. In the laser-plasma experiments, all three conditions are satisfied, as further discussed below.
The calibration curve method is applied in a traditional approach for the determination of concentrations of the constituents present in any materials. In this method, laser-induced breakdown spectra are recorded for each reference material with known element concentrations, viz. one measures the intensity of a spectral line present in each reference material. A graph is drawn for spectral intensities versus elemental concentrations in the reference materials. Calibration curves are established for each element of interest from reference material with known ingredient concentrations and the same matrix as the unknown target material. Usually, it is challenging to find a reference material with the same matrix as the material in which concentrations of the constituents are to be determined. In turn, the CF-LIBS method is well-established to determine each constituent’s concentration simultaneously without requiring reference materials. The results obtained by CF-LIBS are reliable with a typical uncertainty of less than 10% [55].

Stoichiometric Ablation

The ablation to be stoichiometric, the laser-ablated part of the sample which is converted into the plasma, must truly represent the composition of the sample. In this regard [50,51,52], laser irradiance greater than 1 GW/cm2 leads to stoichiometric ablation irrespective of the state of matter and yields a plasma truly representative of the sample’s elemental composition. In the experiments discussed in this work, the pellet of the sample is homogeneous. Laser irradiance can be calculated by determining the laser spot size diameter, D, on the sample surface,
D = 4 λ f / π d ,
where λ is the wavelength of the laser beam, f is the focal length of the lens, and d is the beam diameter of the laser beam. In the present experiment, laser energy per pulse, E = 15 mJ, λ = 532 nm, f = 30 cm, and d = 0.9 cm. Therefore, the laser spot size diameter on the sample’s surface amounts to D = 22.6 μm. Consequently, the fluence and the irradiance are 3.8 × 10 3 J/cm2 and 0.94 TW/cm2, respectively. Clearly, in the present experiment, the laser irradiance is greater than 1 GW/cm2 and fulfills the condition for stoichiometric ablation.

Optically Thin Plasma

For the validation of optically thin plasma, we have selected the pair of two interference-free lines of Ca II and Mg II having the same upper energy level and estimated the spectral intensity ratio followed by Lorentzian fitting. The theoretical intensity ratio has been estimated by using the other spectroscopic parameters in NIST data. Both the theoretical and experimental ratios have been listed in Table 2. We observed from the table that the experimental ratio (I1/I2) is approximately equal to the theoretical ratio A 1 g 1 λ 2 / A 2 g 2 λ 1 for the pair of spectral lines Ca-II (393.3/396.8) and MgII (279.5/280.2). It is clear from Table 2 that the intensity ratio (I1/I2) of two spectral lines is approximately equal to the ratio A 1 g 1 λ 2 / A 2 g 2 λ 1 . These results demonstrate that the laser-induced plasma in the present study is optically thin.

Local Thermodynamic Equilibrium

The necessary McWhirter criterion,
N e ( cm 3 ) > 1.6 × 10 12 T ( K ) 1 / 2 Δ E ( eV ) 3 ,
where N e is the electron density, T is the plasma temperature, and Δ E is the energy difference for the corresponding transition needs to be met for the laser–plasma to be considered in a state of local thermodynamic equilibrium (LTE) [51,52,53,54]. In this work, emission lines of Ca I and Mg I are selected for graphical display in form of a Boltzmann plot that utilizes emission intensity and the standard logarithm form,
I λ k i = C s F A k i g k e E k / ( k B T ) U s ( T ) ,
ln I λ k i A k i g k = E k k B T + ln C s U s ( T ) .
Here, k B is the Boltzmann constant, U s ( T ) is the partition function, C s is the concentration, and F is an experimental factor. The plasma temperature of each constituent in laser-produced plasma was determined by using the slope and intercept of the above equation. The average temperature of the plasma is found to be 10,570 K, as displayed in Figure 4. The sufficient condition for plasma to be considered in LTE requires that the ionization and excitation temperatures determined by the Saha–Boltzmann equation and by a Boltzmann plot, respectively, must be in agreement to within 15%. The Saha–Boltzmann equation [55],
ln I i j I I A m n I g m I I m n I A i j I I g i I I = E i o n d E + E i I I E m I k B T + ln 2 ( 2 π m e k B T ) 3 / 2 N e h 3 ,
for the ionic and atomic emission ratio serves as a sufficient condition for the confirmation of LTE. Here, d E is the lowering correction parameter, i.e., the correction term in the first ionization potential emerging due to high pressure in the plasma plume. m e is the electron mass, h is the Planck’s constant, E i o n is the the element’s first ionization potential. E i I I and E m I are the ionic and atomic species of an element’s upper energy levels with transition probabilities of A i j I I and A m n I and statistical weights g i I I and g m I , respectively. Figure 4 also illustrates the Saha–Boltzmann plot. The slope indicates an ionization temperature of 11,651 K. The excitation and ionization temperature are within 11%; consequently, the laser–plasma is in LTE.
For the determination of electron density, the Stark-broadened 422.6 nm Ca I line is well-isolated from other atomic lines; see Figure 4a. The electron density,
N e = Δ λ F W H M 2 w S ,
is proportional to the full-width-at half-maximum (FWHM), Δ λ F W H M , and inversely proportional to the Stark-broadening parameter, w S . From the FWHM of the line profile, the average, line-of-sight electron number density amounts to N e = 2.2 × 10 18 cm 3 . The electron density is larger than the necessary McWhirter criteron of 1.6 × 10 15 cm 3 for the 422.6 nm Ca I line and for an average, line-of-sight temperature of 10,570 K.
Application of the CF-LIBS algorithm [56] leads to the following concentrations: 38.2% Ca, 2.6% Fe, 24.6% Na, 18.4% K, 6.3% Mg, and 0.24% Sr, 7% C, 2.8% N, 0.4% O, and 1.8% H. Figure 5 displays concentration ratios of Mg/Na, K/Na, and Mg/K that are calculated with CF-LIBS. These results indicate good agreement with the ratios of the integrated intensities of Mg/Na, K/Na, Mg/K of t. dioica leaves samples illustrated in Figure 3. The experiments reveal that that spectral intensities of the elements can be used for evaluation of actual concentrations and concentration ratios of the elements.

3.2. Biochemical Analysis

3.2.1. Effect on Normal Healthy Rats

Table 3 indicates the hypoglycemic impact of a single oral administration of variable doses of 500, 750, 1000, and 1250 mg/kg bw aqueous leave extract in normal healthy rats, including the control dose of 0, i.e., distilled water (dw). Treated rats showed a regular fall of 8.56, 20.36 and 23.87% from the doses of 500, 750 and 1000 mg/kg bw, respectively, after 6 h. However, a fall of only 14.04% was observed with the dose of 1250 mg/kg bw after the same time interval.

3.2.2. Effect on Normal Healthy Rats during Glucose Tolerance Test

Table 4 summarizes the study results of aqueous extract of t. dioica leaves on blood glucose level (BGL) and glucose tolerance test (GTT) of normal healthy rats. Different doses of 500, 750, 1000 and 1250 mg/kg bw of extract were given orally to overnight fasted healthy rats. The observed decrease with the doses of 500, 750, 1000 and 1250 mg/kg bw in BGL after 2 h of administration was 12.28, 9.54, 15.21, and 12.15%, respectively, and these BGLs are considered as the ‘0’ h value. However, the decrease was observed up to 3 h after glucose administration and at 1 h intervals. The results show that the percentage decrease in BGLs was regular up to the dose of 1000 mg/kg bw and reaches its maximum of 17.28%. Moreover, a decrease of 14.77% was observed with the dose of 1250 mg/kg bw at the same time.

3.2.3. Effect on Diabetic Rats during Glucose Tolerance Test

Figure 6 and Figure 7 demonstrate the anti-diabetic effect of aqueous extract of t. dioica leaves on subdiabetic and mildly diabetic animals, respectively. Different doses of aqueous extract as mentioned above along with the standard drug tolbutamide 250 mg/kg bw were given orally to the groups as defined in the experimental design. The decrease of 13.7, 17.01, 22.0 and 16.3% in the BGLs of subdiabetic animals was observed after 3 h of glucose administration with the doses of 500, 750, 1000 and 1250 mg/kg bw, respectively. However, the dose of 250 mg/kg of tolbutamide reduced the BGL by 24.19% at 3 h during GTT in subdiabetic rats, which is comparable with the dose of 1000 mg/kg bw. Moreover, the maximum decrease of 22.0% with 1000 mg/kg bw dose of aqueous extract and 24.19% with 250 mg/kg bw doses of tolbutamide was observed after 3 h of glucose administration during GTT. The decrease of 15.7, 28.79, 31.39 and 30.86% in the BGLs of mildly diabetic animals was observed after 3 h of glucose administration with the doses of 500, 750, 1000 and 1250 mg/kg bw, respectively. However, the dose of 250 mg/kg of tolbutamide reduced BGL by 30.89% after 3 h during GTT in mildly diabetic rats, which is almost the same as with the dose of 1000 mg/kg bw. Moreover, the maximum decrease of 30.73% with 1000 mg/kg bw dose of aqueous extract and 31.95% with 250 mg/kg bw dose of tolbutamide was observed after 3 h of glucose administration during GTT.

3.2.4. Effect on Fasting Blood Glucose, Post-Prandial Glucose, and Lipid Profile of Severely Diabetic Rats

The long-term treatment’s anti-diabetic and anti-lipemic effects on the blood sugar levels and lipid profiles of severely diabetic rats are shown in Table 5. Rats were treated with an optimum effective dose of 1000 mg/kg bw of aqueous extract once a day at noon for one month. At the end of the treatment, the animals were compared with their own initial values and showed a significant reduction of 27.17% in fasting blood glucose (FBG) and 31.17% in post-prandial glucose (PPG) levels. The enhanced levels of TG, TC, LDL, and VLDL cholesterol were brought down significantly to 59.21, 19.15, 9.13 and 56.92%, respectively, after the treatment period. The aqueous extract has gained much attention due to their promising improvement of 32.18% in HDL level in the severely diabetic treated group. Moreover, in the untreated group, there was a slight fall in HDL levels and slight increment in all the other above-mentioned parameters.

3.2.5. Effect on Aspartate Aminotransferase, Alanine Aminotransferase, Alkaline Phosphatase, Creatinin, Total Protein, and Total Hemoglobin Levels of Severely Diabetic Rats

The hepatoprotective impact of long-term therapy is demonstrated in Table 6 on blood serum levels of aspartate aminotransferase (AST), alanine aminotransferase (ALT), alkaline phosphatase (ALKP), and creatinine (CRTN). These indicators are usually measured in units per liter (u/L). The affected levels of total protein and hemoglobin are also recorded. In diabetic control rats, there was a gradual increase in all these parameters except for total protein (TPR) and total hemoglobin (Hb) with vehicle (water only). Moreover, the most effective dose of 1000 mg/kg bw of the aqueous extract produced a fall of 26.19, 39.03, 38.43 and 41.17%, respectively, in AST, ALT, ALKP and CRTN levels after 30 days treatment. The unique observation indicated a promising improvement of 36.36 and 15.78% in protein and hemoglobin levels, respectively.

3.2.6. Effect on Urine Sugar and Body Weight of Severely Diabetic Rats

The effects of the most effective dose of the aqueous extract, 1000 mg/kg bw, on the body weight and urine sugar levels of severely diabetic rats and the control group are shown in Table 7. Urine sugar results of 0 are usually indicated as nil, and strip measurements showed +, ++, +++, or ++++, as noted in the table. The urine sugar levels decreased 75% and the body weight increased by 16.7% after treatment with the effective dose. In turn, enhanced levels of urine sugar accompanied with weight loss were observed in the control group.

3.2.7. Lethal Dose 50

The experiment was conducted with normal healthy rats. The behavior of the treated rats appeared normal. No toxic effect was reported at doses up to 10 and 15 times of the effective dose of the aqueous extract as no mortality was observed in any of these groups.

4. Discussion

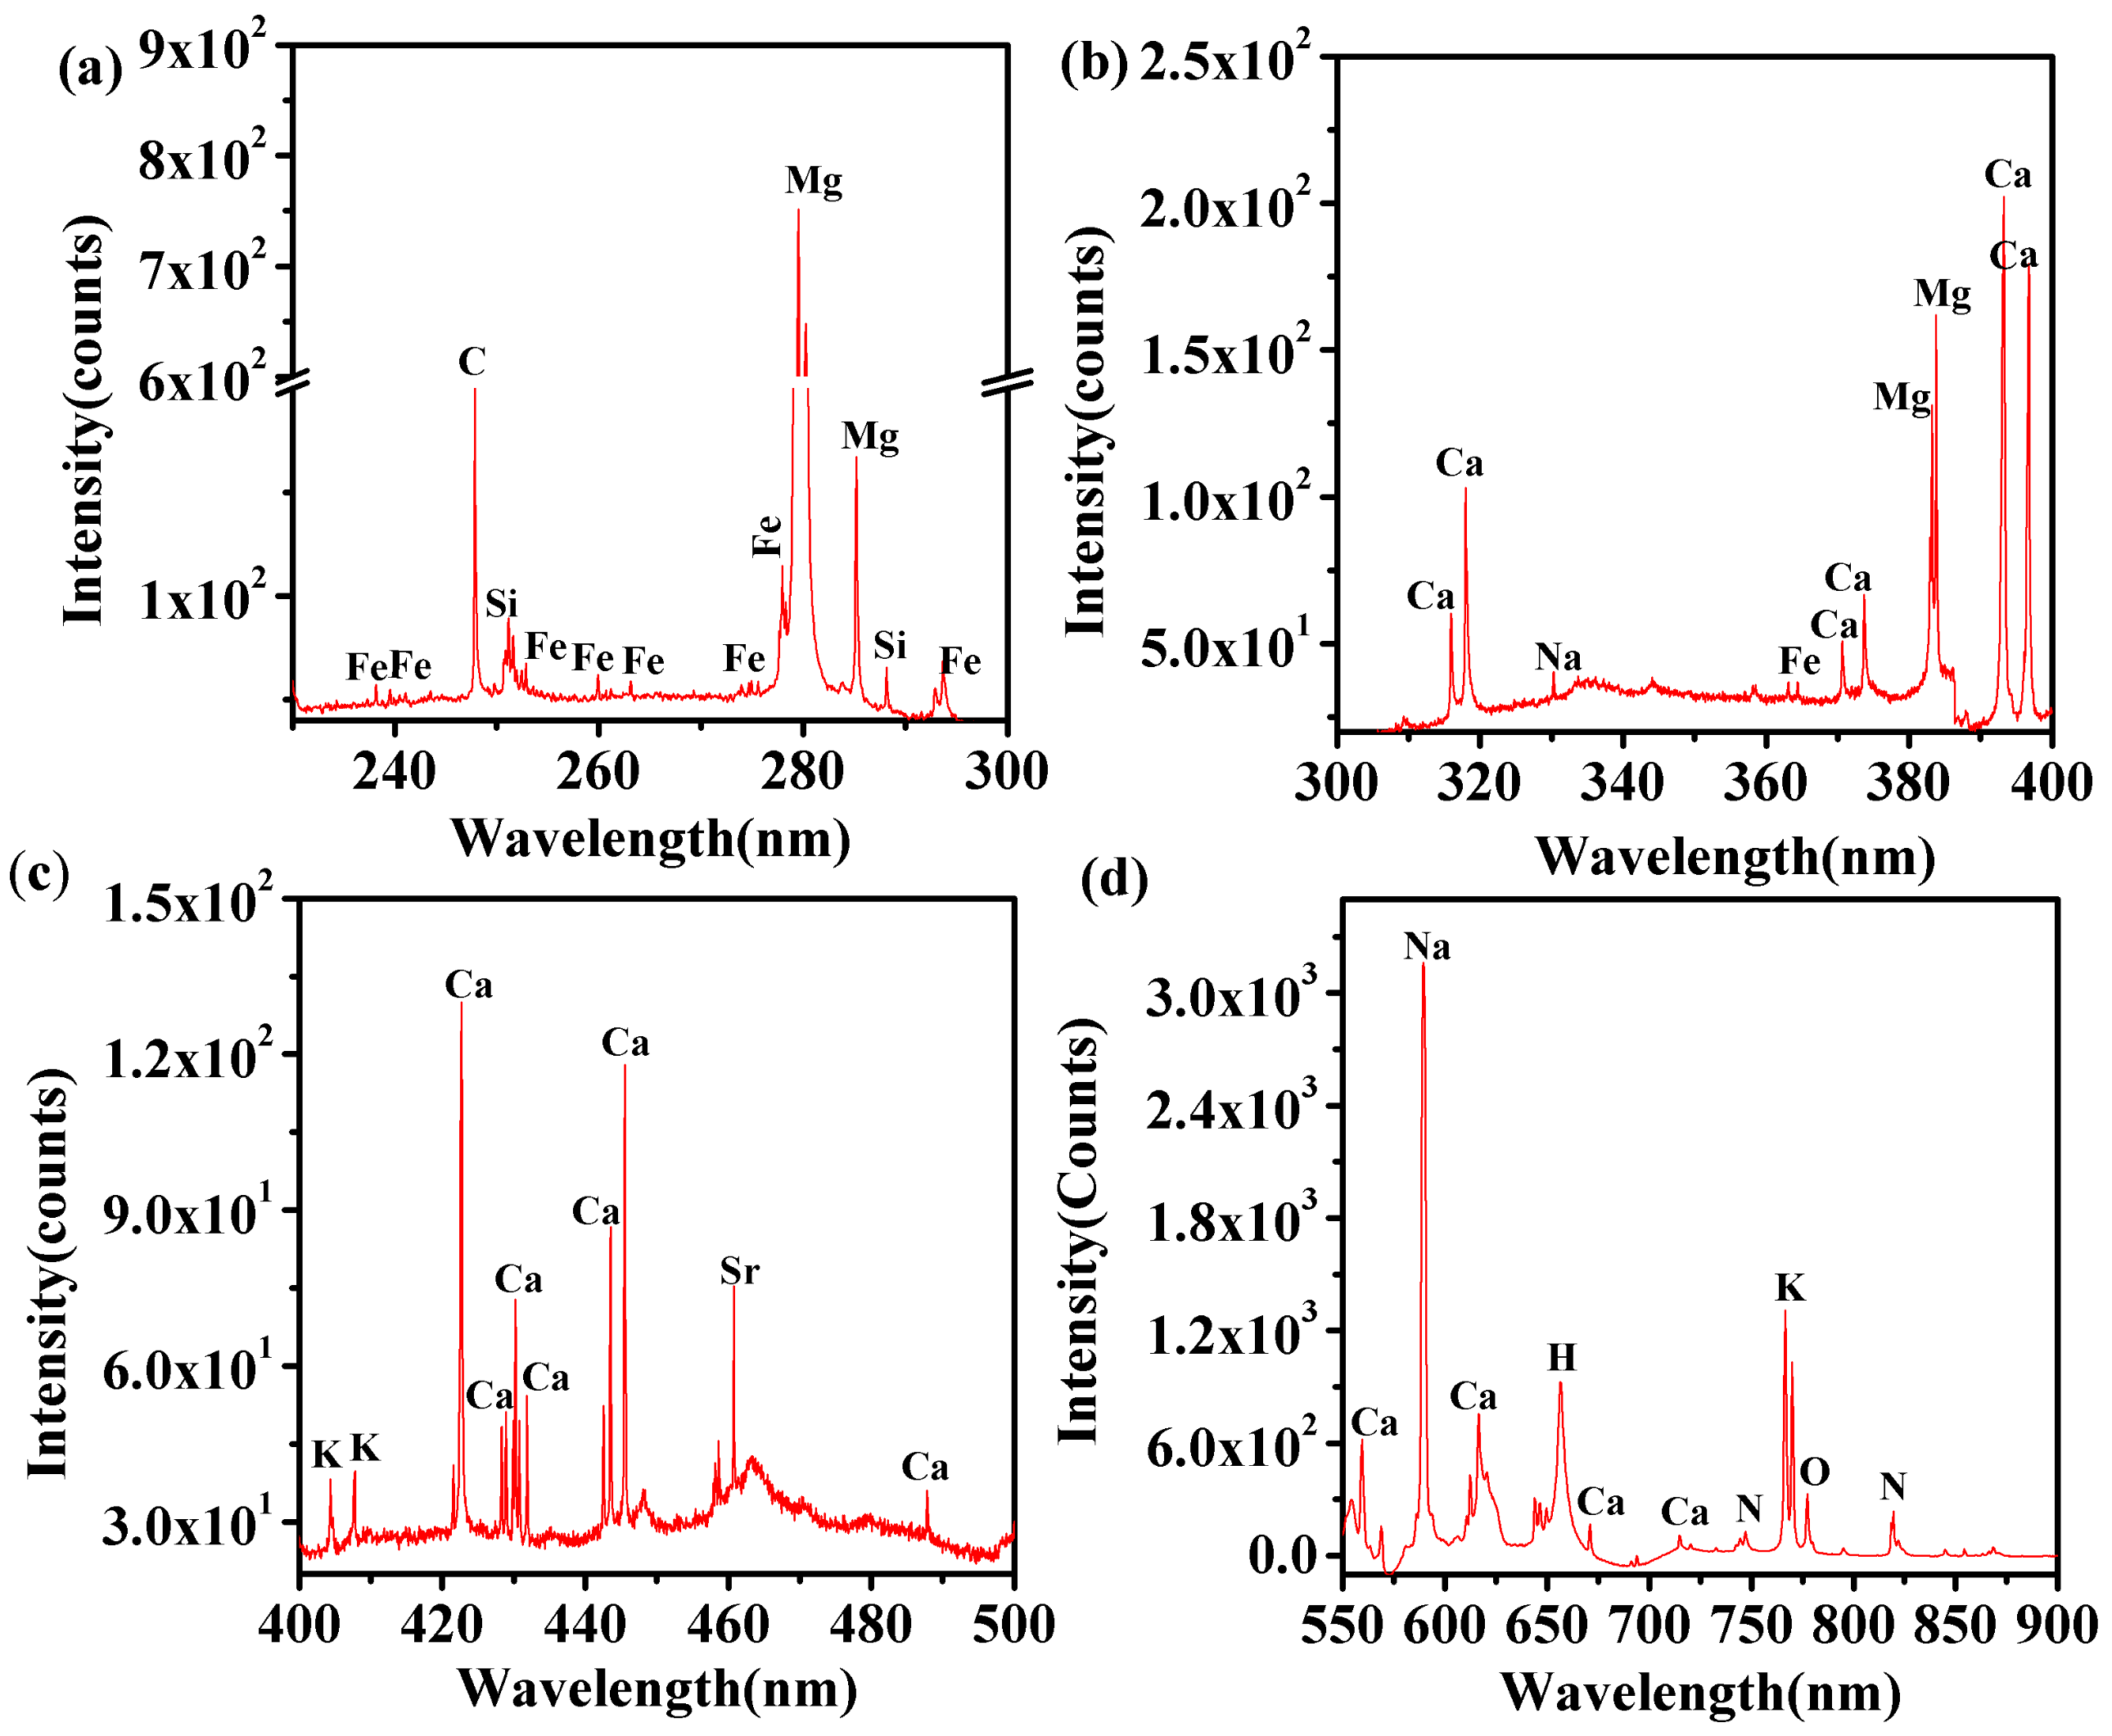
The application of LIBS delivers the elemental composition of 
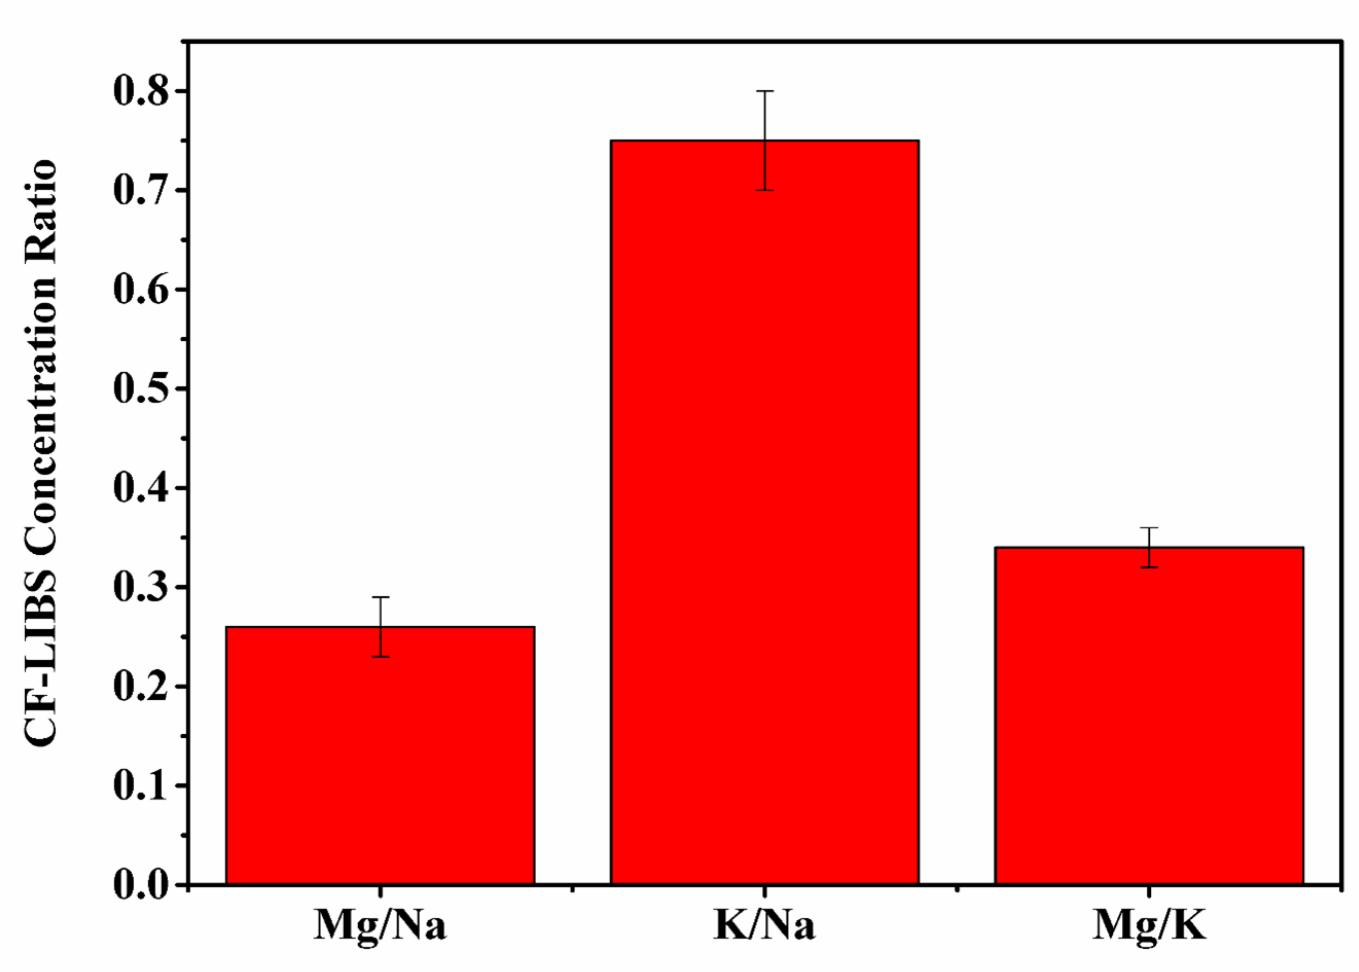
t. diocia leaves. These leaves are instrumental for the lowering of an elevated BGL, and consequently, they can be used for the therapy and management of diabetes. Elements including Na, K, Ca, Mg and Fe, and elemental ratios play a vital role in managing diabetes. It is noteworthy that the ratios of Mg/Na and Mg/K, determined by CF-LIBS in aqueous extract of t. diocia leaves, indicate similar trends as observed for other anti-diabetic medicines. The t. diocia plant is traditionally used as a vegetable in today’s Indian food system and as well in the ayurvedic system of medicine [57].
The communicated work demonstrates the considerable hypoglycemic and anti-diabetic efficacy of t. diocia leaves corroborated by short- and long-term studies. FBG studies on normal rats show the greatest hypoglycemic impact (23.8%) in less than 6 h; see Table 3. In contrast, the GTT studies on normal rats demonstrate that the hypoglycemic impact was initiated within 1 h and intensified later; see Table 4. This implies that within about one hour, the active components of aqueous extract induces the hypoglycemic effect after reaching the target tissues through circulation. The data also confirm that a significant effect persists for the next three hours after the glucose administration.
The GTT results reveal an improvement in the glucose tolerance of subdiabetic and mildly diabetic animals, reflecting a significant drop in high blood glucose levels. The results with a dose of 250 mg/kg bw of tolbutamide, a synthetic drug, are comparable with the dose of 1000 mg/kg bw of the aqueous extract. This would indicate similar mechanisms of action. STZ induces type II diabetes in which pancreatic insulin-secreting cells are destroyed [58,59]; consequently, the elevated blood glucose levels in the diabetic animals used in this study are consistent with type II diabetes. Hence, t. diocia aqueous extract, which supposedly acts as an insulin secretion enhancer by activating beta cells, could be considered an important and useful treatment in the context of type II diabetes.
In cases of normal, subdiabetic, and mildly diabetic animals, the dose of 1000 mg/kg bw was found to be the most effective dose; therefore, this dose was used to treat the animals with severe diabetes for further studies. It has been noted frequently that hyperlipidemia is always associated with hyperglycemia. As indicated in the medical literature, hypertriglyceridemia is the most prevalent lipid abnormality [59]. Numerous studies have linked elevated blood triglyceride levels to a higher risk of stroke. If high levels of TC and LDL cholesterol persist, then LDL has a propensity to adhere to the blood vessel walls, stimulating atherosclerosis, which in turn causes heart attacks and strokes. Consequently, high levels of LDL cholesterol increase the danger of developing heart disease that may induce stroke [60]. There is currently a volley of data supporting the notion that HDL is a beneficial lipid, as high levels are linked to low rates of heart disease while low levels are linked to higher rates. After 30 days of treatment, the animals in the current study with severe diabetes had increased HDL cholesterol levels and considerably decreased levels of TC, LDL, VLDL, and TG.
Other biochemical parameters taken into consideration for assessing the improvement in LFT and KFT of severely diabetic animals include AST, ALT, ALKP, CRTN, and TPR. AST is located in the liver, and it is released into the serum when the liver suffers from damage. Increased levels of AST in serum cause heart attacks and muscle disorders. Although ALT is not just found in the liver, liver damage causes it to be released into the bloodstream. As a result, it acts as a pretty accurate measure of liver health. Although ALKP is present in a variety of organs, its significant presence in the liver cannot be ignored. Hence, elevated levels of ALKP are indicative of liver disease or bile tract obstruction. However, high levels of CRTN cause renal failure. The reduction of raised levels of AST, ALT, ALKP, and CRTN by the treatment of aqueous extract of t. dioica leaves suggests that it could be explored as an anti-hyperglycemic agent and as an hepato-protective and renal protective agent to manage diabetic complications as well. The additional advantageous results in this study include a reduction in urine sugar level, an increase in body weight and total protein level. It has considerable value for human subjects too due to its traditional use as an Indian vegetable and its high LD50, showing a great margin of safety.

5. Conclusions

The present study reveals the fact that LIBS could be used as an advanced analytical tool to identify and quantify the elements responsible for the medicinal aspect of vegetables, which are part of the ayurvedic system of medicine. The elemental ratio of Mg/Na and Mg/K concentration of minerals in the aqueous extract of t. dioica leaves follows the same trend as reported in traditional medicine to treat diabetic patients. Based on the results of all parameters especially from a liver function test (LFT) and kidney function test (KFT), the aqueous extract of t. dioica leaves could be developed as an anti-diabetic drug for the management of diabetes and its complications. Furthermore, this study has relevance and significance because of the feasibility of the extract to show hypoglycemic property, and the extract induces strong hypolipemic action on hypertriglyceridemia and hepatoprotective effects. Additional advantages comprise reduced urine sugar level, increased body weight, and improved total protein level. The study confirms the benefits of the traditional use of t. dioica as an Indian vegetable with considerable value for humans including a comforting level of safety. Further characterizations of active components in t. dioica leaves are warranted, and studies are in progress to isolate, identify, and evaluate active components.

Author Contributions

All authors contributed equally to this work. Material preparation, data collection and analysis of the LIBS experiment were performed by T.K., Biochemical analysis was performed by P.K.R. The first draft of the manuscript was written by T.K. All authors edited and commented on previous versions of the manuscript. All authors have read and agreed to the published version of the manuscript.

Funding

This research received no external funding.

Institutional Review Board Statement

The study was approved by the Institutional Ethical Committee (83a/a/04/CPCSEA).

Data Availability Statement

The datasets obtained and analyzed in the current study are available from the corresponding author on request.

Acknowledgments

One of the authors, CGP, acknowledges the support in part by the Center for Laser Applications at the University of Tennessee Space Institute.

Conflicts of Interest

The author declares no conflict of interest. The funders had no role in the design of the study; in the collection, analyses, or interpretation of data; in the writing of the manuscript, or in the decision to publish the results.

Abbreviations

The following abbreviations are used in this manuscript:
LIBSLaser-Induced Breakdown Spectroscopy
ALKPAlkaline Phosphate
ALTAlanine Transferase
ASTSerum Separate Transferase
BGLBlood Glucose Level
bwBody Weight
CRTNCreatinine
CCDCharge-Coupled Device
dwDistilled Water
FBGFasting Blood Glucose
GTTGlucose Tolerance Test
hHours
HbHemoglobin
HDLHigh-Density Lipoprotein
kgKilogram
LDLLow-Density Lipoprotein
mgMilligram
PPGPost-Prandial Glucose
SDSeverly Diabetic
s.d.Standard Deviation
STZStreptozotocin
t. dioicatrichosanthes dioica
TCTotal Cholesterol
TPRTotal Protein
TGTri-Glyceride
USUrine Sugar

References

  1. Kesari, A.N.; Gupta, R.K.; Watal, G. Hypoglycemic effects of Murraya koenigii on normal and alloxan diabetic rabbits. J. Ethnopharmacol. 2005, 97, 247–251. [Google Scholar] [CrossRef]
  2. Gupta, R.K.; Kesari, A.N.; Watal, G.; Murthy, P.S.; Chandra, R.; Tandan, V. Hypoglycemic and anti-diabetic effect of aqueous extract of leaves of Annona squamosa (L). in experimental animals. Curr. Sci. 2005, 88, 1244–1254. [Google Scholar]
  3. Grover, J.K.; Yadav, S.; Vats, V. Medicinal plants of India with antidiabetic potential. J. Ethnopharmacol. 2002, 81, 81–100. [Google Scholar] [CrossRef]
  4. Irrova, M.D.; Paya, M.; Villar, A. A review of natural products and plants as potential antidiabetic drugs. J. Ethnopharmacol. 1989, 27, 243–275. [Google Scholar]
  5. Rai, P.K.; Jaiswal, D.; Mehta, S.; Watal, G. Anti-hyperglycaemic potential of Psidium guajava raw fruit peel. Indian J. Med. Res. 2009, 129, 561. [Google Scholar]
  6. Mukherjee, P.K.; Wahile, A. Integrated approaches towards drug development from Ayurveda and other Indian system of medicines. J. Ethnopharmacol. 2006, 103, 25–35. [Google Scholar] [CrossRef]
  7. Samy, R.; Ignacimuthu, P.S.; Sen, A. Screening of 34 Indian medicinal plants for antibacterial properties. J. Ethnopharmacol. 1998, 62, 173–182. [Google Scholar] [CrossRef]
  8. Rai, P.K.; Rai, N.K.; Pandhija, S.; Rai, A.K.; Watal, G. Screening of glycemic elements in ethnobotanical plants by laser induced break down spectroscopy. In Proceedings of the Progress on Tunable Lasers for Ultrafast Processes and Applications (PTLUPA ’06), Chennai, India, 21–22 December 2006; Volume 6, pp. 1–2. [Google Scholar]
  9. Rai, P.K.; Jaiswal, D.; Rai, N.K.; Pandhija, S.; Rai, A.K.; Watal, G. Role of glycemic elements of Cynodon dactylon and Musa paradisiaca in diabetes management. Lasers Med. Sci. 2009, 24, 761–768. [Google Scholar] [CrossRef]
  10. Rai, N.K.; Rai, P.K.; Pandhija, S.; Watal, G.; Rai, A.K.; Bicanic, D. Application of LIBS in detection of antihyperglycemic trace elements in Momordica charantia. Food Biophys. 2009, 4, 167–171. [Google Scholar] [CrossRef] [Green Version]
  11. Rai, P.K.; Rai, N.K.; Rai, A.K.; Watal, G. Role of LIBS in elemental analysis of Psidium guajava responsible for glycemic potential. Instrum. Sci. Technol. 2007, 35, 507–522. [Google Scholar] [CrossRef]
  12. Dhar, P.; Gembitsky, I.; Rai, P.K.; Rai, N.K.; Rai, A.K.; Watal, G. A possible connection between antidiabetic & antilipemic properties of Psoralea corylifolia seeds and the trace elements present: A LIBS based study. Food Biophys. 2013, 8, 95–103. [Google Scholar]
  13. Watal, G.; Sharma, B.; Rai, P.K.; Jaiswal, D.; Rai, D.K.; Rai, N.K.; Rai, A.K. LIBS-based detection of antioxidant elements: A new strategy. Methods Mol. Biol. 2010, 594, 275–285. [Google Scholar]
  14. Rai, P.K.; Shukla, S.; Mehta, S.; Rai, N.K.; Rai, A.K.; Watal, G. Therapeutic phytoelemental profile of trichosanthes dioica. Adv. Mater. Lett. 2010, 1, 210–216. [Google Scholar]
  15. Chehade, J.M.; Mooradian, A.D. A rational approach to drug therapy of type 2 diabetes mellitus. Drugs 2000, 60, 95–113. [Google Scholar] [CrossRef]
  16. Kesari, A.N.; Kesari, S.; Singh, S.K.; Gupta, R.K.; Watal, G. Studies on the glycemic and lipidemic effect of Murraya koenigii in experimental animals. J. Ethnopharmacol. 2007, 112, 305–311. [Google Scholar] [CrossRef]
  17. Gupta, R.K.; Kesari, A.N.; Murthy, P.S.; Chandra, R.; Tandon, V.; Watal, G. Hypoglycemic and antidiabetic effect of ethanolic extract of leaves of Annona squamosa L. in experimental animals. J. Ethnopharmacol. 2005, 99, 75–81. [Google Scholar] [CrossRef]
  18. Gupta, R.K.; Kesari, A.N.; Watal, G.; Murthy, P.S.; Chandra, R.; Tandon, V. Nutritional and hypoglycemic effect of fruit pulp of Annona squamosa in normal healthy and alloxan-induced diabetic rabbits. Ann. Nutr. Metab. 2005, 49, 407–413. [Google Scholar] [CrossRef]
  19. Jaiswal, D.; Rai, P.K.; Kumar, A.; Watal, G. Study of glycemic profile of Cajanus cajan leaves in experimental rats. Indian J. Clin. Biochem. 2008, 23, 167–170. [Google Scholar] [CrossRef] [Green Version]
  20. Kunze, H.-J. Introduction to Plasma Spectroscopy; Springer: Heidelberg, Germany, 2009. [Google Scholar]
  21. Fujimoto, T. Plasma Spectroscopy; Clarendon Press: Oxford, UK, 2004. [Google Scholar]
  22. Ochkin, V.N. Spectroscopy of Low Temperature Plasma; Wiley-VCH: Weinheim, Germany, 2009. [Google Scholar]
  23. Boulos, M.I.; Fauchais, P.; Pfender, E. Thermal Plasmas. Fundamentals and Applications; Plenum Press: London, UK, 1994. [Google Scholar]
  24. Radziemski, L.J.; Cremers, D.A. (Eds.) Laser-Induced Plasmas and Applications; Dekker: New York, NY, USA, 1989. [Google Scholar]
  25. Miziolek, A.W.; Palleschi, V.; Schechter, I. (Eds.) Laser Induced Breakdown Spectroscopy (LIBS): Fundamentals and Applications; Cambridge Univ. Press: New York, NY, USA, 2006. [Google Scholar]
  26. Singh, J.P.; Thakur, S.N. (Eds.) Laser Induced Breakdown Spectroscopy, 1st ed.; Elsevier: Amsterdam, The Netherlands, 2007. [Google Scholar]
  27. Singh, J.P.; Thakur, S.N. (Eds.) Laser Induced Breakdown Spectroscopy, 2nd ed.; Elsevier: Amsterdam, The Netherlands, 2020. [Google Scholar]
  28. Pathak, A.K.; Kumar, R.; Singh, V.K.; Agrawal, R.; Rai, S.; Rai, A.K. Assessment of LIBS for Spectrochemical Analysis: A Review. Appl. Spectrosc. Rev. 2012, 47, 14–40. [Google Scholar] [CrossRef]
  29. Baer, D.R.; Artyushkova, K.; Brundle, C.R.; Castle, J.E.; Engelhard, M.H.; Gaskell, K.J.; Grant, J.T.; Haasch, R.T.; Linford, M.R.; Powell, C.J.; et al. Practical Guides for X-Ray Photoelectron Spectroscopy (XPS): First Steps in planning, conducting and reporting XPS measurements. J. Vac. Sci. Technol. A 2019, 37, 03140111. [Google Scholar] [CrossRef]
  30. Trevizan, L.C.; Santos, D., Jr.; Samad, R.E.; Vieira, N.D., Jr.; Nomura, C.S.; Nunes, L.C.; Rufini, I.A.; Krug, F.J. Evaluation of laser induced breakdown spectroscopy for the determination of macronutrients in plant materials. Spectrochim. Acta Part B At. Spectrosc. 2008, 63, 1151–1158. [Google Scholar] [CrossRef]
  31. Chakravarthy, H.M. Fascicles of Flora of India-11 Cucurbitacae; Botanical Survey of India: Kolkata, India, 1982.
  32. Singh, K. Pointed Gourd. Indian Hortic. 1989, 33–34, 33–37. [Google Scholar]
  33. Sharma, G.; Pant, M.C. Effect of feeding T. Dioica (Parval) Whole Leaves Blood Glucose, Serum Triglycerides, Phospholipid, Cholest. High-Density Lipoprotein-Cholest. Levels Norm. Albino Rabbits. Curr. Sci. 1988, 57, 1085–1087. [Google Scholar]
  34. Mukharjee, S.K. Scope and use of indigenous herbal drugs in ’Madhumeha’ An Indian scenario. In Proceedings of the International Seminar on Free Radicals, Mediated Diseases, Varansi, India, 2–4 September 1996. [Google Scholar]
  35. Harit, M.; Rathee, P.S. Antifungal activity of unsaponifiable fraction of the fixed oil of (Trichosanthes) seed. Asian J. Chem. 1996, 8, 180–182. [Google Scholar]
  36. Luque de Castro, M.D.; García-Ayuso, L.E. Soxhlet extraction of solid materials: An outdated technique with a promising innovative future. Anal. Chim. Acta 1998, 369, 1–10. [Google Scholar] [CrossRef]
  37. Singh, S.K.; Rai, P.K.; Jaiswal, D.; Watal, G. Evidence-based Critical Evaluation of Glycemic Potential of Cynodon dactylon. Evid. Based Complement Alternat. Med. 2008, 5, 415–420. [Google Scholar] [CrossRef] [PubMed] [Green Version]
  38. Brahm, D.; Trinder, P. Estimation of glucose by glucose oxidase method. Analyst 1972, 97, 142–145. [Google Scholar]
  39. Allian, C.C.; Poon, L.S.; Chan, C.S.; Richmond, W.; Fu, P.C. Enzymatic determination of total cholesterols. Clin. Chem. 1974, 20, 470–475. [Google Scholar] [CrossRef]
  40. Buccolo, G.; David, M. Quantitative determination of Serum Triglycerides by use of enzyme. Clin. Chem. 1973, 19, 476–482. [Google Scholar] [CrossRef]
  41. Friedwald, W.T.; Ley, R.I.; Fradrickson, D.S. Estimation of low-density lipoprotein cholesterol in plasma without the use of preparative ultracentrifuge. Clin. Chem. 1972, 18, 499–502. [Google Scholar] [CrossRef]
  42. Henry, R.J.; Canon, D.C.; Winkelman, J.W. Clinical Chemistry Principals and Techniques, 2nd ed.; Harper and Row: New York, NY, USA, 1974. [Google Scholar]
  43. Hørder, M.; Elser, R.C.; Gerhardt, W.; Mathieu, M.; Sampson, E.J. International Federation of Clinical Chemistry (IFCC): Scientific Division, Committee on Enzymes. IFCC methods for the measurement of catalytic concentration of enzymes. Part 7. IFCC method for creatine kinase (ATP: Creatine (N-phosphotransferase, EC 2.7.3.2). IFCC Recommendation. J. Anal. Methods Chem. 1990, 12, 628560. [Google Scholar]
  44. Meites, S.; American Association of Clinical Chemists. Standard Methods of Clinical Chemistry; Academic Press: New York, NY, USA, 1965. [Google Scholar]
  45. Strickland, R.D.; Freeman, M.L.; Gurule, F.F. Copper binding by proteins in Alkaline solution. Anal. Chem. 1961, 33, 125–128. [Google Scholar] [CrossRef]
  46. Nonfon, M.; Lieb, F.; Moeschler, H.; Wendish, D. Four anonins from Annona squamosa. Phytochemistry 1990, 29, 1951–1954. [Google Scholar] [CrossRef]
  47. NIST: National Institute of Standards and Technology USA. Electronic Database. Available online: http://physics.nist.gov/PhysRefData/ASD/linesform.html (accessed on 28 April 2022).
  48. Kumari, R.; Kumar, R.; Rai, A.; Rai, A.K. Evaluation of Na and K in anti-diabetic ayurvedic medicine using LIBS. Lasers Med. Sci. 2021, 37, 513–522. [Google Scholar] [CrossRef]
  49. Singh, V.K.; Rai, A.K.; Rai, P.K.; Jindal, P.K. Cross-sectional study of kidney stones by laser-induced breakdown spectroscopy. Lasers Med. Sci. 2009, 24, 749–759. [Google Scholar] [CrossRef]
  50. Cremers, D.A.; Radziemski, L.J. Handbook of Laser Induced Breakdown Spectroscopy, Wiley: New York, NY, USA, 2006.
  51. Griem, H.R. Validity of local thermal equilibrium in plasma spectroscopy. Phys. Rev. 1963, 131, 1170–1176. [Google Scholar] [CrossRef]
  52. Griem, H.R. Plasma Spectroscopy; McGraw-Hill: New York, NY, USA, 1964. [Google Scholar]
  53. McWhirter, R.W.P. Spectral Intensities. In Plasma Diagnostic Techniques; Huddlestone, R.H., Leonard, S.L., Eds.; Academic Press: London, UK, 1965; Chapter 5; pp. 265–317. [Google Scholar]
  54. Wiese, W.L. Line Broadening. In Plasma Diagnostic Techniques; Huddlestone, R.H., Leonard, S.L., Eds.; Academic Press: London, UK, 1965; Chapter 6; pp. 201–264. [Google Scholar]
  55. Kumar, T.; Rai, A.K.; Dwivedi, A.; Kumar, R.; Azam, M.; Singh, V.; Yadav, N.; Rai, A.K. Chemical Characterization for the Detection of Impurities in Tainted and Natural Curcuma longa from India Using LIBS Coupled with PCA. Atoms 2022, 10, 91. [Google Scholar] [CrossRef]
  56. Kumar, R.; Rai, A.K.; Alamelu, D.; Aggarwal, S.K. Monitoring of toxic elements present in sludge of industrial waste using CF-LIBS. Environ. Monit. Assess. 2013, 185, 171–180. [Google Scholar] [CrossRef]
  57. Brahamvarchas. Ayurveda ka Pran: Vanaushidhi Vigyan, 3rd ed.; Brahmavarchas Shodh Sansthan: Haridwar, India, 2003; pp. 450–451. [Google Scholar]
  58. Hoftiezer, V. Comparison of streptozotocin-induced diabetes in the rat inducing volumetric quantitation of the pancreatic islets. Diabetologia 1973, 9, 178–184. [Google Scholar] [CrossRef] [Green Version]
  59. Sharma, S.R.; Dwivedi, S.K.; Swarup, D. Hypoglycemic and hypolipidemic effects of Cinnamomum tamala Nees leaves. Indian J. Exp. Biol. 1996, 34, 372–374. [Google Scholar]
  60. Sachdeva, A.; Khemani, L.D. Effect of Hibiscus rosa sinesis Linn. ethanol flower extract on blood glucose level and lipid profile in streptozotocin induced diabetic rats. J. Ethnopharmacol. 2003, 89, 61–66. [Google Scholar] [CrossRef]
Figure 1. Schematic diagram of the experimental setup for LIBS.
Foundations 02 00066 g001
Figure 2. LIBS spectra of t. dioica leaves for different spectral regions. (a) 230 to 300 nm, (b) 300 to 400 nm, (c) 400 to 500 nm, and (d) 550 to 900 nm.
Foundations 02 00066 g002
Figure 3. Intensity ratios Mg/Na, K/Na, and Mg/K of t. dioica leaves.
Foundations 02 00066 g003
Figure 4. (a) Lorentzian plot for determination of electron density. (b) Boltzmann plot for determination of plasma excitation temperature. (c) Saha–Boltzmann plot for determination of ionization temperature. Excitation and ionization temperature agree within 11%, confirming local thermodynamic equilibrium; see text.
Foundations 02 00066 g004
Figure 5. Concentration ratios of Mg/Na, K/Na, and Mg/K, evaluated with CF-LIBS.
Foundations 02 00066 g005
Figure 6. Effect of graded doses of t. dioica leaves aqueous extract on BGL during GTT in subdiabetic rats. Control: Distilled water, Treated 1: 500 mg/kg bw, Treated 2: 750 mg/kg bw, Treated 3: 1000 mg/kg bw, Treated 4: 1250 mg/kg bw, tolbutamide: 250 mg/kg bw.
Foundations 02 00066 g006
Figure 7. Effect of graded doses of t. dioica leaves aqueous extract on BGL during GTT in mildly diabetic rats. Control: Distilled water, Treated 1: 500 mg/kg bw, Treated 2: 750 mg/kg bw, Treated 3: 1000 mg/kg bw, Treated 4: 1250 mg/kg bw, tolbutamide: 250 mg/kg bw.
Foundations 02 00066 g007
Table 1. List of identified elements in t. dioica samples.
ElementWavelength (nm)
carbon (C)247.8
nitrogen (N)744.2, 746.8, 818.4, 818.8, 821.6
oxygen (O)777.3, 844.6
hydrogen (H)656.3
calcium (Ca)317.8, 318.2, 370.6, 373.7, 393.4, 396.3, 422.7,
430.2, 430.7, 442.5, 443.4, 443.5, 445.5, 445.6,
445.7, 487.8, 610.2, 612.2, 616.2, 643.9, 646.2,
649.3, 671.7, 714.8, 720.2
magnesium (Mg)279.6, 280.2, 285.2, 383.0, 383.9,
sodium (Na)588.9, 589.5
potassium (K)404.5, 404.8, 766.4, 769.8
iron (Fe)238.2, 239.5, 240.4, 252.3, 259.8, 263.1, 273.9, 274.9, 275.5, 278.8, 293.6
silicon (Si)252.8, 288.1
strontium (Sr)460.6
Table 2. Experimental and theoretical ratio of the spectral line Ca II and Mg II.
ElementExperimental Ratio (I1/I2)Theoretical Ratio A 1 g 1 λ 2 / A 2 g 2 λ 1
Ca II (393.3/396.8)1.921.86
Mg II (279.5/280.2)1.982.05
Table 3. Effect of graded dose of t. dioica leave aqueous extract on blood glucose leveles (mg/dL) of normoglycemic rats (mean ± standard deviation) for pre- and post- treatments.
Experiment GroupsTreatment (mg/kg bw)Pre-Treatment FBGPost (h) 1.5Post (h) 3.0Post (h) 4.5Post (h) 6.0
control0 (dw)71.5 ± 3.269.3 ± 3.273.0 ± 3.671.5 ± 3.371.2 ± 4.0
extract50072.0 ± 3.569.7 ± 4.365.4 ± 4.661.4 ± 4.265.1 ± 3.4 a
extract75069.9 ± 3.964.5 ± 4.263.1 ± 4.457.9 ± 4.256.7 ± 3.9
extract100070.3 ± 3.767.1 ± 4.164.8 ± 4.357.8 ± 4.754.6 ± 3.5 a
extract125071.1 ± 4.670.4 ± 4.267.1 ± 4.865.7 ± 3.6 a 61.2 ± 4.9 a
ap < 0.01 compared with control.
Table 4. Effect of graded dose of t. dioica leaves aqueous extract on BGL during GTT of normoglycemic rats (mean ± standard deviation) for pre- and post- treatments.
Experiment GroupsTreatment (mg/kg bw)Pre-Treatment FBGPost (h) 1Post (h) 2Post (h) 3Post (h) 4Post (h) 5
control0 (dw)73.3 ± 4.175.9 ± 3.276.5 ± 4.5107.3 ± 4.199.6 ± 3.791.4 ± 4.5
treated 150069.1 ± 4.668.1 ± 5.467.1 ± 4.391.3 ± 4.183.2 ± 4.3 a 78.1 ± 3.9
treated 275066.9 ± 5.567.8 ± 4.269.2 ± 3.791.4 ± 4.481.4 ± 4.4 a 75.1 ± 3.9
treated 3100072.5 ± 4.165.4 ± 4.164.8 ± 5.192.1 ± 4.481.3 ± 4.4 a 75.6 ± 4.1
treated 4125069.9 ± 4.669.1 ± 3.967.2 ± 3.890.1 ± 4.3 a 84.1 ± 3.8 a 77.9 ± 3.5
ap < 0.01 compared with control.
Table 5. Effect of graded dose of t. dioica leaves aqueous extract on blood glucose level and lipid profile of severely diabetic (SD) rats (mean ± s.d.) for pre- and post-treatment levels.
Experiment AnimalsTreatment (Aqueous Extract)Pre-Treatment LevelsPost (Days) 7Post (Days) 14Post (Days) 21Post (Days) 28
FBG (mg/dL)
Normal (control)0 (dw)82.3 ± 3.485.7 ± 2.984.5 ± 4.583.8 ± 4.985.3 ± 3.8
SD (control)0 (dw)287.4 ± 5.6290.8 ± 3.5 a 302.5 ± 4.7 a 299.8 ± 4.8 a 298.8 ± 4.8 a
SD (treated)1000 mg/kg bw297.3 ± 4.6273.5 ± 4.5 a 255.6 ± 4.4 a 223.9 ± 4.8 a 211.2 ± 4.9
PPG (mg/dL)
Normal (control)0 (dw)161.6 ± 5.1161.9 ± 4.8162.1 ± 4.8161.4 ± 5.2162.6 ± 4.2
SD (control)0 (dw)446.9 ± 4.7455.4 ± 5.2 a 457.8 ± 3.7 a 453.5 ± 4.1 a 462.9 ± 3.7 a
SD (treated)1000 mg/kg bw437.3 ± 3.4385.2 ± 5.0 a 353.4 ± 4.2 a 321.3 ± 4.1 a 303.2 ± 4.1 a
Total colesterol (mg/dL)
Normal (control)0 (dw)94.5 ± 4.196.0 ± 3.997.9 ± 3.797.2 ± 3.197.0 ± 3.3
SD (control)0 (dw)117.9 ± 4.1115.8 ± 5.1 a 115.3 ± 5.1 a 114.6 ± 4.1 a 115.2 ± 5.1 a
SD (treated)1000 mg/kg bw116.5 ± 4.9101.7 ± 4.3 a 99.9 ± 4.5 a 93.5 ± 5.3 a 94.9 ± 5.0 a
HDL colesterol (mg/dL)
Normal (control)0 (dw)27.6 ± 4.128.9 ± 4.629.7 ± 4.528.8 ± 3.829.9 ± 4.1
SD (control)0 (dw)23.9 ± 2.923.6 ± 3.1 b 22.5 ± 3.6 b 23.2 ± 3.8 b 23.3 ± 3.1 b
SD (treated)1000 mg/kg bw21.1 ± 3.625.3 ± 4.8 b 25.4 ± 5.2 b 27.8 ± 5.4 b 28.1 ± 6.2 b
LDL colesterol (mg/dL)
Normal (control)0 (dw)53.1 ± 3.653.3 ± 3.753.8 ± 4.055.6 ± 4.154.7 ± 3.6
SD (control)0 (dw)51.8 ± 3.352.4 ± 6.4 a 55.6 ± 5.4 a 53.6 ± 4.2 b 53.9 ± 4.1 b
SD (treated)1000 mg/kg bw54.6 ± 2.848.2 ± 3.2 a 51.1 ± 4.1 a 47.9 ± 5.3 b 49.3 ± 4.2 a
VLDL colesterol (mg/dL)
Normal (control)0 (dw)14.2 ± 2.914.3 ± 2.314.4 ± 2.514.5 ± 2.714.6 ± 2.4
SD (control)0 (dw)41.7 ± 5.239.4 ± 4.5 a 36.2 ± 4.2 a 38.3 ± 4.8 a 38.9 ± 4.8 a
SD (treated)1000 mg/kg bw40.6 ± 3.332.3 ± 4.3 a 20.4 ± 5.3 a 17.4 ± 4.3 a 17.5 ± 4.5 a
Triglycerides (mg/dL)
Normal (control)0 (dw)91.9 ± 4.791.4 ± 4.192.8 ± 4.291.2 ± 3.192.8 ± 4.3
SD (control)0 (dw)198.3 ± 4.1196.7 ± 4.8 a 184.2 ± 4.4 a 190.5 ± 3.6 a 199.7 ± 3.1 b
SD (treated)1000 mg/kg bw204.9 ± 4.3160.5 ± 4.8 a 100.9 ± 4.1 b 88.5 ± 4.6 a 87.4 ± 4.8 a
ap < 0.001 compared with control. b p < 0.01 compared with control.
Table 6. Effect of graded dose of t. dioica leaves aqueous extract on serum enzymes, total protein, and total hemoglobin of severely diabetic (SD) rats (mean ± s.d.) for pre- and post-treatment levels.
Experiment AnimalsTreatment (Aqueous Extract)Pre-Treatment LevelsPost (Days) 7Post (Days) 14Post (Days) 21Post (Days) 28
AST (u/L)
Normal (control)0 (dw)21.1 ± 3.421.6 ± 2.921.4 ± 3.421.6 ± 4.121.8 ± 3.5
SD (control)0 (dw)37.5 ± 4.635.2 ± 3.7 a 35.7 ± 3.5 a 36.8 ± 3.9 a 36.3 ± 3.9 a
SD (treated)1000 mg/kg bw37.8 ± 4.636.4 ± 3.9 a 35.2 ± 3.6 a 33.4 ± 4.2 a 27.9 ± 4.4 a
ALT (u/L)
Normal (control)0 (dw)21.6 ± 3.421.8 ± 4.321.2 ± 4.221.9 ± 4.821.6 ± 4.1
SD (control)0 (dw)37.3 ± 3.136.5 ± 3.2 a 38.1 ± 3.6 a 37.3 ± 4.2 a 37.8 ± 3.1 a
SD (treated)1000 mg/kg bw39.2 ± 4.638.3 ± 4.3 a 34.1 ± 4.2 a 29.7 ± 4.6 a 23.9 ± 3.7 a
Alkaline Phosphatase (u/L)
Normal (control)0 (dw)91.9 ± 5.190.3 ± 4.791.2 ± 4.491.9 ± 3.991.9 ± 3.4
SD (control)0 (dw)163.6 ± 4.5164.9 ± 4.4 a 165.2 ± 4.2 a 166.1 ± 4.9 a 168.7 ± 4.2 a
SD (treated)1000 mg/kg bw166.5 ± 4.7169.9 ± 4.4 a 145.9 ± 4.1 b 114.6 ± 4.9 a 102.5 ± 5.1 b
Serum creatinine (u/L)
Normal (control)0 (dw)0.9 ± 0.10.8 ± 0.30.8 ± 0.50.9 ± 0.60.8 ± 0.3
SD (control)0 (dw)1.4 ± 0.51.5 ± 0.7 a 1.7 ± 0.5 a 1.6 ± 0.4 a 1.8 ± 0.6 a
SD (treated)1000 mg/kg bw1.7 ± 0.61.7 ± 0.5 a 1.3 ± 0.4 a 1.2 ± 0.4 a 1.0 ± 0.4 a
Total hemoglobin (g/dL)
Normal (control)0 (dw)13.9 ± 2.413.6 ± 2.414.1 ± 2.414.0 ± 2.314.2 ± 2.3
SD (control)0 (dw)10.5 ± 3.210.5 ± 2.4 a 10.1 ± 3.6 a 10.6 ± 2.5 a 10.0 ± 2.4 a
SD (treated)1000 mg/kg bw11.4 ± 2.912.4 ± 2.5 a 14.2 ± 2.3 a 13.1 ± 2.6 a 13.2 ± 2.7 a
Total protein (mg/dL)
Normal (control)0 (dw)8.8 ± 1.98.6 ± 1.38.6 ± 1.58.9 ± 2.48.9 ± 2.3
SD (control)0 (dw)5.4 ± 2.55.2 ± 2.6 a 5.4 ± 1.8 a 5.6 ± 2.5 a 5.5 ± 1.4 a
SD (treated)1000 mg/kg bw5.5 ± 2.35.7 ± 2.3 a 6.5 ± 2.1 a 7.2 ± 1.8 a 7.5 ± 2.3 a
ap < 0.001 compared with control. b p < 0.01 compared with control.
Table 7. Impact of the most effective dose of t. dioica aqueous extract on urine sugar and body weight in normal and severely diabetic (SD) rats (mean ± s.d.) for pre- and post-treatment levels.
Experiment AnimalsTreatment (Aqueous Extract)Pre-Treatment LevelsPost (Days) 7Post (Days) 14Post (Days) 21Post (Days) 28
urine sugar
Normal (control)0 (dw)nilnilnilnilnil
SD (control)0 (dw)++++++++++++++++++
SD (treated)1000 mg/kg bw++++++++++++++
body weight (g)
Normal (control)0 (dw)210 ± 10210 ± 10210 ± 10200 ± 10210 ± 10
SD (control)0 (dw)260 ± 10250 ± 10240 ± 10240 ± 10230 ± 10
SD (treated)1000 mg/kg bw250 ± 10240 ± 10240 ± 10230 ± 10230 ± 10
Publisher’s Note: MDPI stays neutral with regard to jurisdictional claims in published maps and institutional affiliations.

