Article

Spatial Computational Hepatic Molecular Biomarker Reveals LSEC Role in Midlobular Liver Zonation Fibrosis in DILI and NASH Liver Injury

Independent Researcher, Magnit, CA 95630, USA
Int. J. Transl. Med. 2024, 4(2), 208-223; https://doi.org/10.3390/ijtm4020012
Submission received: 7 February 2024 / Revised: 11 March 2024 / Accepted: 19 March 2024 / Published: 23 March 2024

Abstract

:
The liver is structurally organized into zonation, where Liver Sinusoidal Endothelial Cells (LSECs) play a crucial role during chronic liver injury and the early stages of fibrosis. Fibrosis can be reversed if diagnosed early at the molecular level in zonation before progressing to advanced stages like bridging fibrosis. This study identified zonation marker genes using scRNA-seq and spatial transcriptomics molecular profiling technologies in a normal and diseased fibrotic human liver. DGE analysis was performed over LSECs, and we identified the top 20 expressed genes in the periportal, perivenous, and intermediate acinar zones. Multi-omics and scRNA-seq analysis over Visium images and ECs liver cells showed OIT3, DNASE1L3, CLEC4G, LYVE1, FCN2, and CRHBP as commonly expressed mid-lobular zonation-specific genes. Also, this study detected STAB2, F8, AQP1, TEK, TIMP3, TIE1, and CTSL genes as expressed in DILI and NASH EC populations. The connection between LSEC marker genes in zone 2 and liver fibrosis holds significant promise for advancing our understanding in developing new therapeutic strategies for fibrosis reversal and designing computational molecular biomarkers in NASH and DILI fibrotic liver diseases.

1. Introduction

Liver disease contributes to approximately 4% of global deaths annually, accounting for over two million fatalities. The significant global burden of liver disease is exerting considerable pressure on public healthcare systems. Major contributors to this burden include cirrhosis and hepatocellular carcinoma (HCC), as well as metabolic dysfunction-associated steatotic liver disease (MASLD) and drug-induced liver injury (DILI), which are common causes of liver-related deaths [1].
The liver is the largest organ in the human body and is responsible for vital functions, including the metabolism of nutrients and xenobiotics. Structurally, the liver comprises small anatomical units known as liver lobules. Each lobule is histologically organized into a unique hexagonal architectural arrangement of hepatocytes (parenchymal cells: PCs) into three zones that exhibit distinct functionalities, a phenomenon known as liver zonation. Venous blood from the gut mixes at the portal vein with oxygenated atrial blood and flows towards the central vein through sinusoids. The liver tissue area around the portal triad, i.e., peri-portal recognized as zone 1 (oxygen enriched), is involved in metabolic functions and specialized in gluconeogenesis. In contrast, the tissue area around the central vein recognized as zone 3 (less oxygen) is involved in bile acid production drug metabolism and glycolysis. The area in between, i.e., midlobular, known as zone 2, is a transitional region where the concentration of oxygenated blood, nutrients, metabolites, and gut-derived toxins varies along the portal–central vein axis. Spatially, heterogeneous hepatocytes are distinguished by the gene expression profiles, where 50% of the genes are expressed along the lobular zonation axis [2]. The zone 2 is believed to play an essential role in the homeostatic renewal of hepatocytes, liver mass regeneration, and proliferation upon liver injury [3,4]. The spatial heterogeneity of parenchymal and non-parenchymal cells (NPCs) is zones is dependent on which modulates differential gene expression (DGE) and initiates several liver diseases, including nonalcoholic steatohepatitis (NASH), DILI, HCC, and liver regeneration [5].
Apart from hepatocytes, LSECs, which constitute around 15–20% of the total number of liver cells, are highly specialized non-parenchymal endothelial cells. They act as a physical barrier between blood substrates and hepatocytes. Liver endothelial cells (ECs) include LSECs, vascular ECs, and lymphatic ECs (LyECs) [6,7]. As chronic liver disease advances, hepatocyte functioning is impaired by crosstalk between other liver cells, which initiates an important role in regulating fibrosis. LSECs have unique fenestrae (pores) that allow for the efficient clearance of pathogens, debris, and toxins from the blood, keeping the liver clean and functional. LSECs act as determinants of hepatic fibrosis, where the process of capillarization precedes fibrosis in which LSECs lack fenestration and develop an organized basement membrane [8]. LSECs are the major drivers in fibrosis [9,10,11,12], and differential gene expression is observed between the different zones of the liver lobule during fibrosis [13]. For example, the periportal zone 1 expresses genes involved in the uptake of nutrients, the midlobular zone 2 expresses genes involved in the metabolism of nutrients, and the pericentral zone 3 expresses genes involved in the secretion of bile. The gradient of DGE is observed in LSECs and hepatocytes following disrupted zonation architecture and liver functionalities in most liver diseases, including MASLD, NASH, and DILI. DGE manifests around pericentral zone 3 and later progresses towards advanced stages of fibrosis, bridging fibrosis, and cirrhosis [14,15]. Liver bridging fibrosis, a specific advanced NASH feature, is a type of scarring caused by the accumulation of excess collagen around the hexagonal portal triad–central vein region in the later stages of liver fibrosis. These collagen bands connect different areas of the liver and block the flow of blood and bile, which leads to liver failure. Early liver fibrosis, a condition where scar tissue builds up, can indeed be reversed if detected early in zonation at the molecular level and addressed promptly. However, it is crucial to remember that this reversal is contingent on preventing the progression to more advanced stages, like bridging fibrosis, where the scar tissue becomes more organized, and the damage is irreversible.
It is challenging to measure zonation-specific structural variations during the early stages of fibrosis and later at the bridging fibrosis level. Our knowledge is limited and poorly understood on the role of (1) zone 2 LSECs in early liver fibrosis, (2) LSEC-specific marker genes in hepatotoxic DILI conditions, (3) DGE profiles within unclear boundaries of liver zones under normal, NASH, and DILI disease fibrotic patterns. This study aims to computationally characterize and quantify the spatial heterogeneity of hepatocytes at the molecular level using single-cell RNA sequencing and spatial molecular imaging techniques. This will enhance our understanding of zonal restructuring, the role of LSECs, and marker genes in normal and diseased fibrotic conditions.

2. Methods and Materials

2.1. H&E Histopathology Image Classifications

Image analytics and experimental workflow, illustrated in Figure 1D, are designed to classify hematoxylin and eosin (H&E) histopathology images under five categories, i.e., normal, steatosis, early fibrosis, bridging fibrosis, and cirrhosis. Machine learning widgets, shown in the workflow, are executed to load, process, classify, cluster, and visualize the imaging data. Open-source visual programming data mining framework, the Orange toolbox, is used for the classification of H&E histopathology image tiles. Orange is a machine learning data mining platform (http://orange.biolab.si, accessed on 22 December 2023) for image analysis and data visualization [16,17]. H&E-stained whole slide (WSI) histopathology images were acquired from open-source National Cancer Institute (NCI) USA Biorepositories and Biospecimen Research Branch’s (BBRB) Genotype-Tissue Expression (GTEx) Tissue Image library of annotated WSI with clinical data, publicly available at https://brd.nci.nih.gov/brd/specimen/GTEX-117XS-0926 (accessed on 20 December 2023) and downloaded under five categories as normal, steatosis, early fibrosis, bridging fibrosis, and cirrhosis. Each WSI was cropped into tiles for training machine learning models and classified in Orange tool classification layout. Experimental workflow is shown in Figure 1D.

2.2. Spatial Transcriptomics Data Analysis

2.2.1. DGE Analysis for NASH and Zonation

DGE analysis for NASH and zonation expression is performed over four independent studies, GSE89632, GSE126848, GSE83990, and GSE105127, using the NCBI GEO2R analysis tool. Two studies were selected in each group, i.e., GSE89632 and GSE126848, in the NASH and control group, and GSE83990 and GSE105127 in the liver zonation group (zone 1, zone 2, zone 3) from NCBI GEO (Gene Expression Omnibus) database to understand DGE expression for NASH and zonation-specific genes. In the first step, patients in respective studies were grouped as NASH and control groups and zone 1, zone 2, and zone 3 in zone-specific DGE studies. The second step was to run the GEO2R tool (available at NCBI GEO website) for DGE analysis, and then volcano plots were generated under respective studies, as shown in Figure 2.

2.2.2. Single-Cell Clustering for NASH and DILI

Single-cell transcriptomic analysis is performed over liver cells (n = 9, i.e., three patients in each group) in control, DILI (intrinsic), and NASH datasets, available at NCBI GEO GSE166178 [18] and analyzed for the heterogeneity of inter- and intra-group endothelial cells in healthy and diseased mouse livers, as illustrated in Figure 3.

2.2.3. Visium Data Analysis and Visualization

The Visium dataset used here is available at the Gene Expression Omnibus NCBI GEO public database under accession number GSE192742. Visium 10x genomics Loupe Browser image files were downloaded from liver cell atlas, available at https://www.livercellatlas.org/download.php (accessed on 20 December 2023). The Visium ST images of normal human liver samples were processed using Loupe Browser 7.0.1 (10x Genomics Inc., Pleasanton, CA, USA) and downloaded from https://www.10xgenomics.com/support/software/loupe-browser/downloads (accessed on 20 December 2023). The gene expression data for the k-mean clusters were generated by the Space Ranger software (Version # Loupe Browser 7.0.1) for upregulated genes. The data consist of the median-normalized average of gene expression, log2 fold changes, and statistical significance (p values) computed for genes with a p value < 0.05.

2.2.4. Spatial Molecular Imaging

Spatial molecular imaging highlights DGE in human liver zonation. Imaging data were acquired from an open-source publicly available multiplex dataset at http://nanostring.com/CosMx-dataset (accessed on 20 December 2023) CosMxTM Spatial Molecular Imager, which includes staining for a panel of morphological features.

2.3. Liver Cell Clustering and Analysis Tool

For liver cell clustering and LSEC marker analysis, National Institute of Health (NIH), USA, Human BioMolecular Atlas Program (HuBMAP) Azimuth app is used. Azimuth is a Seurat-based web application tool that uses an annotated reference dataset to automate the processing, analysis, and interpretation of single-cell RNA-seq data. Azimuth utilizes ‘reference-based mapping’ pipeline that accept counts matrix file in multiple formats as input and performs normalization, visualization, cell annotation, and DGE without any coding requirement on web cloud. All results can be visualized within the app and are downloadable for additional downstream analysis [19,20,21,22,23]. The development of Azimuth is led by the New York Genome Center Mapping Component as part of the NIH HuBMAP consortium.

2.4. LSEC Markers

Cellxgene Differential Expressed Gene (DGE) tool is used to run expression analysis for the cell types of PP-LSEC, PC-LSEC, and LSEC cells. CellxGene is an open-source, public database available at https://cellxgene.cziscience.com/, a suite of tools to run an analysis of the single-cell transcriptomic datasets. A list of ECs expressed exclusively for LSEC cell populations is acquired from liver single-cell expression atlas of 28 human livers [24] available at http://liveratlas-vilarinholab.med.yale.edu/ and plotted on LSECs HuBMAP Azimuth reference-based single-cell analysis tool for expression analysis. The analyzed results were then compared with the zonation browser tool to see the zonation profiles of the same expressed genes in midlobular zone 2. All three plots are illustrated in Supplementary Figure S3. Zonation browser tool is available at https://itzkovitzwebapps.weizmann.ac.il/webapps/home/session.html?app=HumanandMouseHepatocyteZonation (accessed on 20 December 2023).

3. Results

3.1. Histopathology H&E Image Classification Experimental Workflow for Early and Bridging Fibrosis

After predictive analysis, images are clustered based on the histologic disease features learned by machine learning models, workflow design shown in Figure 1D. For instance, all the bridging fibrosis images are grouped together, as shown in the t-SNE plot (Figure 1E) and hierarchical clustering (Figure 1A–C). Other category images are grouped similarly as per their disease morphology features. The confusion matrix shown in Figure 1F illustrates correctly predicted images (diagonally highlighted blocks) under respective categories. Closely clustered images share common morphological disease features in early fibrosis and steatosis (NASH-specific feature), where white fat droplets are present in both images, shown as an example in Figure 1C. Classification models’ performance is summarized in Table 1.

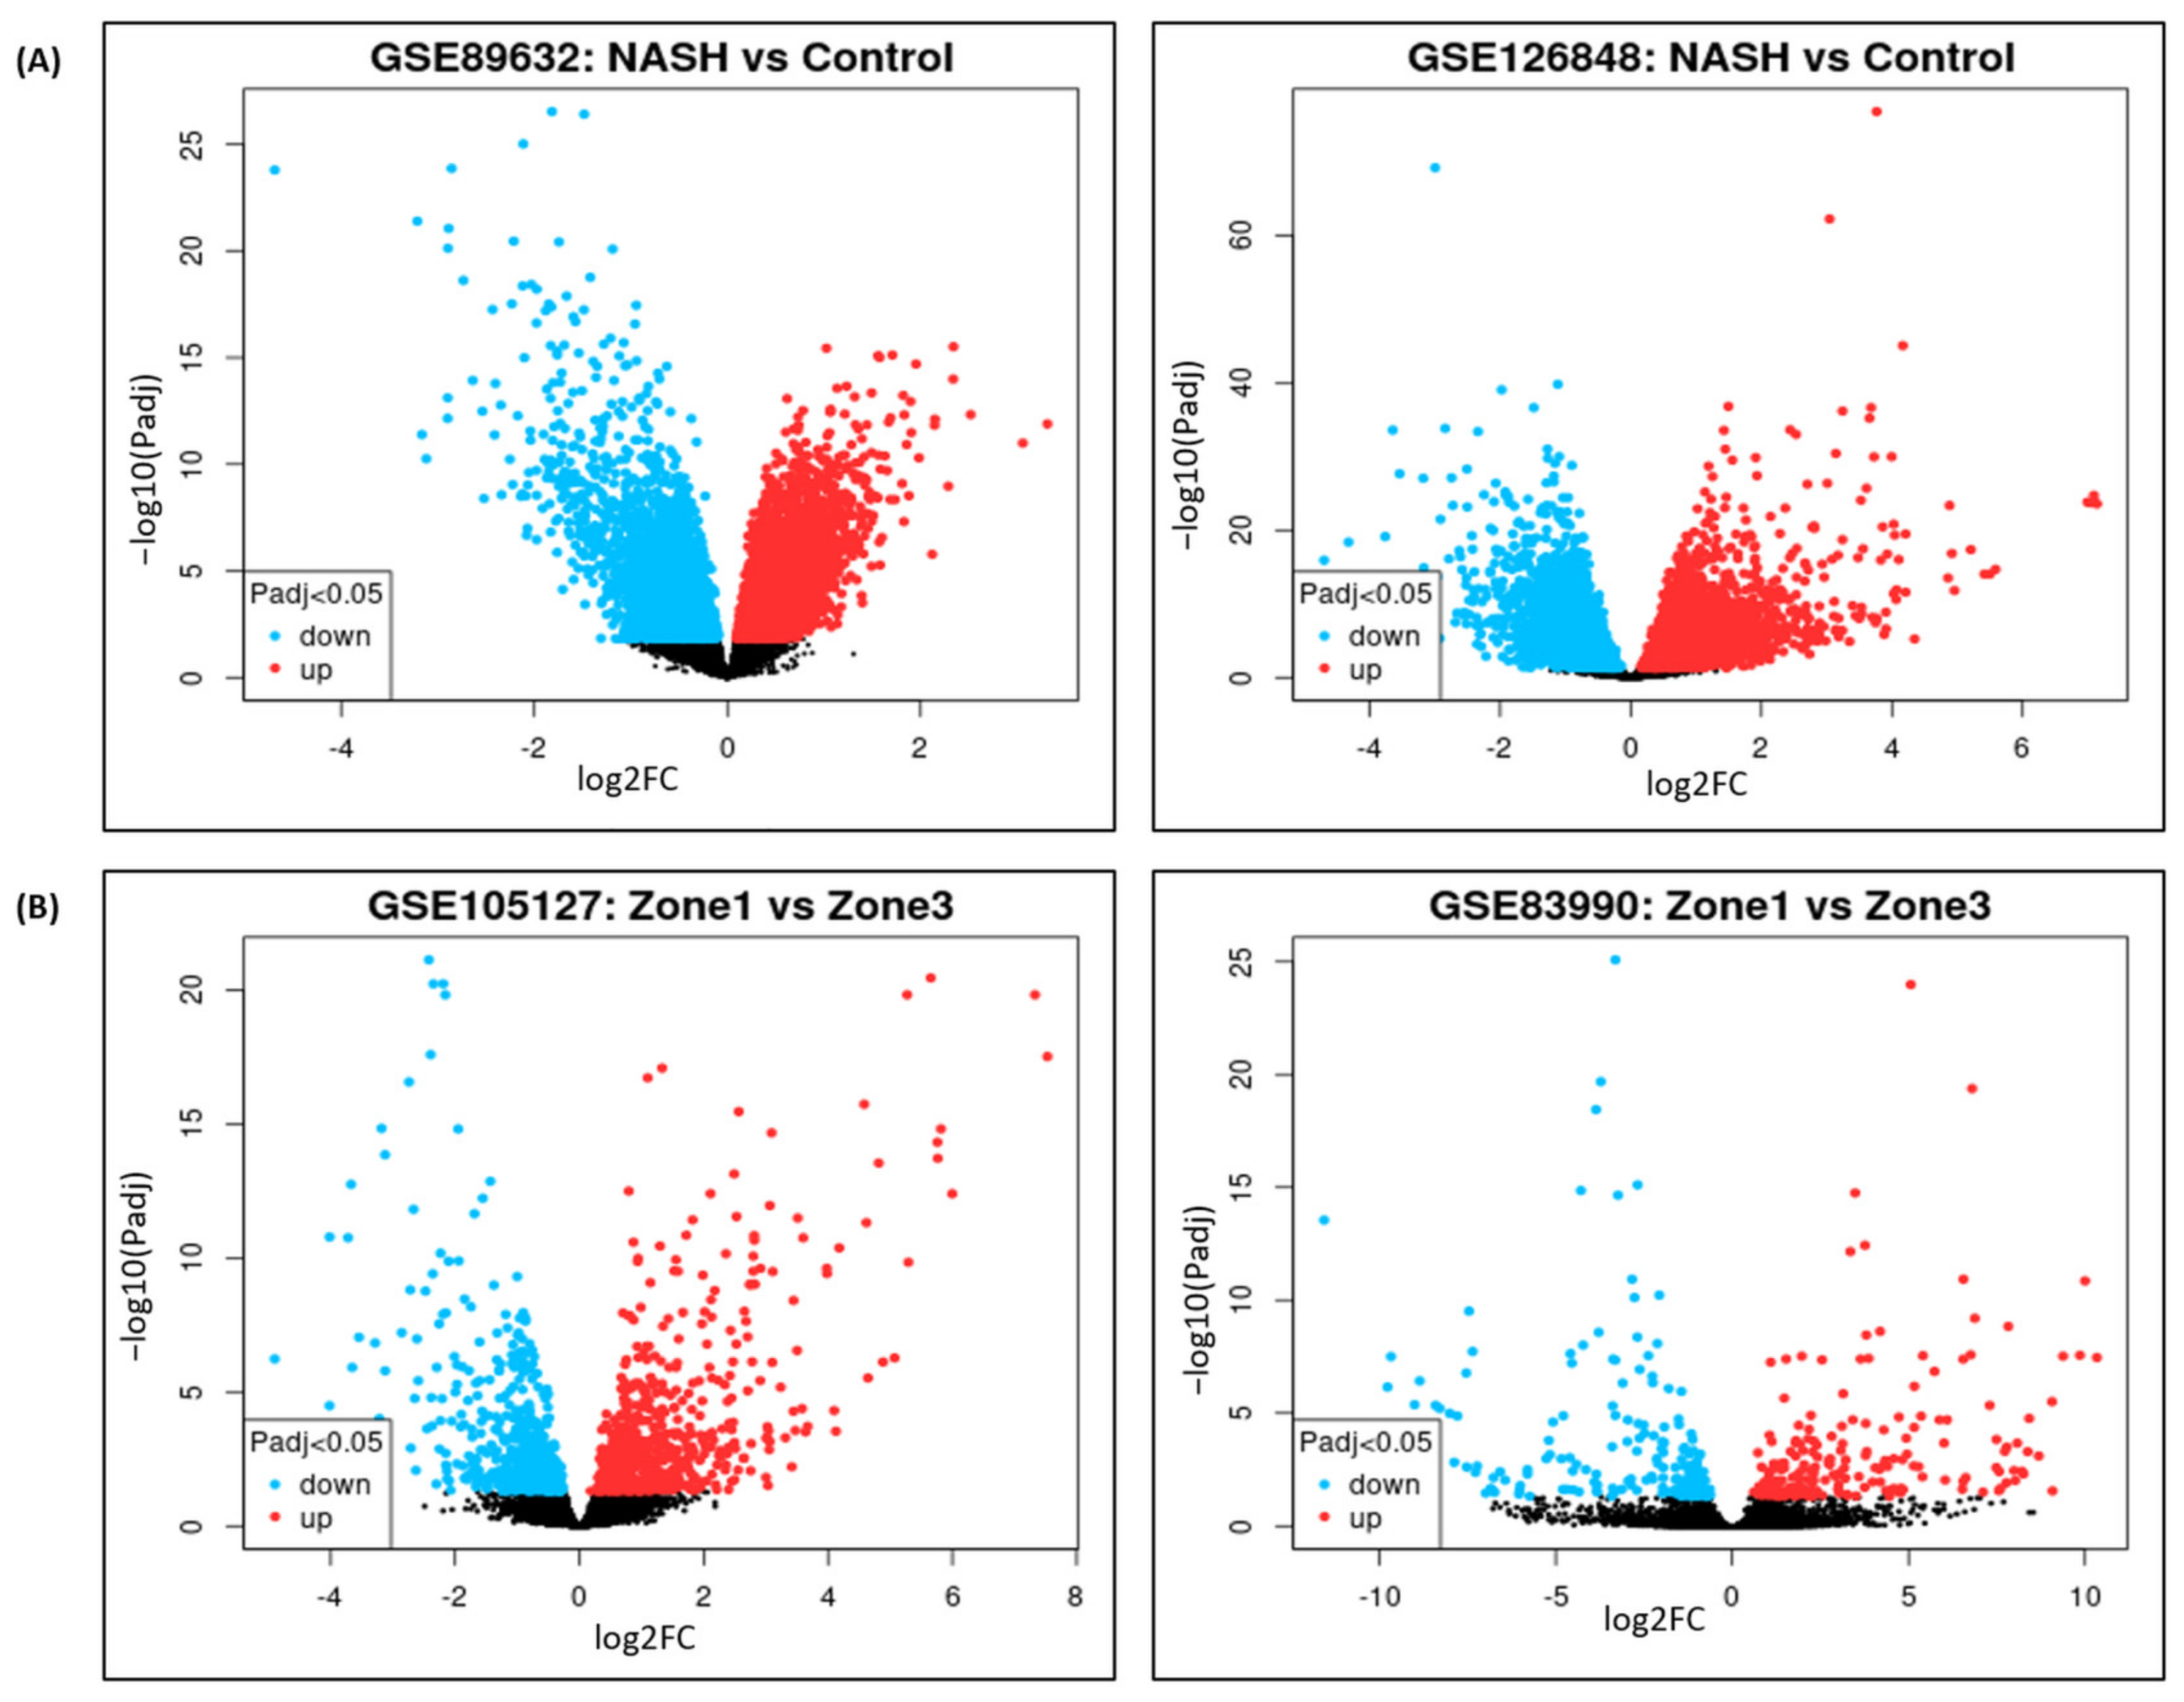
3.2. DGE Analysis for NASH and Zonation Expression

Volcano plots for NASH vs. control are illustrated in Figure 2A, and zone 1 vs. zone 3 expressions are illustrated in Figure 2B. The volcano plots display statistical significance (−log10 p value) versus the magnitude of change (log2 fold change) of differentially expressed genes in NASH vs. control and zonation-specific expression studies. Details of DGEs and the top up/down-expressed genes are summarized in Table 2.

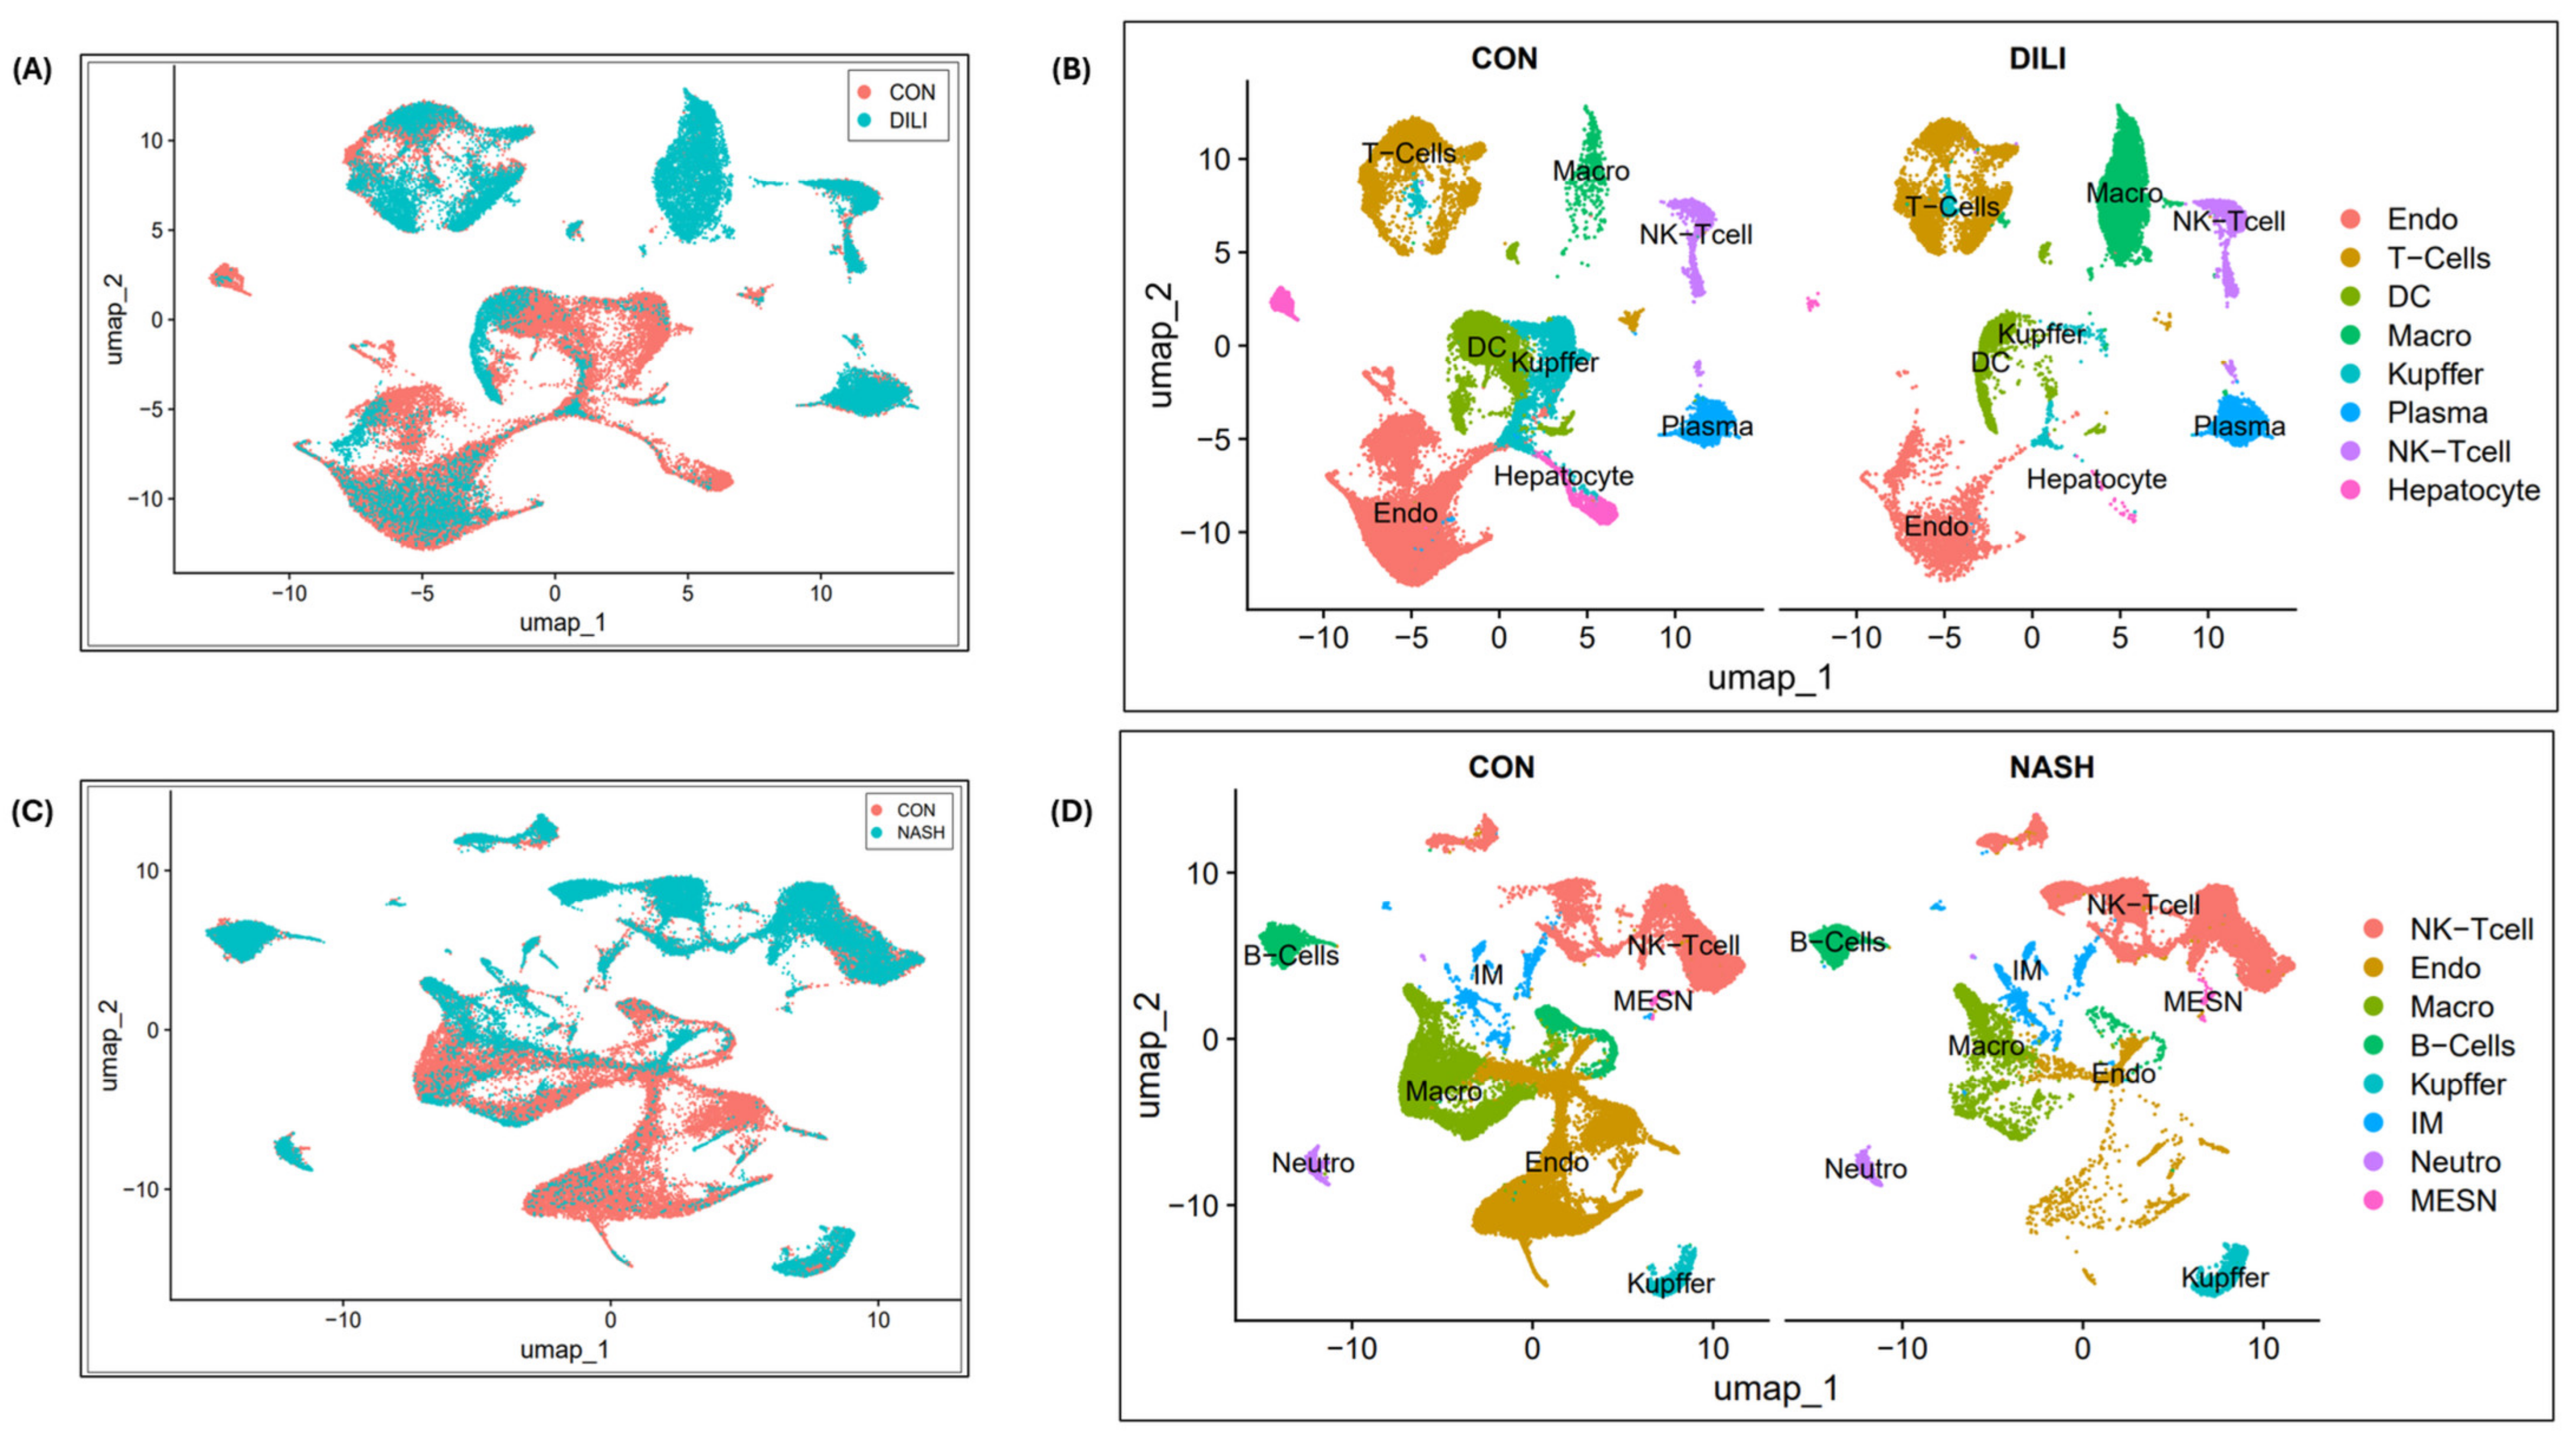
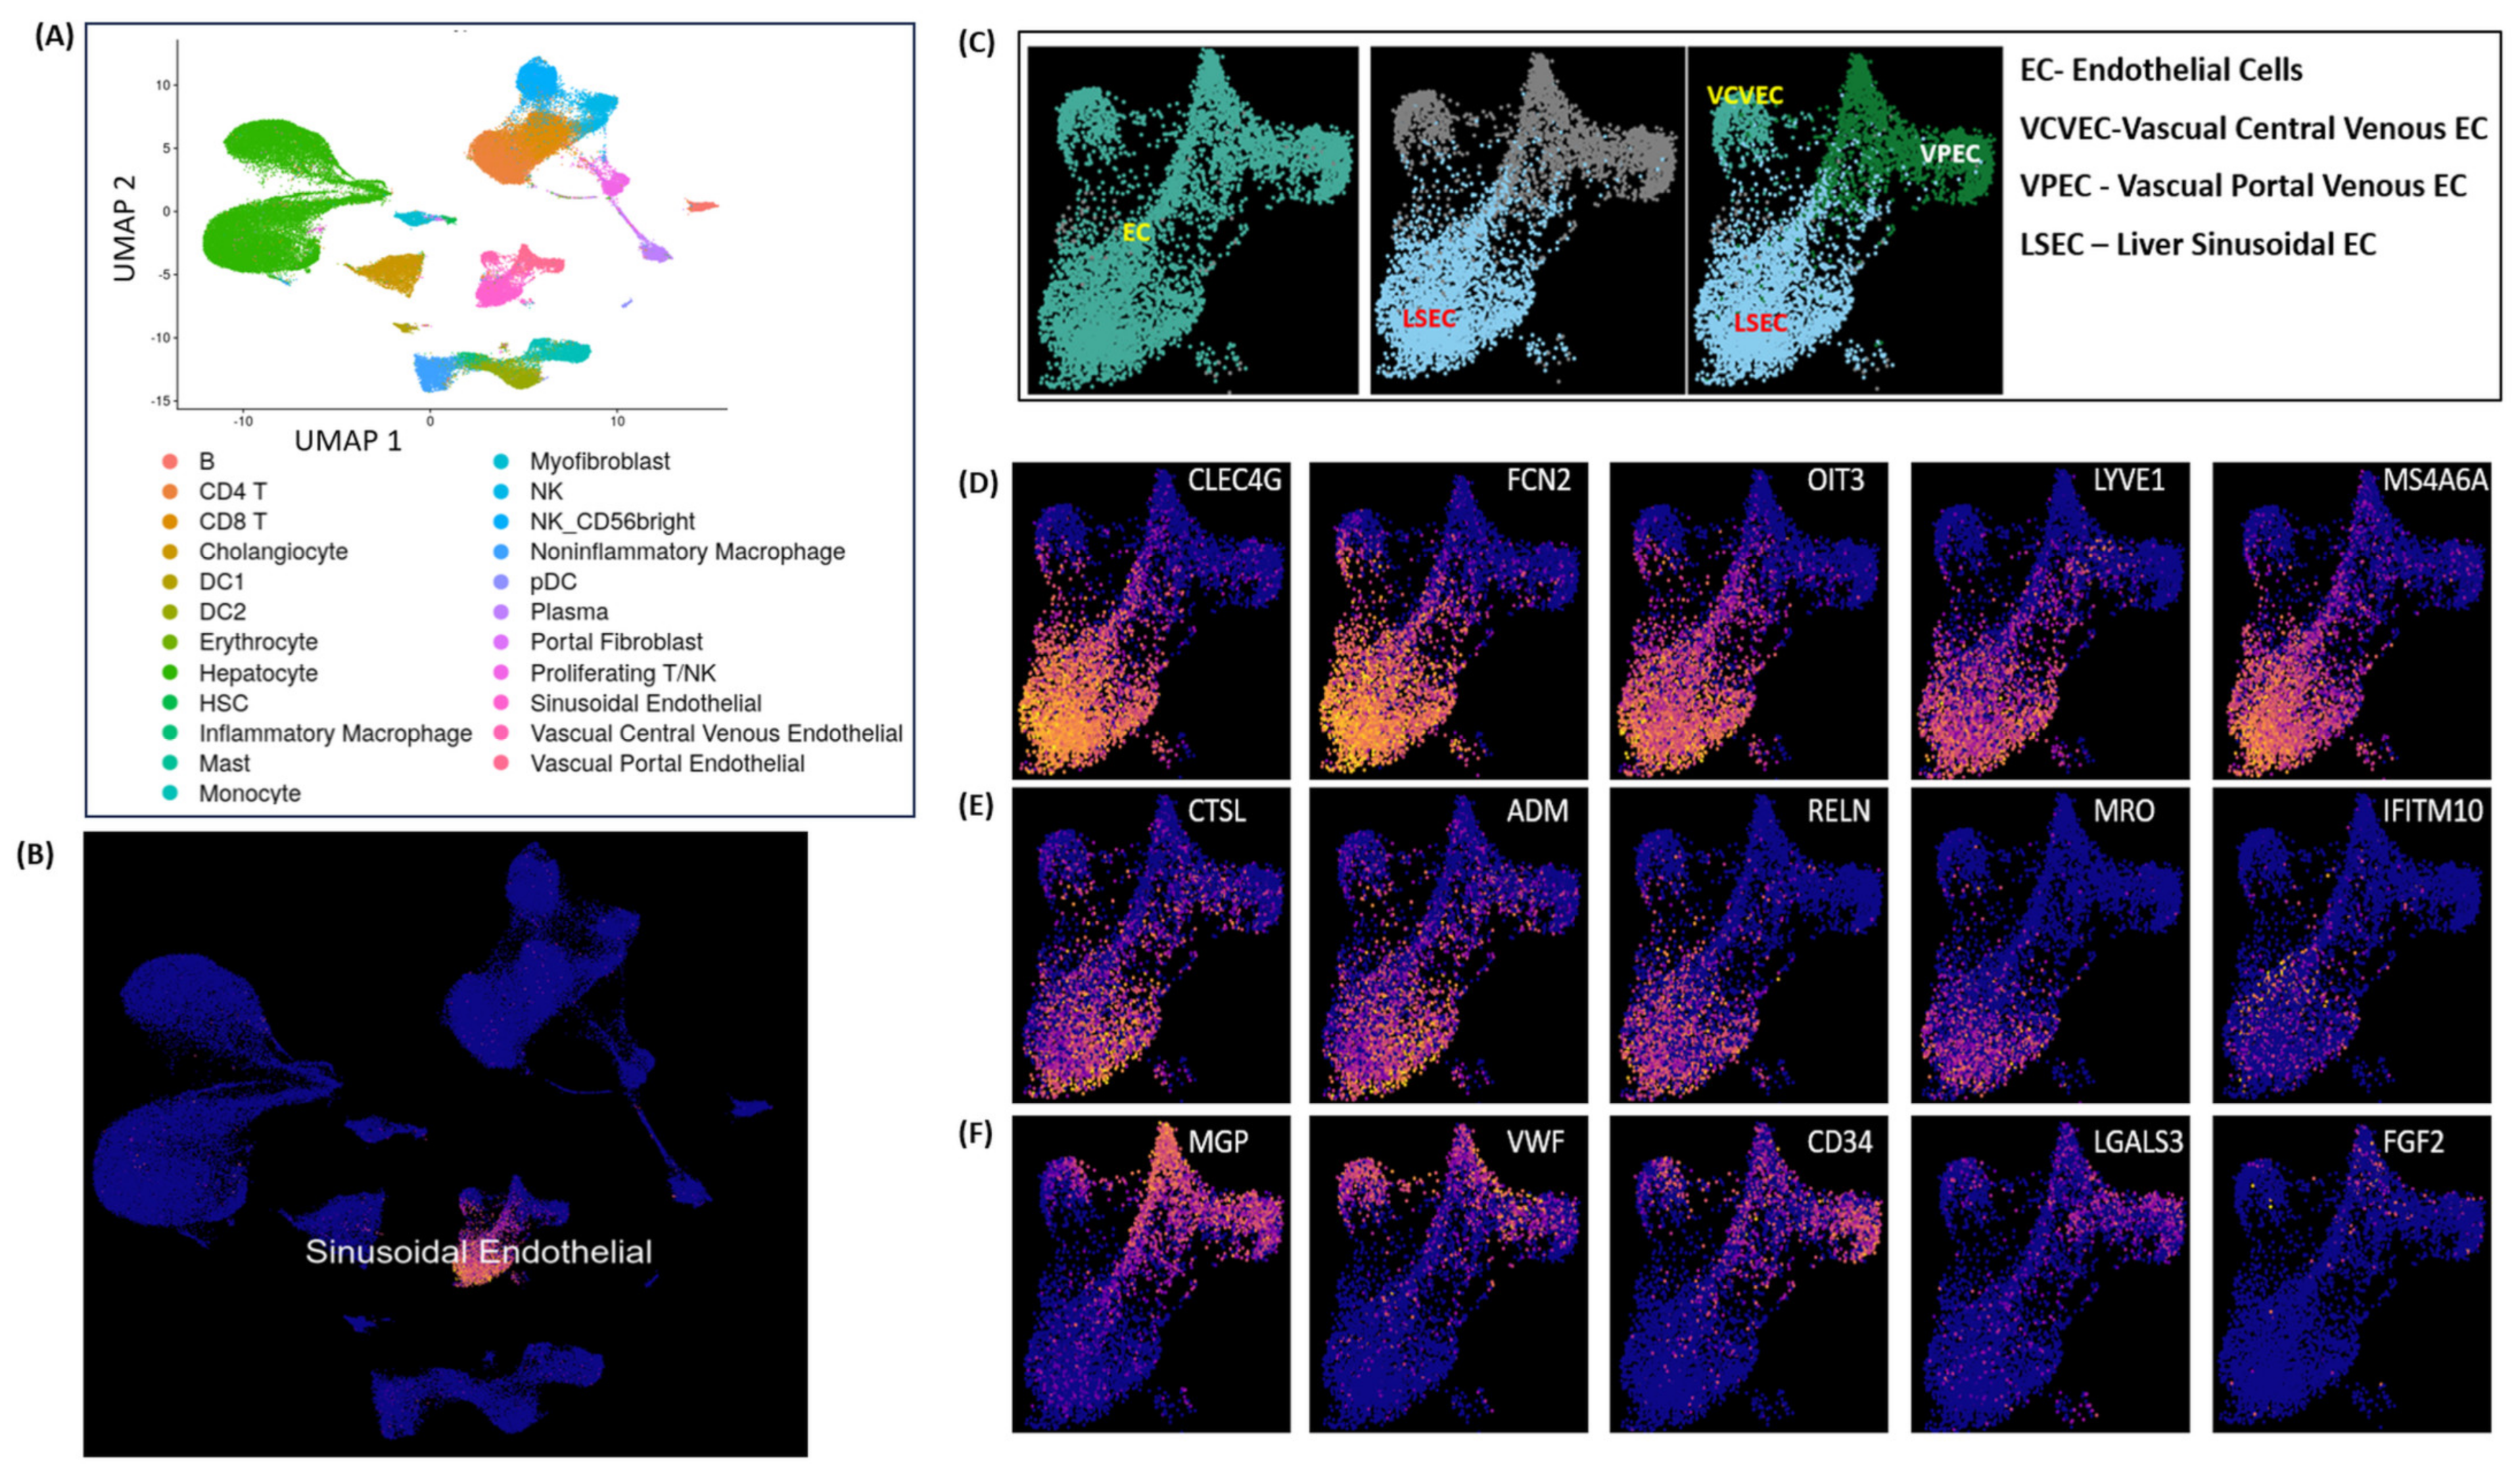
3.3. Single-Cell Clustering and DGE Expression Profiles in DILI and NASH ECs

The single-cell clustering results for control vs. DILI are illustrated in Figure 3A,B, and control vs. NASH are illustrated in Figure 3C,D. The DGE expression in DILI and NASH EC populations is performed over eight commonly expressed genes, STAB2, OIT3, F8, AQP1, TEK, TIMP3, TIE1, and CTSL. Expression profiles are illustrated in Supplementary Figure S1.

3.4. Spatial Transcriptomics Data Analysis for Zonation Marker Genes

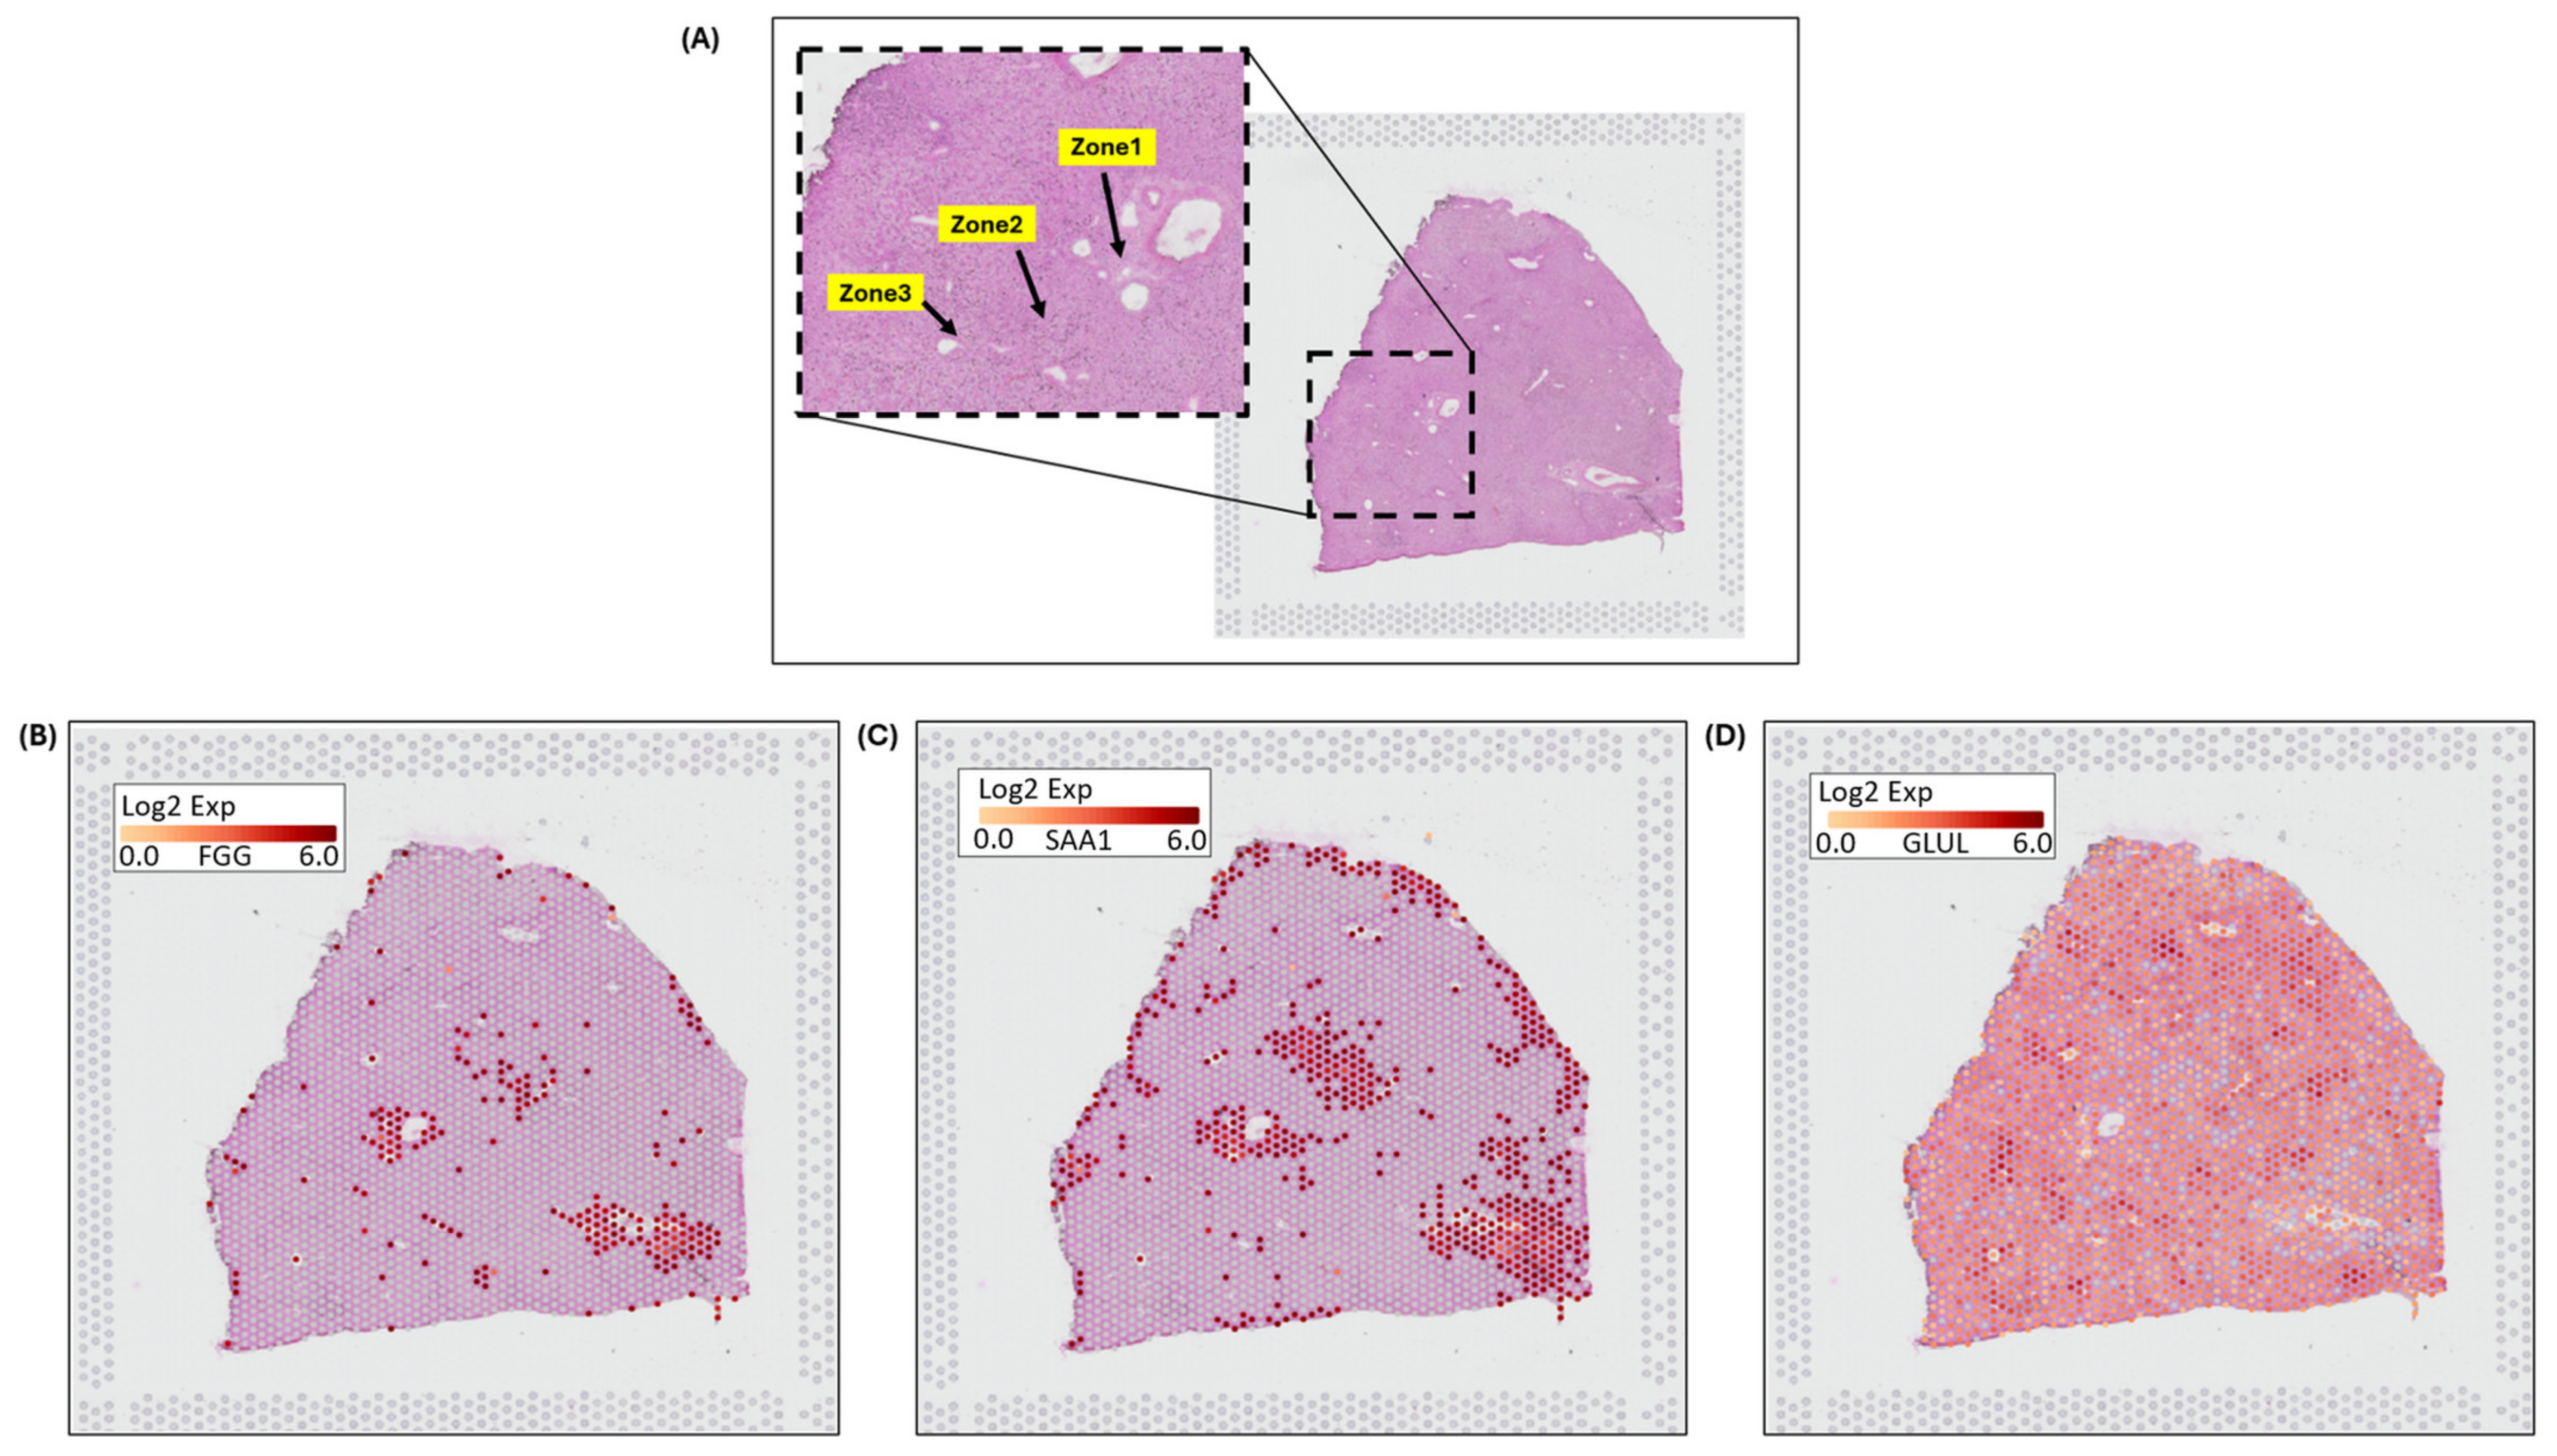
3.4.1. 10x Genomics Visium Image Analysis for Spatial Distribution of Zonation Expression Markers

Spatial transcriptomics (ST) image analysis is performed using 10x genomics Visium platform on H&E-stained healthy human liver images to identify zonation patterns based on known markers [25]. 10x genomics uses the space ranger tool for automated image detection, fiducial marker locations, and to identify tissue boundaries. Expressed dots (red) are the 55-micron Visium spots. Transcriptomes (RNAs) are extracted for studying spatial cellular populations and gene expressions at specific visium spot tissue locations. Figure 4A shows marked zonation areas on H&E stained histopathology normal liver. Figure 4B–D illustrates zonation-specific expressed genes, such as FGG, SAA1, and GLUL overlaid Visium liver tissue images [26]. The expression profiles unraveled zonation expressions in the peri-portal, midlobular, and peri-central zones.

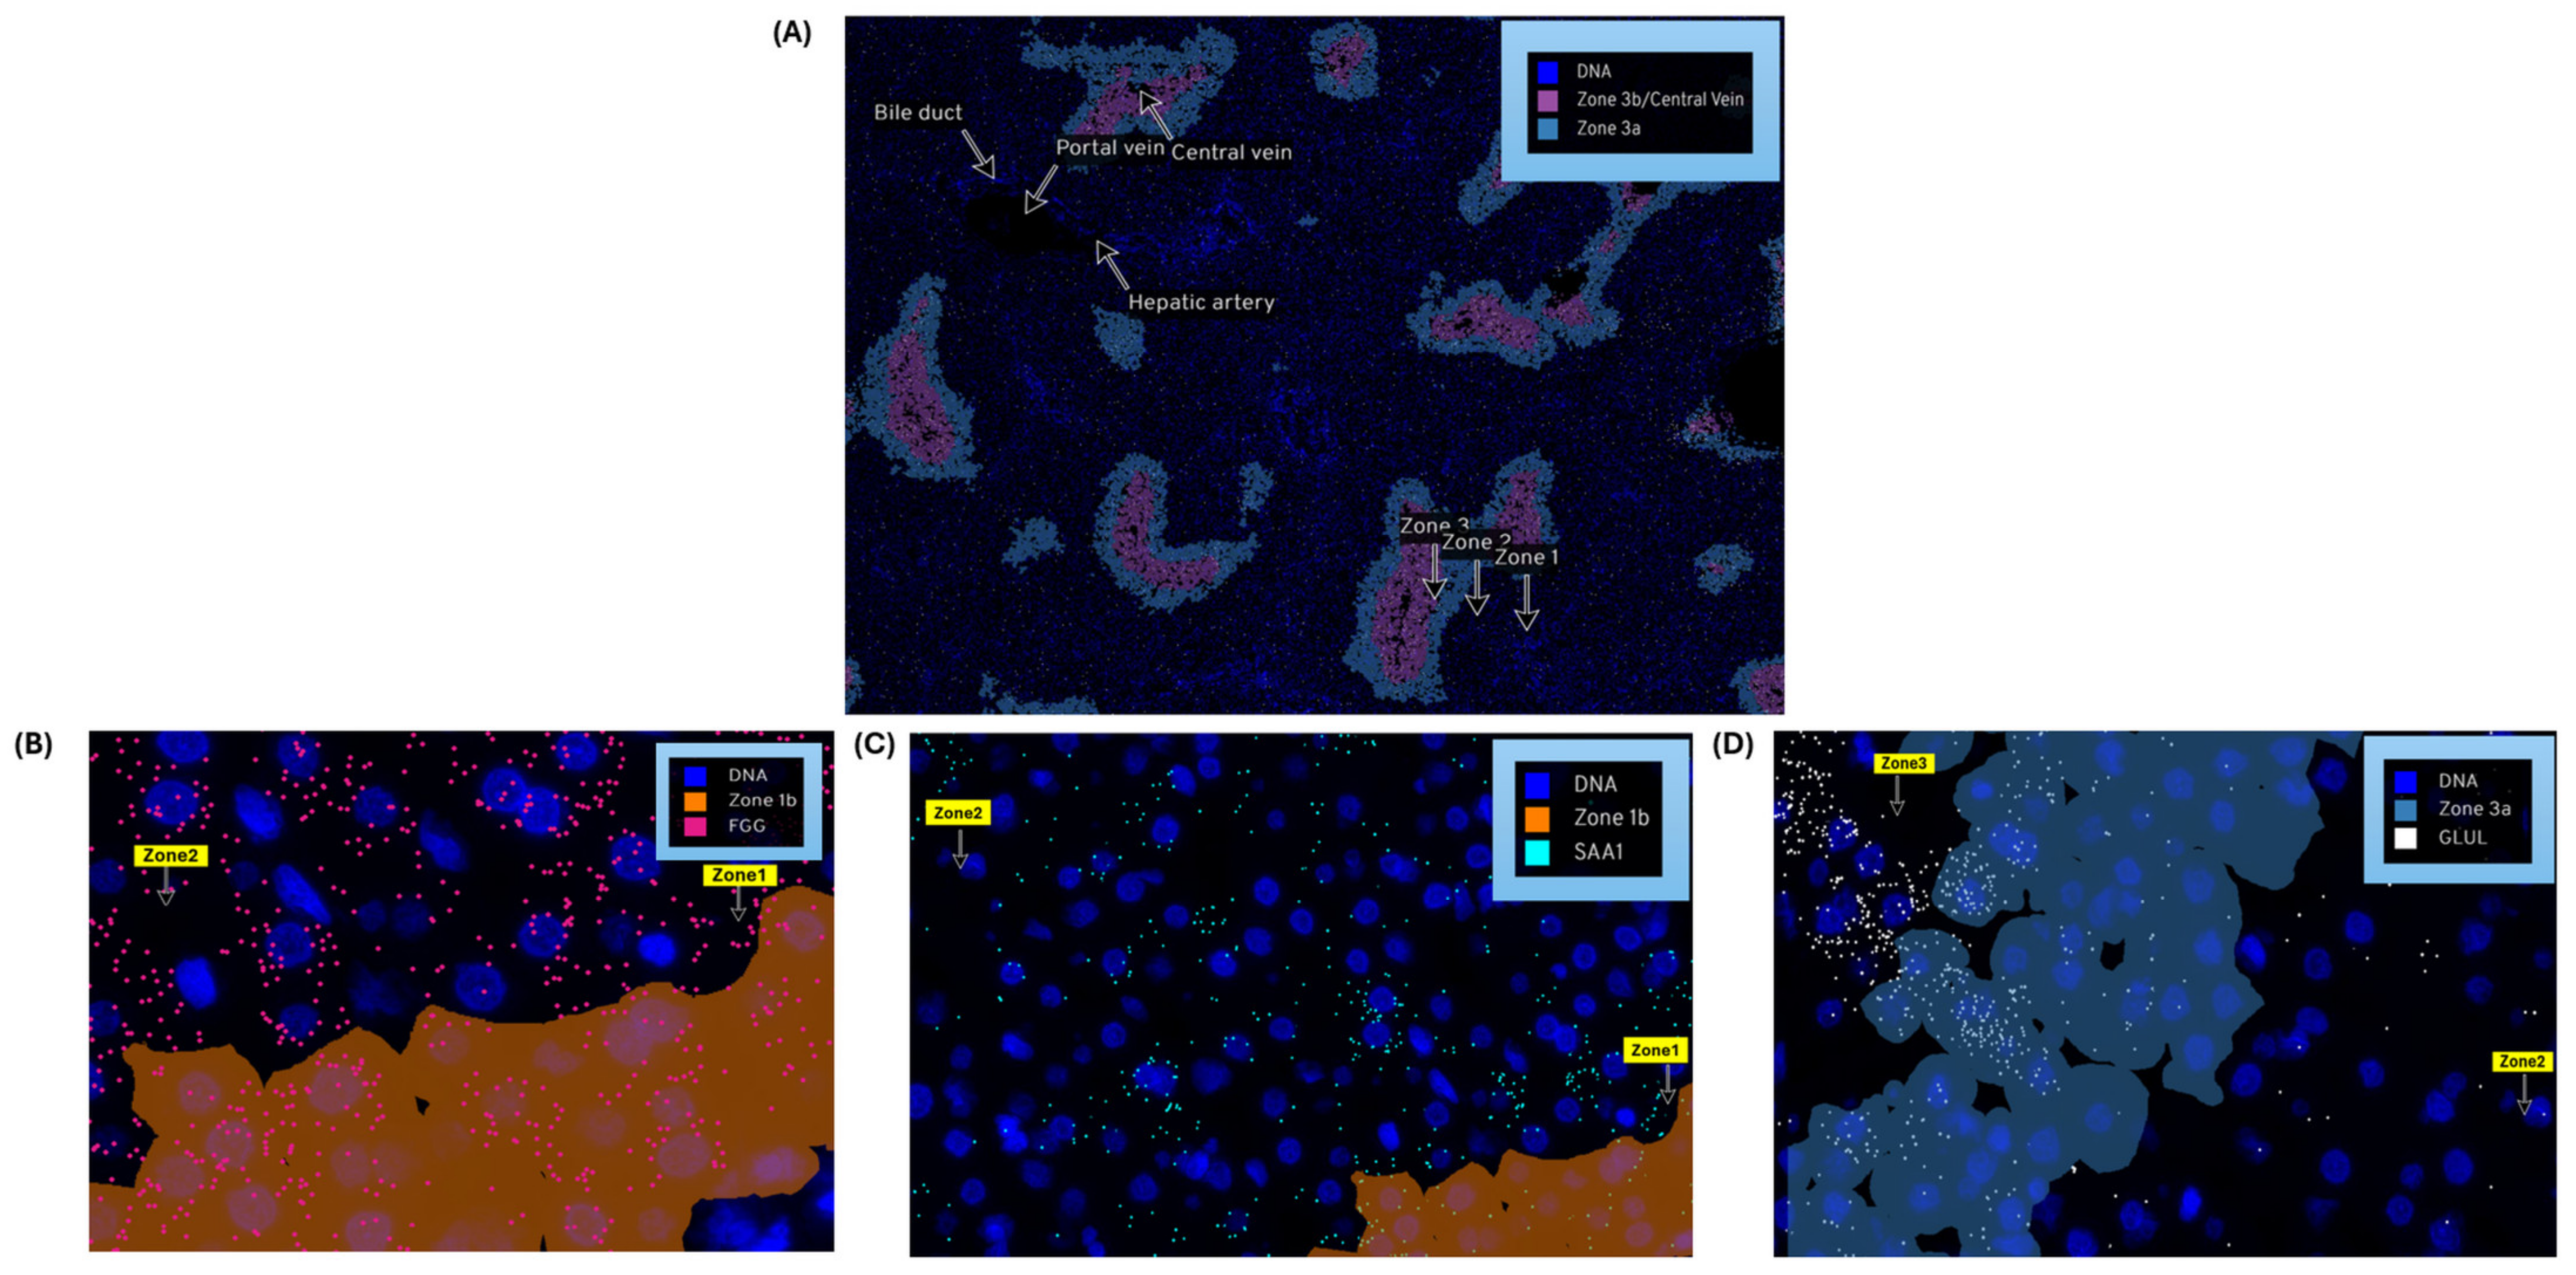
3.4.2. Spatial Molecular Imaging to Demonstrate Liver Zonation Architecture

Nanostring’s CosMxTM Spatial Molecular Imager (SMI) platform, illustrated in Figure 5A, is a high-plex spatial multiomics image generated from a 5 µm thick human formalin-fixed paraffin-embedded (FFPE) liver section stained for both protein and RNA analytes to demonstrate zone 1, zone 2, and zone 3 architecture. Figure 5B–D illustrate differential gene expression with three target markers, i.e., FGG, SAA1, and GLUL, to highlight the zonation boundaries in a healthy liver tissue at molecular resolution. Similar equivalent patterns are demonstrated in 10x genomics Visium images for the same three zonation-specific genes, which highlights zonation boundaries in a normal human liver. However, in the diseased and chronic liver injury conditions, this zonation disruption exhibits varying DGEs.

3.5. Liver Cell Clustering and LSEC Markers

Endothelial cell (EC) clustering data analysis is executed here to demonstrate LSEC gene expression markers on integrated scRNA-seq data of 28 healthy human liver samples. The single-cell scRNA-seq data used here were acquired from five separate independent studies reported elsewhere in [19,20,21,24,27]. Figure 6A illustrates the UMAP clustering of all normal liver cells. The LSEC clusters shown in Figure 6B are picked as a subset of clustered EC cells shown in Figure 6A. Vascual Central Venous ECs (VCVEC) and Vascual Portal Venous ECs (VPEC) are clustered along with LSECs, shown in Figure 6C, which are further separated as subsets and highlighted using ECs and LSECs separately with the CLEC4G, FCN2, OIT3, and LYVE1 expression marker genes illustrated in Figure 6D–E. VCVEC and VPEC clusters were further separated and highlighted using MGP, VWF, and CD34 expression marker genes, illustrated in Figure 6F. VCVEC and VPEC shown in Figure 6C,D are identified based on the list of endothelial cell markers selected from the FindAllMarker() list and plotted at National Institute of Health’s (NIH), Human BioMolecular Atlas Program (HuBMAP) Azimuth app, which is a Seurat-based web application tool that provides clustering of all human normal liver cells (including VCVEC and VPEC).

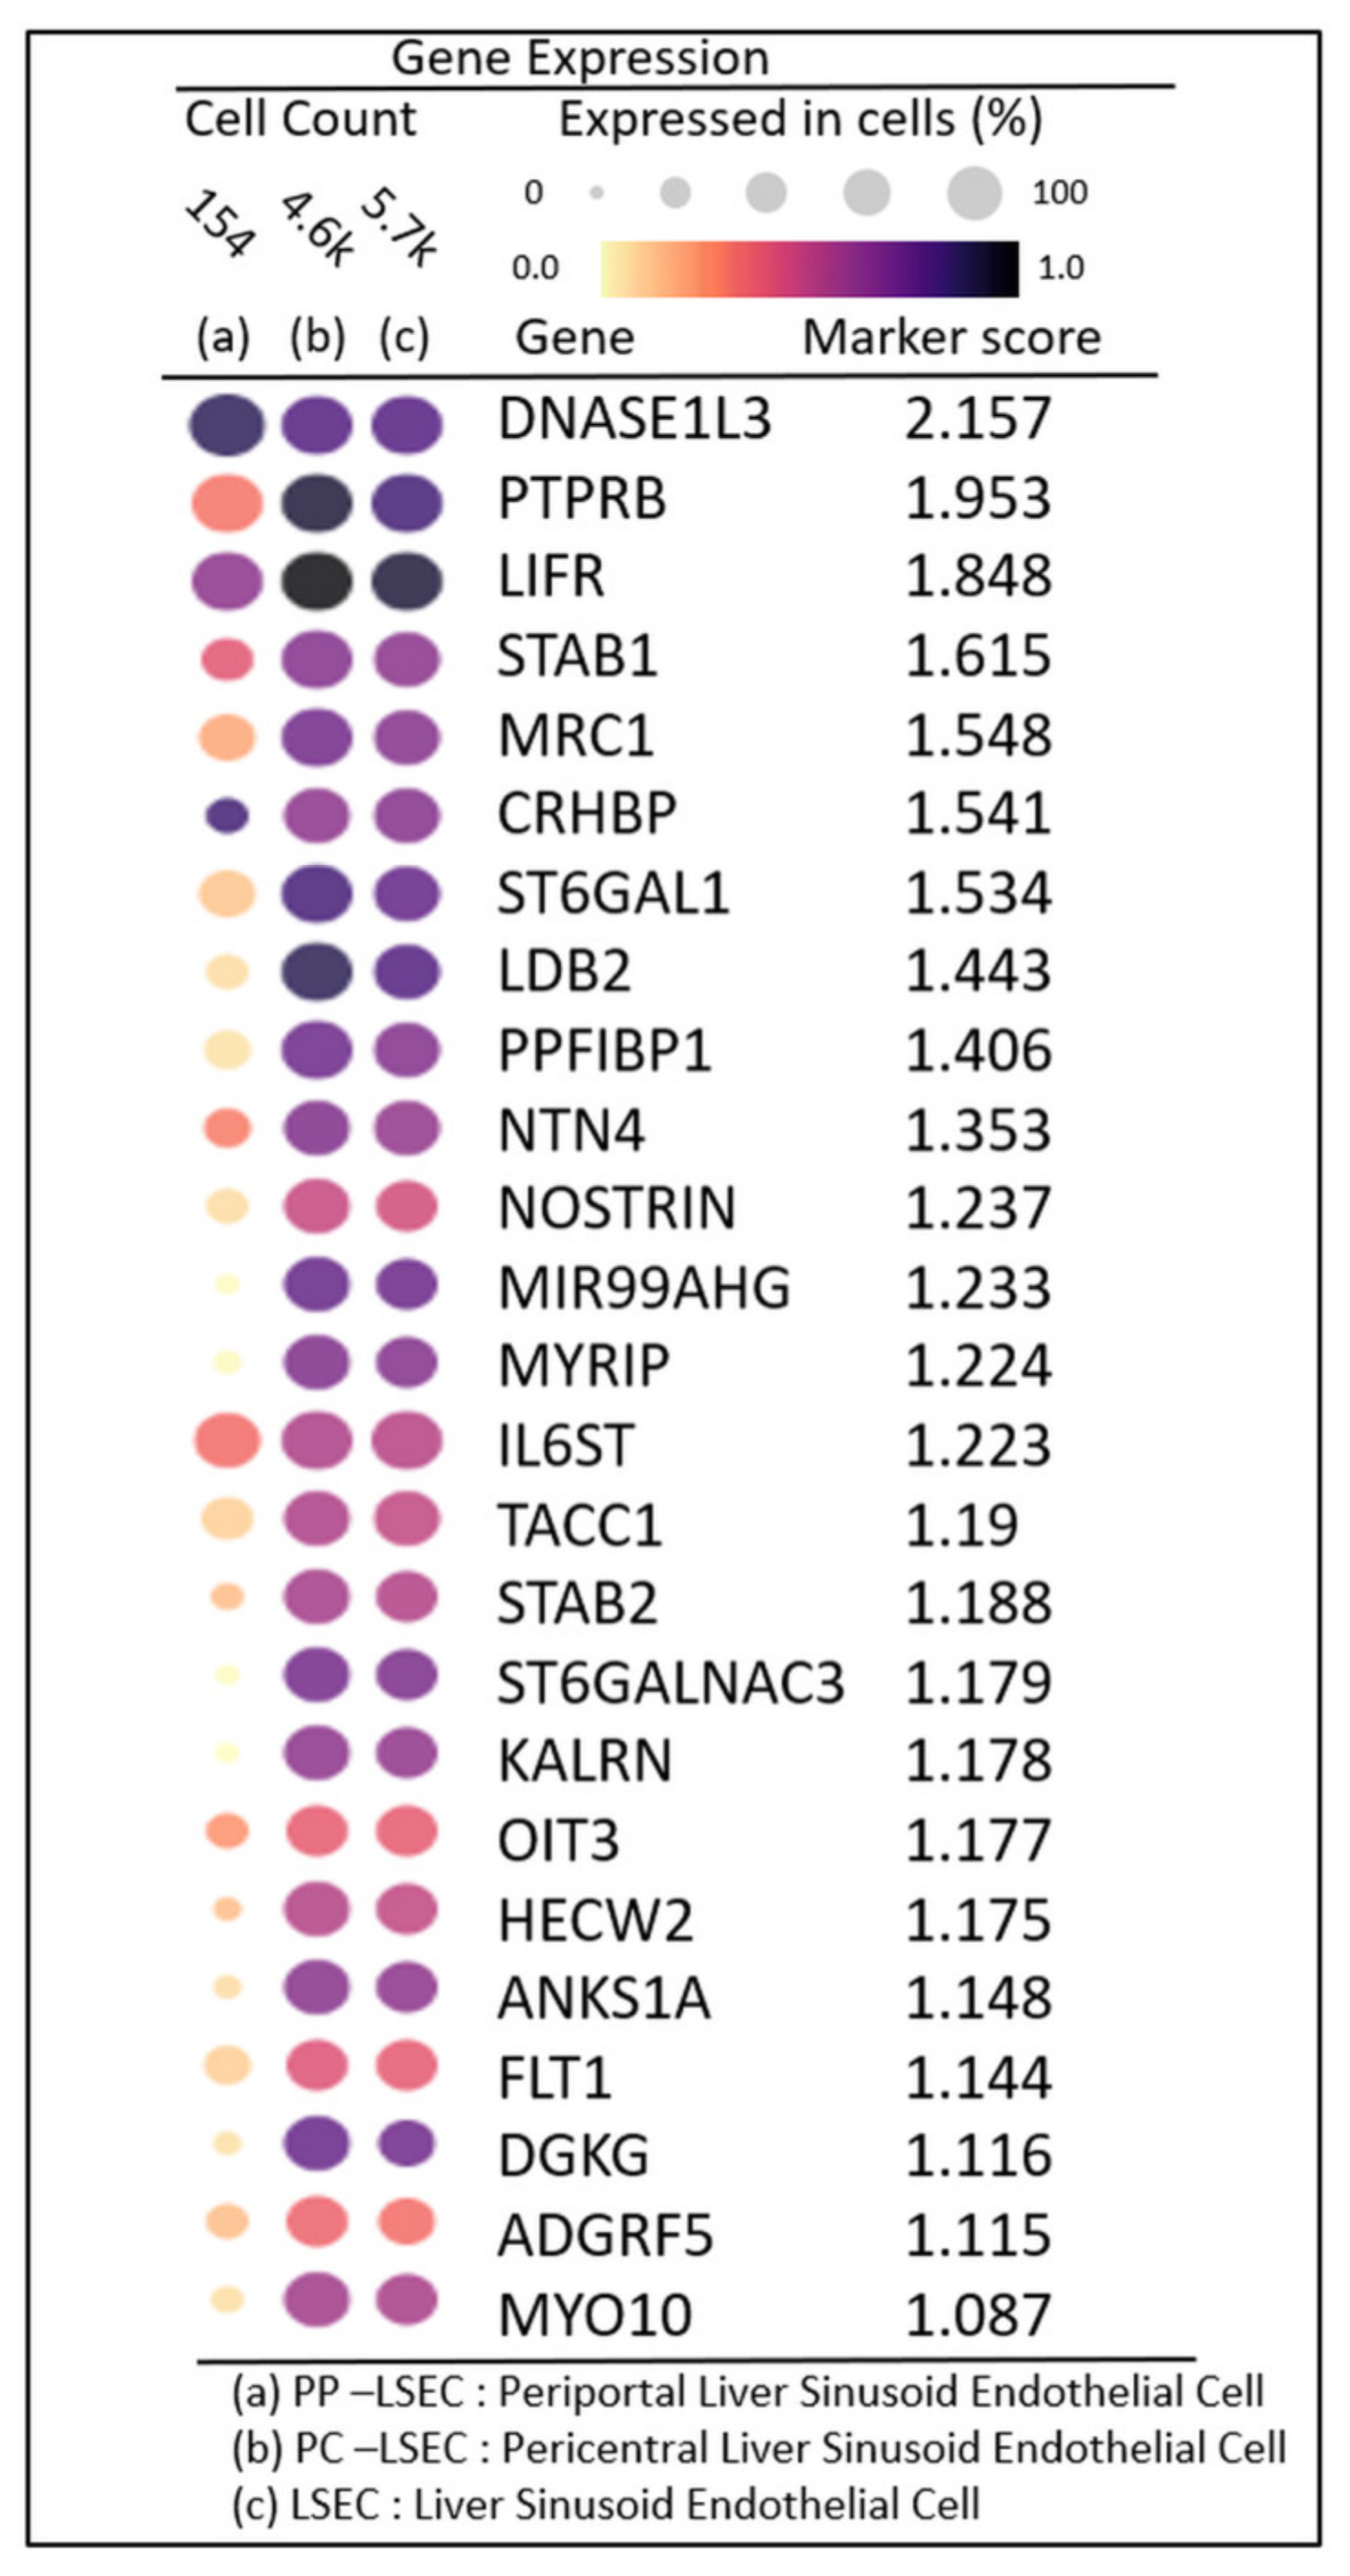
3.6. DGE Profiles in Zonated LSECs

The DGE profiles identified the top 25 highly expressed genes with their marker score in PP−LSEC: Periportal Liver Sinusoid Endothelial Cells PC−LSEC: Pericentral Liver Sinusoid Endothelial Cells and LSEC cells, illustrated in Figure 7. The combination of two metrics represented in gene expression dot plots, i.e., gene expression and percentage of expressing cells, enables us to assess the gene expression within a grid of genes by cell types. The genes that are expressed in a small percentage of cells may be difficult to identify in a dot plot visually. This is particularly important for specific marker genes that are specifically but lowly expressed in their target cell types, for example, transcription factors and cell-surface receptors.
A marker score is the 10th percentile of the effect sizes across all comparisons for each gene. DGE analysis is performed using the cellxgene web tool, a well-curated, standardized, wide collection of interoperable single-cell transcriptomic data platforms available at https://cellxgene.cziscience.com [28]. The five most commonly expressed genes, DNASE1L3, LIFR, STAB1, MRC1, and CRHBP, are detected using cellxgene analysis and confirmed in other datasets [25]. Also, the top 20 expressed genes identified in each zone are summarized in Table 3. The gene list is selected by the single-cell analysis algorithm based on the markers detected through the “FindAllMarkers()” function in the Seurat single-cell analysis R-package. This function identifies differentially expressed genes for each of the identity classes (clusters) in the supplied dataset and builds a list of expressed genes in the given dataset. From this list, 60 genes are picked (tabulated in Table 3), expressed in endothelial cells (20 in each zone). Their zonation expression is further validated in the zonation browser tool and plotted, shown in Supplementary Figure S2. Commonly expressed genes in this group are MRC1, HAL, TIMP1 (zone 1), DNASE1L3, CRHBP, C9 (zone 2) SELE, APOB, and GLUL (zone 3). Their zonation-specific expression is confirmed using the human hepatocyte zonation browser tool, another open-source web platform publicly available web tool [29], illustrated in Supplementary Figure S2.

4. Discussion

This study aims to enhance our understanding of the complex interplay of LSECs in midlobular zone 2 and their role in initiating early fibrosis and regeneration. LSECs’ presence in zone 2 is influential and plays a critical role in determining whether injured hepatocytes will regenerate or be susceptible to fibrosis. Their anti-fibrotic ability to support regeneration is crucial for a successful liver repair process. LSECs secrete extracellular matrix (ECM) components, like laminins, providing a supporting microenvironment for regeneration and ensuring proper tissue restructuring [30].
Understanding the zonation of LSECs at the cellular and molecular levels is crucial, as is quantifying these architectural changes spatially in both healthy and diseased liver conditions. Scarring tissue in NASH and DILI disease models exhibits the common features of liver fibrosis. In this study, OIT3 is computationally identified as a commonly expressed marker gene in midlobular zone 2 by the LSEC cell population, both in the NASH and DILI datasets. This is consistent with another study that reported OIT3 as a hallmark gene expressed in ECs [31]. The second-most prominent gene identified is DNASE1L3. Other zonation-specific marker genes identified in our study are MRC1, HAL (zone 1), CRHBP, LYVE1 (zone 2), SELE, and GLUL (zone 3). Protein F8 secreted by LSECs [32] plays an important role in blood clotting and is another marker gene detected in our experiment on the GSE166178 dataset as a highly expressed zone 2 marker gene and confirmed by the zonation browser tool. Also found in this series were STAB2, CLEC4G, and LYVE1 genes as midlobular zone 2 markers and confirmed as an expressed healthy human liver [6,7]. STAB2 is primarily expressed in LSECs and is clinically relevant [33,34]. Gene AQP1 (Aquaporin-1) promotes angiogenesis, fibrosis, and portal hypertension and is reported as overexpressed in endothelial cells in advanced fibrotic stages such as cirrhosis [35], which exhibits similar trends of overexpression in our dataset, illustrated in Supplementary Figure S1. Also, LYVE1 was found among the genes with increased expression, suggesting several possibilities: (a) Lymphangiogenesis: this might promote the formation of new lymphatic vessels, potentially contributing to inflammation and fibrosis progression. (b) Endothelial cell activation: LYVE1 upregulation could indicate a shift in the function of sinusoidal endothelial cells towards a more pro-fibrotic phenotype. (c) Scar tissue remodeling: lymphatic vessels may play a role in clearing collagen debris and remodeling scar tissue during the later stages of fibrosis.
The liver displays unique spatial heterogeneity and functioning of hepatocytes by exhibiting distinct metabolic and functional profiles across different acinar zones (periportal, perivenous, and intermediate). Specific enzymes, transporters, and other proteins act as zonation markers, reflecting the specialized functions of each zone. 10x genomics Visium platform and Nanostring’s CosMx technologies were used here to demonstrate these changes at the molecular level and confirmed by the zonation browser tool as zonation-specific, i.e., GLUL as zone 3, FGG as zone 2, and SAA1 as zone 1 expressed marker genes.
In Figure 3D, single-cell analysis exhibits a reduction in endothelial cell numbers, which is mainly observed in NASH patients [12]. The potential mechanisms may explain the observed reduction in endothelial cell numbers in the NASH liver: (1) Oxidative stress: NASH is characterized by increased oxidative stress and endoplasmic reticulum (ER) stress, which can trigger endothelial cell apoptosis and necrosis. (2) Inflammatory response: chronic inflammation in the NASH liver can release pro-inflammatory cytokines and chemokines, further promoting endothelial cell damage and apoptosis. Single-cell data have revealed interactions between endothelial cells and macrophages in NASH, suggesting that these interactions might contribute to endothelial cell loss in NASH. Furthermore, macrophages in DILI are not a homogenous population. Depending on the microenvironment and stimuli, they can adopt different phenotypes with distinct functions. DILI attracts pro-inflammatory cells like macrophages, which can further damage endothelial cells and impair their normal function. Single-cell analysis in DILI, illustrated in Figure 3B, shows a growing trend of macrophages, which could be due to their activated role, often associated as pro-inflammatory in the DILI disease model [36].
In NASH-related fibrosis, DGEs in zone 1 might be related to lipid metabolism and oxidative stress, while zone 3 DGEs could be involved in inflammation and bile acid signaling. Similarly, in a specific DILI drug, DGEs might be related to mitochondrial dysfunction, immune response, or direct cell injury in specific zones. Fibrosis is caused by long-term chronic liver injury and is considered a hallmark disease feature of both NASH and DILI progression. This disrupts the liver architecture and function, leading to potential organ failure. Different genes might be driving fibrosis in each zone, suggesting targeted therapies for each zonated area.
DILI is a challenging disease to diagnose, a leading cause of acute liver failure, and responsible for drug withdrawal from the market. Computational biomarkers could be helpful as emerging new technologies in the diagnosis of DILI and NASH-related fibrotic patterns [37]. DGEs could serve as early diagnostic or prognostic biomarkers for fibrosis progression in NASH and DILI. DGE analysis in the NCBI GEO GSE126848 study identified UQCRB as the most upregulated gene in NASH and confirmed as a zone 2 marker, which is reported in a different study as a molecular prognostic biomarker in human colorectal cancer [38]. DGE expression profiles identified five other commonly expressed genes, such as DNASE1L3, LIFR, STAB1, MRC1, and CRHBP. Table 3 summarized the top 20 highly expressed genes in PP–LSEC and PC-LSEC, such as MRC1, HAL, TIMP1 (zone 1), DNASE1L3, CRHBP, C9 (zone 2) SELE, APOB, and GLUL (zone 3).
Spatial omics is a powerful technique that allows researchers to analyze the gene expression at a microscopic level within tissues. These high-resolution data can provide insights into the complex cellular organization of the liver and how it changes in different liver diseases. Informatic analysis of spatial omics data can help to identify patterns of gene expression and protein localization that are associated with specific liver diseases. These patterns can then be used to develop predictive tests for diagnosing or staging liver diseases: (1) NASH is a more severe form of liver disease. Spatial omics analysis could be used to identify patterns of gene expression that differentiate between MASLD and NASH. These patterns could then be used to develop a test to predict which patients with MASLD or other related liver diseases are more likely to progress to NASH. (2) DILI is a liver injury caused by medications. Spatial omics analysis could be used to identify the specific cell types in the liver that are most susceptible to damage from different drugs. This information could then be used to develop new drugs that are less likely to cause DILI.
Further analysis of these patterns could be used to investigate other interesting aspects, such as the role of the gut microbiome in liver disease. Spatial omics analysis could be used to investigate how the gut microbiome interacts with the liver at a cellular level. There is growing evidence that the gut microbiome plays a role in liver disease. An imbalance in the gut microbiome can contribute to various liver diseases [39,40]. This might impact the liver by increasing intestinal permeability and chronic inflammation. An unhealthy gut microbiome can lead to a leaky gut, where the intestinal barrier weakens, allowing harmful bacteria and their products to enter the bloodstream and potentially reach the liver.
H&E histopathology images are still considered as the gold standard in pathology [41] for the analysis and detection of early fibrotic lesions. Also, the 10x genomics Visium platform uses tissues for extracting transcriptome and histopathology H&E-stained images to align Visium spots (extracted transcriptome locations) for studying cellular heterogeneity and spatial analysis [42]. Fibrosis is the formation of scar tissue in response to liver injury or disease. A machine learning-based histopathology image classification model is designed here to understand these fibrosis development stages on H&E-stained images, i.e., starting from normal lobular liver architecture and then how the zonal pattern of fibrosis (collagen fibers) develops in early fibrosis, bridging fibrosis, and cirrhosis. This approach can be used further for the prediction of fibrosis in other datasets used in this study. DGE analysis of liver zonation can provide valuable insights into the mechanisms and identification of potential therapeutic targets for fibrosis in NASH and DILI.
The limitation of this study is that DGE analysis alone is not sufficient to fully elucidate the early stages of fibrosis in complex diseases like NASH and DILI. Integrating these analyses with other datasets, such as protein expression and metabolic profiling, is required for analysis in normal and diseased conditions. More research is needed to validate DGEs as reliable zonation markers and translate them into effective diagnostic and prognostic biomarkers. Investigating LSECs in the context of both zonation and fibrosis holds significant promise for developing novel therapeutic strategies against liver diseases. This may help to protect zonation patterns, prevent fibrosis development, and ultimately improve liver health.

5. Conclusions

The healthy mammalian liver lobule is spatially well zonated and recognized by known markers based on the distribution of metabolic functions, which are disrupted in pathological conditions and liver injury. However, due to hepatocyte heterogeneity, these zonation markers, such as enzymes, metabolites, and gene expression patterns, vary in their expression and activity, even within the same lobule. These molecular markers are not (1) zonation-specific or (2) disease-specific; for example, the expression and distribution of specific molecules within the liver change during fibrogenesis in NASH and DILI. LSECs play an essential and intricate role in the early stages of liver fibrosis and regeneration during mid-lobular zonation restructuring. Their strategic position allows them to act as critical conductors in influencing the delicate balance between tissue repair and scarring. Emerging trends in new technologies, such as scRNA-seq, spatial transcriptomics, and multiomics, can be helpful in determining the role of LSECs in identifying the zonation marker DGEs at the cellular and molecular levels. LSECs can provide valuable insights into how zonation marker variations and fibrosis are interconnected. The goal of this study is primarily to establish a baseline to understand which normal liver zones might experience changes, specifically midlobular zone 2 during early fibrosis, liver injury conditions, or in the stages of advanced fibrosis.
This study identified the zonation-specific midlobular markers of LSECs. STAB2 family genes are the most highly expressed genes in liver LSECs related to fibrosis detected by this study, illustrated in Supplementary Figure S1. The STAB2 expression profiles in LSECs are clinically relevant for liver health, fibrosis, and disease susceptibility. The dysregulation of STAB2 expression in LSECs may impact hyaluronan (HA) clearance, contributing to liver fibrosis. In liver disease, altered STAB2 expression could affect the scavenging function of LSECs, influencing disease progression. Gene profiles in the midlobular zone hold significant clinical relevance towards developing new therapeutic strategies. LSEC-specific gene profiles can guide the development of targeted therapies for fibrosis. By identifying genes involved in fibrosis progression within LSECs, researchers can develop drugs or other interventions that specifically target these pathways. Liver fibrosis in its early stages can be reversible if detected in zonation at the molecular level before moving to advanced stages like bridging fibrosis. Current diagnostic methods often lack accuracy in the early stages of liver fibrosis. Diagnosis of DILI in its early stages is an important but complex and challenging task. Accurate evaluation and causality assessment are the critical aspects of early detection. This is where computational biomarkers derived from integrated multi-omics, cellular, and molecular data hold immense promise for providing a deeper understanding and improved diagnosis of NASH and DILI-related liver fibrosis.
NASH and DILI are complex diseases, and unraveling their secrets requires a powerful orchestra of technologies. Efforts are made here to leverage the latest advancements in single-cell analysis, histopathology, spatial transcriptomics, and multi-omics, playing their part in deciphering cellular diversity and unveiling the cell state transitions involved in fibrosis developments. The integration of other technologies with histopathology serves as a valuable platform for spatially correlating single-cell data with tissue morphology. This allows researchers to link gene expression patterns to specific cell locations and structures within the liver, adding a crucial spatial dimension to develop their understanding of fibrosis developmental stages. By combining these powerful tools, researchers can create a rich, multidimensional picture of liver fibrosis in NASH and DILI. This holistic understanding can lead to the identification of novel therapeutic targets, improved diagnosis, prognosis, and the development of personalized medicine by understanding the unique molecular signatures of individual patients.
Studying liver zonation fibrosis in NASH and DILI using new technologies offers significant novelty and holds great promise for advancing our understanding of these complex diseases. These new technologies offer a revolutionary approach to studying liver zonation fibrosis in NASH and DILI. Their ability to reveal previously hidden cellular and spatial heterogeneity, pinpoint molecular drivers, and elucidate disease mechanisms will significantly improve our understanding of fibrosis progression and ultimately lead to the development of more effective and personalized therapeutic strategies.

Supplementary Materials

The following supporting information can be downloaded at: https://www.mdpi.com/article/10.3390/ijtm4020012/s1. Figure S1. Expression profiles of eight commonly expressed genes STAB2, OIT3, F8, AQP1, TEK, TIMP3, TIE1, CTSL in DILI and NASH ECs populations (AB) for control vs DILI; (CD) for control vs NASH. Figure S2. Zonation browser window: Illustrating normalized expression profiles of zone 1, zone 2 & zone 3 genes detected as LSECs and fibrosis-related markers. Figure S3. Expression profile LSECs markers; (A) OIT3 and CLEC4G are reported as hallmark genes expressed in LSECs and involved in fibrosis, illustrating and confirmed here as strongly expressed (validated in HuBMAP Azimuth liver reference cell dataset (left) and shown in zonation browser window (right), (B) expression for same two genes are validated at http://liveratlas-vilarinholab.med.yale.edu/, accessed on 20 December 2023; (C) zone 2 expression tested for other detected genes here (shown in zonation browser window) with mild-to-medium expression in LSECs.

Funding

This research received no external funding.

Institutional Review Board Statement

Not applicable.

Informed Consent Statement

Not applicable.

Data Availability Statement

The tool used for building machine learning image classification model is freely available (link provided in the text) open-source fully user-friendly (no python coding required) GUI (Graphical User Interface), which works on drag-n-drop widgets (building blocks) method. Classifiers can be designed based on the workflow developed here, shown in Figure 1D. Information can be shared on trained classifier, designing methodologies, and building experimental workflow upon request.

Conflicts of Interest

The author declares no conflicts of interest.

References

  1. Devarbhavi, H.; Asrani, S.K.; Arab, J.P.; Nartey, Y.A.; Pose, E.; Kamath, P.S. Global Burden of Liver Disease: 2023 Update. J. Hepatol. 2023, 79, 516–537. [Google Scholar] [CrossRef]
  2. Ben-Moshe, S.; Itzkovitz, S. Spatial Heterogeneity in the Mammalian Liver. Nat. Rev. Gastroenterol. Hepatol. 2019, 16, 395–410. [Google Scholar] [CrossRef] [PubMed]
  3. Itoh, T. The Truth Lies Somewhere in the Middle: The Cells Responsible for Liver Tissue Maintenance Finally Identified. Cell Regen. 2021, 10, 28. [Google Scholar] [CrossRef]
  4. Wei, Y.; Wang, Y.G.; Jia, Y.; Li, L.; Yoon, J.; Zhang, S.; Wang, Z.; Zhang, Y.; Zhu, M.; Sharma, T.; et al. Liver Homeostasis Is Maintained by Midlobular Zone 2 Hepatocytes. Science 2021, 371, eabb1625. [Google Scholar] [CrossRef] [PubMed]
  5. Panday, R.; Monckton, C.P.; Khetani, S.R. The Role of Liver Zonation in Physiology, Regeneration, and Disease. Semin. Liver Dis. 2022, 42, 001–016. [Google Scholar] [CrossRef] [PubMed]
  6. Verhulst, S.; van Os, E.A.; De Smet, V.; Eysackers, N.; Mannaerts, I.; van Grunsven, L.A. Gene Signatures Detect Damaged Liver Sinusoidal Endothelial Cells in Chronic Liver Diseases. Front. Med. 2021, 8, 750044. [Google Scholar] [CrossRef]
  7. Su, T.; Yang, Y.; Lai, S.; Jeong, J.; Jung, Y.; McConnell, M.; Utsumi, T.; Iwakiri, Y. Single-Cell Transcriptomics Reveals Zone-Specific Alterations of Liver Sinusoidal Endothelial Cells in Cirrhosis. Cell. Mol. Gastroenterol. Hepatol. 2021, 11, 1139–1161. [Google Scholar] [CrossRef]
  8. DeLeve, L.D. Liver Sinusoidal Endothelial Cells in Hepatic Fibrosis. Hepatology 2015, 61, 1740–1746. [Google Scholar] [CrossRef]
  9. Lafoz, E.; Ruart, M.; Anton, A.; Oncins, A.; Hernández-Gea, V. The Endothelium as a Driver of Liver Fibrosis and Regeneration. Cells 2020, 9, 929. [Google Scholar] [CrossRef]
  10. Gao, J.; Zuo, B.; He, Y. Liver Sinusoidal Endothelial Cells as Potential Drivers of Liver Fibrosis (Review). Mol. Med. Rep. 2024, 29, 40. [Google Scholar] [CrossRef]
  11. Velliou, R.-I.; Legaki, A.-I.; Nikolakopoulou, P.; Vlachogiannis, N.I.; Chatzigeorgiou, A. Liver Endothelial Cells in NAFLD and Transition to NASH and HCC. Cell. Mol. Life Sci. 2023, 80, 314. [Google Scholar] [CrossRef]
  12. Nasiri-Ansari, N.; Androutsakos, T.; Flessa, C.-M.; Kyrou, I.; Siasos, G.; Randeva, H.S.; Kassi, E.; Papavassiliou, A.G. Endothelial Cell Dysfunction and Nonalcoholic Fatty Liver Disease (NAFLD): A Concise Review. Cells 2022, 11, 2511. [Google Scholar] [CrossRef]
  13. Ghallab, A.; Myllys, M.; Holland, C.H.; Zaza, A.; Murad, W.; Hassan, R.; Ahmed, Y.A.; Abbas, T.; Abdelrahim, E.A.; Schneider, K.M.; et al. Influence of Liver Fibrosis on Lobular Zonation. Cells 2019, 8, 1556. [Google Scholar] [CrossRef]
  14. Nagy, D.; Maude, H.; Birdsey, G.M.; Randi, A.M.; Cebola, I. RISING STARS: Liver Sinusoidal Endothelial Transcription Factors in Metabolic Homeostasis and Disease. J. Mol. Endocrinol. 2023, 71, e230026. [Google Scholar] [CrossRef]
  15. Ben-Moshe, S.; Veg, T.; Manco, R.; Dan, S.; Papinutti, D.; Lifshitz, A.; Kolodziejczyk, A.A.; Halpern, K.B.; Elinav, E.; Itzkovitz, S. The Spatiotemporal Program of Zonal Liver Regeneration Following Acute Injury. Cell Stem Cell 2022, 29, 973–989.e10. [Google Scholar] [CrossRef]
  16. Demšar, J.; Curk, T.; Erjavec, A.; Gorup, Č.; Hočevar, T.; Milutinovič, M.; Možina, M.; Polajnar, M.; Toplak, M.; Starič, A.; et al. Orange: Data Mining Toolbox in Python. J. Mach. Learn. Res. 2013, 14, 2349–2353. [Google Scholar]
  17. Godec, P.; Pančur, M.; Ilenič, N.; Čopar, A.; Stražar, M.; Erjavec, A.; Pretnar, A.; Demšar, J.; Starič, A.; Toplak, M.; et al. Democratized Image Analytics by Visual Programming through Integration of Deep Models and Small-Scale Machine Learning. Nat. Commun. 2019, 10, 4551. [Google Scholar] [CrossRef]
  18. Wang, Z.; Qian, J.; Lu, X.; Zhang, P.; Guo, R.; Lou, H.; Zhang, S.; Yang, J.; Fan, X. A Single-Cell Transcriptomic Atlas Characterizes Liver Non-Parenchymal Cells in Healthy and Diseased Mice. bioRxiv 2021. [Google Scholar] [CrossRef]
  19. MacParland, S.A.; Liu, J.C.; Ma, X.-Z.; Innes, B.T.; Bartczak, A.M.; Gage, B.K.; Manuel, J.; Khuu, N.; Echeverri, J.; Linares, I.; et al. Single Cell RNA Sequencing of Human Liver Reveals Distinct Intrahepatic Macrophage Populations. Nat. Commun. 2018, 9, 4383. [Google Scholar] [CrossRef]
  20. Ramachandran, P.; Dobie, R.; Wilson-Kanamori, J.R.; Dora, E.F.; Henderson, B.E.P.; Luu, N.T.; Portman, J.R.; Matchett, K.P.; Brice, M.; Marwick, J.A.; et al. Resolving the Fibrotic Niche of Human Liver Cirrhosis at Single-Cell Level. Nature 2019, 575, 512–518. [Google Scholar] [CrossRef]
  21. Aizarani, N.; Saviano, A.; Sagar, N.; Mailly, L.; Durand, S.; Herman, J.S.; Pessaux, P.; Baumert, T.F.; Grün, D. A Human Liver Cell Atlas Reveals Heterogeneity and Epithelial Progenitors. Nature 2019, 572, 199–204. [Google Scholar] [CrossRef] [PubMed]
  22. Hao, Y.; Hao, S.; Andersen-Nissen, E.; Mauck, W.M.; Zheng, S.; Butler, A.; Lee, M.J.; Wilk, A.J.; Darby, C.; Zager, M.; et al. Integrated Analysis of Multimodal Single-Cell Data. Cell 2021, 184, 3573–3587.e29. [Google Scholar] [CrossRef] [PubMed]
  23. Zhang, M.; Yang, H.; Wan, L.; Wang, Z.; Wang, H.; Ge, C.; Liu, Y.; Hao, Y.; Zhang, D.; Shi, G.; et al. Single-Cell Transcriptomic Architecture and Intercellular Crosstalk of Human Intrahepatic Cholangiocarcinoma. J. Hepatol. 2020, 73, 1118–1130. [Google Scholar] [CrossRef] [PubMed]
  24. Brancale, J.; Vilarinho, S. A Single Cell Gene Expression Atlas of 28 Human Livers. J. Hepatol. 2021, 75, 219–220. [Google Scholar] [CrossRef] [PubMed]
  25. Halpern, K.B.; Shenhav, R.; Matcovitch-Natan, O.; Tóth, B.; Lemze, D.; Golan, M.; Massasa, E.E.; Baydatch, S.; Landen, S.; Moor, A.E.; et al. Single-Cell Spatial Reconstruction Reveals Global Division of Labour in the Mammalian Liver. Nature 2017, 542, 352–356. [Google Scholar] [CrossRef]
  26. Hildebrandt, F.; Andersson, A.; Saarenpää, S.; Larsson, L.; Van Hul, N.; Kanatani, S.; Masek, J.; Ellis, E.; Barragan, A.; Mollbrink, A.; et al. Spatial Transcriptomics to Define Transcriptional Patterns of Zonation and Structural Components in the Mouse Liver. Nat. Commun. 2021, 12, 7046. [Google Scholar] [CrossRef] [PubMed]
  27. Segal, J.M.; Kent, D.; Wesche, D.J.; Ng, S.S.; Serra, M.; Oulès, B.; Kar, G.; Emerton, G.; Blackford, S.J.I.; Darmanis, S.; et al. Single Cell Analysis of Human Foetal Liver Captures the Transcriptional Profile of Hepatobiliary Hybrid Progenitors. Nat. Commun. 2019, 10, 3350. [Google Scholar] [CrossRef] [PubMed]
  28. Program, C.S.-C.B.; Abdulla, S.; Aevermann, B.; Assis, P.; Badajoz, S.; Bell, S.M.; Bezzi, E.; Cakir, B.; Chaffer, J.; Chambers, S.; et al. CZ CELL×GENE Discover: A Single-Cell Data Platform for Scalable Exploration, Analysis and Modeling of Aggregated Data. bioRxiv 2023. [Google Scholar] [CrossRef]
  29. Massalha, H.; Bahar Halpern, K.; Abu-Gazala, S.; Jana, T.; Massasa, E.E.; Moor, A.E.; Buchauer, L.; Rozenberg, M.; Pikarsky, E.; Amit, I.; et al. A Single Cell Atlas of the Human Liver Tumor Microenvironment. Mol. Syst. Biol. 2020, 16, e9682. [Google Scholar] [CrossRef] [PubMed]
  30. Natarajan, V.; Harris, E.N.; Kidambi, S. SECs (Sinusoidal Endothelial Cells), Liver Microenvironment, and Fibrosis. BioMed Res. Int. 2017, 2017, 4097205. [Google Scholar] [CrossRef] [PubMed]
  31. Li, Z.-W.; Ruan, B.; Yang, P.-J.; Liu, J.-J.; Song, P.; Duan, J.-L.; Wang, L. Oit3, a Promising Hallmark Gene for Targeting Liver Sinusoidal Endothelial Cells. Signal Transduct. Target. Ther. 2023, 8, 344. [Google Scholar] [CrossRef] [PubMed]
  32. Jamil, M.A.; Singer, H.; Al-Rifai, R.; Nüsgen, N.; Rath, M.; Strauss, S.; Andreou, I.; Oldenburg, J.; El-Maarri, O. Molecular Analysis of Fetal and Adult Primary Human Liver Sinusoidal Endothelial Cells: A Comparison to Other Endothelial Cells. Int. J. Mol. Sci. 2020, 21, 7776. [Google Scholar] [CrossRef]
  33. Olsavszky, V.; Sticht, C.; Schmid, C.D.; Winkler, M.; Wohlfeil, S.A.; Olsavszky, A.; Schledzewski, K.; Géraud, C.; Goerdt, S.; Leibing, T.; et al. Exploring the Transcriptomic Network of Multi-Ligand Scavenger Receptor Stabilin-1- and Stabilin-2-Deficient Liver Sinusoidal Endothelial Cells. Gene 2021, 768, 145284. [Google Scholar] [CrossRef]
  34. Maeda-Smithies, N.; Hiller, S.; Dong, S.; Kim, H.-S.; Bennett, B.J.; Kayashima, Y. Ectopic Expression of the Stabilin2 Gene Triggered by an Intracisternal A Particle (IAP) Element in DBA/2J Strain of Mice. Mamm. Genome Off. J. Int. Mamm. Genome Soc. 2020, 31, 2–16. [Google Scholar] [CrossRef]
  35. Huebert, R.C.; Jagavelu, K.; Hendrickson, H.I.; Vasdev, M.M.; Arab, J.P.; Splinter, P.L.; Trussoni, C.E.; LaRusso, N.F.; Shah, V.H. Aquaporin-1 Promotes Angiogenesis, Fibrosis, and Portal Hypertension Through Mechanisms Dependent on Osmotically Sensitive MicroRNAs. Am. J. Pathol. 2011, 179, 1851–1860. [Google Scholar] [CrossRef]
  36. Gerussi, A.; Natalini, A.; Antonangeli, F.; Mancuso, C.; Agostinetto, E.; Barisani, D.; Di Rosa, F.; Andrade, R.; Invernizzi, P. Immune-Mediated Drug-Induced Liver Injury: Immunogenetics and Experimental Models. Int. J. Mol. Sci. 2021, 22, 4557. [Google Scholar] [CrossRef] [PubMed]
  37. Puri, M. Automated Machine Learning Diagnostic Support System as a Computational Biomarker for Detecting Drug-Induced Liver Injury Patterns in Whole Slide Liver Pathology Images. Assay Drug Dev. Technol. 2020, 18, 1–10. [Google Scholar] [CrossRef] [PubMed]
  38. Kim, H.-C.; Chang, J.; Lee, H.S.; Kwon, H.J. Mitochondrial UQCRB as a New Molecular Prognostic Biomarker of Human Colorectal Cancer. Exp. Mol. Med. 2017, 49, e391. [Google Scholar] [CrossRef] [PubMed]
  39. Schwenger, K.J.; Clermont-Dejean, N.; Allard, J.P. The Role of the Gut Microbiome in Chronic Liver Disease: The Clinical Evidence Revised. JHEP Rep. 2019, 1, 214–226. [Google Scholar] [CrossRef]
  40. Tilg, H.; Cani, P.D.; Mayer, E.A. Gut Microbiome and Liver Diseases. Gut 2016, 65, 2035–2044. [Google Scholar] [CrossRef]
  41. Gurcan, M.N.; Boucheron, L.; Can, A.; Madabhushi, A.; Rajpoot, N.; Yener, B. Histopathological Image Analysis: A Review. IEEE Rev. Biomed. Eng. 2009, 2, 147. [Google Scholar] [CrossRef]
  42. Clifton, K.; Anant, M.; Aihara, G.; Atta, L.; Aimiuwu, O.K.; Kebschull, J.M.; Miller, M.I.; Tward, D.; Fan, J. STalign: Alignment of Spatial Transcriptomics Data Using Diffeomorphic Metric Mapping. Nat. Commun. 2023, 14, 8123. [Google Scholar] [CrossRef]
Figure 1. Experimental workflow, histopathology image classification, and analysis; (A) H&E image classification for cirrhosis; (B) bridging fibrosis; (C) early fibrosis and steatosis; (D) workflow of classification experiment study design; (E) t-SNE plot for clustered images; (F) confusion matrix of classifier performance.
Ijtm 04 00012 g001
Figure 2. Volcano plots of differential gene expression in: (A) NASH vs. control. (B) Zone 1 vs. zone 3.
Ijtm 04 00012 g002
Figure 3. Single-cell clustering in DILI and NASH ECs (study GSE166178): (A) cell clustering for control and DILI samples (combined); (B) cell annotations and clustering (separately); (C) cell clustering for control and NASH samples (combined); (D) cell annotations and clustering (separately). Abbreviations: endo—endothelial cells, DC—dendritic cells, Macro—macrophages, IM—immune cells, MESN—mesenchymal cells, NK-T cell—natural killer T cells, Neutro—neutrophils.
Ijtm 04 00012 g003
Figure 4. 10x genomics Visium image analysis for zonation marker: (A) fiducial image of H&E-stained normal liver, (inset) highlighting zonation areas of zone 1, zone 2, and zone 3, (B) gene expression for FGG in zone 1, (C) expression for SAA1 in zone 2, (D) expression for GLUL in zone 3.
Ijtm 04 00012 g004
Figure 5. Nanostring’s CosMx Spatial Molecular Imager (SMI) of normal human liver demonstrates zonation architecture: (A) zonation boundaries for zone 1, zone 2, zone 3 and portal and central veins; (B) zonation-specific gene expression, FGG (pink marker) expressed as in zone 1 (spreads across zone 2); (C) SAA1 (aqua marker) expressed as in zone 2; (D) GLUL (white marker) expressed as in zone 3.
Ijtm 04 00012 g005
Figure 6. LSEC cell clustering and markers: (A) clustering of all the normal liver cells; (B) LSEC cluster; (C) VCVEC, VPEC, and LSEC subset under EC cluster; (D,E) LSEC marker gene expressions; (F) VCVEC and VPEC marker gene expression clusters.
Ijtm 04 00012 g006
Figure 7. Gene expression dot plots: grid of genes by cell types enabling one to access DGE profiles and percentage of expressing cells in PP–LSEC: Periportal Liver Sinusoid Endothelial Cells, PC–LSEC: Pericentral Liver Sinusoid Endothelial Cells and LSEC cells.
Ijtm 04 00012 g007
Table 1. ML image classifier performance matrix.
ModelAUCCAF1PrecisionRecall
KNN0.8760.5920.6090.6450.592
Tree0.6590.4600.4670.4770.460
SVM0.8960.6600.6920.6670.660
Random Forest0.7740.5180.5200.5250.518
Neural Network0.8770.6440.6420.6400.644
Naïve Bayes0.8470.6000.5970.5980.600
Logistic Regression0.8920.6560.6550.6540.656
Constant0.5000.2000.0670.0400.582
AdaBoost0.7480.5820.5800.5820.582
Table 2. DGE of zonation-specific and NASH genes.
NCBI GEO Study IDPublication
PMID
YearPatients (N)Differentially Expressed GenesTop UP/Down Expressed Genes
GSE48452239317602013NASH vs. Healthy Control(N = 46)NASH vs. Cntrl = 47
Steatosis vs. Cntrl = 32
NASH vs. Steatosis = 1
Up = H2AFY2, GALNT18; Down = APOF, C8B
Up = RPS13, UBE2N; Down = CCDC82, NCAM2
Up = ZMAT3; Down = C8B
GSE89632351667232016NASH vs. Healthy Control (N = 63)NASH vs. Cntrl = 2641
Steatosis vs. Cntrl = 3627
NASH vs. Steatosis = 11
Up = TYMS, FMO1; Down = MIR21, AXUD1
Up = FOSB, MYC; Down = RFXDC2, WNT5A
Up = AKR1B10, CDC2; Down = IL6, CCL2
GSE126848306533412019NASH vs. Healthy Control (N = 45)NASH vs. Cntrl = 1906
NAFLD vs. Cntrl = 1045
NASH vs. NAFLD = 5
Up = UQCRBP1, SNORD140; Down = FNBP1, GLUD1P2
Up = FNBP1, GLUD1P2; Down = UQCRBP1, SNORD140
Up = MRC2, GALNT18; Down = ST3GAL6, MAT1A
GSE83990292447882018Liver Zonation (N = 12)Zone1 vs. Zone2 = 27
Zone2 vs. Zone 3 = 4
Zone1 vs. Zone 3 = 323
Up = DPT, STAB1; Down = OAT, SLCO1B3
Up = HAL, OIT3; Down = GLUL, SRPX
Up = HAL, AQP1; Down = OAT, CXCL6
GSE105127302978082018Liver Zonation (N = 57)Zone1 vs. Zone2 = 63
Zone2 vs. Zone 3 = 37
Zone1 vs. Zone 3 = 1010
Up = MGP, FGFR2; Down = TBX15, SLCO1B7
Up = SPRYD4, D9; Down = GLUL, PTGDS
Up = KRT19, AQP1; Down = RSPO3, GLUL
Table 3. Top 20 detected zone-specific genes.
zone 1zone 2zone 3
MRC1DNASE1L3SELE
HALCRHBPAPOB
TIMP1C9GLUL
SERPINE1CDH5FGF2
SAA1IGFBP7PLG
ID1APOFITGA5
CLDN10C8BICOS
CRPLYVE1PLPP3
SLPINOSTRINCTSS
CHI3L1TTRFGF2
FSTBTNL9PLG
TIE1ENGLGR5
LGALS3LIFRNOTUM
TRAT1FGGSLC13A3
SDSTEKOAT
PDPNKRT7GPAM
ADAM23CXCL6SP5
FGFR2LEPRCYP2E1
H2AFY2EDN1SLCO1B3
RPL3CD34MTMR11
Disclaimer/Publisher’s Note: The statements, opinions and data contained in all publications are solely those of the individual author(s) and contributor(s) and not of MDPI and/or the editor(s). MDPI and/or the editor(s) disclaim responsibility for any injury to people or property resulting from any ideas, methods, instructions or products referred to in the content.

