
Fast Forward: Optimized Sample Preparation and Fluorescent Staining for Microplastic Detection


Abstract
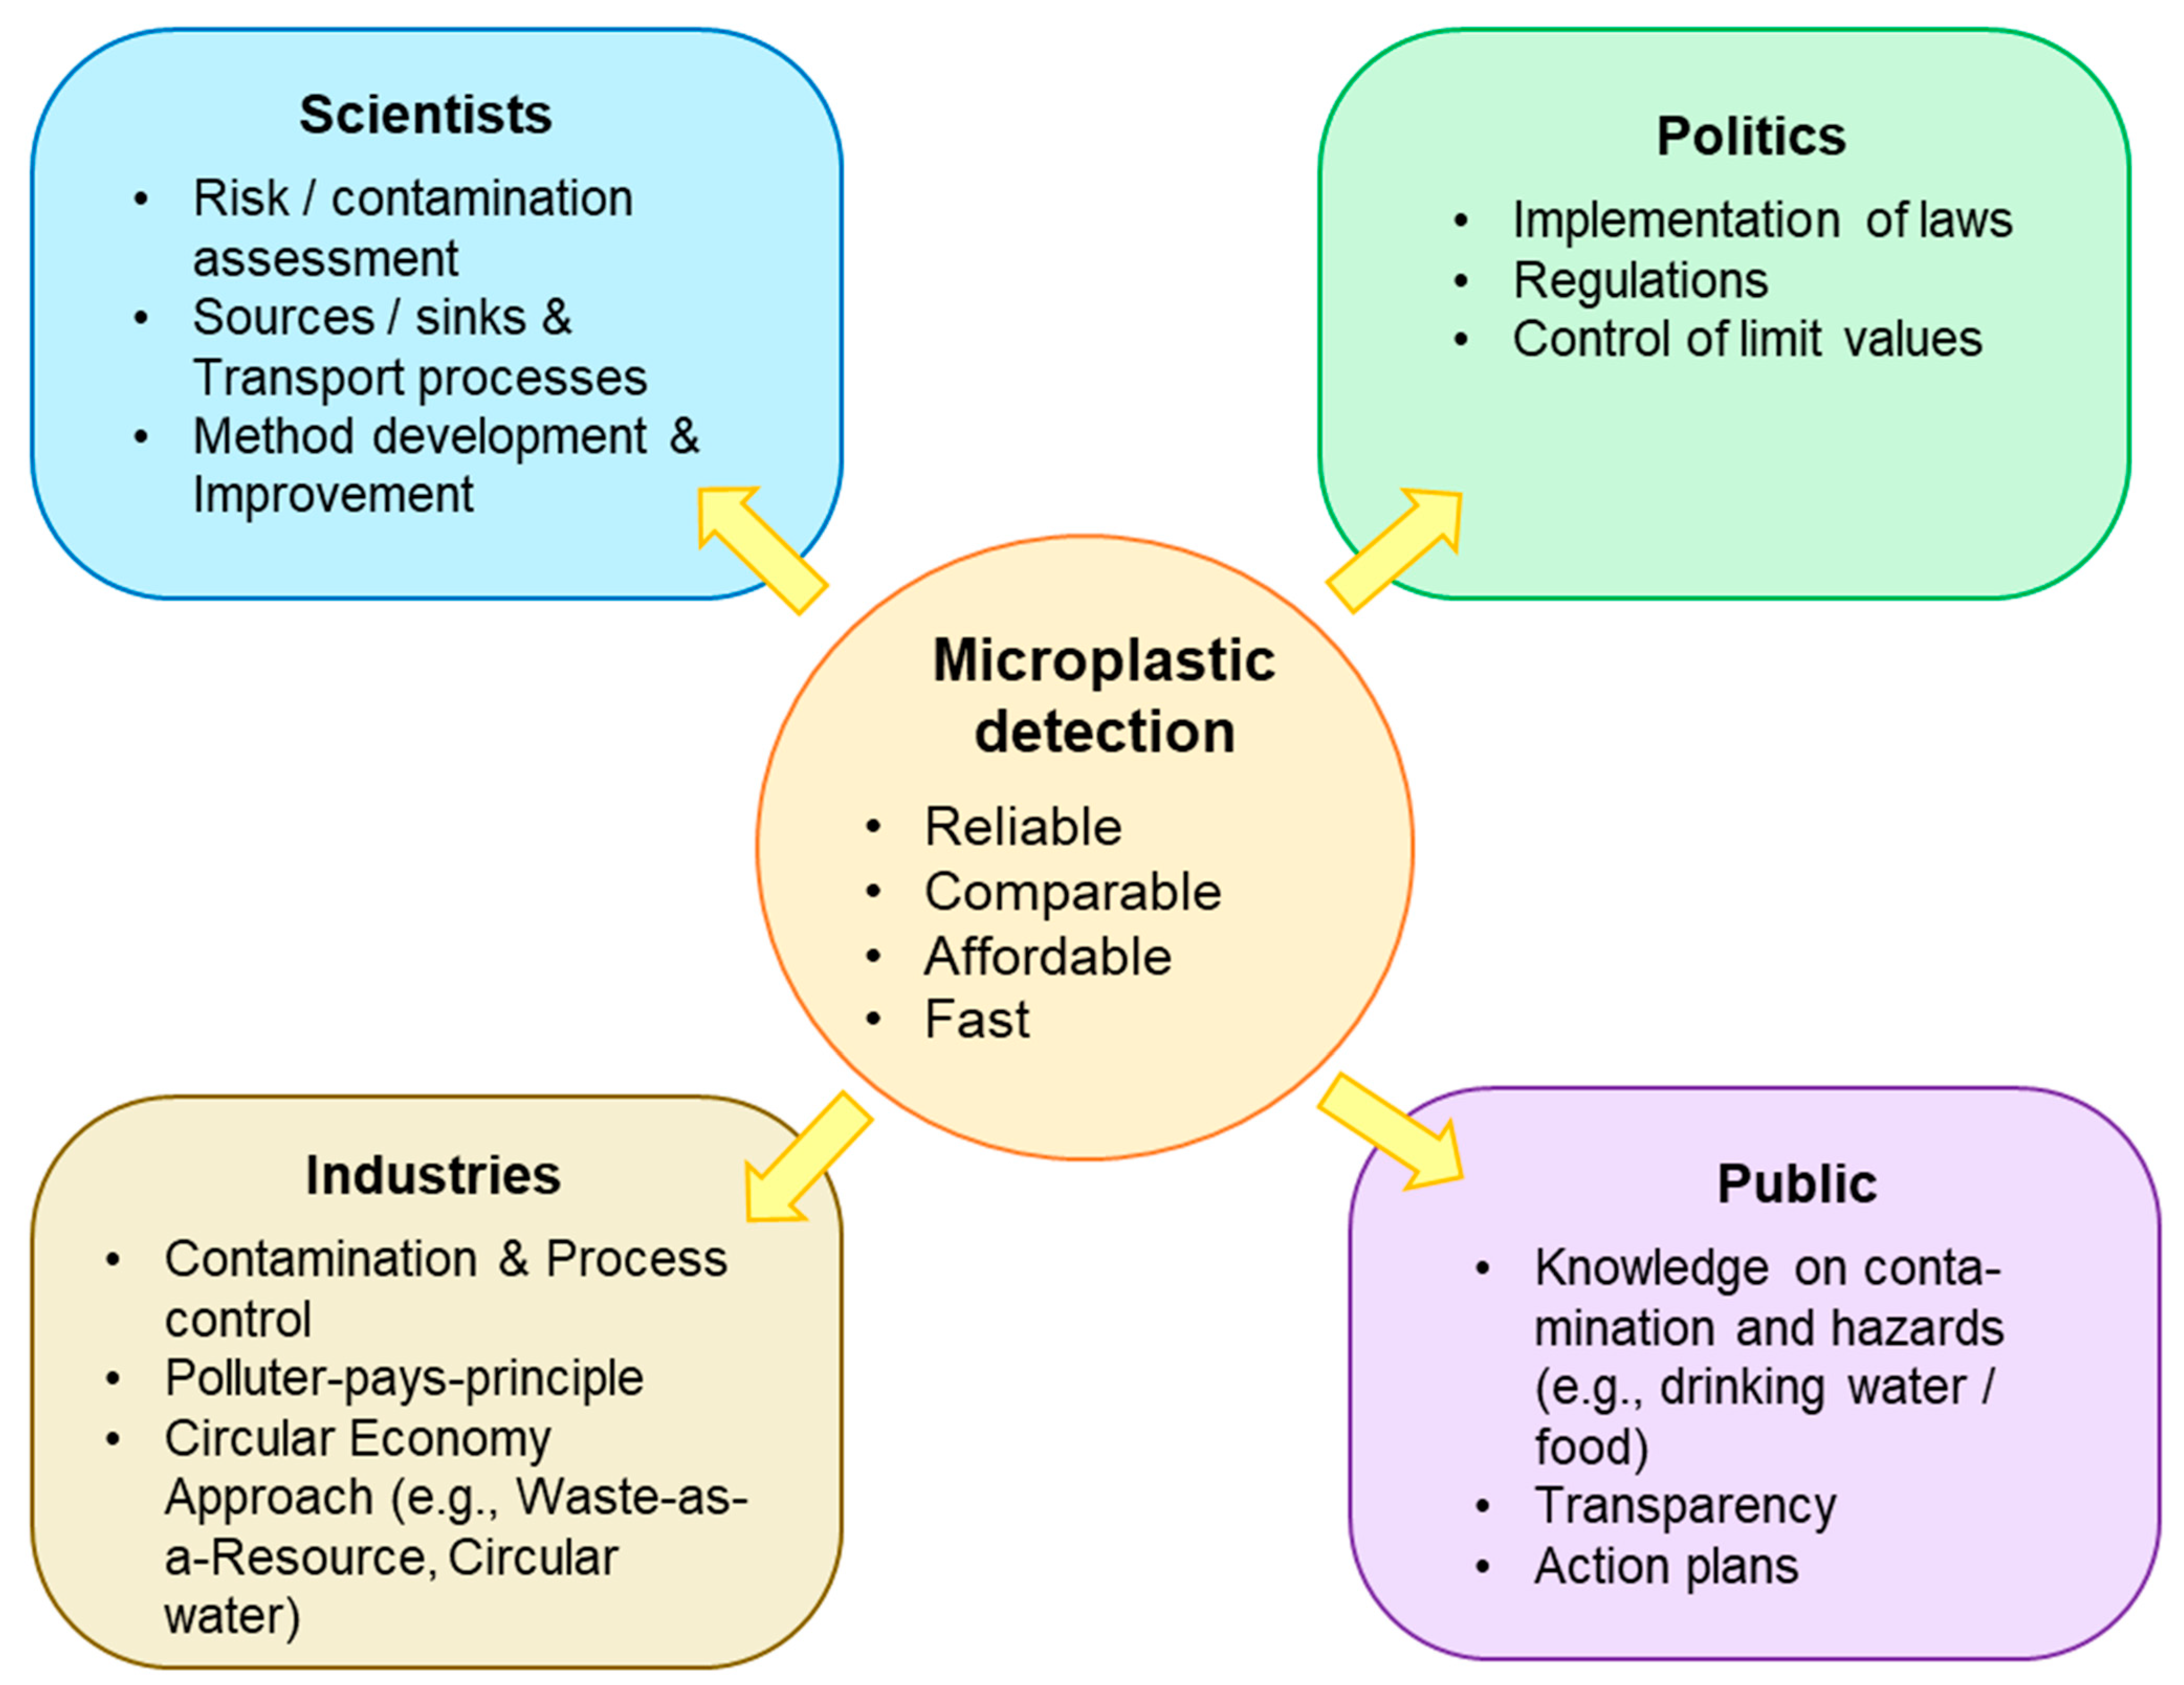
:1. Introduction
2. Material and Methods
2.1. Chemicals and Microplastics
2.2. Hydrogen Peroxide Treatment
2.3. Fluorescent Staining
2.4. Fluorescent Imaging
2.5. Recovery Rates and Automated Microplastic Detection
2.6. Wastewater Sampling and Method Comparison
2.7. Contamination Control
3. Results and Discussion
3.1. Optimization of the Staining Process
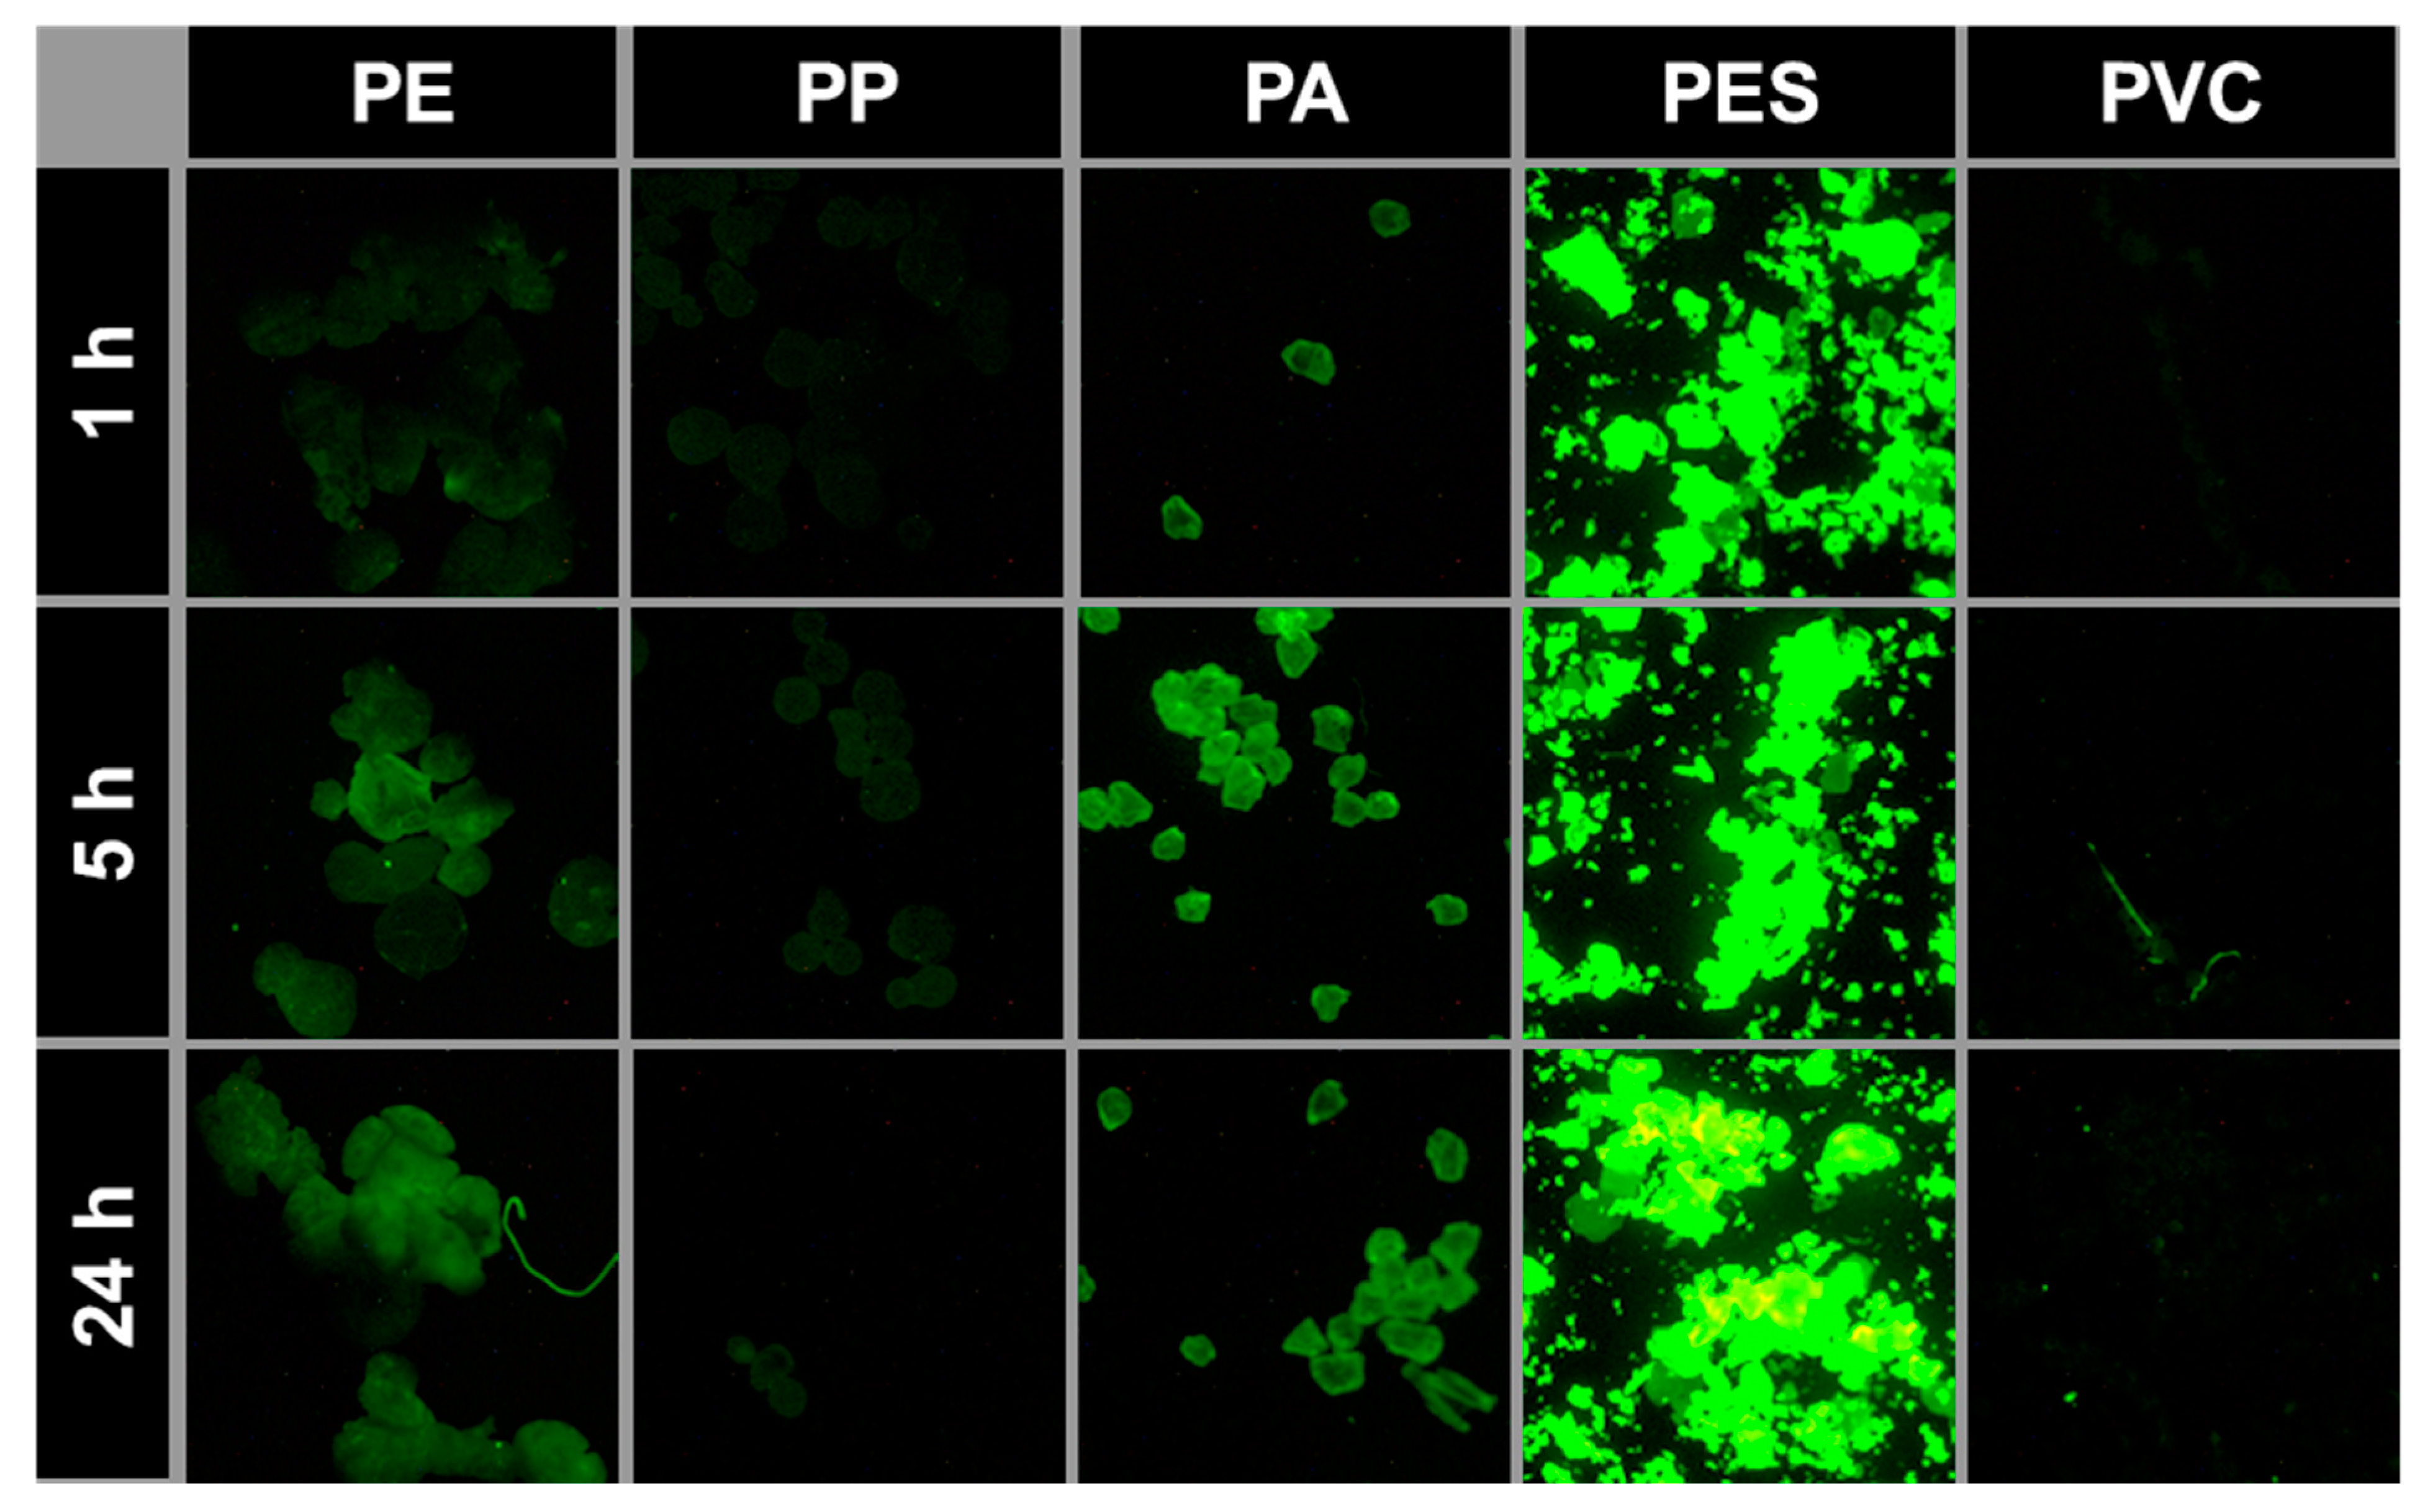
3.1.1. Staining Time
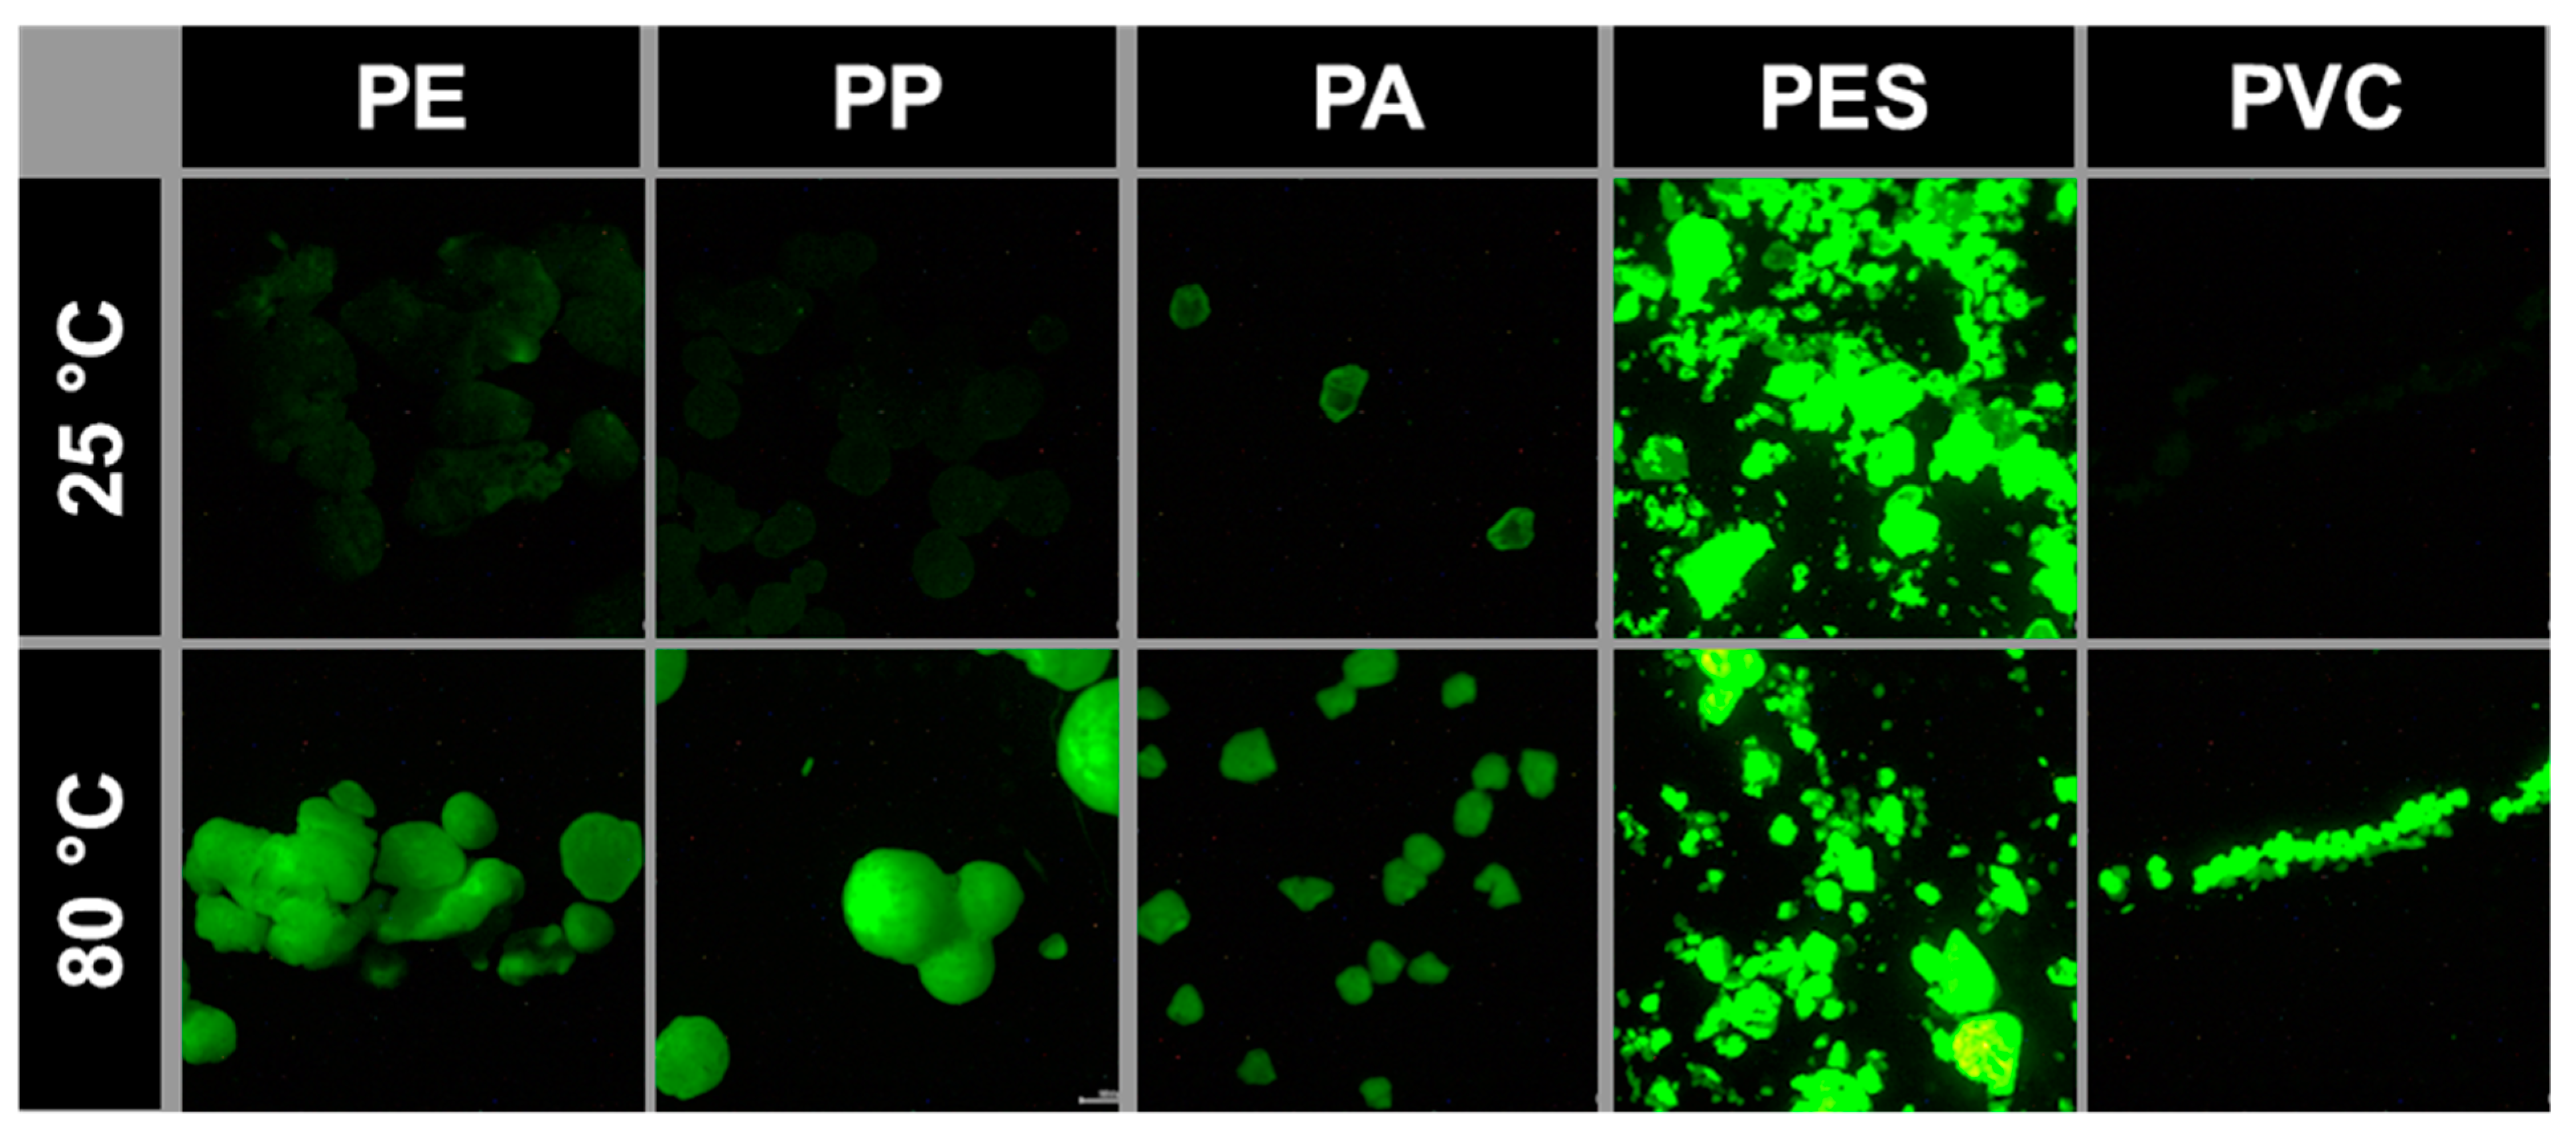
3.1.2. Staining Temperature
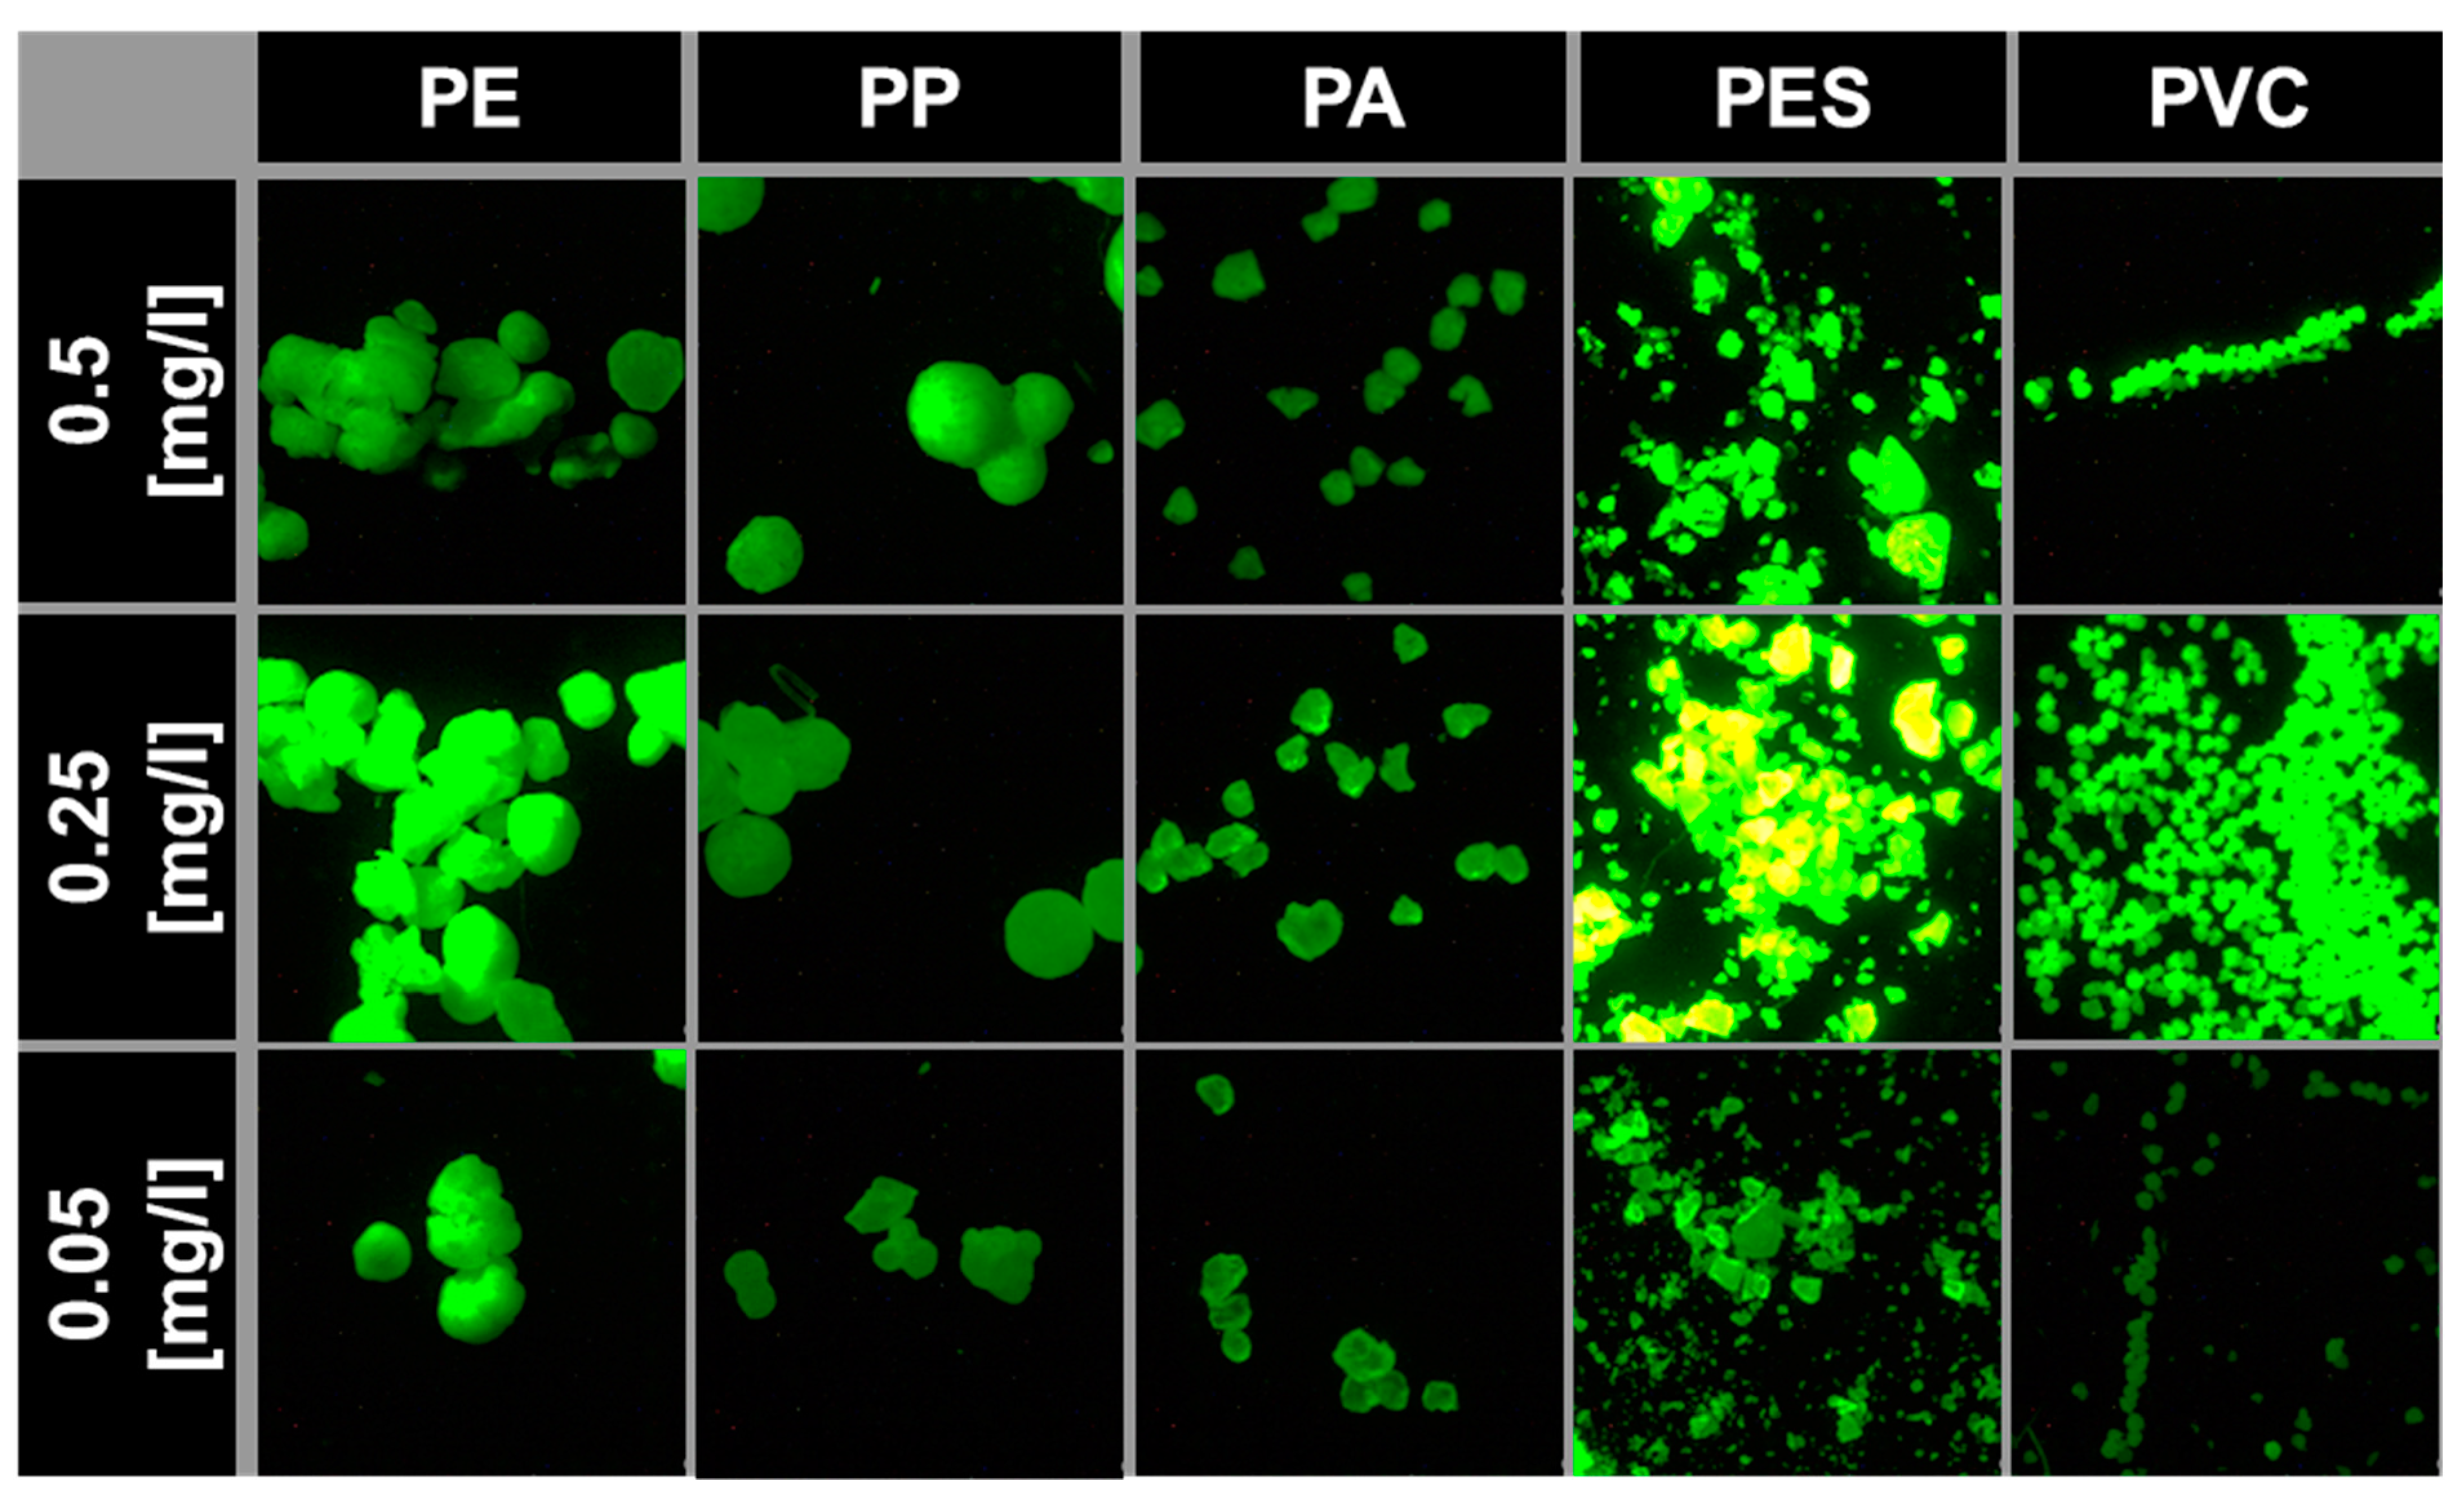
3.1.3. Dye Concentration
3.1.4. Surfactants
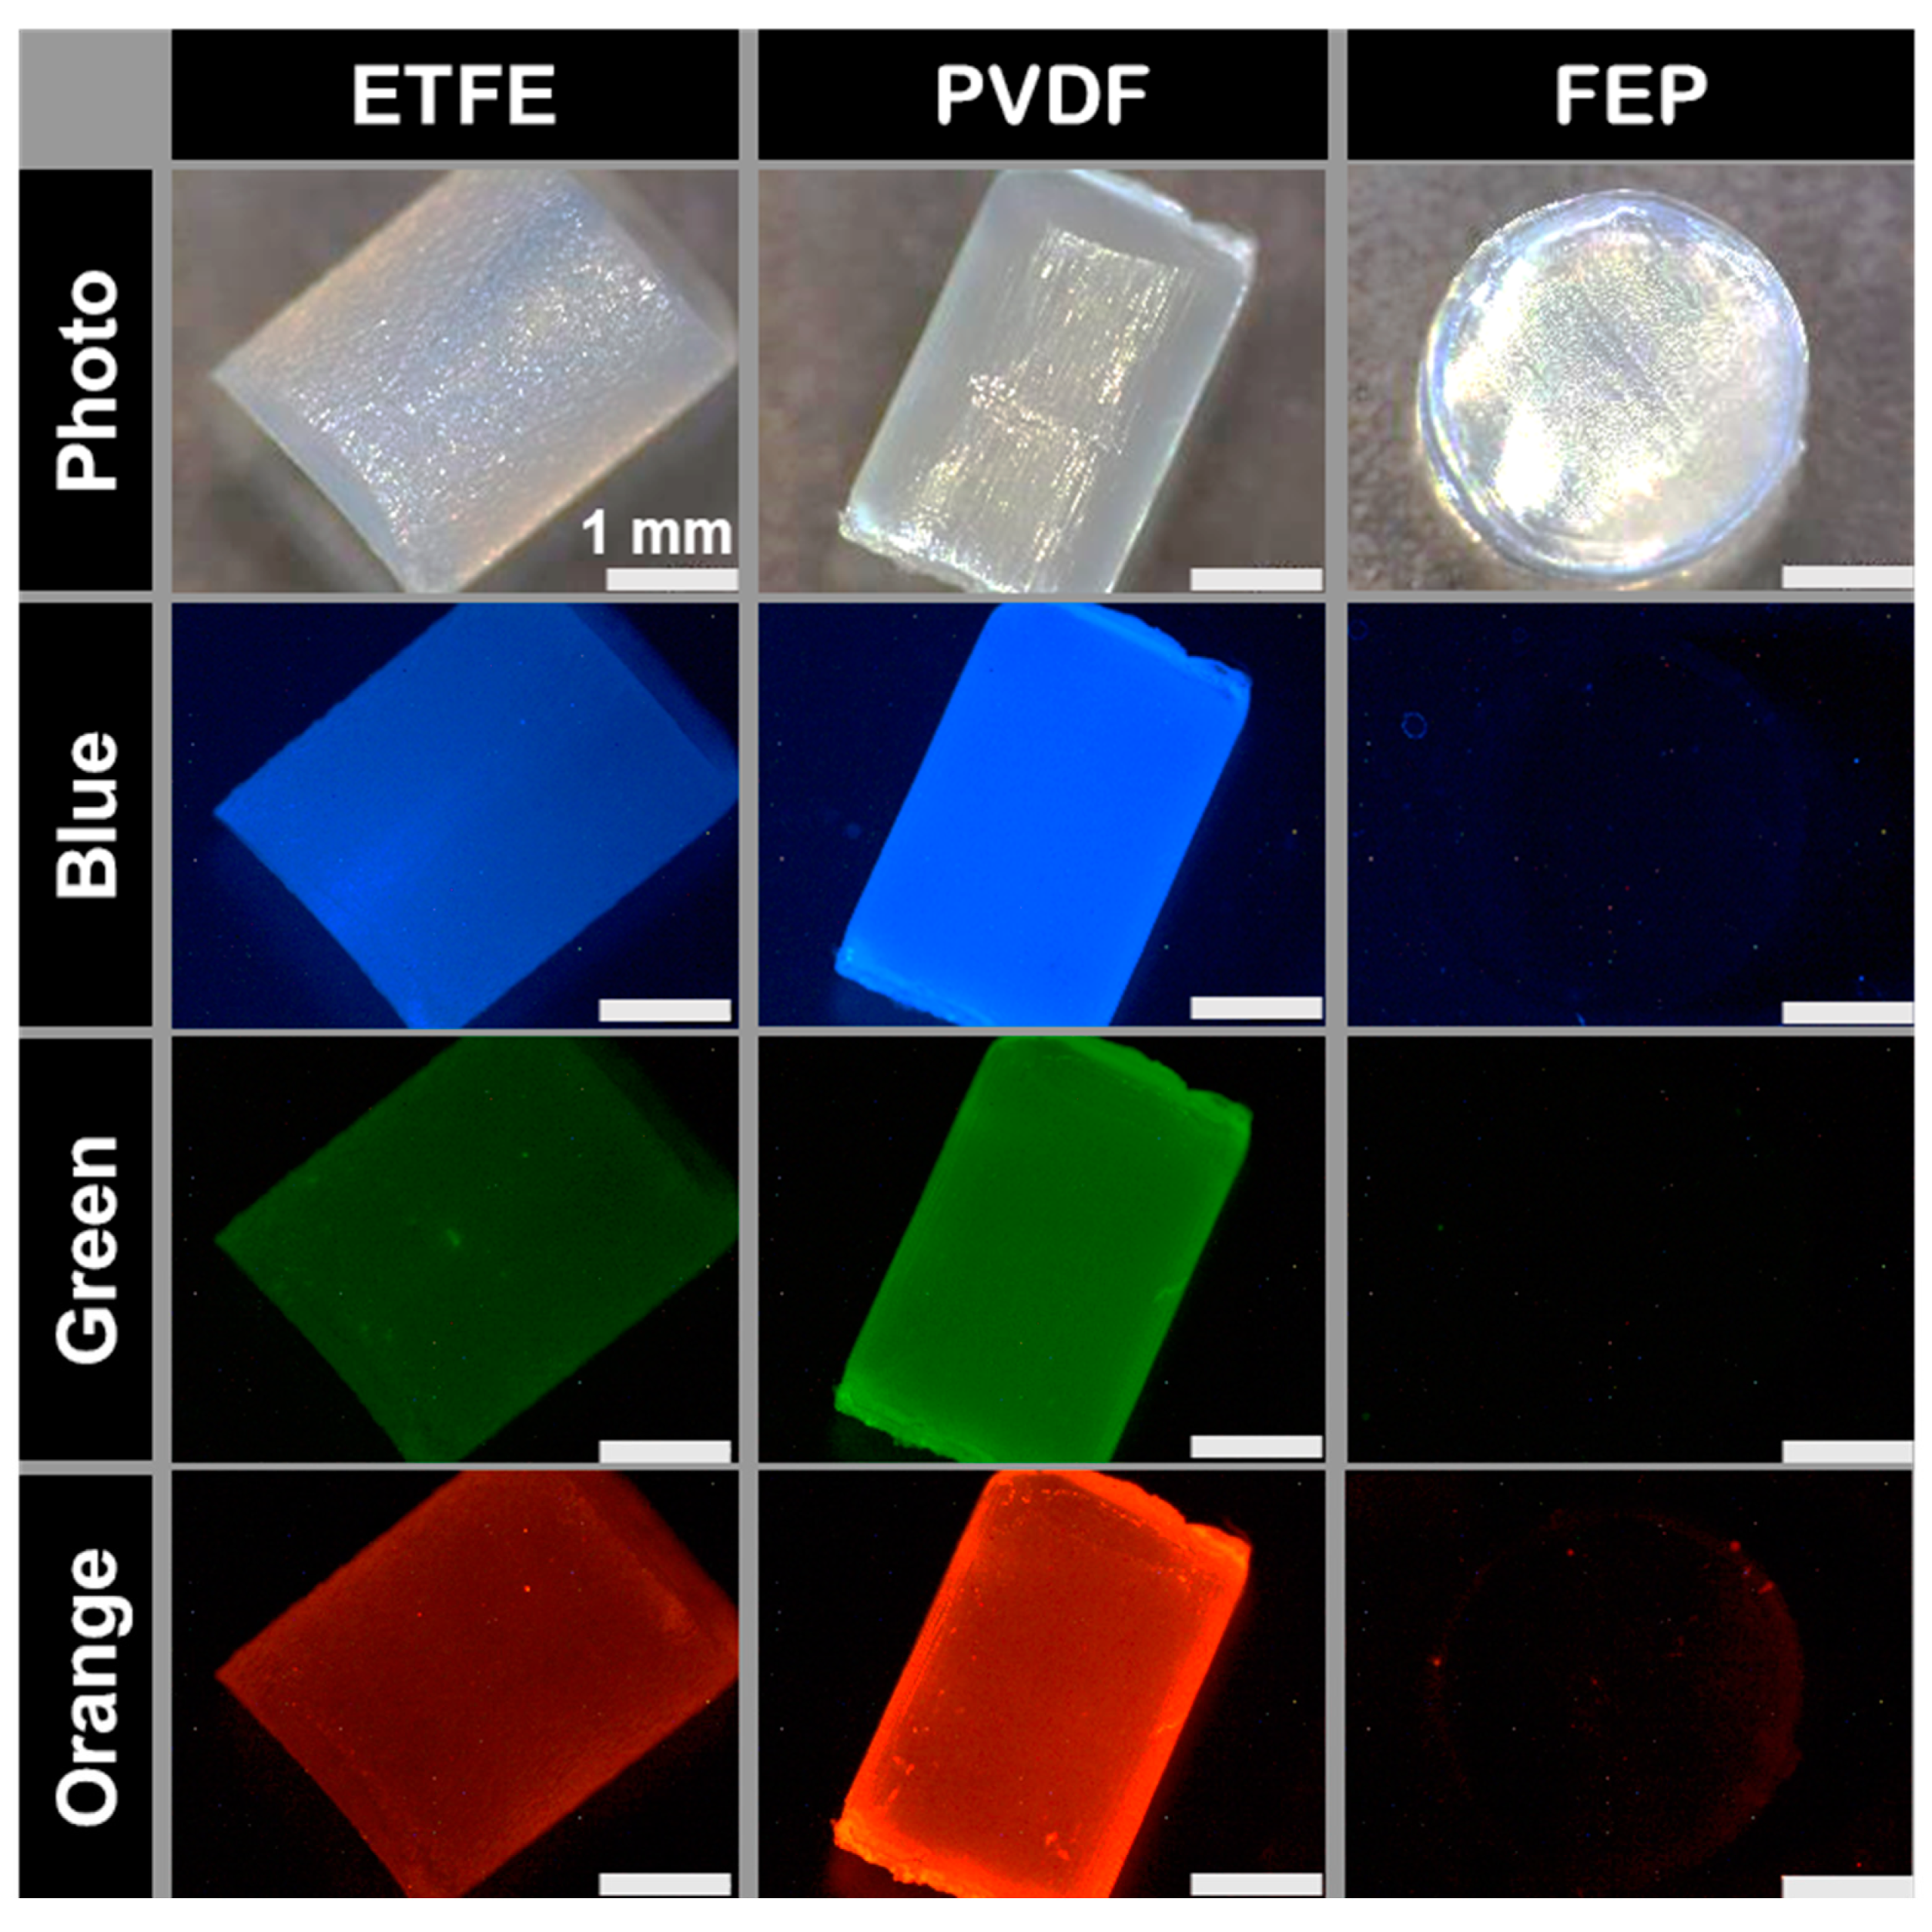
3.2. Fluoropolymers
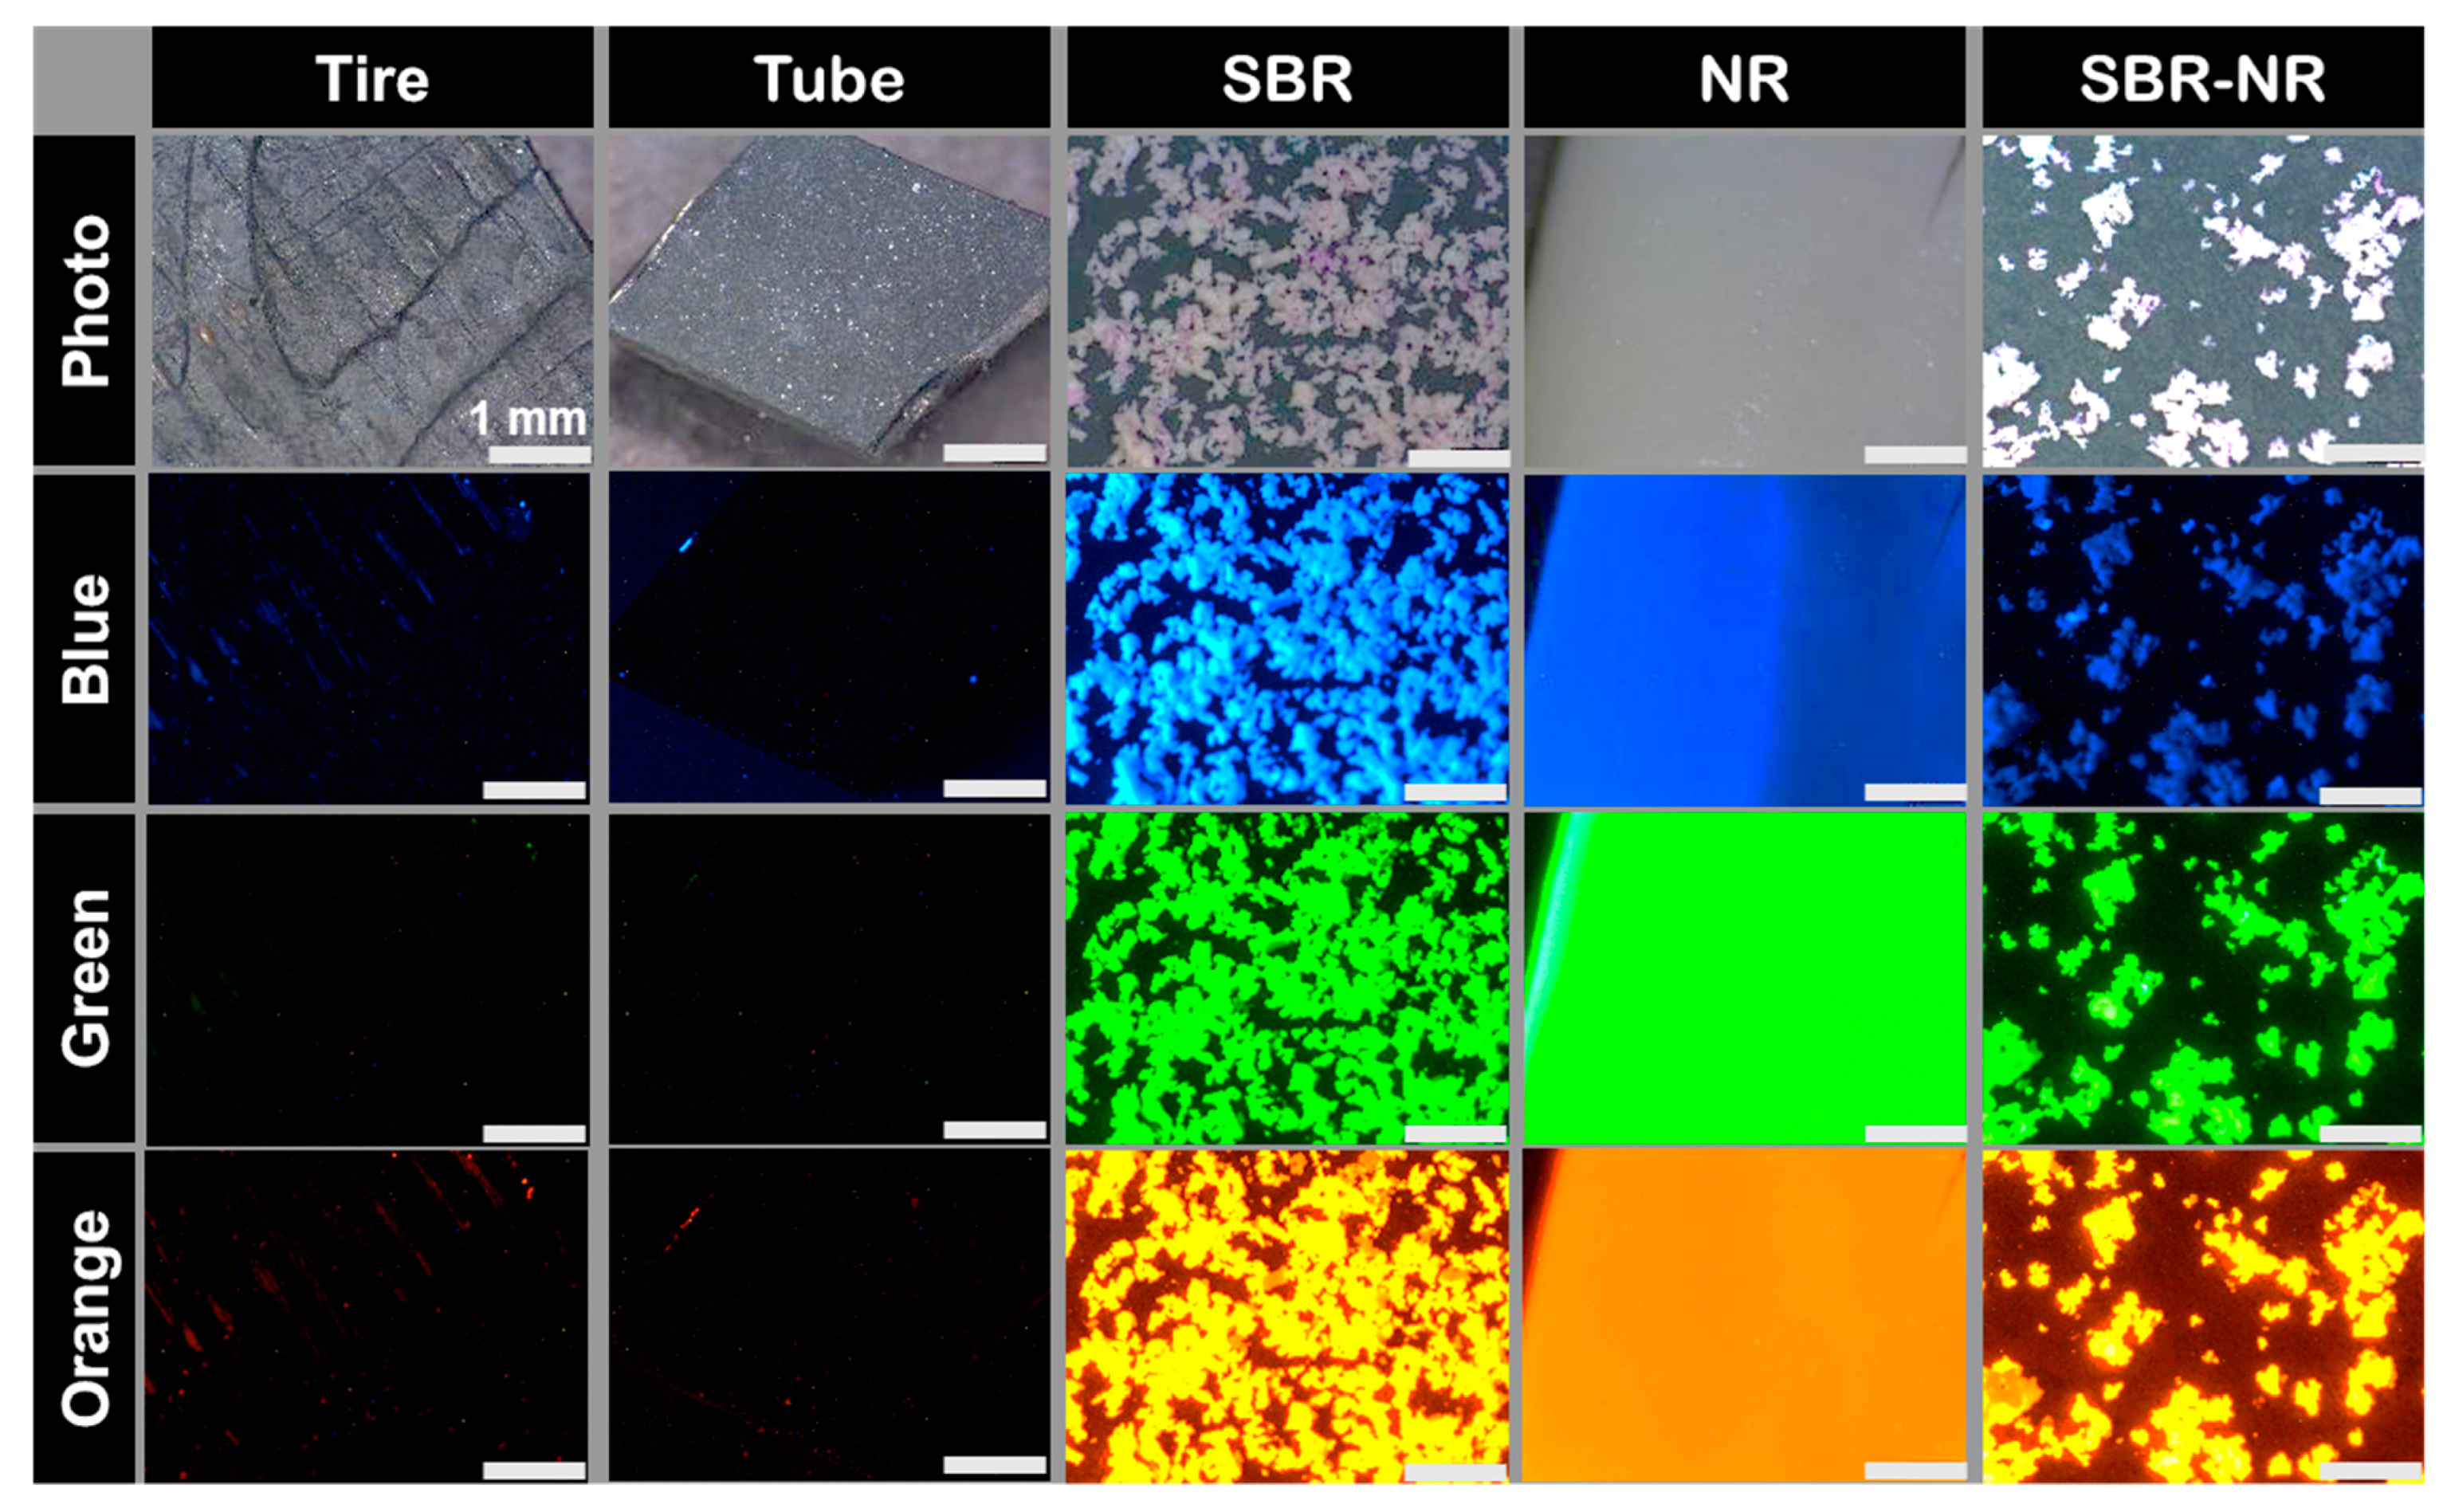
3.3. Tire Abrasion
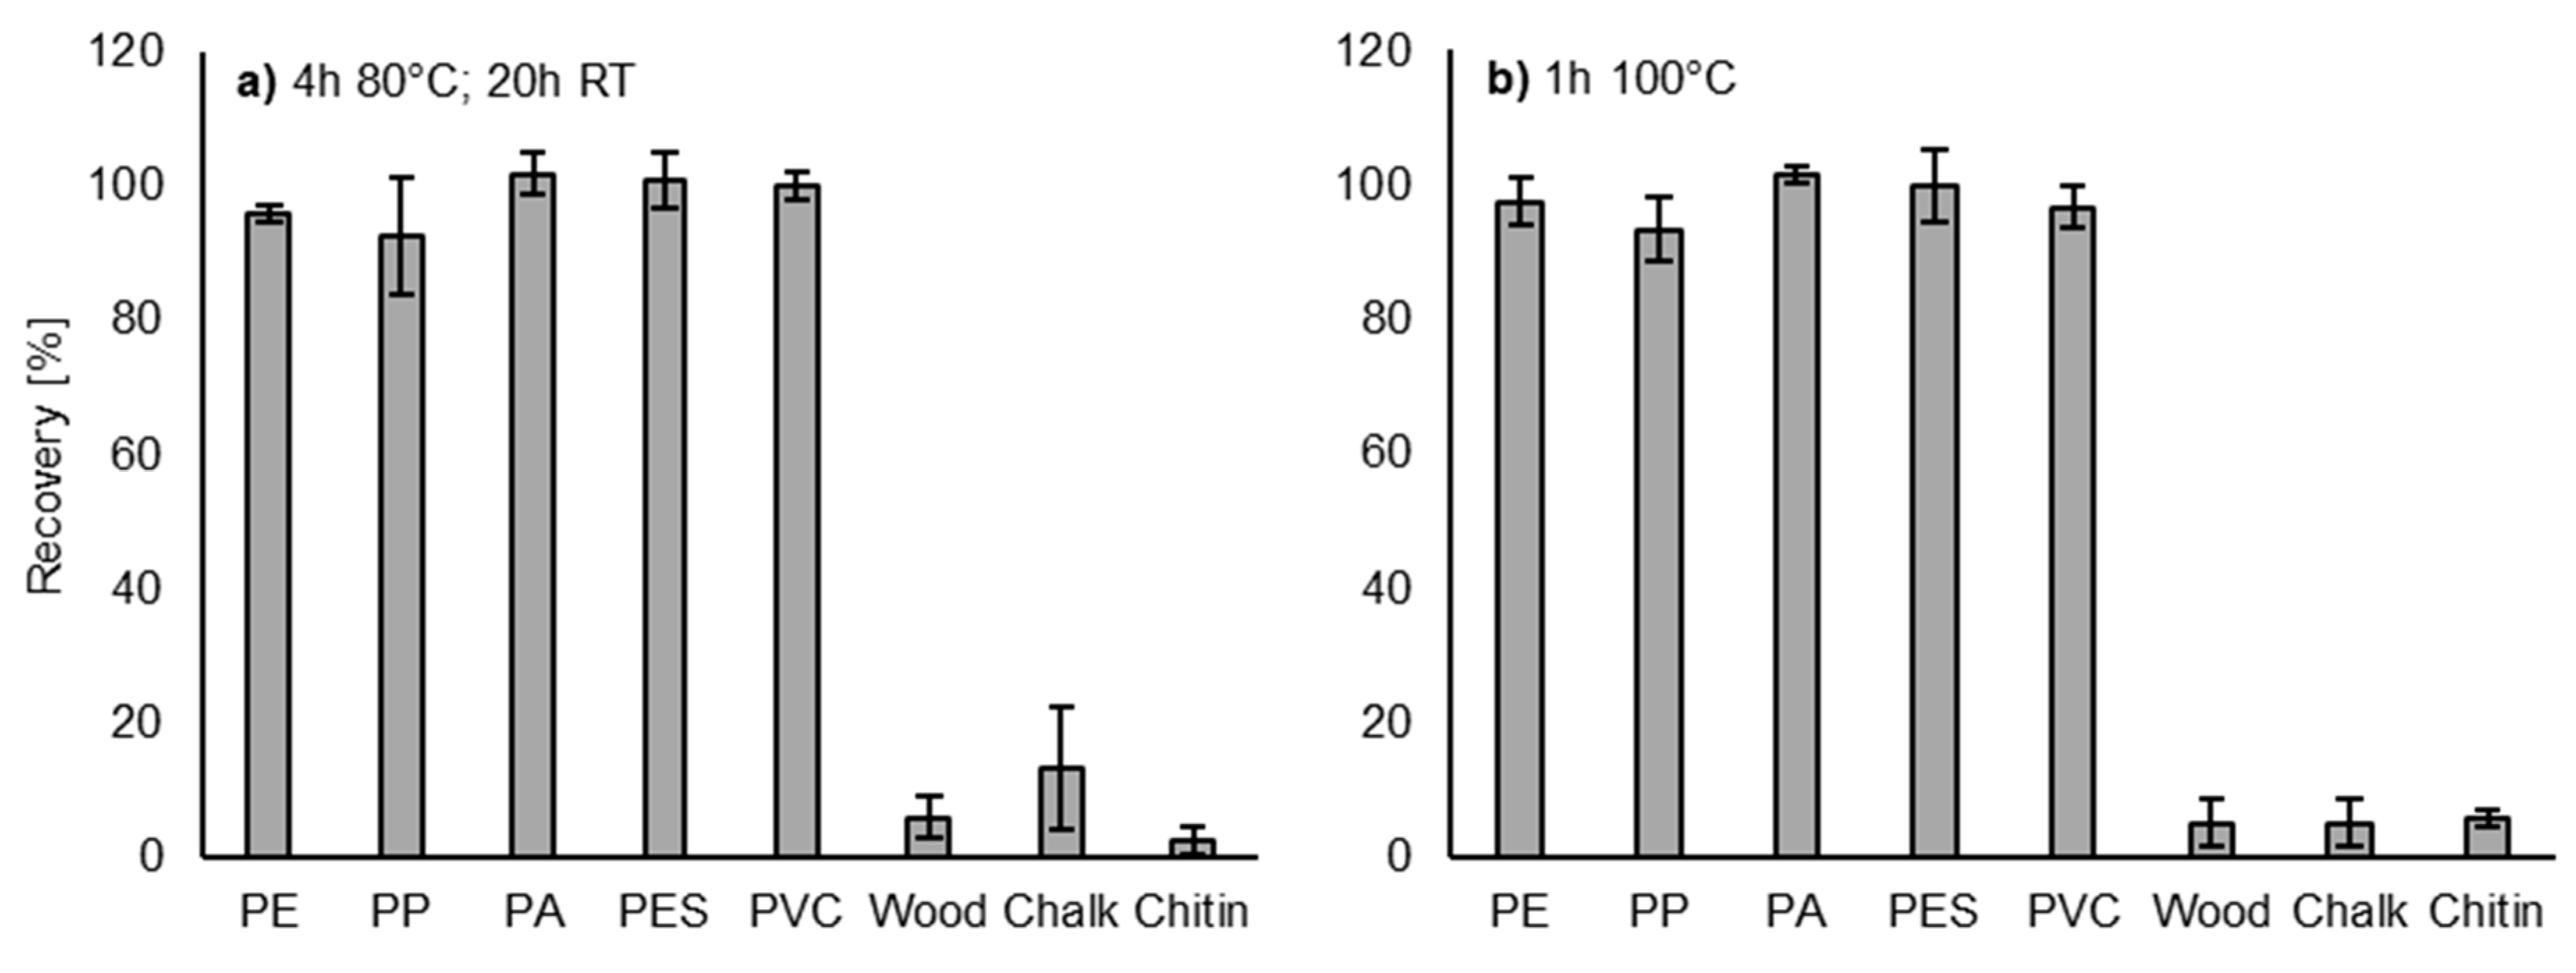
3.4. Accelerated Hydrogen Peroxide Digestion and Recovery Rates
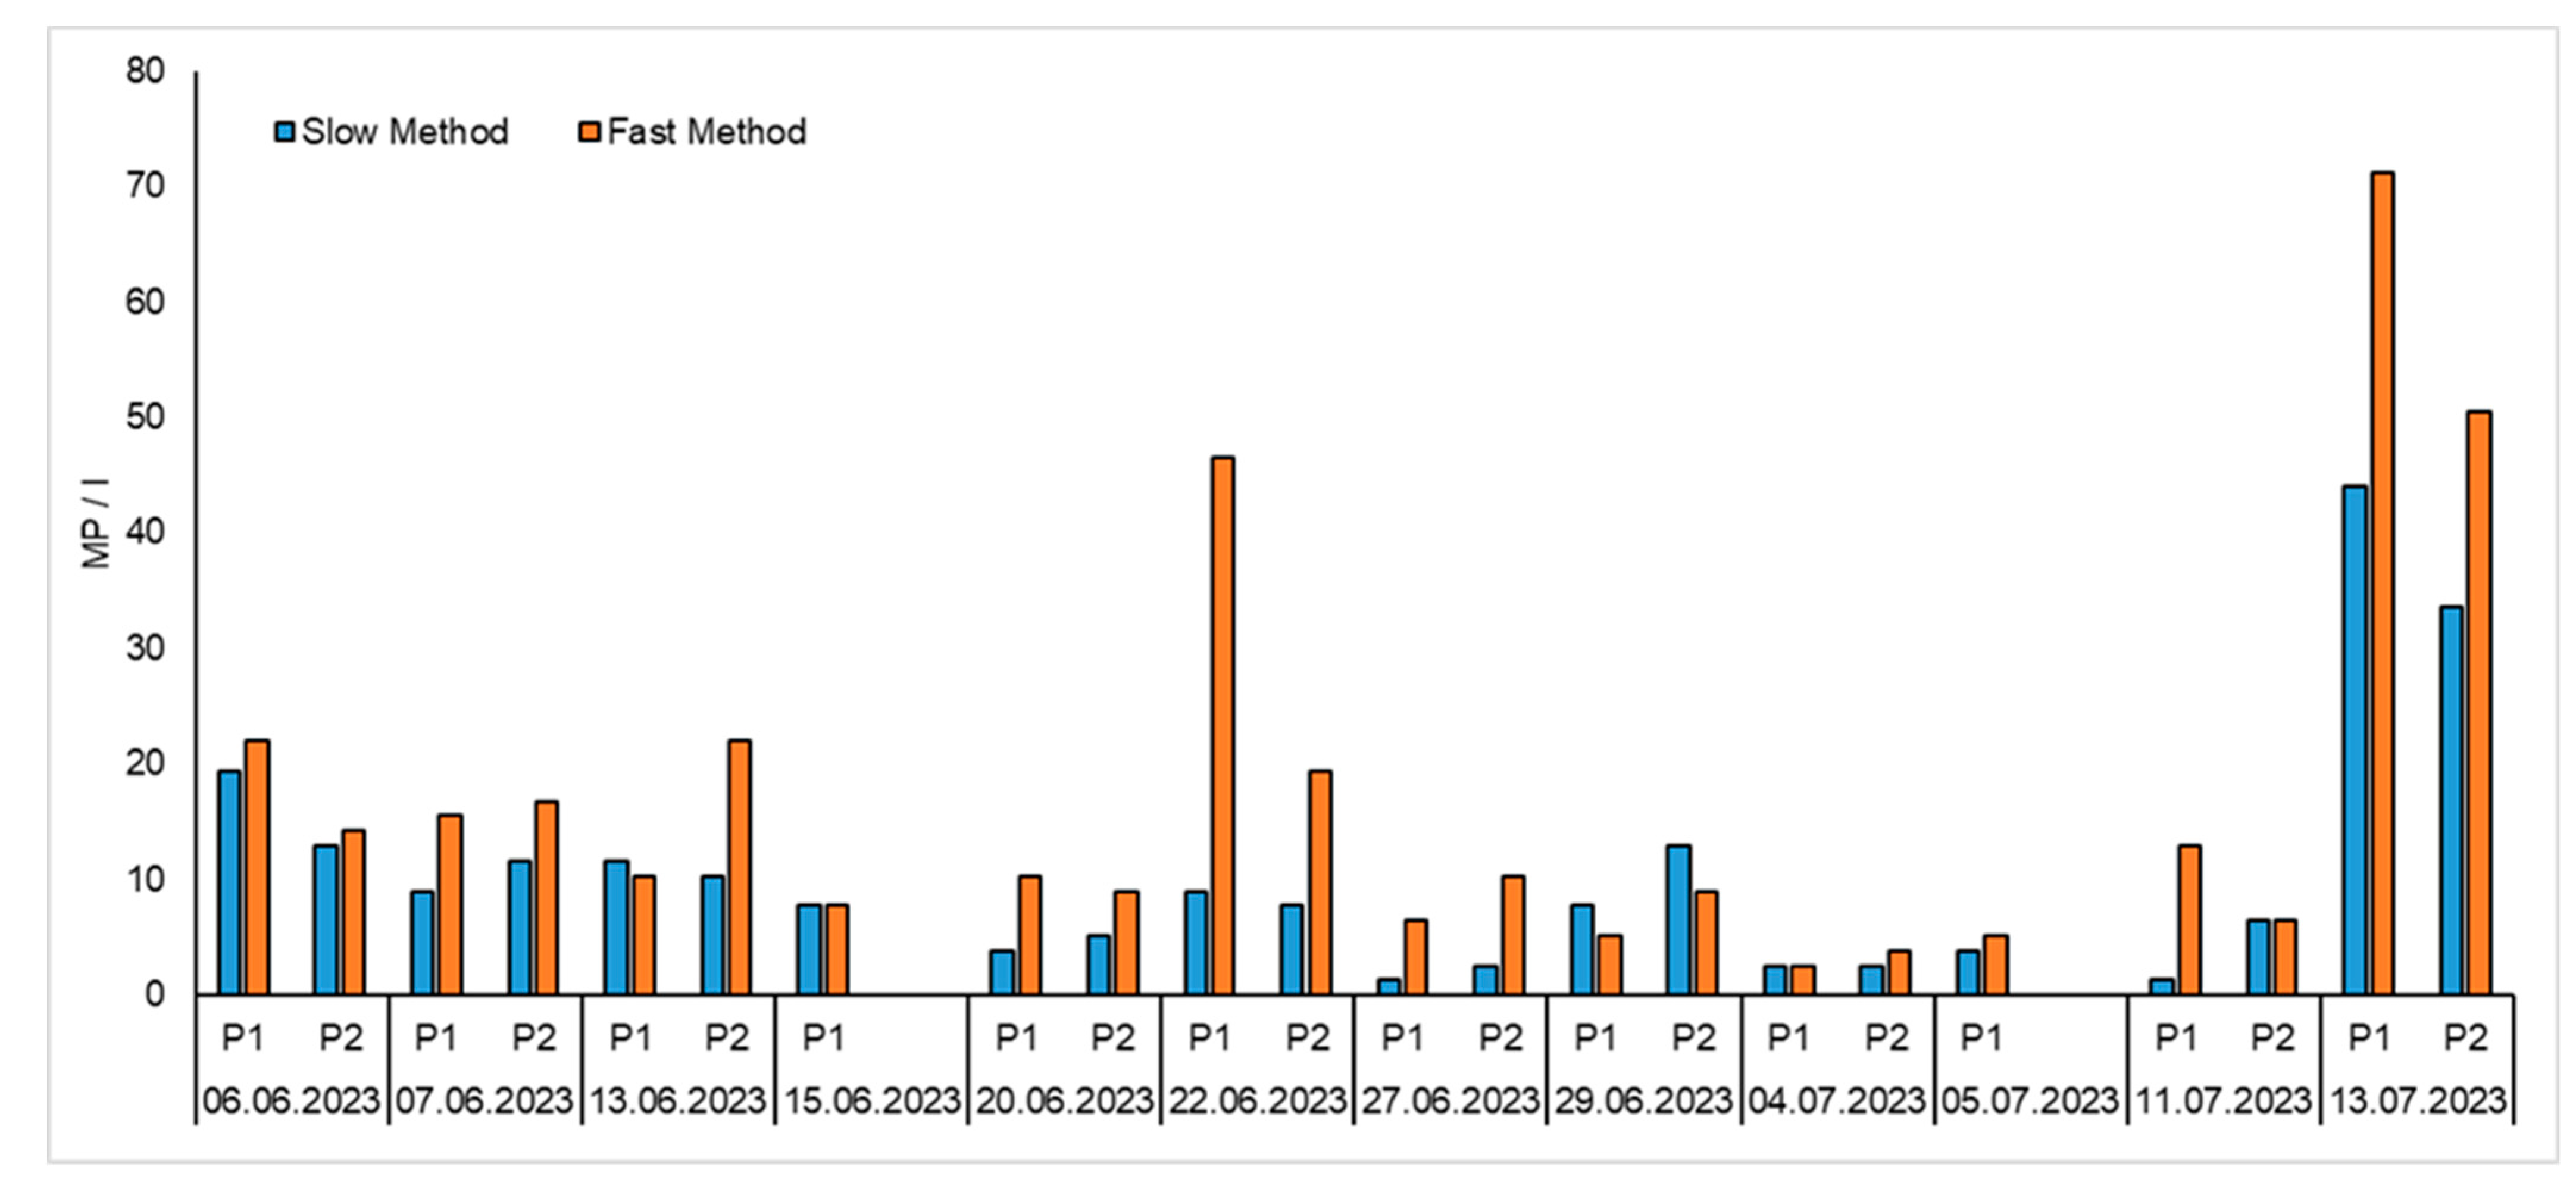
3.5. Comparison of Methods Using Wastewater Samples
4. Conclusions
Supplementary Materials
Author Contributions
Funding
Institutional Review Board Statement
Informed Consent Statement
Data Availability Statement
Acknowledgments
Conflicts of Interest
References
- Rochman, C.M. Microplastics research-from sink to source. Science 2018, 360, 28–29. [Google Scholar] [CrossRef]
- Huang, S.; Huang, X.; Bi, R.; Guo, Q.; Yu, X.; Zeng, Q.; Huang, Z.; Liu, T.; Wu, H.; Chen, Y.; et al. Detection and Analysis of Microplastics in Human Sputum. Environ. Sci. Technol. 2022, 56, 2476–2486. [Google Scholar] [CrossRef] [PubMed]
- Rochman, C.M.; Hoellein, T. The global odyssey of plastic pollution. Science 2020, 368, 1184–1185. [Google Scholar] [CrossRef] [PubMed]
- Koelmans, A.A.; Redondo-Hasselerharm, P.E.; Nor, N.H.M.; de Ruijter, V.N.; Mintenig, S.M.; Kooi, M. Risk assessment of microplastic particles. Nat. Rev. Mater. 2022, 7, 138–152. [Google Scholar] [CrossRef]
- Adhikari, S.; Kelkar, V.; Kumar, R.; Halden, R.U. Methods and challenges in the detection of microplastics and nanoplastics: A mini-review. Polym. Int. 2022, 71, 543–551. [Google Scholar] [CrossRef]
- Fang, C.; Luo, Y.; Naidu, R. Microplastics and nanoplastics analysis: Options, imaging, advancements and challenges. TrAC Trends Anal. Chem. 2023, 117158. [Google Scholar] [CrossRef]
- Muthukumaran, P.; Suresh Babu, P.; Kamaraj, M.; Aravind, J. Microplastics menace: The new emerging lurking environmental issue, a review on sampling and quantification in aquatic environments. Int. J. Environ. Sci. Technol. 2023, 20, 1081–1094. [Google Scholar] [CrossRef]
- Glöckler, F.; Foschum, F.; Kienle, A. Continuous Sizing and Identification of Microplastics in Water. Sensors 2023, 23, 781. [Google Scholar] [CrossRef] [PubMed]
- Choran, N.; Örmeci, B. Micro-flow imaging for in-situ and real-time enumeration and identification of microplastics in water. Front. Water 2023, 5. [Google Scholar] [CrossRef]
- Hyeon, Y.; Kim, S.; Ok, E.; Park, C. A fluid imaging flow cytometry for rapid characterization and realistic evaluation of microplastic fiber transport in ceramic membranes for laundry wastewater treatment. Chem. Eng. J. 2023, 454, 140028. [Google Scholar] [CrossRef]
- Bianco, A.; Carena, L.; Peitsaro, N.; Sordello, F.; Vione, D.; Passananti, M. Rapid detection of nanoplastics and small microplastics by Nile-Red staining and flow cytometry. Env. Chem Lett 2023, 21, 647–653. [Google Scholar] [CrossRef]
- Enyoh, C.E.; Verla, A.W.; Ohiagu, F.O.; Enyoh, E.C. Progress and future perspectives of microplastic research in Nigeria. Int. J. Environ. Anal. Chem. 2023, 103, 1971–1981. [Google Scholar] [CrossRef]
- (EU) 2020/2184; DIRECTIVE (EU) 2020/2184 of the European Parliament and of the Council of 16 December 202. European Union: Maastricht, The Netherlands, 16 December 2020.
- 2022/0345 (COD); Proposal for A Directive of the European Parliament And of The Council Concerning Urban Wastewater Treatment (Recast). European Union: Maastricht, The Netherlands, 2022.
- Belz, S.; Bianchi, I.; Cella, C.; Emteborg, H.; Fumagalli, F.; Geiss, O.; Gilliland, D.; Held, A.; Jakobsson, U.; La Spina, R.; et al. Current Status of the Quantification of Microplastics in Water—Results of a JRC/BAM Inter-Laboratory Comparison Study on PET in Water, EUR 30799 EN; European Union: Maastricht, The Netherlands.
- Liu, S.; Shang, E.; Liu, J.; Wang, Y.; Bolan, N.; Kirkham, M.B.; Li, Y. What have we known so far for fluorescence staining and quantification of microplastics: A tutorial review. Front. Environ. Sci. Eng. 2022, 16. [Google Scholar] [CrossRef]
- Shim, W.J.; Song, Y.K.; Hong, S.H.; Jang, M. Identification and quantification of microplastics using Nile Red staining. Mar. Pollut. Bull. 2016, 113, 469–476. [Google Scholar] [CrossRef]
- Shruti, V.C.; Pérez-Guevara, F.; Roy, P.D.; Kutralam-Muniasamy, G. Analyzing microplastics with Nile Red: Emerging trends, challenges, and prospects. J. Hazard. Mater. 2022, 423, 127171. [Google Scholar] [CrossRef] [PubMed]
- Erni-Cassola, G.; Gibson, M.I.; Thompson, R.C.; Christie-Oleza, J.A. Lost, but Found with Nile Red: A Novel Method for Detecting and Quantifying Small Microplastics (1 mm to 20 μm) in Environmental Samples. Environ. Sci. Technol. 2017, 51, 13641–13648. [Google Scholar] [CrossRef]
- Hernandez, L.M.; Farner, J.M.; Claveau-Mallet, D.; Okshevsky, M.; Jahandideh, H.; Matthews, S.; Roy, R.; Yaylayan, V.; Tufenkji, N. Optimizing the Concentration of Nile Red for Screening of Microplastics in Drinking Water. ACS EST Water 2023, 3, 1029–1038. [Google Scholar] [CrossRef]
- Meyers, N.; Catarino, A.I.; Declercq, A.M.; Brenan, A.; Devriese, L.; Vandegehuchte, M.; de Witte, B.; Janssen, C.; Everaert, G. Microplastic detection and identification by Nile red staining: Towards a semi-automated, cost- and time-effective technique. Sci. Total Environ. 2022, 823, 153441. [Google Scholar] [CrossRef]
- Konde, S.; Brackmann, S.; Prume, J.; Gerhard, M.; Koch, M. Nile Red Staining for the Detection of Microplastics: A Comprehensive Study on the Emission Spectra, 2023. 2023; preprint. [Google Scholar]
- Sturm, M.T.; Myers, E.; Schober, D.; Korzin, A.; Schuhen, K. Development of an Inexpensive and Comparable Microplastic Detection Method Using Fluorescent Staining with Novel Nile Red Derivatives. Analytica 2023, 4, 27–44. [Google Scholar] [CrossRef]
- Lohmann, R.; Cousins, I.T.; DeWitt, J.C.; Glüge, J.; Goldenman, G.; Herzke, D.; Lindstrom, A.B.; Miller, M.F.; Ng, C.A.; Patton, S.; et al. Are Fluoropolymers Really of Low Concern for Human and Environmental Health and Separate from Other PFAS? Environ. Sci. Technol. 2020, 54, 12820–12828. [Google Scholar] [CrossRef]
- Mesquita, P.; Gong, L.; Lin, Y. A Low-Cost Microfluidic Method for Microplastics Identification: Towards Continuous Recognition. Micromachines 2022, 13, 499. [Google Scholar] [CrossRef] [PubMed]
- Wang, C.; Jiang, L.; Liu, R.; He, M.; Cui, X.; Wang, C. Comprehensive assessment of factors influencing Nile red staining: Eliciting solutions for efficient microplastics analysis. Mar. Pollut. Bull. 2021, 171, 112698. [Google Scholar] [CrossRef]
- Park, D.H.; Oh, S.B.; Hong, S.C. In Situ Fluorescent Illumination of Microplastics in Water Utilizing a Combination of Dye/Surfactant and Quenching Techniques. Polymers 2022, 14, 3084. [Google Scholar] [CrossRef]
- Gao, Z.; Wontor, K.; Cizdziel, J.V. Labeling Microplastics with Fluorescent Dyes for Detection, Recovery, and Degradation Experiments. Molecules 2022, 27, 7415. [Google Scholar] [CrossRef] [PubMed]
- Vermeiren, P.; Muñoz, C.; Ikejima, K. Microplastic identification and quantification from organic rich sediments: A validated laboratory protocol. Environ. Pollut. 2020, 262, 114298. [Google Scholar] [CrossRef] [PubMed]
- Pfeiffer, F.; Fischer, E.K. Various Digestion Protocols Within Microplastic Sample Processing—Evaluating the Resistance of Different Synthetic Polymers and the Efficiency of Biogenic Organic Matter Destruction. Front. Environ. Sci. 2020, 8. [Google Scholar] [CrossRef]
- Prata, J.C.; Da Costa, J.P.; Girão, A.V.; Lopes, I.; Duarte, A.C.; Rocha-Santos, T. Identifying a quick and efficient method of removing organic matter without damaging microplastic samples. Sci. Total Environ. 2019, 686, 131–139. [Google Scholar] [CrossRef]
- Sturm, M.T.; Horn, H.; Schuhen, K. The potential of fluorescent dyes-comparative study of Nile red and three derivatives for the detection of microplastics. Anal. Bioanal. Chem. 2021, 413, 1059–1071. [Google Scholar] [CrossRef]
- Shen, M.; Song, B.; Zeng, G.; Zhang, Y.; Teng, F.; Zhou, C. Surfactant changes lead adsorption behaviors and mechanisms on microplastics. Chem. Eng. J. 2021, 405, 126989. [Google Scholar] [CrossRef]
- Ameduri, B. Fluoropolymers: A special class of per- and polyfluoroalkyl substances (PFASs) essential for our daily life. J. Fluor. Chem. 2023, 267, 110117. [Google Scholar] [CrossRef]
- Kang, P.; Zhao, Y.; Zuo, C.; Cai, Y.; Shen, C.; Ji, B.; Wei, T. The unheeded inherent connections and overlap between microplastics and poly- and perfluoroalkyl substances: A comprehensive review. Sci. Total Environ. 2023, 878, 163028. [Google Scholar] [CrossRef]
- An, L.; Liu, Q.; Deng, Y.; Wu, W.; Gao, Y.; Ling, W. Sources of Microplastic in the Environment. In Microplastics in Terrestrial Environments; He, D., Luo, Y., Eds.; Springer International Publishing: Cham, Switzerland, 2020; ISBN 978-3-030-56270-0. [Google Scholar]
- Boucher, J.; Friot, D. Primary microplastics in the oceans: A global evaluaton of sources; IUCN: Gland, Spain, 2017; ISBN 9782831718279. [Google Scholar]
- Acharya, S.; Rumi, S.S.; Hu, Y.; Abidi, N. Microfibers from synthetic textiles as a major source of microplastics in the environment: A review. Text. Res. J. 2021, 91, 2136–2156. [Google Scholar] [CrossRef]
- Myszka, R.; Enfrin, M.; Giustozzi, F. Microplastics in road dust: A practical guide for identification and characterisation. Chemosphere 2023, 315, 137757. [Google Scholar] [CrossRef] [PubMed]
- Azizi, N.; Nasseri, S.; Nodehi, R.N.; Jaafarzadeh, N.; Pirsaheb, M. Evaluation of conventional wastewater treatment plants efficiency to remove microplastics in terms of abundance, size, shape, and type: A systematic review and Meta-analysis. Mar. Pollut. Bull. 2022, 177, 113462. [Google Scholar] [CrossRef]
- Lambert, S.; Scherer, C.; Wagner, M. Ecotoxicity testing of microplastics: Considering the heterogeneity of physicochemical properties. Integr. Environ. Assess. Manag. 2017, 13, 470–475. [Google Scholar] [CrossRef] [PubMed]
- Huang, Z.; Hu, B.; Wang, H. Analytical methods for microplastics in the environment: A review. Environ. Chem. Lett. 2023, 21, 383–401. [Google Scholar] [CrossRef] [PubMed]


| Polymer Type | Abbreviation | Supplier | Preparation |
|---|---|---|---|
| Polyethylene | PE | LyondellBasell, Basell Polyolefine GmbH, Frankfurt, Germany | Granules for industrial use |
| Polypropylene | PP | LyondellBasell, Basell Polyolefine GmbH, Frankfurt, Germany | Granules for industrial use |
| Polyester | PES | EMS-Grilltech, Switzerland | Granules for industrial use |
| Polyamide | PA | EMS-Grilltech, Switzerland | Granules for industrial use |
| Polyvinylchloride | PVC | Sigma-Aldrich, Germany | Granules for industrial use |
| Fluorethylenpropylen | FEP | Ambofluor GmbH & Co. KG, Hamburg, Germany | Granules for industrial use |
| Ethylen-Tetrafluorethylen | ETFE | Ambofluor GmbH & Co. KG, Hamburg, Germany | Granules for industrial use |
| Polyvinylidene flouride | PVDF | Ambofluor GmbH & Co. KG, Hamburg, Germany | Granules for industrial use |
| Styrene-butadiene rubber | SBR | RCT Reichelt Chemietechnik GmbH + Co., Heidelberg, Germany | Shredding of the rubber sample (19746; SBR-Food-Platte—Shore 65°) |
| Natural rubber | NR | ARNOWA GmbH, Salzkotten, Germany | Cutting of a latex glove |
| Blend of SBR and NR | SBR-NR | WiCo Wichmann, Otto & Cie GmbH + Co. KG, Wenden, Germany | Shredding of the rubber sample (NR/SBR hell 65Sh FDA Rollen; G40160103010000) |
| Tire abrasion | Bike tire | Shredding of the tire | |
| Tube abrasion | Bike tube | Shredding of the tube | |
| Wood | Fine shavings of Quercus spec. | ||
| Chitin | Ground shell of Mytilidae | ||
| Chalk | Ground exoskeleton of Pandalus borealis |
| Version | Procedure |
|---|---|
| Slow (old method) Sturm et al. (2023) [23] |
|
| Fast (new method) |
|
| Fluorescence | Excitation | Emission | Exposure | Gain |
|---|---|---|---|---|
| Blue | 395 nm | 430–480 nm | 500 ms | 4 |
| Green | 430–480 nm | 500–570 nm | 500 ms | 4 |
| Orange | 500–570 nm. | 570–640 | 500 ms | 4 |
Disclaimer/Publisher’s Note: The statements, opinions and data contained in all publications are solely those of the individual author(s) and contributor(s) and not of MDPI and/or the editor(s). MDPI and/or the editor(s) disclaim responsibility for any injury to people or property resulting from any ideas, methods, instructions or products referred to in the content. |
© 2023 by the authors. Licensee MDPI, Basel, Switzerland. This article is an open access article distributed under the terms and conditions of the Creative Commons Attribution (CC BY) license (https://creativecommons.org/licenses/by/4.0/).
Share and Cite
Sturm, M.T.; Myers, E.; Korzin, A.; Polierer, S.; Schober, D.; Schuhen, K. Fast Forward: Optimized Sample Preparation and Fluorescent Staining for Microplastic Detection. Microplastics 2023, 2, 334-349. https://doi.org/10.3390/microplastics2040026
Sturm MT, Myers E, Korzin A, Polierer S, Schober D, Schuhen K. Fast Forward: Optimized Sample Preparation and Fluorescent Staining for Microplastic Detection. Microplastics. 2023; 2(4):334-349. https://doi.org/10.3390/microplastics2040026
Chicago/Turabian StyleSturm, Michael Toni, Erika Myers, Anika Korzin, Sabrina Polierer, Dennis Schober, and Katrin Schuhen. 2023. "Fast Forward: Optimized Sample Preparation and Fluorescent Staining for Microplastic Detection" Microplastics 2, no. 4: 334-349. https://doi.org/10.3390/microplastics2040026