Article

Expression of Cowpea VuWRKY21 and VuWRKY87 Genes in Arabidopsis thaliana Confers Plant Tolerance to Salt Stress

by
Joelson Germano Crispim
1,
Elenilson dos Santos Souza
1,
Marina Ferreira Kitazono Antunes
1,
Hai Liu
2,
Valesca Pandolfi
1,
Marciana Bizerra de Morais
3,
Lili Sun
2,
Cláudia Ulisses
3,
Roel Collamat Rabara
2,
José Ribamar Costa Ferreira-Neto
1,
Ana Maria Benko-Iseppon
1,
Michael P. Timko
2 and
Ana Christina Brasileiro-Vidal
1,*
1
Department of Genetics, Biosciences Center, Federal University of Pernambuco, Recife 50730-120, PE, Brazil
2
Department of Biology, University of Virginia, Charlottesville, VA 22904, USA
3
Postgraduate Program in Plant Breeding Genetics, Department of Agronomy, Federal Rural University of Pernambuco, Recife 52171-900, PE, Brazil
*
Author to whom correspondence should be addressed.
DNA 2023, 3(4), 168-185; https://doi.org/10.3390/dna3040014
Submission received: 10 September 2023 / Revised: 16 October 2023 / Accepted: 1 November 2023 / Published: 8 November 2023

Abstract

:
WRKY transcription factors play a pivotal role in regulating stress signaling pathways, including those associated with salt stress response. The present work characterized the effects of two WRKY genes from Vigna unguiculata, namely VuWRKY21 and VuWRKY87, on enhancing plant salinity tolerance. Under salt stress conditions, Arabidopsis lines expressing VuWRKY21 or VuWRKY87 showed elevated expression of genes participating in saline stress response pathways and reduced oxidative stress induced by reactive oxygen species (ROS). Among the salt-responsive genes in Arabidopsis, AtP5CS1, AtNHX1, AtRD29A, AtSOS3, AtSOS2, and AtSOS1 exhibited modulated expression levels after stress imposition. Furthermore, compared to wild-type plants, at most evaluated times, transgenic lines, on average, presented lower H2O2 content while displaying higher content of SOD (EC: 1.15.1.1) and CAT (EC: 1.11.1.6) at early stages of salt stress. These findings suggest that the expression of both VuWRKY genes in Arabidopsis, particularly VuWRKY21, activated genes involved in salinity tolerance.

Graphical Abstract

1. Introduction

Saline soil presents a critical factor that affects crop growth and productivity [1]. Known effects include reduced germination, growth, and vigor in seedlings, which consequently limits plant yield, resulting in an average annual biomass loss of more than 50% [2,3]. This stress may trigger alterations in membrane properties, an increase in respiration, inhibition of photosynthesis, and a decrease in dry matter production, among other effects [4].
Plants respond to stressful situations by accumulating osmoprotectants, such as amino acids, antioxidants, and sugars. This is achieved via the activation of various structural and regulatory genes. Among the genes involved are those encoding late embryogenesis abundant (LEA) proteins, enzymes involved in proline biosynthesis and antioxidant activity (e.g., superoxide dismutase—SOD and catalase—CAT), proteins engaged in selective water transport and ion regulation, and specific transcription factor (TF) families, such as the WRKY family [5,6].
WRKY TFs play a pivotal role in responding to abiotic stress [7,8]. For instance, RD29A and RD29B, which encode hydrophilic proteins associated with various abiotic stresses, can be upregulated by WRKY [9]. In GhWRKY6-like (Gossypium hirsutum L.) Arabidopsis thaliana (L.) Heynh, the osmotic stress-related AtRD29A and AtRD29B genes exhibited increased expression under salt stress [10].
The Arabidopsis AtP5CS1 belongs to the category of osmoprotectant genes involved in abiotic stress tolerance. It encodes a Δ1-pyrroline-5-carboxylate synthase (P5CS) responsible for proline synthesis. The overexpression of a Triticum aestivum L. WRKY gene, TaWRKY46, increased the expression of P5CS1 in Arabidopsis. This elevation in expression could enhance osmoregulatory functions and subsequently maintain the osmotic capacity, safeguarding plant water content during osmotic stress [11].
Furthermore, WRKY genes also play an important role in the regulation of genes associated with the Salt-Overly Sensitive (SOS) pathway [12,13]. The SOS pathway genes stand as pivotal elements in salinity response. After an initial accumulation of Na+ in the root, the cytosolic Na+ reduction is likely mediated by the SOS pathway. The SOS3/SOS2 complex triggers the presumed Na+/H+ (NHX/SOS1) exchanger, which transports Na+ from the cytosol to the apoplast of the cortex, root, and epidermis [14]. Enhanced expression of genes belonging to the SOS pathway has been associated with increased salt stress tolerance in diverse studies [13,15]. In Fortunella crassifolia Swingle, FcWRKY40 upregulated SOS pathway genes [13]. The overexpression of FtWRKY46, a WRKY gene from Fagopyrum tataricum (L.) Gaertn, led to the upregulation of AtSOS1, AtSOS2, and AtSOS3 genes in Arabidopsis. This is likely facilitated by W-box cis-regulatory elements identified in the promoter regions of these genes [16].
Several WRKY genes from various species, including wheat TaWRKY93, watermelon [Citrullus lanatus (Thunb.) Matsum. & Nakai] ClWRKY20, and bamboo [Phyllostachys edulis (Carrière) J.Houz.] PheWRKY86, have been overexpressed in Arabidopsis to assess their effects on the regulation of genes responsive to abiotic stresses, including salt stress [17,18,19]. In peanuts (Arachis hypogaea L.), for example, enhanced salinity tolerance was achieved via the expression of AhWRKY75 [20]. Notably, the regulatory mechanism of WRKY on target gene expression exhibits significant similarities between dehydration and salinity responses [10,21]. Thus, the recognized importance of WRKY TFs in regulating genes responsive to abiotic stresses, such as drought and salinity, is evident, pointing to their use in genetic engineering for acquiring tolerance.
Among the legumes of socioeconomic importance, cowpea [Vigna unguiculata (L.) Walp.] holds a prominent position as a widely cultivated legume consumed worldwide, both in its fresh form and as dry beans [22]. Apart from its nutritional advantages, cowpea offers an appealing solution for impoverished and degraded soils. This is due to its release of high-quality organic matter, facilitation of nutrient cycling in the soil, and enhancement of water retention. Thus, cowpea presents its capacity to rehabilitate nutrients in saline soils and to biologically fix nitrogen from the soil in symbiosis with rhizobia [1,23,24,25].
Advances in sequencing technologies and the extensive generation of genomic and transcriptomic data in plants have played a crucial role in identifying regulatory genes involved in plant adaptation to environmental conditions [26]. Previously, we identified 25 differentially expressed VuWRKY genes in cowpea under root dehydration. Among them, VuWRKY21 and VuWRKY87 stood out, exhibiting significant induction levels at early stages (25–100 min) of abiotic stress [27]. Considering the regulatory role of WRKY genes under abiotic stresses, such as drought and salinity, the analysis of selected VuWRKY members in transgenic A. thaliana plants emerges as an alternative method for assessing these candidate genes’ responses to abiotic stress. Singh et al. [28], for instance, showed that SlWRKY23, from Solanum lycopersicum (L.), imparts tolerance to NaCl and mannitol stress via the interaction of the auxin and ethylene in A. thaliana.
Thus, the present work aimed to analyze the biochemical effects and the differential expression of genes responsive to salt stress in A. thaliana expressing the cowpea genes VuWRKY21 or VuWRKY87.

2. Materials and Methods

2.1. Gene Cloning and Plant Transformation

Based on our previous work, two WRKY cowpea genes (VuWRKY21 and VuWRKY87) were selected as representative of early genes responsive to root dehydration stress, as described by Matos et al. [27]. They are deposited at the NCBI BioProject (https://www.ncbi.nlm.nih.gov/bioproject/) under reference numbers BioProject ID: PRJNA605156 and BioSample: SAMN14051116. The coding regions of both genes were PCR-amplified via Phusion DNA polymerase (Thermo Fisher Scientific Inc., Waltham, MA, USA) from root cDNA samples of dehydration-stressed “Pingo de Ouro” cowpea accession (see [27]). Primers were designed using the Primer-BLAST tool at NCBI (https://www.ncbi.nlm.nih.gov/, accessed on 25 November 2013) for VuWRKY21 [forward (ATGGAACCAACATGCTT) and reverse (TTACCATTTGGCCTCTAG)] with an expected product of 807 bp, and for VuWRKY87 [forward (ATGGACAACATGGGAGAC) and reverse (TCATGGGTTATCGAATCTGA)] with an expected product of 1062 bp. Target PCR products were separated in a 1.5% agarose gel and recovered with a ZymocleanTM Gel DNA Recovery kit (Zymo Research, Irvine, CA, USA). The recovered DNA fragments were mobilized in the intermediate vector pENTR/D-TOPO (Invitrogen, Grand Island, NY, USA) for sequencing verification, followed by introduction into the pGWB6 destination vector [29] via LR recombination reaction (Gateway LR Clonase Enzyme mix; Invitrogen, Grand Island, NY, USA). The resulting plasmids were called pGWB-VuWRKY21 and pGWB-VuWRKY87, with each VuWRKY gene under the control of the constitutive 35S Cauliflower Mosaic Virus (CaMV) promoter. Both the pGWB-VuWRKY21 and pGWB-VuWRKY87 were introduced into Agrobacterium tumefaciens strain LBA4404 via electroporation. Positive colonies were selected on a solid YEB medium containing 50 mg/L of kanamycin, 67.5 mg/L of rifampicin, and 50 mg/L of streptomycin and further confirmed by PCR to verify the presence of VuWRKY21 or VuWRKY87. Plants of A. thaliana (ecotype Columbia, Col-0) were transformed using the floral dip method as described by Bechtold and Bouchez [30] and modified by Clough and Bent [31].

2.2. Subcellular Location, Molecular Weight (kDa), and Isoelectric Point of VuWRKY21 and VuWRKY87 Proteins

Polypeptide sequences corresponding to the VuWRKY21 and VuWRKY87 genes were used to determine the subcellular location via the Cell-Ploc online tool 2.0 [32]. Isoelectric point and molecular mass values were calculated using the JVirGel tool 2.0 [33].

2.3. Establishment and Generation Advance of Transformed A. thaliana

The T1 seeds of transgenic plants containing the VuWRKY21 or VuWRKY87 genes were collected and stored at 4 °C until germination. The seeds were sterilized with 2.0% sodium hypochlorite containing 0.1% Tween-20, followed by five washes in sterile distilled water. The surface sterilized seeds were vernalized for 48 h at 4 °C before being plated on a solid MS [34] medium containing kanamycin and hygromycin (50 mg/L each) as selective agents.
After fifteen days, the positively germinated seedlings with at least four leaves were individually acclimatized in pots containing a mixture of the commercial substrate (Forth Condicionador Floreiras—naturally decomposed pine bark, ash, and calcium sulfate) and vermiculite (1:1). Plants were grown in a controlled environment with the following growth condition: 20 to 22.5 °C, 16:8 h photoperiod, and relative humidity of 70 to 80% under irrigation every three days. After two weeks of cultivation, the waterings were interspersed with the addition of fertilizer NPK 20-20-20 (1.0 g/L). Each T1 seedling was considered a transgenic event and sequentially numbered in each generation.
To advance generations, T1 seeds were grown in the presence of antibiotics, and antibiotic-resistant T2 plants containing the VuWRKY21 and VuWRKY87 genes were self-fertilized and analyzed by conventional PCR to confirm the transgene insertion. Afterward, for each confirmed transgenic event, 150 T3 seeds were germinated on solid selective MS plates described above. Events with at least 90% of the seeds germinated and four leaves in the rosette were considered homozygous after 15 days of cultivation. The positive and negative controls consisted of 150 seeds of the wild type (WT), cultivated under the same conditions as the transgenic lines, varying only concerning the absence and presence of the selective agents (kanamycin and hygromycin, 50 mg/L each) in the culture medium, respectively.

2.4. Germination and Root Elongation under Salt Stress

To test salt effects on germination, the seeds (i.e., WT, VuWRKY21 transgenic lines, and VuWRKY87 transgenic lines) were treated on a series of MS media with three different concentrations of NaCl (0, 100, and 200 mM). The daily number of germinated seeds was monitored with a stereomicroscope for seven days. Each experiment was performed in triplicate, with each replicate composed of 40 seeds of the three lines in homozygosity for the genes VuWRKY21 or VuWRKY87 (L1, L2, and L3) and the WT.
To test the salt effects on root elongation, three-day MS-cultivated seeds with roots of 0.5 cm were transferred to the test conditions, MS media with three different concentrations of NaCl (0, 100, and 200 mM). After seven days, root lengths were measured using a digital caliper. The final values of root lengths consisted of the measured value minus 0.5 cm, corresponding to the initial root length. This test was performed with three biological replicates, with each replicate composed of 20 seeds for each transgenic line or the WT.

2.5. Exposure to Salt Stress

For the salinity assays, plants of three transgenic lines homozygous for VuWRKY21 or VuWRKY87 and the WT plants were germinated, acclimated, and cultivated as described in Section 2.3. After 28 days of acclimation, the plants were divided into treated and control groups. Plants of the treated group were irrigated with an NPK 20-20-20 solution (1.0 g/L) supplemented with 200 mM NaCl. The control group was irrigated only with NPK 20-20-20 (1.0 g/L). Rosette leaves were collected from both groups at 1, 2, 4, and 8 h after treatments. Additionally, for each time, there was a control plant that was simultaneously collected, immediately frozen in liquid nitrogen, and stored at −80 °C. These control plants were cultivated under the same conditions and watered only with the NPK solution, without the addition of NaCl (0 h NaCl). Biological triplicates were established for gene expression analyses by qPCR (Real-Time quantitative PCR), in which each plant corresponded to one replicate. For biochemical analyses, each biological replicate was composed of 20 plants. The experiments were performed in a growth room under controlled photoperiod conditions (16 h of light) and a temperature of 21 °C.

2.6. Hydrogen Peroxide (H2O2) and Malondialdehyde (MDA) Quantification

Hydrogen peroxide content was quantified based on the protocol of Alexieva et al. [35]. Briefly, 5 mL of 0.1% trichloroacetic acid (TCA) leaf extract supernatant was mixed with 0.5 mL of 100 mM K-phosphate buffer and 2 mL of 1M potassium iodide (KI) and incubated for 1 h in darkness before the absorbance was measured at 390 nm. Lipid peroxidation was quantified following Heath and Packer [36], with modifications. The reaction was determined by the production of MDA, a metabolite reactive to 2-thiobarbituric acid (TBA).

2.7. Enzymatic Tests and Quantification of Soluble Proteins

Quantification of the total soluble proteins (TSP) was performed as described by Bradford [37]. For the determination of the catalase (CAT; EC: 1.11.1.6) and superoxide dismutase (SOD; EC: 1.15.1.1) activities, the methodologies proposed by Havir and Mchale [38] and Giannopolitis and Ries [39], respectively, were employed. All biochemical analyses were performed with three biological replicates. Each biological replicate was composed of 20 plants.

2.8. RNA Extraction, cDNA Synthesis, and Analysis of the Differential Expression by qPCR

The total RNA was extracted based on the protocol established by Zhao et al. [40] and treated with RNAse-free DNAse (Ambion, Invitrogen, Graičiūno Vilius, Lithuania). RNA was quantified by fluorimetry using Qubit (Invitrogen). For each sample, 0.5 µg of RNA was reversely transcribed using the Improm-II Reverse Transcriptional System (Promega, Madison, WI, USA), following the manufacturer’s specifications.
Differential expression analysis was performed via qPCR with iTaq Universal SYBR Green Supermix kit (BioRad, Foster City, CA, USA), following the manufacturer’s specifications. All primers used are listed in Table S1, and their melting curve can be observed in Figure S1. For each sample, three biological replicates and three technical replicates for each biological replicate were carried out. The quantification cycles (Cqs) were compared between the treated and control of their respective time conditions (control condition: plant cultivated under the same conditions and watered only with the solution, without the addition of NaCl - 0 h NaCl) and were normalized using the Cq values of the reference gene AtUbiquitin (Table S1). Additionally, primers used for the qPCR analyses of VuWRKY21 and VuWRKY87 were aligned by BLASTn against the reference genome of A. thaliana using the Primer-BLAST tool at NCBI (https://www.ncbi.nlm.nih.gov/ accessed on 30 December 2020) to detect possible cross-amplifications (Table S2).
The amplification efficiency for each primer pair was calculated by a standard curve generated by serial dilutions of the cDNA (1/10, 1/100, and 1/1000) in a technical triplicate using the equation E = 10(−1/slop of the standard curve)−1. The standard curve slopes between the range of −3.58 and −3.10 were considered acceptable for the assay [41]. These slope values were equivalent to amplification efficiencies of 90% (E = 1.9) and 110% (E = 2.1), according to the MIQE guidelines for qPCR [42].

2.9. Statistical Analyses of the Relative Gene Expression

Data showed normal distributions by the Lilliefors’ test and homogeneity by the Kolmogorov–Smirnov’s test. Next, the analysis of variance (ANOVA) was employed in a 4 × 3 factorial arrangement (lines x NaCl concentrations) for each VuWRKY gene, followed by the post hoc Tukey’s test (p < 0.05). For the statistical analysis of the germination index, the values were transformed using the arc sine √x (%) formula. All data were analyzed using the program Genes [43].
The relative expression of the target transcripts was determined using the Software of Relative Expression Rest 2009 in the standard mode. The analysis was based on paired comparisons using randomization and bootstrapping with the Pair-wise Fixed Reallocation Randomization Test [44]. The hypothesis test (p < 0.05) was used to determine whether the differences in the expression of the target transcripts in control and treated conditions were significant (Tables S3 and S4). For each evaluated time (1 h, 2 h, 4 h, and 8 h), there was an untreated control plant. For relative expression values below 1.0, the formula −1/X was used, where X corresponds to the value of the relative expression obtained.

3. Results

3.1. Subcellular Location, Molecular Weight (kDa), and Isoelectric Point of VuWRKY21 and VuWRKY87 Proteins

The VuWRKY21 gene encodes a polypeptide of 317 amino acids (aa) in length, with a molecular weight (MW) of 35.36 kDa and isoelectric point (pI) of 8.23, while VuWRKY87 encodes a protein composed of 353 aa, with an MW of 39.36 kDa and pI of 5.67. Both proteins are predicted to be localized in the nucleus. The results show similar molecular weight values but basic or acidic characteristics for the analyzed VuWRKY proteins, respectively (Table S5).

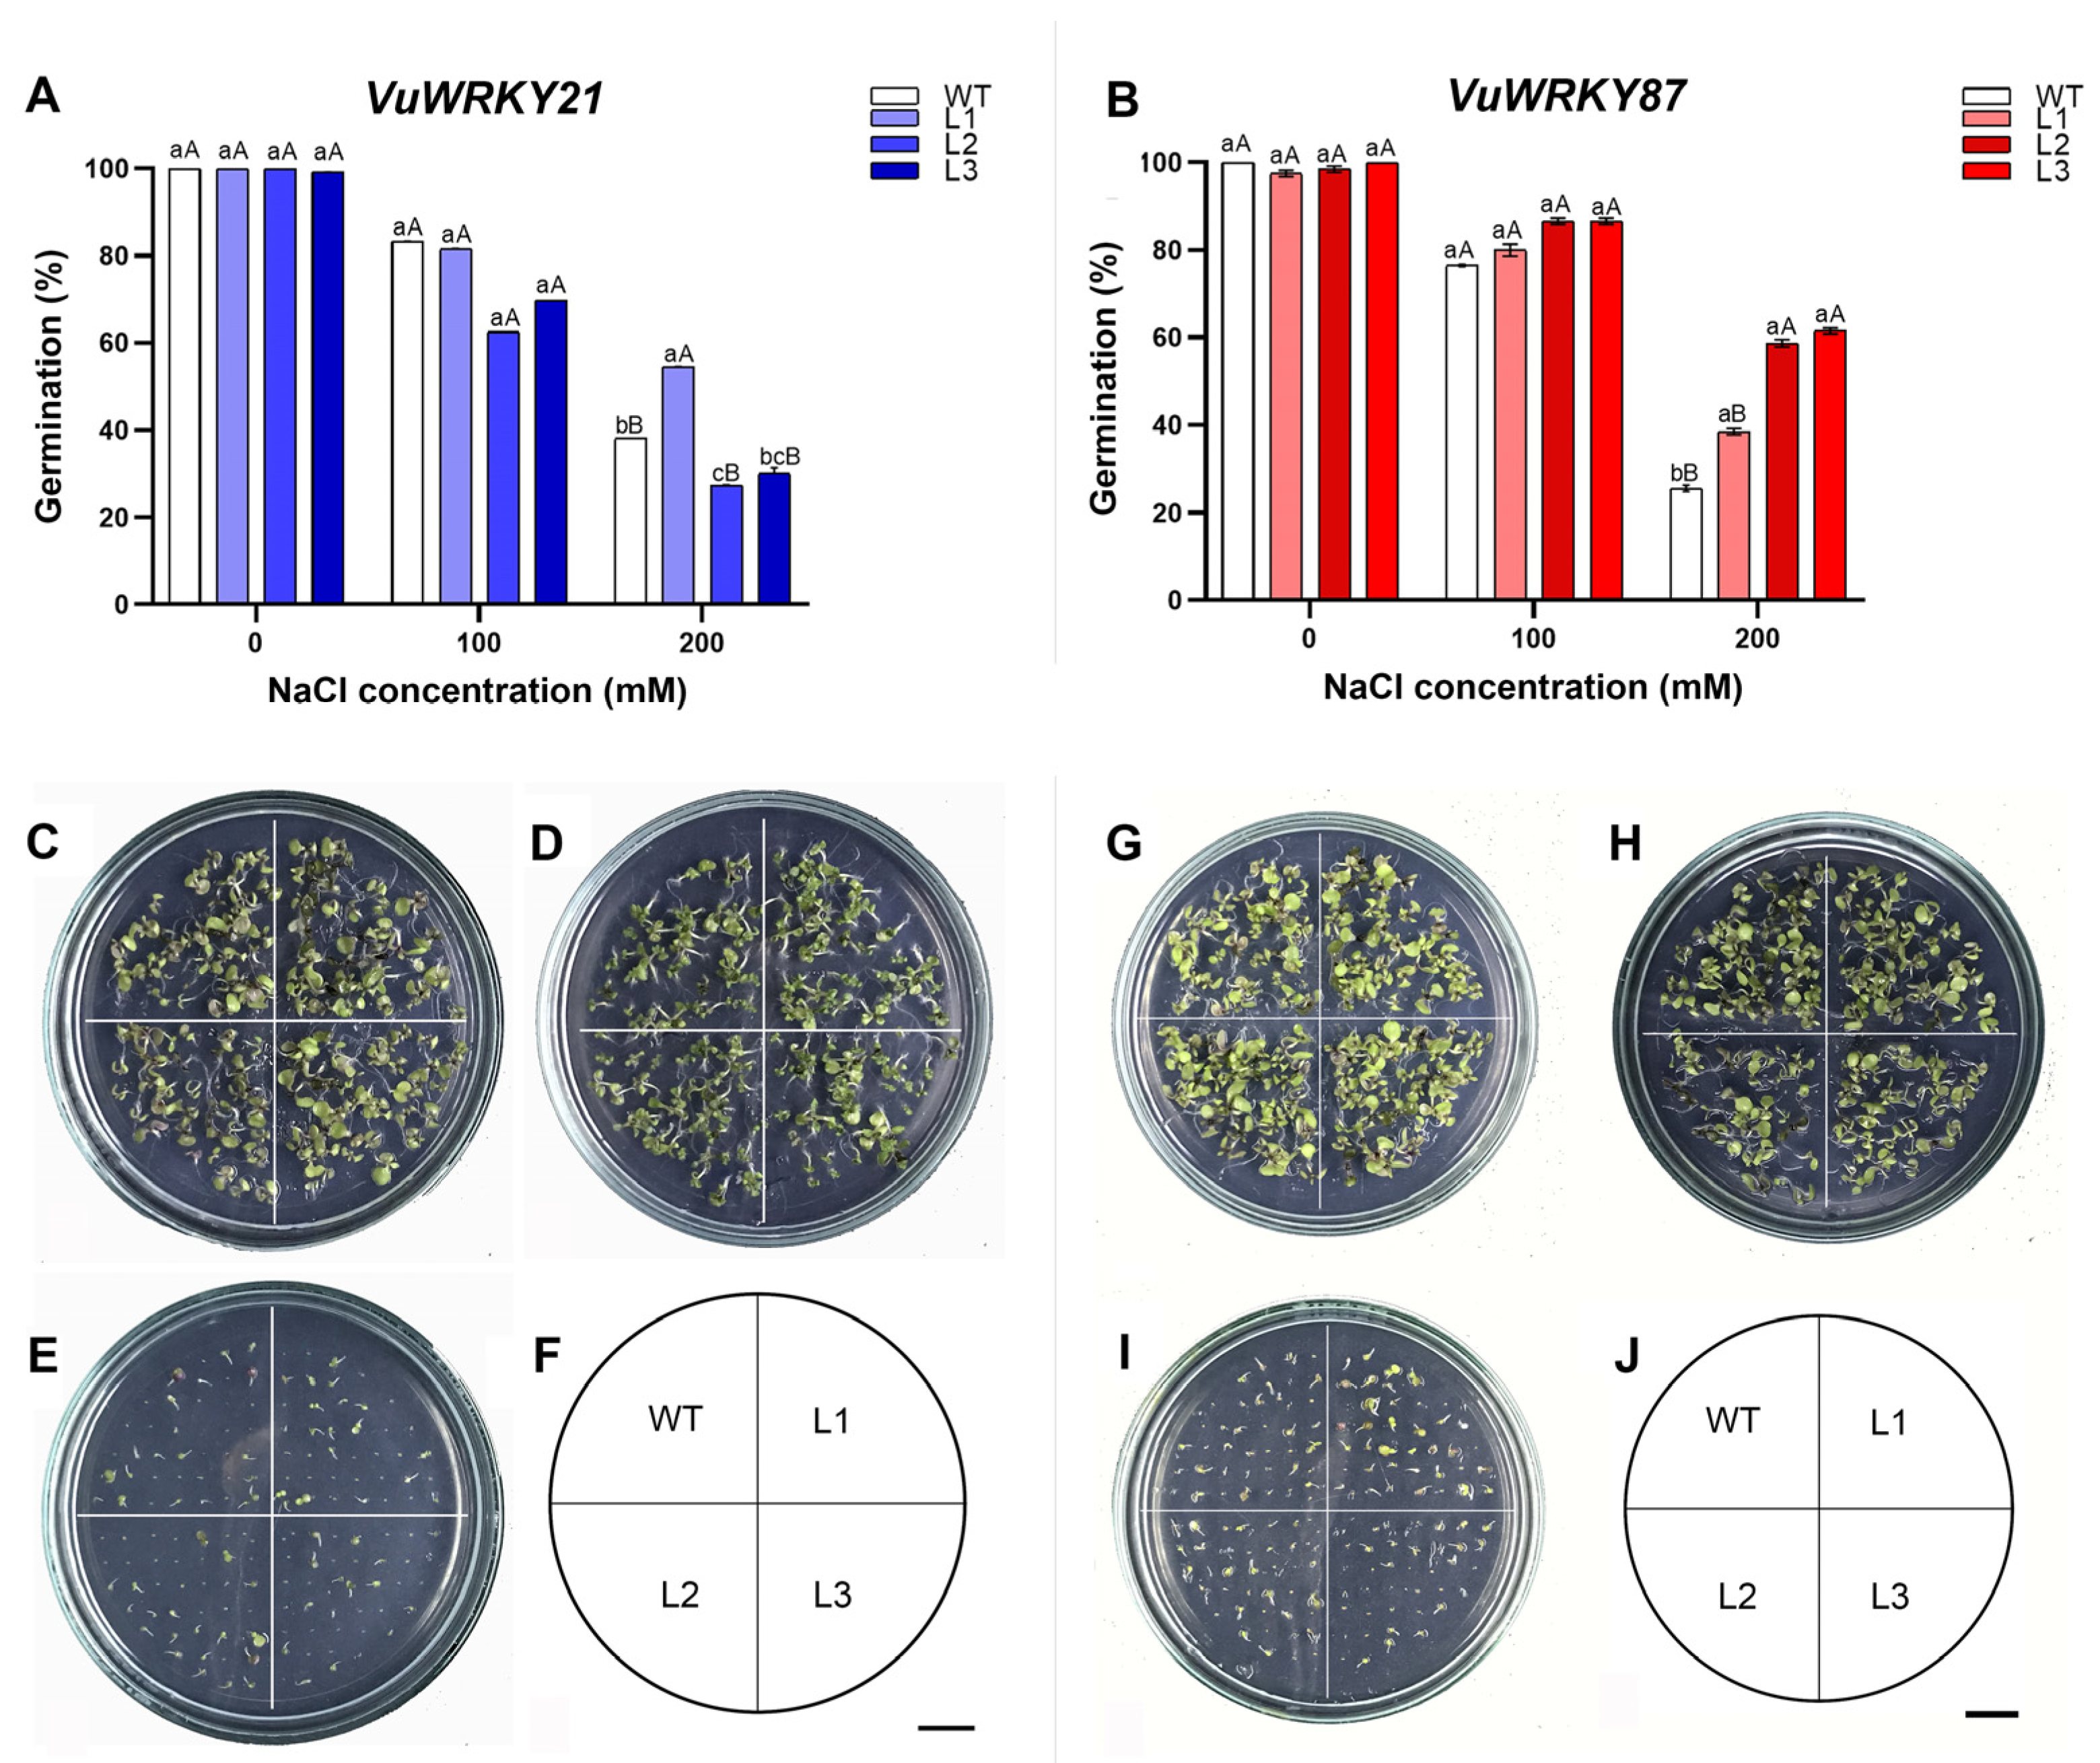
3.2. Seed Germination and Root Elongation Tests

To explore the role of VuWRKY21 and VuWRKY87 on the salt tolerance of cowpea, three transgenic lines (L1, L2, and L3) were, respectively generated for each gene, and the T3 generation non-segregating homozygous lines were analyzed.
The three T3 homozygous VuWRKY21 lines (L1, L2, and L3) exhibited germination rates of 100% (L1 and L2) and 99.17% (L3) in the absence of salt after seven days of cultivation. Similarly, the T3 seed lots from three VuWRKY87 lines had germination rates from 97.50 to 99.17% (Figure 1A). A reduction in the germination rate was observed in proportion to the increase in NaCl concentration after seven days of treatment. At 200 mM NaCl, the VuWRKY21 L1 seeds exhibited the lowest reduction in the germination rate (54.58%) when compared to VuWRKY21 L2 (27%), VuWRKY21 L3 (30%), and WT (38%). Similarly, the germination rate of VuWRKY87 L2 (59.17%) and VuWRKY87 L3 (61.67%) seeds were significantly less affected by 200 mM NaCl compared to VuWRKY87 L1 (39.17%) and WT (25.83%). By 15 days of cultivation, little phenotypic difference could be observed between WT and the VuWRKY21 or VuWRKY87 lines (Figure 1C–H).
There was a significant reduction in root length with increased salt concentration from 100 mM to 200 mM in both WT and transgenic lines. Nevertheless, no significant difference in root length was detected when comparing the WT plants to VuWRKY21 or VuWRKY87 transgenic lines (Figure S2A,B). Despite the little difference, the mean values obtained for root length in the transgenic lines were superior to those of the WT under NaCl stresses (Figure S2C–H).

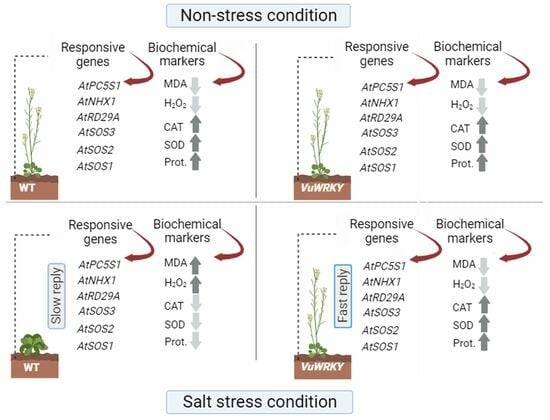
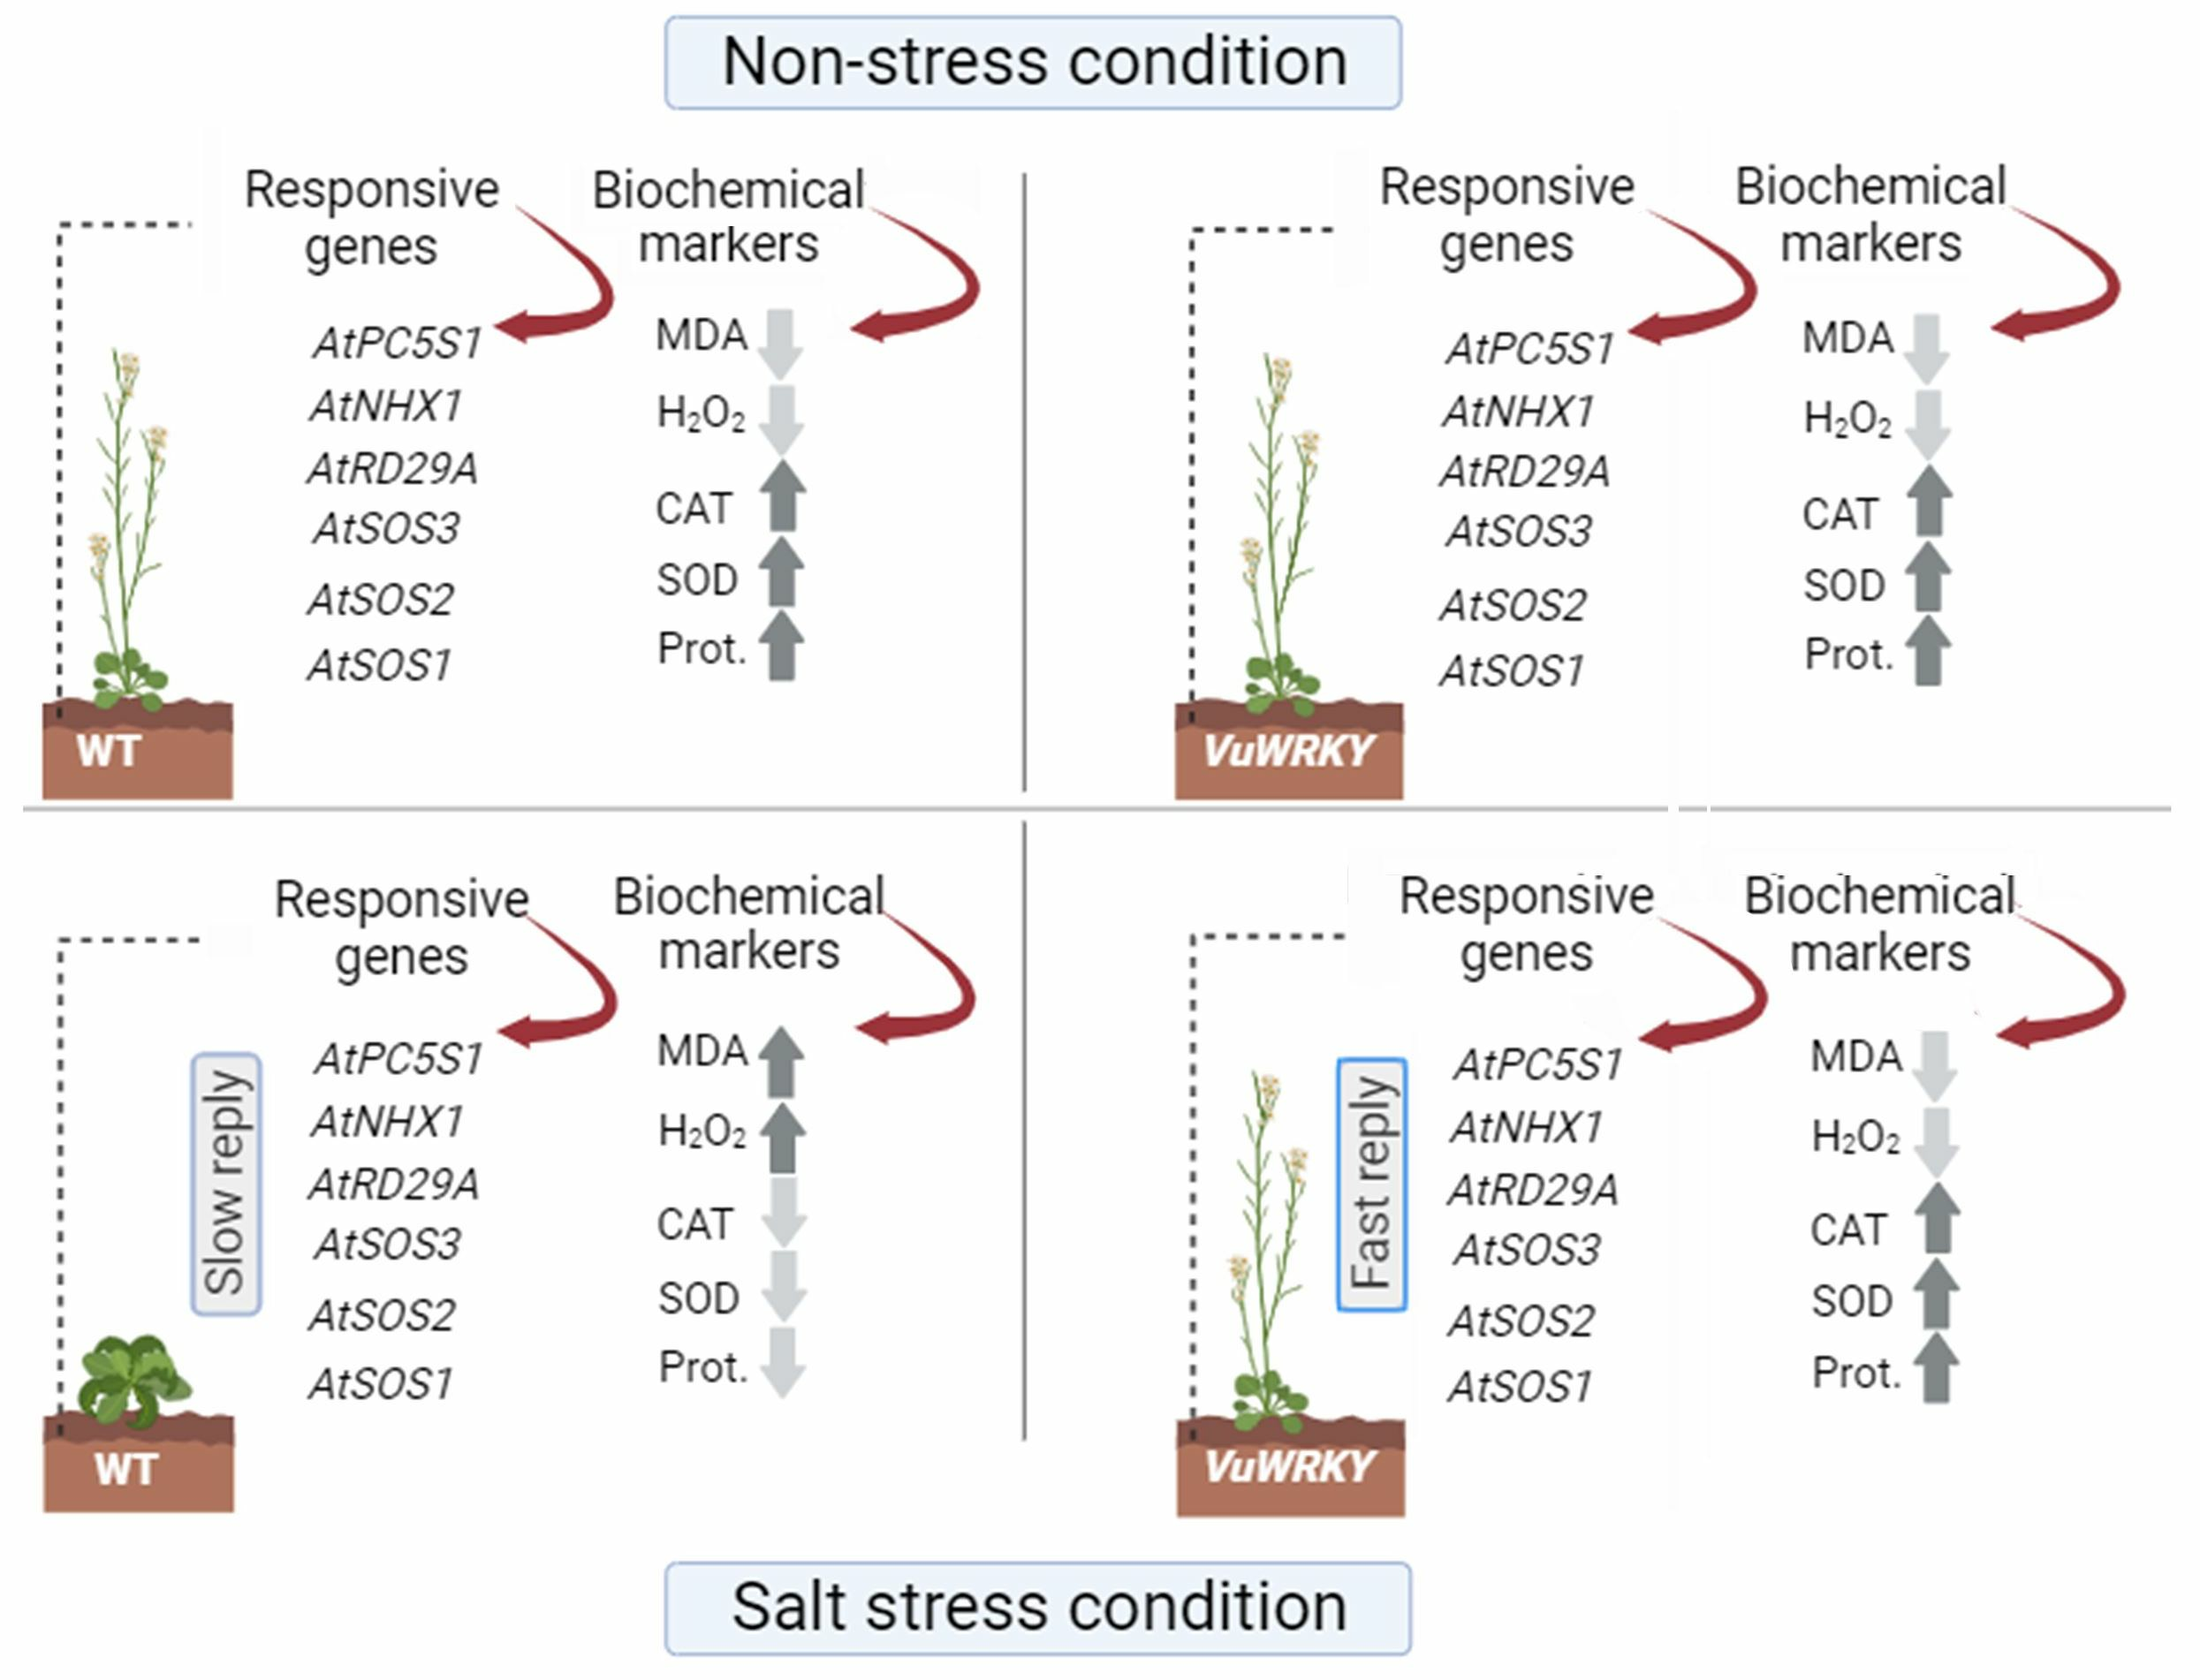
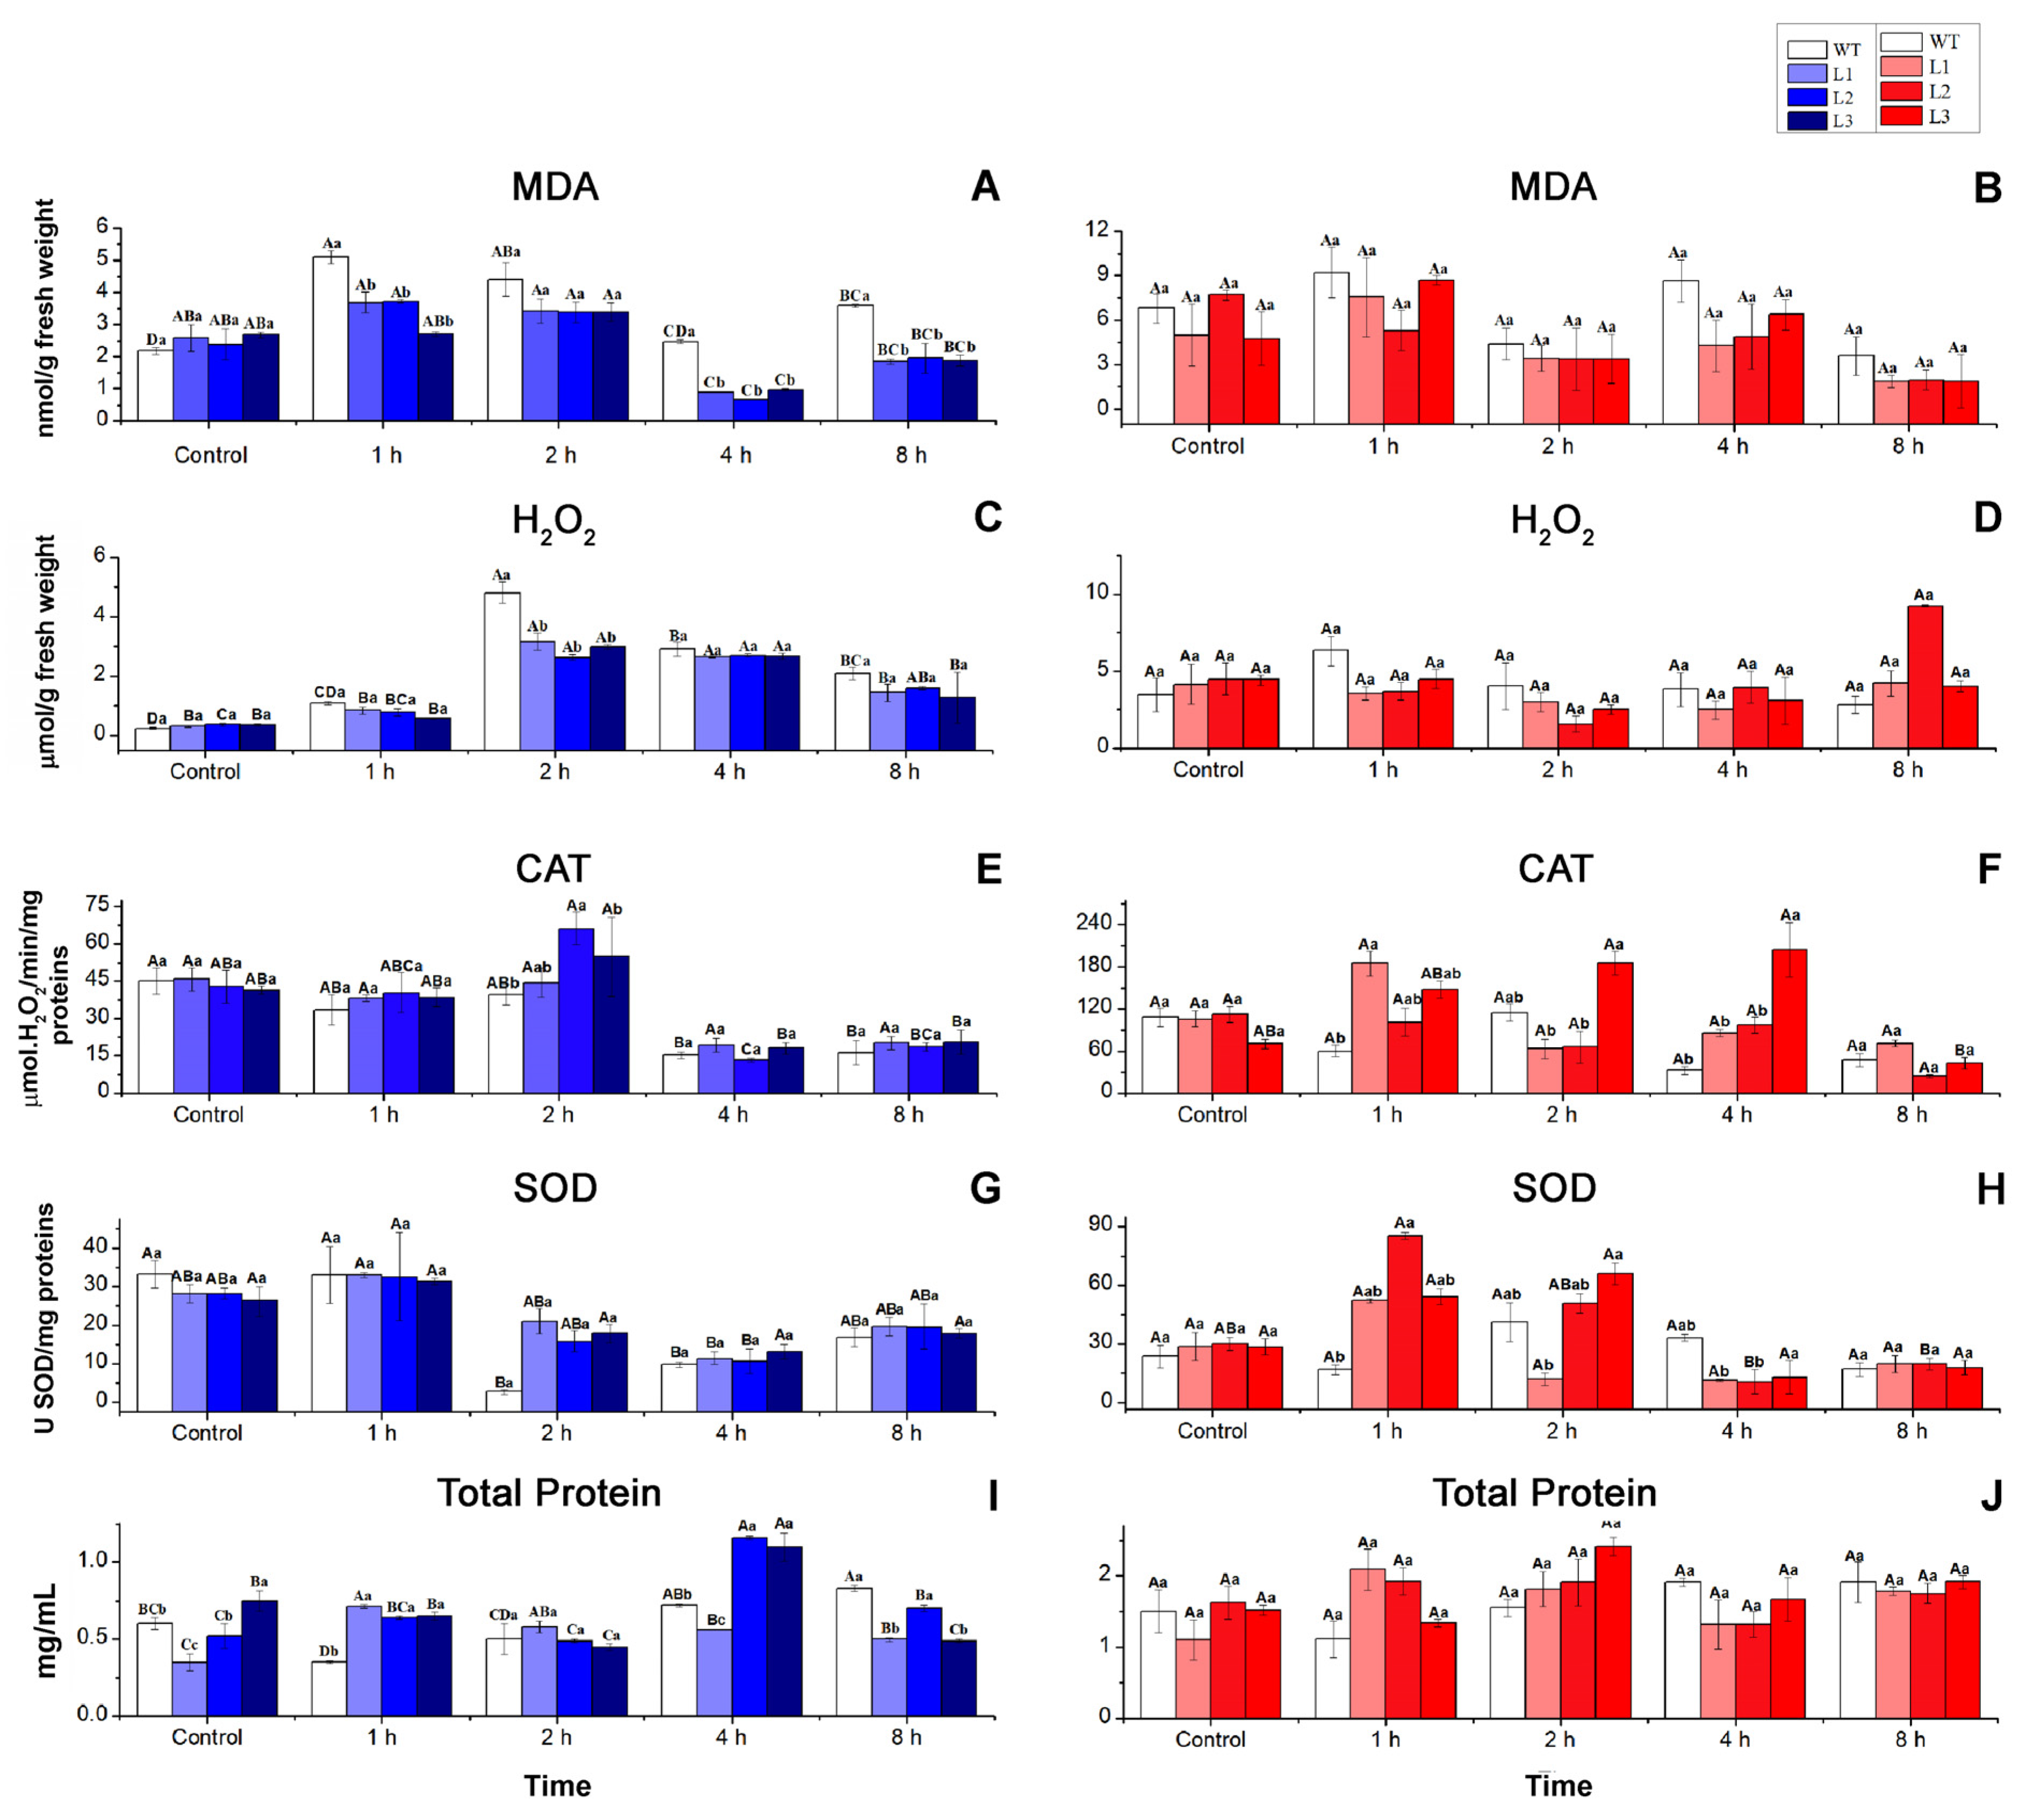
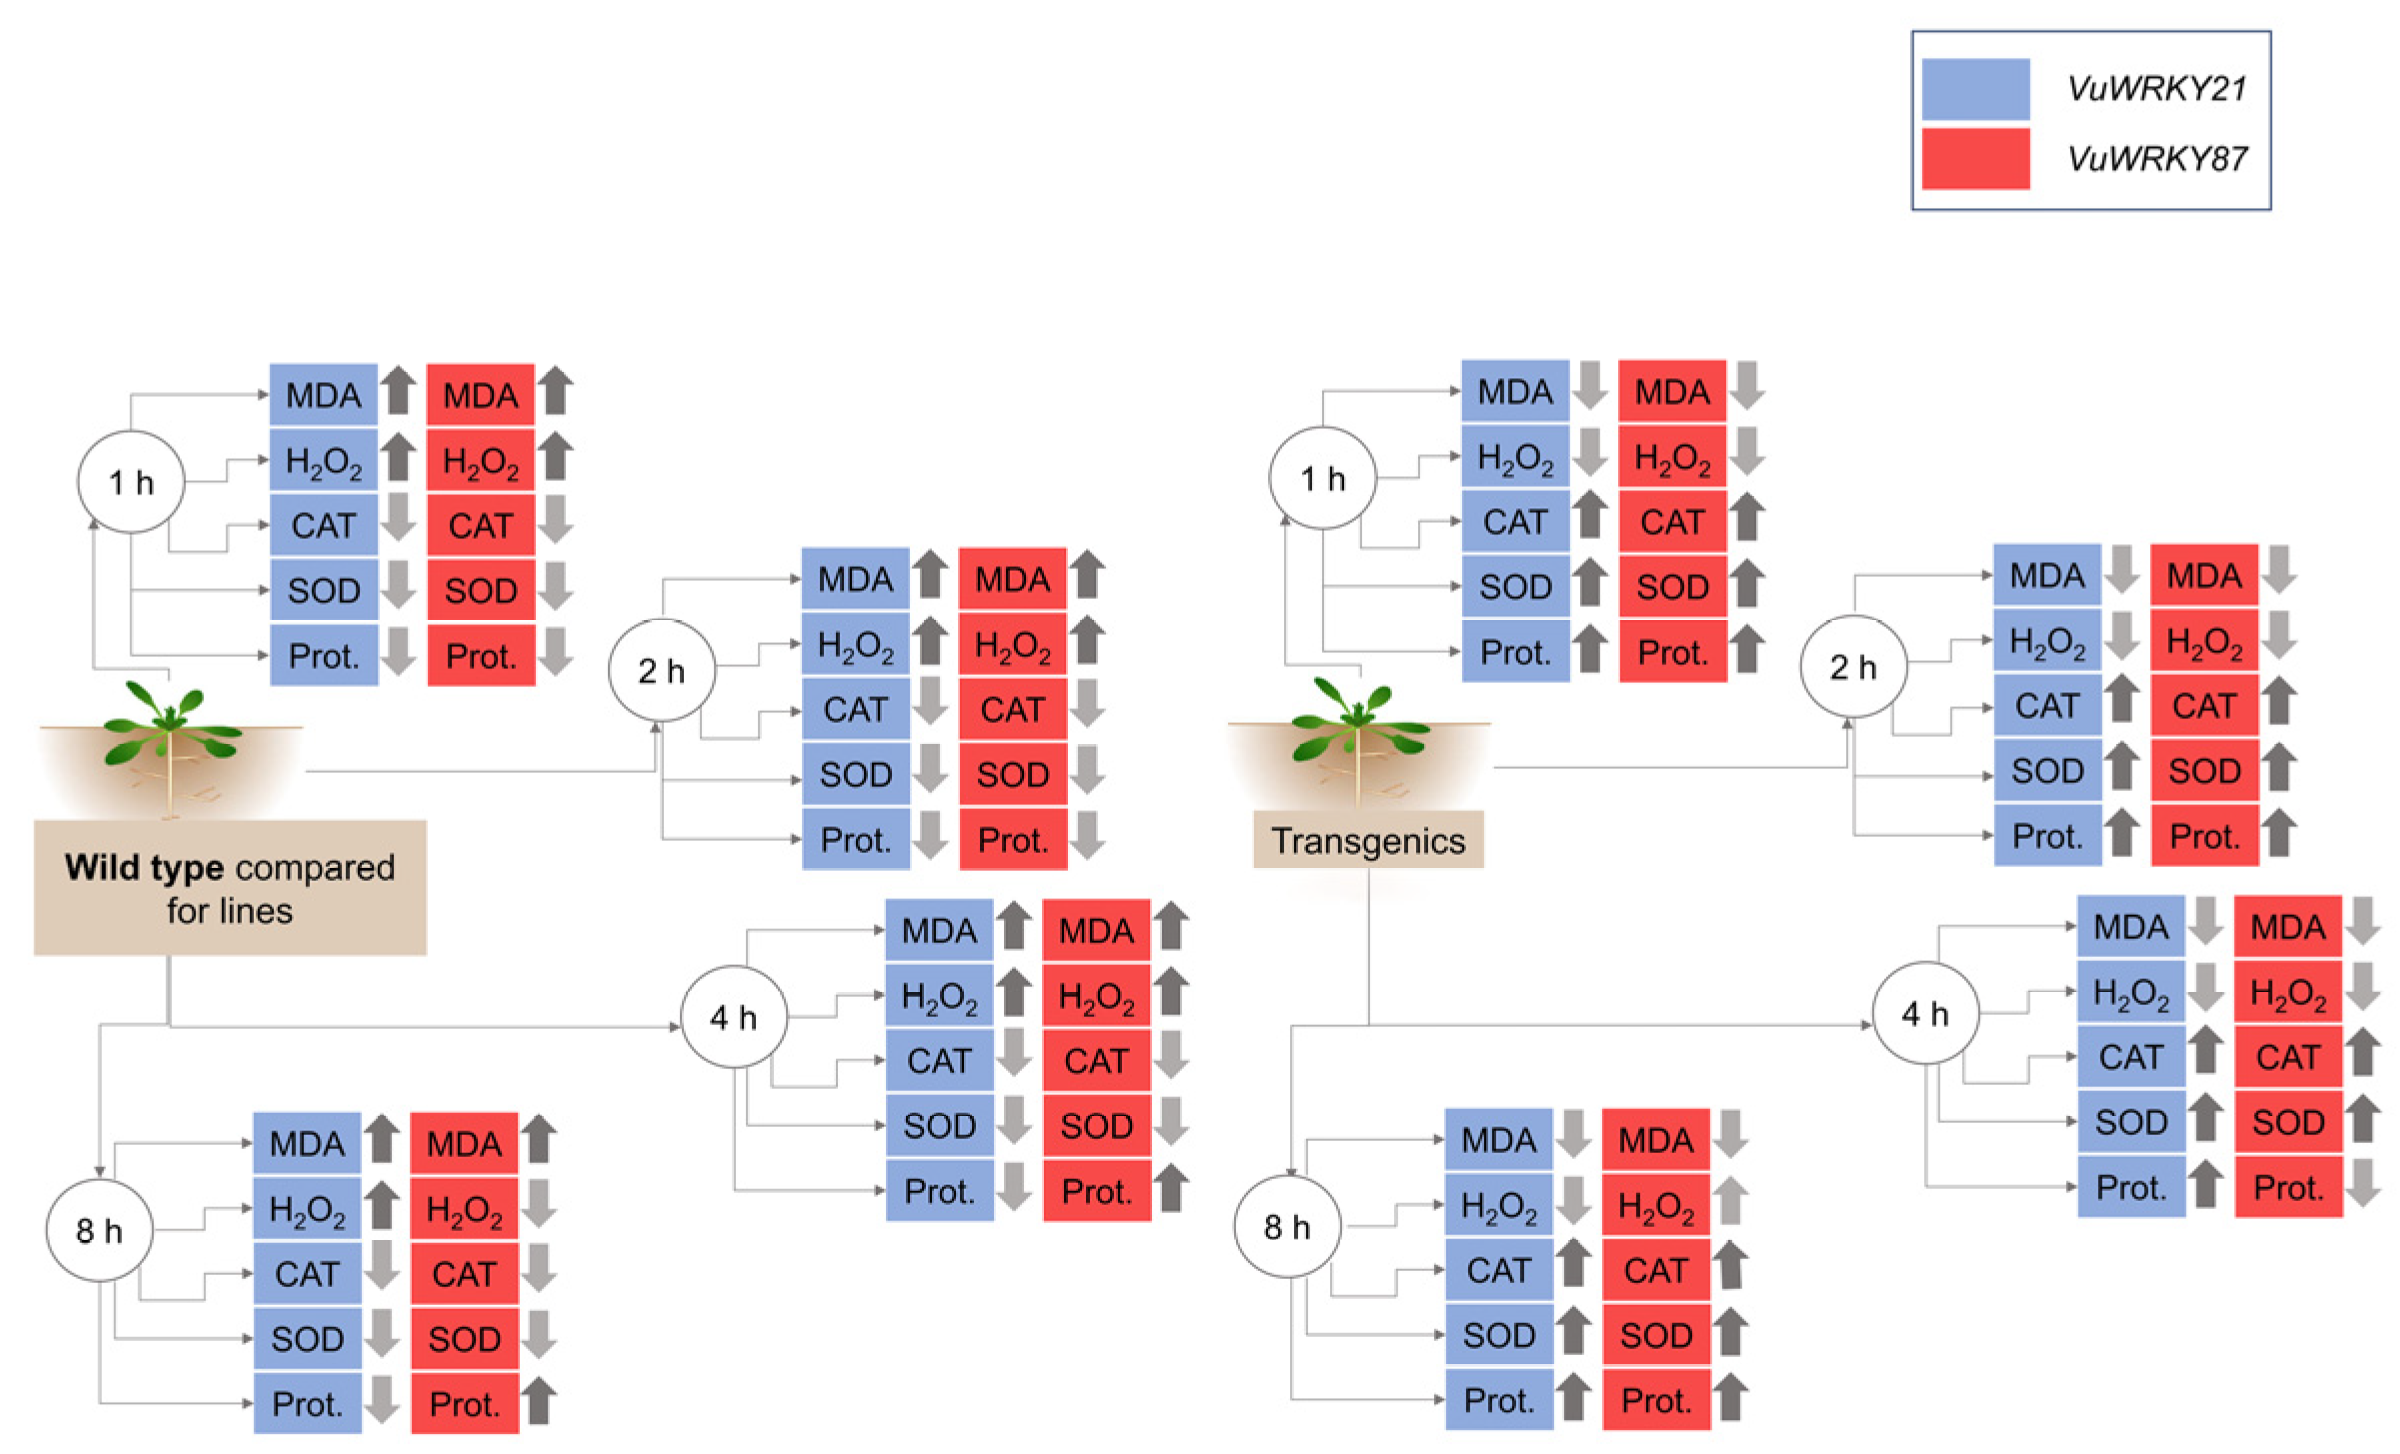
3.3. Biochemical Responses

To better understand possible biochemical alterations accompanying the observed changes above, we examine a series of metabolic parameters in the transgenic lines. It was verified that the WT plants presented the highest MDA content compared to all VuWRKY21 transgenic lines. Significant differences in MDA content between WT lines and VuWRKY21 transgenic lines were observed for 1 h, 4 h, and 8 h post-stress imposition (PSI, Figure 2A). The highest values were observed within the first 2 h PSI. At 1 h PSI, the MDA content level in the WT plants doubled, and there was a 33.87% increase in MDA content in WT plants compared to the mean MDA content of the transgenic lines (Figure 2A). Although a reduction was observed over time for all lines tested, the MDA content in WT was markedly higher than that in the VuWRKY21 lines, especially at 4 h PSI (65.91% higher) and 8 h PSI (47.10% higher, Figure 2A). Although no significant phenotypic differences were observed between the WT plants and the VuWRKY87 lines, the highest MDA contents were detected in the WT plants for all the time points evaluated (Figure 2B).
The highest H2O2 contents were observed at 2 h PSI in both WT and VuWRK21 lines, with the WT lines bearing around 30% higher H2O2 contents than the VuWRK21 lines (Figure 2C). Although not statistically significant, the WT plants still appeared to have higher H2O2 contents than VuWRK21 lines at 4 h and 8 h. No significant differences in H2O2 content were observed between the WT plants and VuWRKY87 lines for all the time points evaluated. Nonetheless, at the early stage (1 h and 2 h PSI), the WT plants presented a non-significant increase in H2O2 content at 28 and 31%, respectively, compared to the mean of the transgenic lines (Figure 2D).
The highest catalase activity occurred at the early stages (1 h and 2 h PSI) for both the WT and the VuWRKY21 transgenic lines. In particular, the mean CAT activity in the transgenic lines was 39.80% higher than that in the WT plants at 2 h PSI (Figure 2E). At 4 h and 8 h PSI, CAT activity remained higher in the VuWRKY21 transgenic lines (10.36% and 21.42%, respectively) compared to WT plants (Figure 2E). The VuWRKY87 plants presented a significant increase in CAT activity, especially at 1 h and 4 h PSI. At 1 h, VuWRKY87 transgenic lines showed a 140% increase, while the increase reached 290% at 4 h, both compared to WT plants (Figure 2F).
In both WT and VuWRKY21 lines, the superoxide dismutase (SOD) exhibited a decline starting from 2 h PSI (Figure 2G). Despite the reduction, the VuWRKY21 lines showed specific SOD activity five times greater than the WT plants at 2 h PSI (Figure 2G). At 4 and 8 h, the WT also presented a reduced SOD activity (19.20 and 12.92%, respectively) compared to the mean of the transformed lines. In the VuWRKY87 transgenic lines, the highest SOD activity occurred during the early stages (1 h and 2 h PSI). Significant differences in the mean SOD activity were observed between VuWRKY87 transgenic lines and WT plants at 1 h PSI, with the transgenic lines displaying nearly three times higher SOD activity (Figure 2H).
As shown in Figure 2I, the total protein content in the WT plants was lower than the mean values of the total protein content in the VuWRKY21 lines at 1 h, 2 h, and 4 h PSI. Notably, the total protein level in WT plants was 66.43% lower than the mean value of the total protein level in VuWRKY21 lines at 1 h (Figure 2I). No significant differences were observed between VuWRKY87 transgenic lines and the WT plants throughout all the time points. Nevertheless, at 1 h PSI, the mean protein content in the VuWRK87 plants was around 45% higher than that in WT plants. As summarized in Figure 3, both VuWRKY21 and VuWRKY87 transgenic lines performed better than the WT plants in all biochemical parameters evaluated.

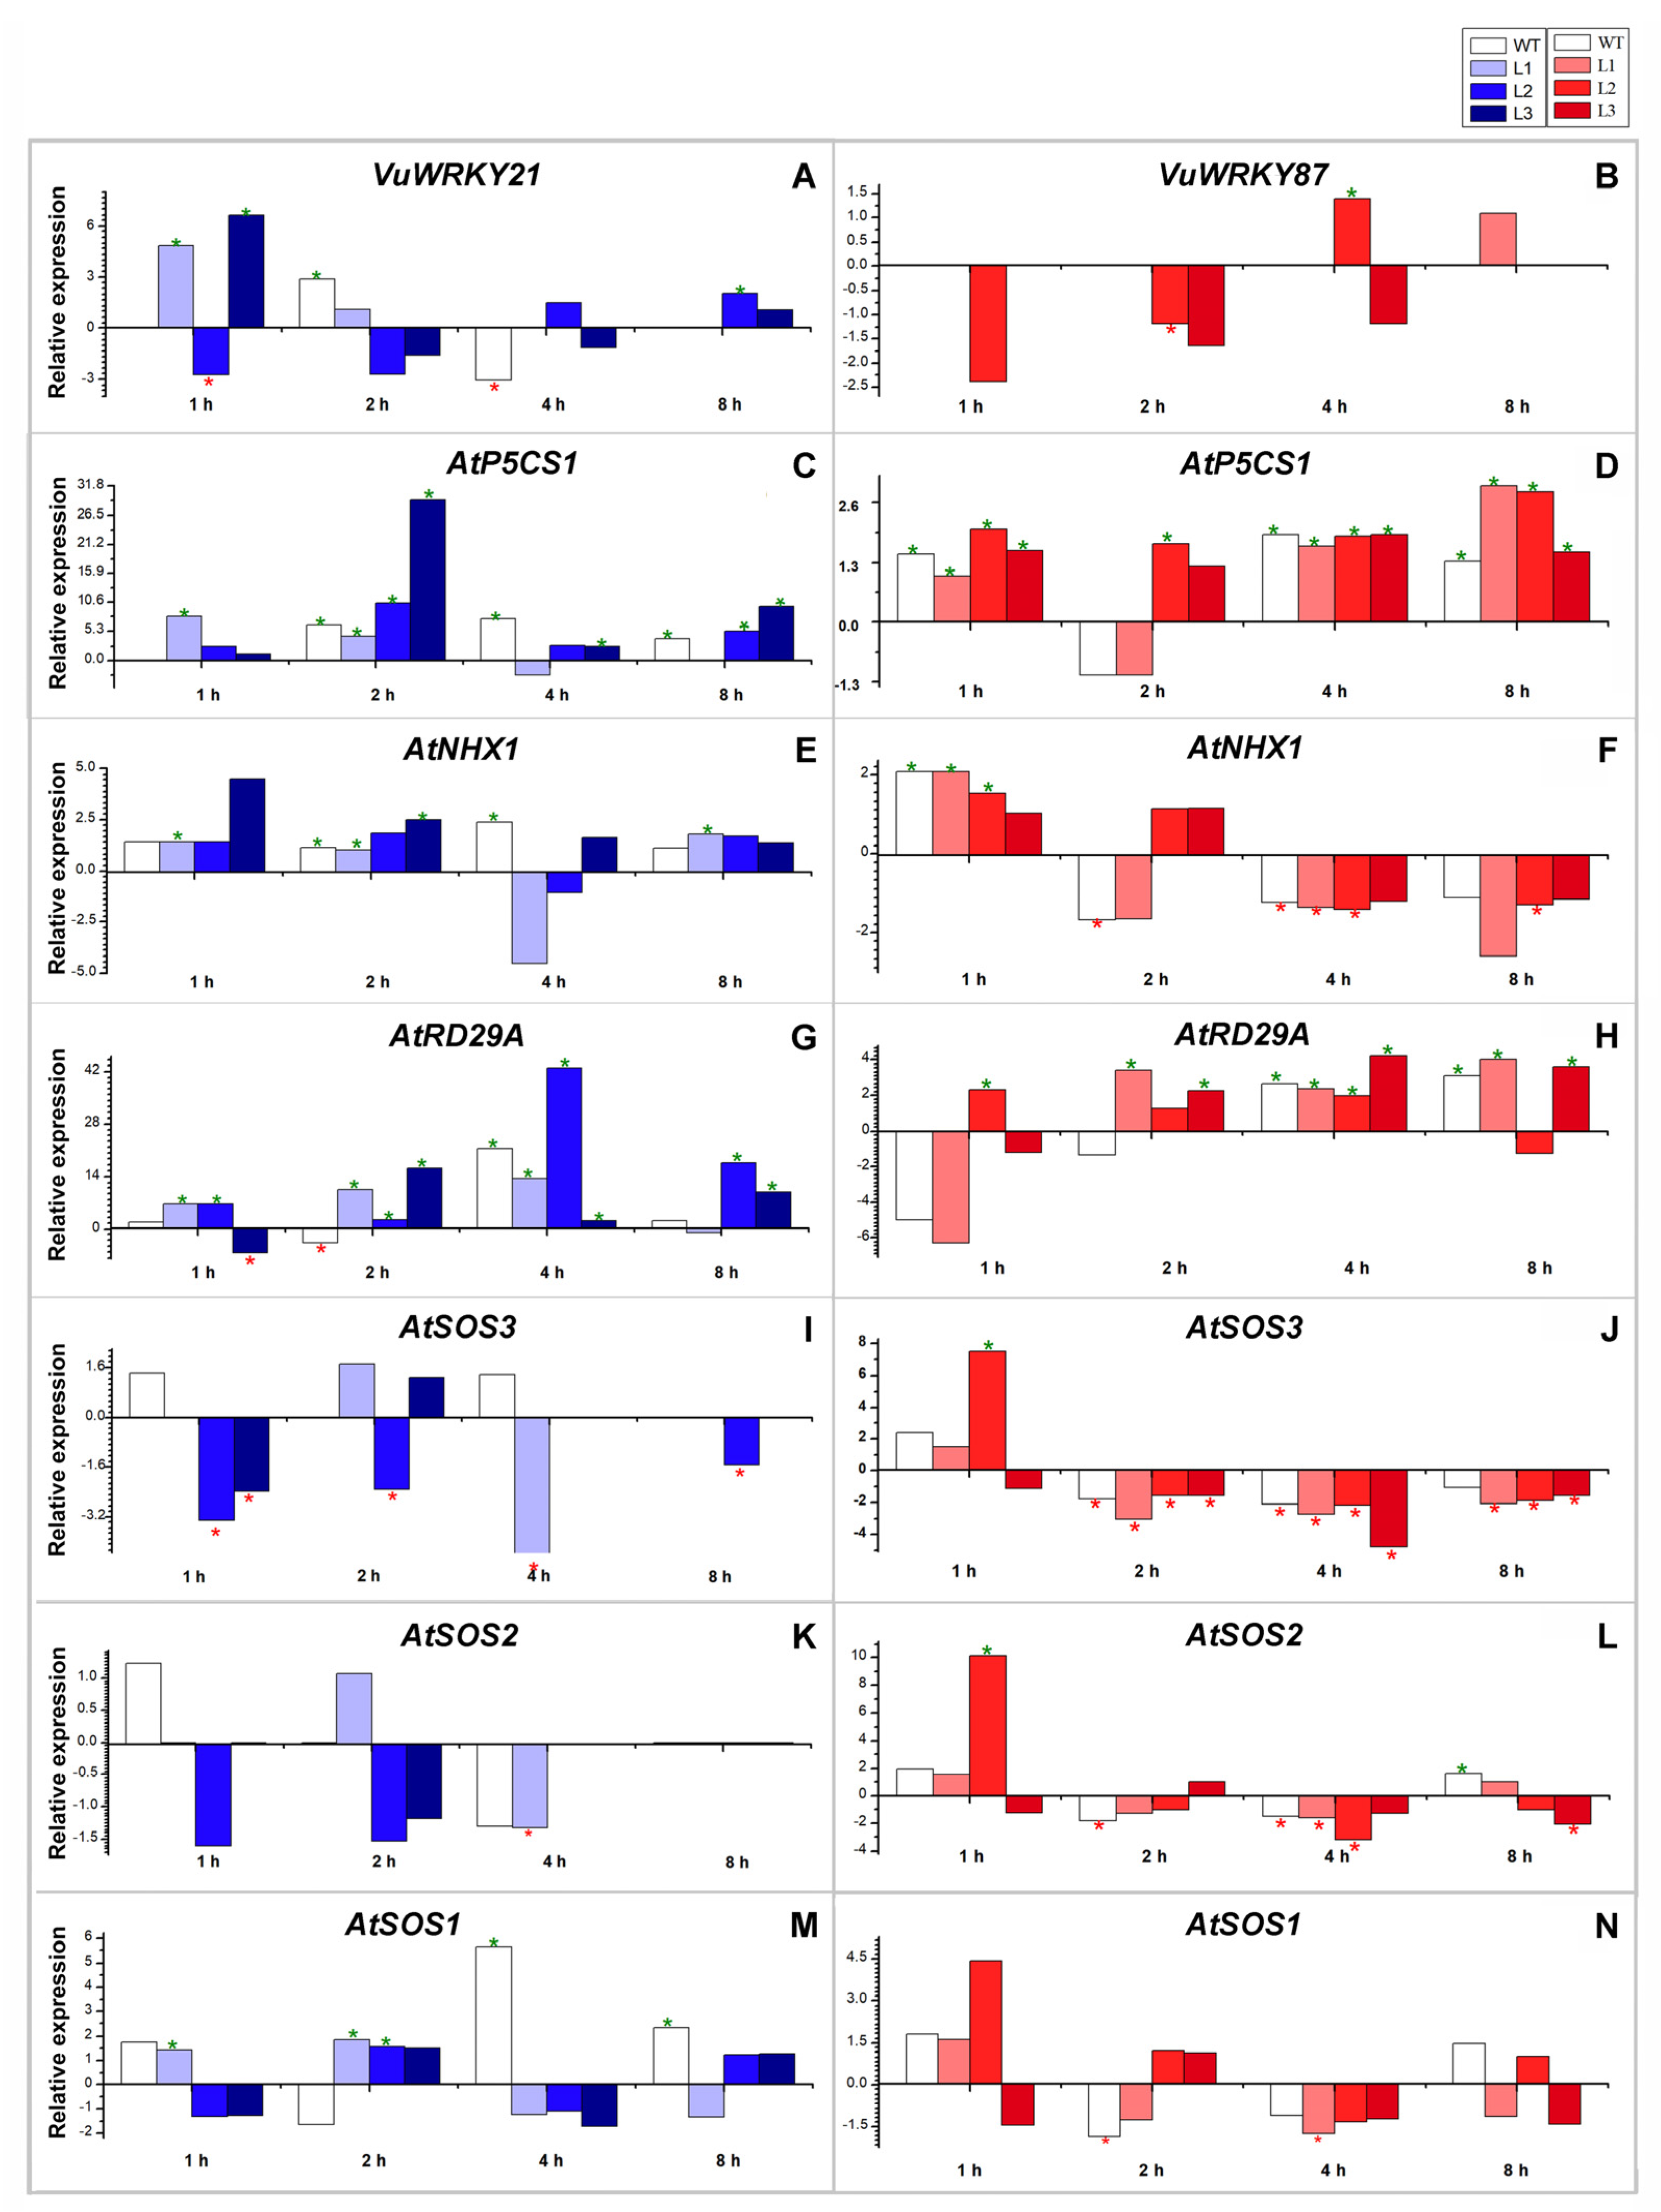
3.4. Effects of VuWRKY21 and VuWRKY87 Genes in Arabidopsis under Salt Stress

To explore the regulatory effect of VuWRKY21 and VuWRKY87 TFs, the expression of six pathway representative genes (i.e., AtP5CS1, AtRB29A, AtNXH1, AtSOS1, AtSOS2, and AtSOS3) known to be responsive to salt, water deficit, and osmotic stresses were selected and analyzed in VuWRKY21 and VuWRKY87 transgenic A. thaliana plants upon stress treatment.
The VuWRKY21 gene presented an early induction in the transgenic lines at 1 h PSI, being upregulated in L1 and L3, which obtained the highest relative expression values, 4.65 and 6.62, respectively. On the other hand, VuWRKY21 L2 was upregulated (2.05) only at 8 h PSI. The WT plants showed modulation at 1 and 8 h. Nevertheless, an upregulation (2.89) was observed at 2 h and a downregulation (−3.03) at 4 h PSI (Figure 4A). Since the WT plants do not carry the VuWRKY genes, this apparent modulation of VuWRKY21 in the non-transformed Arabidopsis plants must be associated with the fact that the primer used in the qPCR for VuWRKY21 annealed in a fragment of the coding sequence of At1G75810, involved in several steps of Arabidopsis development, especially in leaf growth (Table S2) [45]. The possible modulation of At1G75810 did not interfere with our analyses since the referred gene is not involved in the tolerance to salt stress. Conversely, VuWRKY87 was modulated only in L2, downregulated at 2 h PSI, and upregulated at 4 h PSI (Figure 4B). In the WT plants, no expression of the transgene VuWRKY87 was detected, corroborating that the primers used for qPCR did not anneal in any sequence of A. thaliana during in silico analysis (Table S2). The expression of VuWRKY21 and VuWRKY87 genes in A. thaliana under salinity conditions influenced the expression of all genes analyzed, with distinct behaviors between the lines and times analyzed, as described below.
AtP5CS1 showed an early response in all three VuWRKY21 lines. AtP5CS1 was upregulated at 1 h and 2 h PSI in L1, whereas L2 (10.49) and L3 (29.41) presented the highest expression levels at 2 h PSI, with 1.63 and 4.58 times higher than the WT plants (6.42), whose differential expression was also observed from 2 h PSI onward (Figure 4C). For VuWRKY87 transgenic plants, AtP5CS1 was upregulated in all lines and times, except for WT, L1, and L3, at 2 h PSI. Compared to WT plants, higher levels of expression were observed in the transgenic lines L2 and L3 at 1 h PSI; L2 at 2 h PSI; and L1, L2, and L3 at 8 h PSI (Figure 4D).
Similarly, the gene VuWRKY21 positively influenced the regulation of AtNXH1. L1 was upregulated at 1, 2, and 8 h PSI; L3 was upregulated at 2 h PSI, whereas L2 presented a trend for being upregulated at 2 and 8 h PSI (Figure 4E). For the VuWRKY87 lines, upregulation of AtNXH1 occurred only at 1 h PSI (WT, L1, and L2). At 2 h PSI, only the WT plants were downregulated, while at 4 h, the lines L1, L2, and WT were downregulated. At 8 h PSI, the expression levels followed the trend of the previous time, with L2 being significantly downregulated (Figure 4F).
The gene AtRD29A also presented an early modulation in the VuWRKY21 transgenic lines. At 1 h PSI, the VuWRKY21 L1 and L2 both showed a relative expression of AtRD29A that was about four times higher than that in the WT, while it was downregulated in VuWRKY21 L3. At 2 h PSI, it was upregulated in all three VuWRKY21 lines. At 4 h PSI, the highest level of AtRD29A was observed in WT, L1, and L2, whereas it declined drastically in L3 (Figure 4G). AtRD29A was also upregulated early in VuWRKY87 transgenic lines, considering L2 at 1 h and L1 and L3 at 2 h, and was non-significant in the WT at these initial times. At 4 h and 8 h, all lines presented upregulation of AtRD29A (Figure 4H), but L3 at 8 h was not statistically significant compared to the control group.
The VuWRKY21 transgenic lines display a similar behavior concerning the SOS (Salt-Overly Sensitive) pathway genes. The gene AtSOS3 was not statistically upregulated in the transgenic lines, with a tendency for positive regulation only for L1 and L2 at 2 h. On the other hand, this gene was downregulated in L2 at 1, 2, and 8 h, in L3 at 1 h, and in L1 at 4 h (Figure 4I). In turn, the gene AtSOS2 presented an upregulation tendency only in the WT plants (1 h) and in L1 (2 h). It was downregulated in L1 (4 h), L2 (1 and 2 h), L3 (2 h), and WT (4 h), while it was not modulated at 8 h after stress imposition (Figure 4K). Gene AtSOS1 had the highest induction in the transgenic lines at 2 h, while the WT plants were downregulated (−1.64). In contrast, the highest expression levels for AtSOS1 at 4 h and 8 h were observed in the WT plants, with 5.64 and 2.34, respectively. At 4 h, all transgenic lines presented a trend of downregulation (Figure 4M).
The regulation of the SOS pathway was also influenced by gene VuWRKY87. The gene AtSOS3 was upregulated only in L2 at 1 h PSI and was downregulated in all transgenic lines at 2, 4, and 8 h, as in the WT plants at 2 and 4 h. Similar to AtSOS3, the highest induction of AtSOS2 occurred at 1 h in L2 (Figure 4J). AtSOS2 was downregulated in L1 and L2 (4 h) and L3 (8 h). WT was downregulated in 2 and 4 h and upregulated in 8 h (Figure 4L). In general, the levels of AtSOS1 expression did not show statistical significance. Only WT (2 h) and L1 (4 h) were downregulated (Figure 4N).

4. Discussion

Abiotic stress, especially water deficit and salinity, usually affects seed germination, plant growth, and productivity, triggering a series of molecular, physiological, and biochemical alterations [10]. In our study, the expression of two cowpea WRKY TFs (VuWRKY21 or VuWRKY87), selected based on their expression in a drought-tolerant cowpea accession under root dehydration, were analyzed. VuWRKY21 was induced in cowpea with a fold change varying from 79.22 in T25 up to 185.74 in T100 in the tolerant accession, whereas VuWRKY87 presented its maximum modulation of 32.02 in T75 in the accession and treated conditions [27]. In the present work, biochemical parameters and modulation of genes related to salt stress tolerance were monitored in A. thaliana lines transformed with VuWRKY21 or VuWRKY87 genes, indicating an increase in the mechanisms associated with salt stress tolerance.
It is known that an increase in the root-to-shoot ratio contributes to salinity tolerance by optimizing water absorption [46]. In the present work, the presence of NaCl led to a reduction in both germination and seedling development. Nonetheless, at the highest salt concentration (200 mM), the lines carrying VuWRKY21 and VuWRKY87 genes presented a significantly higher germination index for the line L1 carrier of VuWRKY21 gene and for the three VuWRKY87 lines. Similar results were reported by Ullah et al. [10], in which Arabidopsis plants carrying the GhWRKY6-like gene also demonstrated enhanced germination rates and root elongation under a concentration of 200 mM NaCl.
High MDA content is directly proportional to a rise in membrane damage caused by the reactive oxygen species (ROS) with a consequent reduction in salinity tolerance [47,48]. Our study found that the WT line presented higher MDA content at all times of exposure to salt compared to the mean observed for the three VuWRKY21 lines. For the VuWRKY87 lines, there was also a decrease, although not significant. The smaller MDA content observed in the transgenic lines is correlated with the expression of the VuWRKY genes, particularly VuWRKY21. Similar results have been reported for other WRKY overexpressed in Arabidopsis, such as GhWRKY6 [10], TaWRKY46 [11], GmWKRY21, and GmWRKY54 [49], leading to abiotic stress tolerance and positive regulation of several defense pathways, such as those involved in the regulation of cellular homeostasis.
Hydrogen peroxide (H2O2) is a moderately reactive ROS, which has the capacity to diffuse freely through the membranes. It is considered an important intracellular marker for various pathways associated with tolerance mechanisms, such as stomatal closure and cross-bond formation in the cell wall, among others [50,51]. Nevertheless, when the H2O2 content exceeds the cell’s antioxidant capacity, its accumulation may cause oxidative stress and generate toxicity for the plants [52]. In the present work, similarly to MDA, the H2O2 content presented lower values at the initial times (1 and/or 2 h) after imposing salt stress in both lines carrying the VuWRKY genes, with emphasis on VuWRKY21 transgenic lines, which presented the H2O2 content (ca. 30% lower) at 2 h compared with the mean values 0 in the WT line. These results indicate a better performance of the transgenic lines under saline stress.
Plants use several strategies to detoxify the cell from ROS [53], including the synthesis of low molecular weight compounds and antioxidant enzymes [54], such as catalase, which is considered one of the most important enzymes for the intracellular regulation of peroxide levels under abiotic stresses [55]. At the initial times, the highest specific activity of catalase (CAT) was verified, being around 40% higher in the VuWRKY21 lines at 2 h and, on average, 140% higher at 1 h VuWRKY87 transformed lines. In other words, the specific CAT activity was inversely proportional to the value of the H2O2 content in the transgenic plants.
Alterations in superoxide dismutase (SOD) levels are among the first responses against ROS. The accumulation of Na+ and Cl in plants tends to modulate the activities of this and other antioxidant enzymes since they dismute O2. Thus, it is important that the specific SOD activity is synchronized with the CAT activity since the product of O2 dismutation by SOD is H2O2, and its accumulation is as detrimental as O2. These effects of oxidative stress are related to several degenerative processes, such as photoinhibition, photooxidation in chloroplasts, inactivation of enzymes, degradation of photosynthetic pigments, peroxidation of membrane lipids, and DNA damage [56,57,58,59]. This synchrony could be observed in our study, especially for the plants carrying VuWRKY21 at 2 h, when higher SOD (mean value, 557.43%) and CAT (39.55%) activities were observed, besides lower H2O2 content (29.51%), in the transgenic plants compared to the WT. Similarly, the highest SOD activity in the plants carrying the VuWRKY87 gene occurred at the initial times. One hour after stress imposition, there was an increase of 280% in SOD in the mean of the transgenic compared to WT lines.
The lowest availability of nutrients (such as carbohydrates necessary for plant growth) observed, especially in abiotic stress-sensitive plants, may generate a reduction in protein content because of a rise in proteolysis [60]. The increase in protein expression may indicate a possible redirection of the cellular metabolism for synthesizing compounds involved in diverse biological processes, such as the accumulation of reserves and/or defense [61]. Similar to the enzymatic response, the VuWRKY21 lines exhibited mean total protein contents 66% higher than the WT at 1 h and a mean increase of 45% in the VuWRKY87 transformed lines at 1 h after stress. These results reinforce the proposed role of VuWRKY21 and VuWRKY87 genes in salinity tolerance. When cultivated under saline stress, NaCl excess tends to increase proteolysis and decrease protein synthesis. Nevertheless, in the present study, this reduction in protein concentration was not observed for the transgenic plants, indicating that the expression of the VuWRKY21 and VuWRKY87 genes is related to the protection of the plant against the harmful effects of salinity [62].
The identification of stress-responsive genes and their expression analysis under controlled conditions are the first steps toward elucidating the mechanisms of tolerance to adverse environmental conditions, such as salinity [63], and the production of transgenic plants with better performance in adverse environments [64]. According to Matos et al. [27], diverse WRKY of cowpea are associated with orthologous genes identified in other angiosperms, such as soybean and rice, involved in signaling pathways related to the tolerance to abiotic stresses, demonstrating the importance of this gene family in tolerance to abiotic stresses [65]. Among them, VuWRKY18 and 21 are highlighted, which are orthologs of the gene AtWRKY40, involved in ABA signaling [66]. On the other hand, VuWRKY87, also differentially expressed under root dehydration in cowpea, presented no orthology with known genes from P. vulgaris, G. max, and A. thaliana [27]. Therefore, its possible role in pathways of tolerance to abiotic stress is studied for the first time in the present work.
AtP5CS1 is a critical gene in proline biosynthesis, encoding a Δ1-pyrroline-5-carboxylate (P5CS). Proline is produced from glutamic acid, using the enzymes P5CS and pyrroline-5-carboxylate reductase [67], and performs functions that are crucial for plant stress tolerance. It is prominent for acting in the conservation of the osmotic potential under water deficit [68] and promoting cell redox balance, elimination of ROS [52], and regulation of the cytosolic pH, thus acting as a protective agent for the function of enzymes [69,70]. The positive regulation of AtP5CS1 expression mediated by VuWRKY21 or VuWRKY87 corroborates studies in which the expression of the WRKY genes derived from diverse species have upregulated AtP5CS1 in A. thaliana under abiotic stress, as for VvWRKY30 from Vitis vinifera (L.) [71]; TaWRKY93 and TaWRKY46 from T. aestivum [11,17]; and CsWRKY26 from Camellia sinensis L. [68].
The gene AtRD29A is present in ABA-independent pathways and is responsive to osmotic stress [72]. Nevertheless, it encodes a hydrophilic protein with an unknown function [10]. In the present work, AtRD29A also presented an early induction in the transgenic lines of both genes, as compared to the WT. This pattern aligns with findings previously reported for A. thaliana transgenic plants expressing WRKY transgenes under saline stress. Examples of similar observations include CmWRKY17 from Chrysanthemum morifolium L. [73]; GhWRKY34 from G. hirsutum [74]; GhWRKY6 from G. hirsutum [10]; and VvWRKY30 from V. vinifera [71].
The NHX genes, especially NHX1 and NHX2, are positively regulated in diverse plant species under salinity stress, contributing to the tolerance to this condition [75]. AtNHX1 encodes a protein that controls the vacuolar osmotic potential in Arabidopsis, acting in the transport of Na+ to the vacuole from the cytosol and participating as a K+(Na+)/H+ “exchanger” in the cell tonoplast [76]. It has been reported that Arabidopsis plants overexpressing AtNHX1 have increased growth and development under salt stress due to, among other factors, better performance of membrane transporters in the xylem and phloem [77,78]. In G. max, salt tolerance was associated with the overexpression of NHX1 and NHX2 [79,80]. In the present work, a tendency for early upregulation was also observed for AtNXH1 in both transgenic lines (VuWRKY21 and VuWRKY87).
In Arabidopsis, ion homeostasis is maintained primarily via the mediation of the SOS (Salt-Overly Sensitive) pathway, characterizing it as an important regulatory system for plant survival under saline stress. Na+ excess and the high osmolarity are separately detected by unknown sensors at the plasma membrane level that induce an increase in cytosolic Ca2+ [81,82]. The rise in ions is detected by SOS3 (calcium-binding protein), which, after binding to Ca2+, activates SOS2 (serine/threonine protein kinase). Subsequently, the activated SOS3-SOS2 protein complex phosphorylates the SOS1, a co-transporter of Na+/H+ in the plasma membrane, producing the efflux of exceeding Na+ ions [83]. In the present work, the response of the three genes of the SOS pathway was heterogeneous for the transgenic lines under the overexpression of both VuWRKY genes. In general, the genes displayed early positive regulation at 1 h and/or 2 h and negative regulation at 4 h and/or 8 h (e.g., AtSOS3 for VuWRKY87 line at 2 h).
Although water deficit and salt stress may cause similar biochemical and physiological responses, such as osmotic stress, accumulation of ABA and several osmolytes, ionic toxicity, and oxidative stress, most of the efforts have focused on the analysis of the cellular homeostasis of the ion during saline stress, as the most direct way for the molecular mechanisms in plants [68]. After the perception of salt stress, a Ca2+ peak generated in the cytoplasm of root cells triggers the signal transduction cascade of the SOS pathway to protect the cells from damage caused by excessive ion accumulation. By gene expression analysis in Arabidopsis lines carrying the VuWRKY21 and VuWRKY87 genes, it was possible to verify the increase in the relative expression of the genes involved in the pathways for the early signaling and response to saline stress in the transgenic lines. These findings corroborate the results obtained by Ullah et al. [10] and Kang et al. [21], in which WRKY genes overexpressed in Arabidopsis positively regulated genes responsive to salinity.

5. Conclusions

Based on biochemical and molecular analyses, the present study revealed that the VuWRKY87 and VuWRKY21 genes contributed to activating genes related to tolerance response to salt stress. Notably, VuWRKY21 lines provided a better biochemical response, particularly in terms of reducing MDA and H2O2 contents. The present data suggest that both genes participate in the salt stress signaling pathway in cowpea, each acting with a slightly different effect consistent with our earlier findings [27]. The satisfactory performance of VuWRKY21 and VuWRKY87 in Arabidopsis suggests cowpea carries promising genes related to abiotic stress tolerance, establishing them as candidate genes worthy of further investigation.

Supplementary Materials

The following supporting information can be downloaded at https://www.mdpi.com/article/10.3390/dna3040014/s1: Figure S1: Melting curve of primers for all genes used in the VuWRKY21 and 87 expression analysis in Arabidopsis transgenic lines and WT, via qPCR; Figure S2: Average of root length of Arabidopsis transgenic lines carrying VuWRKY21 (A) and VuWRKY87 (B) genes (L1, L2, L3) and wild type (WT) plants under varying NaCl concentrations: 0 mM, 100 mM, and 200 mM. This test was performed with three biological replicates, each comprising 20 seeds. (C–J) Root length of A. thaliana seedlings carrying the VuWRKY21 (C–E) and VuWRKY87 (G–I) genes (L1, L2, L3) and the WT, germinated under different NaCl concentrations: 0 mM (C,G); 100 mM (D,H); and 200 mM (E,I), after seven days cultivation. Identical letters indicate no statistical difference among the observed time points (A and B). Blue bars (A) correspond to results for VuWRKY21 transgenic lines, and red bars (B) represent VuWRKY87 transgenic lines; Table S1: List of primers used in VuWRKY21 and 87 gene expression analysis in Arabidopsis transgenic lines and WT by qPCR.; Table S2: Blastn results in the genome of Arabidopsis thaliana using primer sequences of VuWRKY used in qPCR, performed after the salinity experiment with WT and transgenic lines of A. thaliana; Table S3. Expression values (FC and related data) of VuWRKY21 gene expression analysis in Arabidopsis transgenic lines and WT, by qPCR; Table S4. Expression values (FC and related data) of VuWRKY87 gene expression analysis in Arabidopsis transgenic lines and WT, by qPCR technique; Table S5, Subcellular location, molecular weight (kDA) and isoelectric point of proteins VuWRKY21 and VuWRKY87.

Author Contributions

Conceptualization, J.G.C., H.L., V.P., M.B.d.M., C.U., A.M.B.-I., M.P.T. and A.C.B.-V.; methodology, J.G.C., H.L., M.B.d.M. and L.S.; formal analysis, J.G.C., M.F.K.A. and J.R.C.F.-N.; investigation, J.G.C., E.d.S.S., M.F.K.A., H.L., M.B.d.M., L.S., R.C.R. and A.C.B.-V.; supervision, V.P., A.M.B.-I., M.P.T. and A.C.B.-V.; writing—original draft, J.G.C.; writing—review and editing, E.d.S.S., M.F.K.A., H.L., V.P., M.B.d.M., L.S., C.U., R.C.R., J.R.C.F.-N., A.M.B.-I., M.P.T. and A.C.B.-V.; funding acquisition, A.M.B.-I., M.P.T. and A.C.B.-V.; project administration, M.P.T. and A.C.B.-V. All authors have read and agreed to the published version of the manuscript.

Funding

This work was supported by Conselho Nacional de Desenvolvimento Científico Tecnológico (CNPq) (Grant Numbers: 141370/2018-1, 573884/2008-0, 442019/2019-0, 433931/2018-3, 310871/2014-0, 228476/2013-5, 313527/2017-2, and 313944/2020-2); Coordenação de Aperfeiçoamento de Pessoal de Nível Superior (CAPES) (Grant Number: 23038.010050/2013-04); Division of Integrative Organismal Systems of the National Science Foundation (NSF) (Grant Number: IOS1213059, 416 IOS-1238057); Fundação de Amparo à Ciência e Tecnologia do Estado de Pernambuco (FACEPE) (Grant Number: APQ-0556-5.01/15); and Kirkhouse Trust (SCIO) (Grant Number: GF14730).

Institutional Review Board Statement

Not applicable.

Informed Consent Statement

Not applicable.

Data Availability Statement

All relevant data can be found within the manuscript and its supporting materials.

Acknowledgments

The authors acknowledge Conselho Nacional de Desenvolvimento Científico Tecnológico (CNPq), Coordenação de Aperfeiçoamento de Pessoal de Nível Superior (CAPES), Fundação de Amparo à Ciência e Tecnologia do Estado de Pernambuco (FACEPE), the Department of Biology, University of Virginia, and the Department of Agronomy, Postgraduate Program in Plant Breeding, Universidade Federal Rural de Pernambuco.

Conflicts of Interest

The authors declare no conflict of interest.

References

  1. Abiala, M.A.; Abdelrahman, M.; Burritt, D.J.; Tran, L.P. Salt stress tolerance mechanisms and potential applications of legumes for sustainable reclamation of salt-degraded soils. Land Degrad. Dev. 2018, 29, 3812–3822. [Google Scholar] [CrossRef]
  2. Brozynska, M.; Furtado, A.; Henry, R.J. Genomics of crop wild relatives: Expanding the gene pool for crop improvement. Plant Biotechnol. J. 2016, 14, 1070–1085. [Google Scholar] [CrossRef]
  3. Ravelombola, W.; Shi, A.; Weng, Y.; Mou, B.; Motes, D.; Clark, J.; Chen, P.; Srivastava, V.; Qin, J.; Dong, L.; et al. Association analysis of salt tolerance in cowpea (Vigna unguiculata (L.) Walp) at germination and seedling stages. Theor. Appl. Genet. 2018, 131, 79–91. [Google Scholar] [CrossRef]
  4. Merwad, A.-R.M.A.; Desoky, E.-S.M.; Rady, M.M. Response of water deficit-stressed Vigna unguiculata performances to silicon, proline or methionine foliar application. Sci. Hortic. 2018, 228, 132–144. [Google Scholar] [CrossRef]
  5. Joshi, R.; Wani, S.H.; Singh, B.; Bohra, A.; Dar, Z.A.; Lone, A.A.; Pareek, A.; Singla-Pareek, S.L. Transcription factors and plants response to drought stress: Current understanding and future directions. Front. Plant Sci. 2016, 7, 1029. [Google Scholar] [CrossRef] [PubMed]
  6. Maruyama, K.; Urano, K.; Yoshiwara, K.; Morishita, Y.; Sakurai, N.; Suzuki, H.; Kojima, M.; Sakakibara, H.; Shibata, D.; Saito, K.; et al. Integrated analysis of the effects of cold and dehydration on rice metabolites, phytohormones, and gene transcripts. Plant Physiol. 2014, 164, 1759–1771. [Google Scholar] [CrossRef]
  7. Dong, J.; Chen, C.; Chen, Z. Expression profiles of the Arabidopsis WRKY gene superfamily during plant defense response. Plant Mol. Biol. 2003, 51, 21–37. [Google Scholar] [CrossRef]
  8. Dong, Q.; Zheng, W.; Duan, D.; Huang, D.; Wang, Q.; Liu, C.; Li, C.; Gong, X.; Li, C.; Mao, K.; et al. MdWRKY30, a group IIa WRKY gene from apple, confers tolerance to salinity and osmotic stresses in transgenic apple callus and Arabidopsis seedlings. Plant Sci. 2020, 299, 110611. [Google Scholar] [CrossRef]
  9. Msanne, J.; Lin, J.; Stone, J.M.; Awada, T. Characterization of abiotic stress-responsive Arabidopsis thaliana RD29A and RD29B genes and evaluation of transgenes. Planta 2011, 234, 97–107. [Google Scholar] [CrossRef] [PubMed]
  10. Ullah, A.; Sun, H.; Hakim; Yang, X.; Zhang, X. A novel cotton WRKY gene, GhWRKY6-like, improves salt tolerance by activating the ABA signaling pathway and scavenging of reactive oxygen species. Physiol. Plant. 2018, 162, 439–454. [Google Scholar] [CrossRef]
  11. Li, X.; Tang, Y.; Zhou, C.; Zhang, L.; Lv, J. A wheat WRKY transcription factor TaWRKY46 enhances tolerance to osmotic stress in transgenic Arabidopsis plants. Int. J. Mol. Sci. 2020, 21, 1321. [Google Scholar] [CrossRef] [PubMed]
  12. Amin, I.; Rasool, S.; Mir, M.A.; Wani, W.; Masoodi, K.Z.; Ahmad, P. Ion homeostasis for salinity tolerance in plants: A molecular approach. Physiol. Plant. 2021, 171, 578–594. [Google Scholar] [CrossRef] [PubMed]
  13. Dai, W.; Wang, M.; Gong, X.; Liu, J. The transcription factor FcWRKY 40 of Fortunella crassifolia functions positively in salt tolerance through modulation of ion homeostasis and proline biosynthesis by directly regulating SOS2 and P5CS1 homologs. New Phytol. 2018, 219, 972–989. [Google Scholar] [CrossRef] [PubMed]
  14. Brady, S.M.; Orlando, D.A.; Lee, J.-Y.; Wang, J.Y.; Koch, J.; Dinneny, J.R.; Mace, D.; Ohler, U.; Benfey, P.N. A high-resolution root spatiotemporal map reveals dominant expression patterns. Science 2007, 318, 801–806. [Google Scholar] [CrossRef]
  15. Tang, R.-J.; Yang, Y.; Yang, L.; Liu, H.; Wang, C.-T.; Yu, M.-M.; Gao, X.-S.; Zhang, H.-X. Poplar calcineurin B-like proteins PtCBL10A and PtCBL10B regulate shoot salt tolerance through interaction with PtSOS2 in the vacuolar membrane. Plant Cell Environ. 2014, 37, 573–588. [Google Scholar] [CrossRef]
  16. Lv, B.; Wu, Q.; Wang, A.; Li, Q.; Dong, Q.; Yang, J.; Zhao, H.; Wang, X.; Chen, H.; Li, C. A WRKY transcription factor, FtWRKY46, from Tartary buckwheat improves salt tolerance in transgenic Arabidopsis thaliana. Plant Physiol. Biochem. 2020, 147, 43–53. [Google Scholar] [CrossRef]
  17. Qin, Y.; Tian, Y.; Liu, X. A wheat salinity-induced WRKY transcription factor TaWRKY93 confers multiple abiotic stress tolerance in Arabidopsis thaliana. Biochem. Biophys. Res. Commun. 2015, 464, 428–433. [Google Scholar] [CrossRef]
  18. Zhu, L.; Li, S.; Ouyang, M.; Yang, L.; Sun, S.; Wang, Y.; Cai, X.; Wu, G.; Li, Y. Overexpression of watermelon ClWRKY20 in transgenic Arabidopsis improves salt and low-temperature tolerance. Sci. Hortic. 2022, 295, 110848. [Google Scholar] [CrossRef]
  19. Wu, M.; Zhang, K.; Xu, Y.; Wang, L.; Liu, H.; Qin, Z.; Xiang, Y. The moso bamboo WRKY transcription factor, PheWRKY86, regulates drought tolerance in transgenic plants. Plant Physiol. Biochem. 2022, 170, 180–191. [Google Scholar] [CrossRef]
  20. Zhu, H.; Jiang, Y.; Guo, Y.; Huang, J.; Zhou, M.; Tang, Y.; Sui, J.; Wang, J.; Qiao, L. A novel salt inducible WRKY transcription factor gene, AhWRKY75, confers salt tolerance in transgenic peanut. Plant Physiol. Biochem. 2021, 160, 175–183. [Google Scholar] [CrossRef]
  21. Kang, G.; Yan, D.; Chen, X.; Yang, L.; Zeng, R. HbWRKY82, a novel IIc WRKY transcription factor from Hevea brasiliensis associated with abiotic stress tolerance and leaf senescence in Arabidopsis. Physiol. Plant. 2021, 171, 151–160. [Google Scholar] [CrossRef]
  22. Baptista, A.; Pinho, O.; Pinto, E.; Casal, S.; Mota, C.; Ferreira, I.M.P.L.V.O. Characterization of protein and fat composition of seeds from common beans (Phaseolus vulgaris L.), cowpea (Vigna unguiculata L. Walp) and bambara groundnuts (Vigna subterranea L. Verdc) from Mozambique. J. Food Meas. Charact. 2017, 11, 442–450. [Google Scholar] [CrossRef]
  23. Amorim, M.R.; Mendes, L.W.; Antunes, J.E.L.; Oliveira, L.M.d.S.; Melo, V.M.M.; Oliveira, F.A.S.; Aquino, J.P.A.; Rocha, S.M.B.; Pereira, A.P.d.A.; da Costa, A.F.; et al. Cowpea nodules host a similar bacterial community regardless of soil properties. Appl. Soil Ecol. 2022, 172, 104354. [Google Scholar] [CrossRef]
  24. Masete, F.M.; Munjonji, L.; Ayisi, K.K.; Mopape-Mabapa, M.P. Cowpea growth and nitrogen fixation performance under different mulch treatments. Agriculture 2022, 12, 1144. [Google Scholar] [CrossRef]
  25. Opoku, V.A.; Yawson, D.O.; Asare, P.A.; Afutu, E.; Kotochi, M.C.; Amoah, K.K.; Adu, M.O. Root hair and rhizosheath traits contribute to genetic variation and phosphorus use efficiency in cowpea (Vigna unguiculata (L.) Walp). Rhizosphere 2022, 21, 100463. [Google Scholar] [CrossRef]
  26. Abdelrahman, M.; Jogaiah, S.; Burritt, D.J.; Tran, L.-S.P. Legume genetic resources and transcriptome dynamics under abiotic stress conditions. Plant Cell Environ. 2018, 41, 1972–1983. [Google Scholar] [CrossRef] [PubMed]
  27. Matos, M.K.d.S.; Benko-Iseppon, A.M.; Bezerra-Neto, J.P.; Ferreira-Neto, J.R.C.; Wang, Y.; Liu, H.; Pandolfi, V.; Amorim, L.L.B.; Willadino, L.; do Vale Amorim, T.C.; et al. The WRKY transcription factor family in cowpea: Genomic characterization and transcriptomic profiling under root dehydration. Gene 2022, 823, 146377. [Google Scholar] [CrossRef]
  28. Singh, D.; Debnath, P.; Sane, A.P.; Sane, V.A. Tomato (Solanum lycopersicum) WRKY23 enhances salt and osmotic stress tolerance by modulating the ethylene and auxin pathways in transgenic Arabidopsis. Plant Physiol. Biochem. 2023, 195, 330–340. [Google Scholar] [CrossRef]
  29. Nakagawa, T.; Suzuki, T.; Murata, S.; Nakamura, S.; Hino, T.; Maeo, K.; Tabata, R.; Kawai, T.; Tanaka, K.; Niwa, Y.; et al. Improved Gateway binary vectors: High-performance vectors for creation of fusion constructs in transgenic analysis of plants. Biosci. Biotechnol. Biochem. 2007, 71, 2095–2100. [Google Scholar] [CrossRef] [PubMed]
  30. Bechtold, N.; Bouchez, D. In planta Agrobacterium-mediated transformation of adult Arabidopsis thaliana plants by vacuum infiltration. In Gene Transfer to Plants; Springer: Berlin/Heidelberg, Germany, 1995; pp. 19–23. [Google Scholar] [CrossRef]
  31. Clough, S.J.; Bent, A.F. Floral dip: A simplified method for Agrobacterium-mediated transformation of Arabidopsis thaliana. Plant J. 1998, 16, 735–743. [Google Scholar] [CrossRef]
  32. Chou, K.-C.; Shen, H.-B. Cell-PLoc 2.0: An improved package of web-servers for predicting subcellular localization of proteins in various organisms. Nat. Sci. 2010, 2, 1090–1103. [Google Scholar] [CrossRef]
  33. Hiller, K.; Grote, A.; Maneck, M.; Münch, R.; Jahn, D. JVirGel 2.0: Computational prediction of proteomes separated via two-dimensional gel electrophoresis under consideration of membrane and secreted proteins. Bioinformatics 2006, 22, 2441–2443. [Google Scholar] [CrossRef] [PubMed]
  34. Murashige, T.; Skoog, F. A Revised Medium for Rapid Growth and Bio Assays with Tobacco Tissue Cultures. Physiol. Plant. 1962, 15, 473–497. [Google Scholar] [CrossRef]
  35. Alexieva, V.; Sergiev, I.; Mapelli, S.; Karanov, E. The effect of drought and ultraviolet radiation on growth and stress markers in pea and wheat. Plant Cell Environ. 2001, 24, 1337–1344. [Google Scholar] [CrossRef]
  36. Heath, R.L.; Packer, L. Photoperoxidation in isolated chloroplasts. Arch. Biochem. Biophys. 1968, 125, 189–198. [Google Scholar] [CrossRef]
  37. Bradford, M.M. A rapid and sensitive method for the quantitation of microgram quantities of protein utilizing the principle of protein-dye binding. Anal. Biochem. 1976, 72, 248–254. [Google Scholar] [CrossRef]
  38. Havir, E.A.; McHale, N.A. Biochemical and developmental characterization of multiple forms of catalase in tobacco leaves. Plant Physiol. 1987, 84, 450–455. [Google Scholar] [CrossRef]
  39. Giannopolitis, C.N.; Ries, S.K. Superoxide Dismutases: I. Occurrence in higher plants. Plant Physiol. 1977, 59, 309–314. [Google Scholar] [CrossRef]
  40. Zhao, L.; Ding, Q.; Zeng, J.; Wang, F.-R.; Zhang, J.; Fan, S.-J.; He, X.-Q. An improved CTAB-ammonium acetate method for total RNA isolation from cotton. Phytochem. Anal. 2012, 23, 647–650. [Google Scholar] [CrossRef]
  41. Raso, A.; Biassoni, R. Twenty Years of qPCR: A Mature Technology? Springer: Berlin/Heidelberg, Germany, 2014; pp. 1–3. [Google Scholar] [CrossRef]
  42. Bustin, S.A.; Benes, V.; Garson, J.A.; Hellemans, J.; Huggett, J.; Kubista, M.; Mueller, R.; Nolan, T.; Pfaffl, M.W.; Shipley, G.L.; et al. The MIQE guidelines: Minimum Information for Publication of Quantitative Real-Time PCR Experiments. Clin. Chem. 2009, 55, 611–622. [Google Scholar] [CrossRef]
  43. Cruz, C.D. Genes: A software package for analysis in experimental statistics and quantitative genetics. Acta Sci. Agron. 2013, 35, 271–276. [Google Scholar] [CrossRef]
  44. Pfaffl, M.W. Relative expression software tool (REST(C)) for group-wise comparison and statistical analysis of relative expression results in real-time PCR. Nucleic Acids Res. 2002, 30, e36. [Google Scholar] [CrossRef] [PubMed]
  45. Schmid, M.; Davison, T.S.; Henz, S.R.; Pape, U.J.; Demar, M.; Vingron, M.; Scholkopf, B.; Weigel, D.; Lohmann, J.U. A gene expression map of Arabidopsis thaliana development. Nat. Genet. 2005, 37, 501–506. [Google Scholar] [CrossRef] [PubMed]
  46. Munns, R.; Tester, M. Mechanisms of salinity tolerance. Annu. Rev. Plant Biol. 2008, 59, 651–681. [Google Scholar] [CrossRef] [PubMed]
  47. Bandeoğlu, E.; Eyidoğan, F.; Yücel, M.; Avni Öktem, H. Antioxidant responses of shoots and roots of lentil to NaCl-salinity stress. Plant Growth Regul. 2004, 42, 69–77. [Google Scholar] [CrossRef]
  48. Shafiq, S.; Akram, N.A.; Ashraf, M. Assessment of physio-biochemical indicators for drought tolerance in different cultivars of maize (Zea mays L.). Pak. J. Bot. 2019, 51, 1241–1247. [Google Scholar] [CrossRef]
  49. Zhou, Q.-Y.; Tian, A.-G.; Zou, H.-F.; Xie, Z.-M.; Lei, G.; Huang, J.; Wang, C.-M.; Wang, H.-W.; Zhang, J.-S.; Chen, S.-Y. Soybean WRKY-type transcription factor genes, GmWRKY13, GmWRKY21, and GmWRKY54, confer differential tolerance to abiotic stresses in transgenic Arabidopsis plants. Plant Biotechnol. J. 2008, 6, 486–503. [Google Scholar] [CrossRef]
  50. Anwar, K.; Joshi, R.; Dhankher, O.P.; Singla-Pareek, S.L.; Pareek, A. Elucidating the response of crop plants towards individual, combined and sequentially occurring abiotic stresses. Int. J. Mol. Sci. 2021, 22, 6119. [Google Scholar] [CrossRef]
  51. Silva, P.C.C.; Azevedo Neto, A.D.; Gheyi, H.R.; Ribas, R.F.; Silva, C.R.R.; Cova, A.M.W. Seed priming with H2O2 improves photosynthetic efficiency and biomass production in sunflower plants under salt stress. Arid. Land Res. Manag. 2022, 36, 283–297. [Google Scholar] [CrossRef]
  52. Mansoor, S.; Ali Wani, O.; Lone, J.K.; Manhas, S.; Kour, N.; Alam, P.; Ahmad, A.; Ahmad, P. Reactive oxygen species in plants: From source to sink. Antioxidants 2022, 11, 225. [Google Scholar] [CrossRef]
  53. Foyer, C.H.; Noctor, G. Redox regulation in photosynthetic organisms: Signaling, acclimation, and practical implications. Antioxid. Redox Signal. 2009, 11, 861–905. [Google Scholar] [CrossRef] [PubMed]
  54. Foyer, C.H.; Noctor, G. Redox homeostasis and antioxidant signaling: A metabolic interface between stress perception and physiological responses. Plant Cell 2005, 17, 1866–1875. [Google Scholar] [CrossRef]
  55. Cavalcante Granja, M.M.; Lacerda e Medeiros, M.J.; Medeiros de Araújo Silva, M.; Camara, T.; Willadino, L.; Ulisses, C. Response to in vitro salt stress in sugarcane is conditioned by concentration and condition of exposure to NaCl. Acta Biológica Colomb. 2018, 23, 30–38. [Google Scholar] [CrossRef]
  56. Ahanger, M.A.; Tomar, N.S.; Tittal, M.; Argal, S.; Agarwal, R.M. Plant growth under water/salt stress: ROS production; antioxidants and significance of added potassium under such conditions. Physiol. Mol. Biol. Plants 2017, 23, 731–744. [Google Scholar] [CrossRef] [PubMed]
  57. Willadino, L.; Camara, T.R.; Ribeiro, M.B.; Amaral, D.O.J.D.; Suassuna, F.; Silva, M.V.D. Mechanisms of tolerance to salinity in banana: Physiological, biochemical, and molecular aspects. Rev. Bras. Frutic. 2017, 39, e-723. [Google Scholar] [CrossRef]
  58. Zulfiqar, F.; Ashraf, M. Bioregulators: Unlocking their potential role in regulation of the plant oxidative defense system. Plant Mol. Biol. 2021, 105, 11–41. [Google Scholar] [CrossRef]
  59. Singh, R.; Misra, A.N.; Sharma, P. Genome–wide transcriptional response of contrasting genotypes of industrial crop castor to As(V) stress: Identification of genes and mechanisms associated with As(V) tolerance. Ind. Crops Prod. 2022, 179, 114678. [Google Scholar] [CrossRef]
  60. Akbari, B.; Baghaei-Yazdi, N.; Bahmaie, M.; Mahdavi Abhari, F. The role of plant-derived natural antioxidants in reduction of oxidative stress. BioFactors 2022, 48, 611–633. [Google Scholar] [CrossRef]
  61. Di Carli, M.; Benvenuto, E.; Donini, M. Recent insights into plant–virus interactions through proteomic analysis. J. Proteome Res. 2012, 11, 4765–4780. [Google Scholar] [CrossRef]
  62. Das, P.; Majumder, A.L. Transcriptome analysis of grapevine under salinity and identification of key genes responsible for salt tolerance. Funct. Integr. Genom. 2019, 19, 61–73. [Google Scholar] [CrossRef]
  63. Joshi, R.; Sahoo, K.K.; Tripathi, A.K.; Kumar, R.; Gupta, B.K.; Pareek, A.; Singla-Pareek, S.L. Knockdown of an inflorescence meristem-specific cytokinin oxidase–OsCKX2 in rice reduces yield penalty under salinity stress condition. Plant Cell Environ. 2018, 41, 936–946. [Google Scholar] [CrossRef] [PubMed]
  64. Wani, S.H.; Anand, S.; Singh, B.; Bohra, A.; Joshi, R. WRKY transcription factors and plant defense responses: Latest discoveries and future prospects. Plant Cell Rep. 2021, 40, 1071–1085. [Google Scholar] [CrossRef] [PubMed]
  65. Yang, X.; Li, H.; Yang, Y.; Wang, Y.; Mo, Y.; Zhang, R.; Zhang, Y.; Ma, J.; Wei, C.; Zhang, X. Identification and expression analyses of WRKY genes reveal their involvement in growth and abiotic stress response in watermelon (Citrullus lanatus). PLoS ONE 2018, 13, e0191308. [Google Scholar] [CrossRef] [PubMed]
  66. Shang, Y.; Yan, L.; Liu, Z.-Q.; Cao, Z.; Mei, C.; Xin, Q.; Wu, F.-Q.; Wang, X.-F.; Du, S.-Y.; Jiang, T.; et al. The Mg-Chelatase H subunit of Arabidopsis antagonizes a group of WRKY transcription repressors to relieve ABA-responsive genes of inhibition. Plant Cell 2010, 22, 1909–1935. [Google Scholar] [CrossRef]
  67. Turchetto-Zolet, A.C.; Margis-Pinheiro, M.; Margis, R. The evolution of pyrroline-5-carboxylate synthase in plants: A key enzyme in proline synthesis. Mol. Genet. Genom. 2009, 281, 87–97. [Google Scholar] [CrossRef]
  68. Chen, W.; Zheng, C.; Yao, M.; Chen, L. The tea plant CsWRKY26 promotes drought tolerance in transgenic Arabidopsis plants. Beverage Plant Res. 2021, 1, 3. [Google Scholar] [CrossRef]
  69. Garg, G.; Neha, P. Plant transcription factors networking of pyrroline-5-carboxylate (p5c) enzyme under stress condition: A review. Plant Arch. 2019, 19, 562–569. [Google Scholar]
  70. Furlan, A.L.; Bianucci, E.; Giordano, W.; Castro, S.; Becker, D.F. Proline metabolic dynamics and implications in drought tolerance of peanut plants. Plant Physiol. Biochem. 2020, 151, 566–578. [Google Scholar] [CrossRef]
  71. Zhu, D.; Hou, L.; Xiao, P.; Guo, Y.; Deyholos, M.K.; Liu, X. VvWRKY30, a grape WRKY transcription factor, plays a positive regulatory role under salinity stress. Plant Sci. 2019, 280, 132–142. [Google Scholar] [CrossRef]
  72. Thiery, L.; Leprince, A.-S.; Lefebvre, D.; Ghars, M.A.; Debarbieux, E.; Savouré, A. Phospholipase D is a negative regulator of proline biosynthesis in Arabidopsis thaliana. J. Biol. Chem. 2004, 279, 14812–14818. [Google Scholar] [CrossRef]
  73. Li, P.; Song, A.; Gao, C.; Wang, L.; Wang, Y.; Sun, J.; Jiang, J.; Chen, F.; Chen, S. Chrysanthemum WRKY gene CmWRKY17 negatively regulates salt stress tolerance in transgenic Chrysanthemum and Arabidopsis plants. Plant Cell Rep. 2015, 34, 1365–1378. [Google Scholar] [CrossRef] [PubMed]
  74. Zhou, L.; Wang, N.-N.; Gong, S.-Y.; Lu, R.; Li, Y.; Li, X.-B. Overexpression of a cotton (Gossypium hirsutum) WRKY gene, GhWRKY34, in Arabidopsis enhances salt-tolerance of the transgenic plants. Plant Physiol. Biochem. 2015, 96, 311–320. [Google Scholar] [CrossRef] [PubMed]
  75. Julkowska, M.M.; Testerink, C. Tuning plant signaling and growth to survive salt. Trends Plant Sci. 2015, 20, 586–594. [Google Scholar] [CrossRef] [PubMed]
  76. Ismail, A.M.; Horie, T. Genomics, physiology, and molecular breeding approaches for improving salt tolerance. Annu. Rev. Plant Biol. 2017, 68, 405–434. [Google Scholar] [CrossRef] [PubMed]
  77. Hussain, S.; Ali, B.; Ren, X.; Chen, X.; Li, Q.; Saqib, M.; Ahmad, N. Recent progress in understanding salinity tolerance in plants: Story of Na+/K+ balance and beyond. Plant Physiol. Biochem. 2021, 160, 239–256. [Google Scholar] [CrossRef] [PubMed]
  78. Pabuayon, I.C.M.; Jiang, J.; Qian, H.; Chung, J.-S.; Shi, H. Gain-of-function mutations of AtNHX1 suppress sos1 salt sensitivity and improve salt tolerance in Arabidopsis. Stress Biol. 2021, 1, 14. [Google Scholar] [CrossRef]
  79. Köster, P.; Wallrad, L.; Edel, K.H.; Faisal, M.; Alatar, A.A.; Kudla, J. The battle of two ions: Ca2+ signalling against Na+ stress. Plant Biol. 2019, 21, 39–48. [Google Scholar] [CrossRef]
  80. Yousefirad, S.; Soltanloo, H.; Ramezanpour, S.S.; Zaynali Nezhad, K.; Shariati, V. The RNA-seq transcriptomic analysis reveals genes mediating salt tolerance through rapid triggering of ion transporters in a mutant barley. PLoS ONE 2020, 15, e0229513. [Google Scholar] [CrossRef]
  81. Procino, G.; Gerbino, A.; Milano, S.; Nicoletti, M.C.; Mastrofrancesco, L.; Carmosino, M.; Svelto, M. Rosiglitazone promotes AQP2 plasma membrane expression in renal cells via a Ca2+-dependent/cAMP-independent mechanism. Cell Physiol. Biochem. 2015, 35, 1070–1085. [Google Scholar] [CrossRef]
  82. Zhu, J.-K. Salt and drought stress signal transduction in plants. Annu. Rev. Plant Biol. 2002, 53, 247–273. [Google Scholar] [CrossRef]
  83. Goyal, V.; Jhanghel, D.; Mehrotra, S. Emerging warriors against salinity in plants: Nitric oxide and hydrogen sulphide. Physiol. Plant 2021, 171, 896–908. [Google Scholar] [CrossRef] [PubMed]
Figure 1. Germination index of Arabidopsis transgenic lines carrying VuWRKY21 (A) and VuWRKY87 (B) genes (L1, L2, and L3) and wild-type (WT) plants under varying NaCl concentrations: 0 mM, 100 mM, and 200 mM. This test was performed with three biological replicates, each comprising 40 seeds. (CJ) Development of A. thaliana seedlings carrying the VuWRKY21 (CE) and VuWRKY87 (GI) genes (L1, L2, and L3) and WT, germinated under different NaCl concentrations: 0 mM (C,G); 100 mM (D,H); and 200 mM (E,I), after 15 days of cultivation. Identical letters indicate no statistical difference among the observed time points. Blue bars (A) correspond to results for VuWRKY21 transgenic lines and red bars (B) represent VuWRKY87 transgenic lines.
Dna 03 00014 g001
Figure 2. Effect of salt stress on the content of MDA (A,B), H2O2 (C,D), SOD (E,F), CAT (G,H), and total proteins (I,J), in Arabidopsis thaliana lines carrying VuWRKY21 or VuWRKY87 genes (L1, L2, L3) and wild type (WT), under saline conditions at the times of 1, 2, 4, and 8 h. Equal lowercase letters show no statistical difference between lines for the same time, according to the Tukey test (p < 0.05). Biological triplicates were established for biochemical analyses; each biological replicate comprised 20 plants. In contrast, the same capital letters show no statistical difference between the observed times for the same line. Blue and red bars indicate results of VuWRKY21 and VuWRKY87 transgenic lines, respectively.
Dna 03 00014 g002
Figure 3. Summary of the biochemical response to the mean of transgenic and WT Arabidopsis thaliana plants evaluated under the salt stress imposition at different times. The direction of the arrow indicates the trend of the result for each variable. The up arrow indicates an increase, and the down arrow indicates a reduction. Blue refers to VuWRKY21 transgenic lines, and red to VuWRKY87 transgenic lines.
Dna 03 00014 g003
Figure 4. Differential expression of VuWRKY21 and VuWRKY87 genes and six other target genes in Arabidopsis thaliana lines carrying VuWRKY21 (A,C,E,G,I,K,M) or VuWRKY87 (B,D,F,H,L,N) genes (L1, L2, L3) and wild type (WT) after 1, 2, 4, and 8 h of salt stress (200 mM NaCl): VuWRKY21 (A); VuWRKY87 (B); AtP5CS1 (C,D); AtNHX1 (E,F); AtRD29A (G,H); AtSOS3 (I,J); AtSOS2 (K,L); AtSOS1 (M,N). Biological triplicates were established for the gene expression analyses by qPCR, in which one replicate corresponded to one plant. The quantification cycles (Cqs) were compared between the treated and control of their respective time conditions (control condition: plant cultivated under the same conditions and watered only with the solution, without the addition of NaCl) and were normalized using the Cq values of the reference gene AtUbiquitin. Blue bars identify results of VuWRKY21 gene expression, and red bars of VuWRKY87. * Upregulated, compared to the control group. * Downregulated, compared to the control group.
Dna 03 00014 g004
Disclaimer/Publisher’s Note: The statements, opinions and data contained in all publications are solely those of the individual author(s) and contributor(s) and not of MDPI and/or the editor(s). MDPI and/or the editor(s) disclaim responsibility for any injury to people or property resulting from any ideas, methods, instructions or products referred to in the content.

