

A Hierarchical Security Event Correlation Model for Real-Time Threat Detection and Response

Abstract
:1. Introduction
1.1. Research Background
1.2. Related Works
1.2.1. Hierarchical Correlation
1.2.2. Real-Time Correlation
1.2.3. Correlation Processes
1.2.4. Correlation and Clustering Algorithms
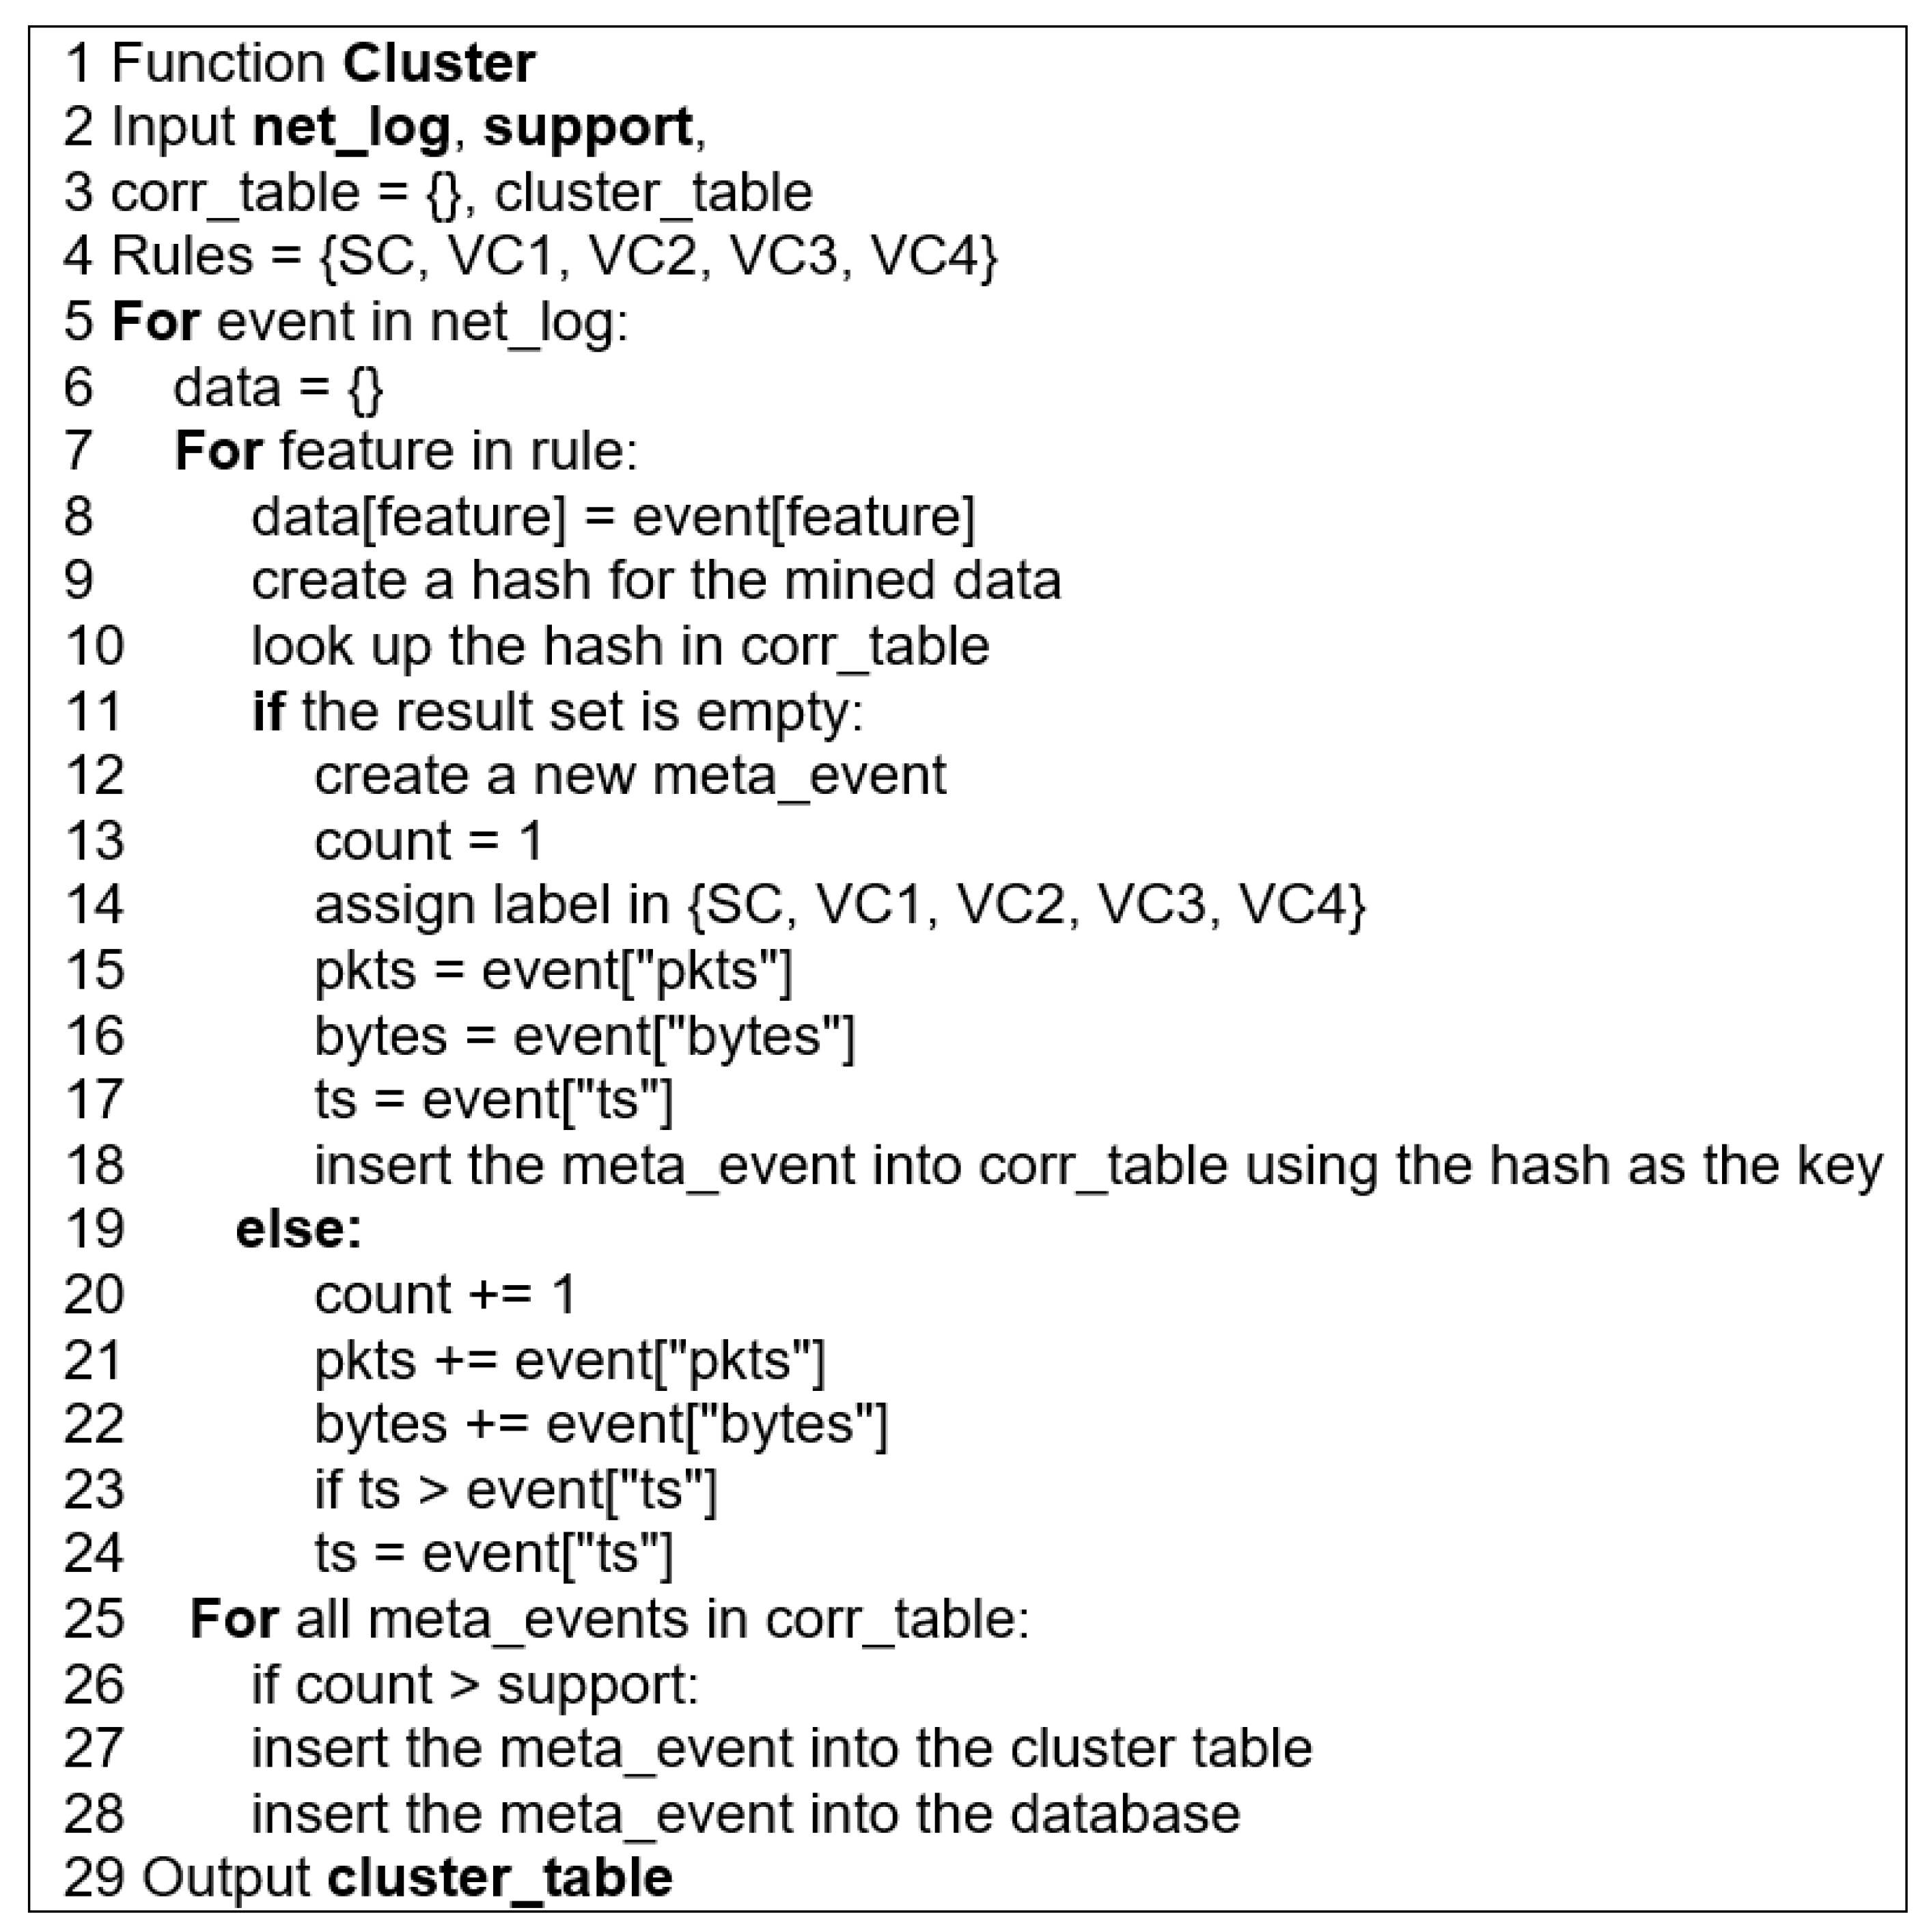
- The data space dimensionality is small and fixed. More precisely, the event log entry as defined is a five-tuple record.
- Each event can belong to candidate clusters that can be defined by the set of predefined mining rules.
- The data of the mined features are categorical.
1.2.5. Graph Correlation
1.3. Drawbacks and Limitations
1.4. Research Contribution
- Reduce the actual volume of alerts generated by an IDS, by correlating the raw events themselves, rather than correlate alerts that have already been raised. This is significant because it places the task of reducing the volume of alerts within the IDS itself. Further, the IDS will raise higher-quality alerts since it will be analyzing correlated information. Further, the IDS can detect more sophisticated attacks as it does not process and analyze data packet by packet as is the case with the state of the art [32].
- Reduce the time taken to respond to threats, because of the reduced number of alerts that need to be analyzed.
- Enhance the capability of intrusion detection systems by improving their correlation unit using a hierarchy of correlation techniques that takes advantage of their cumulative strengths.
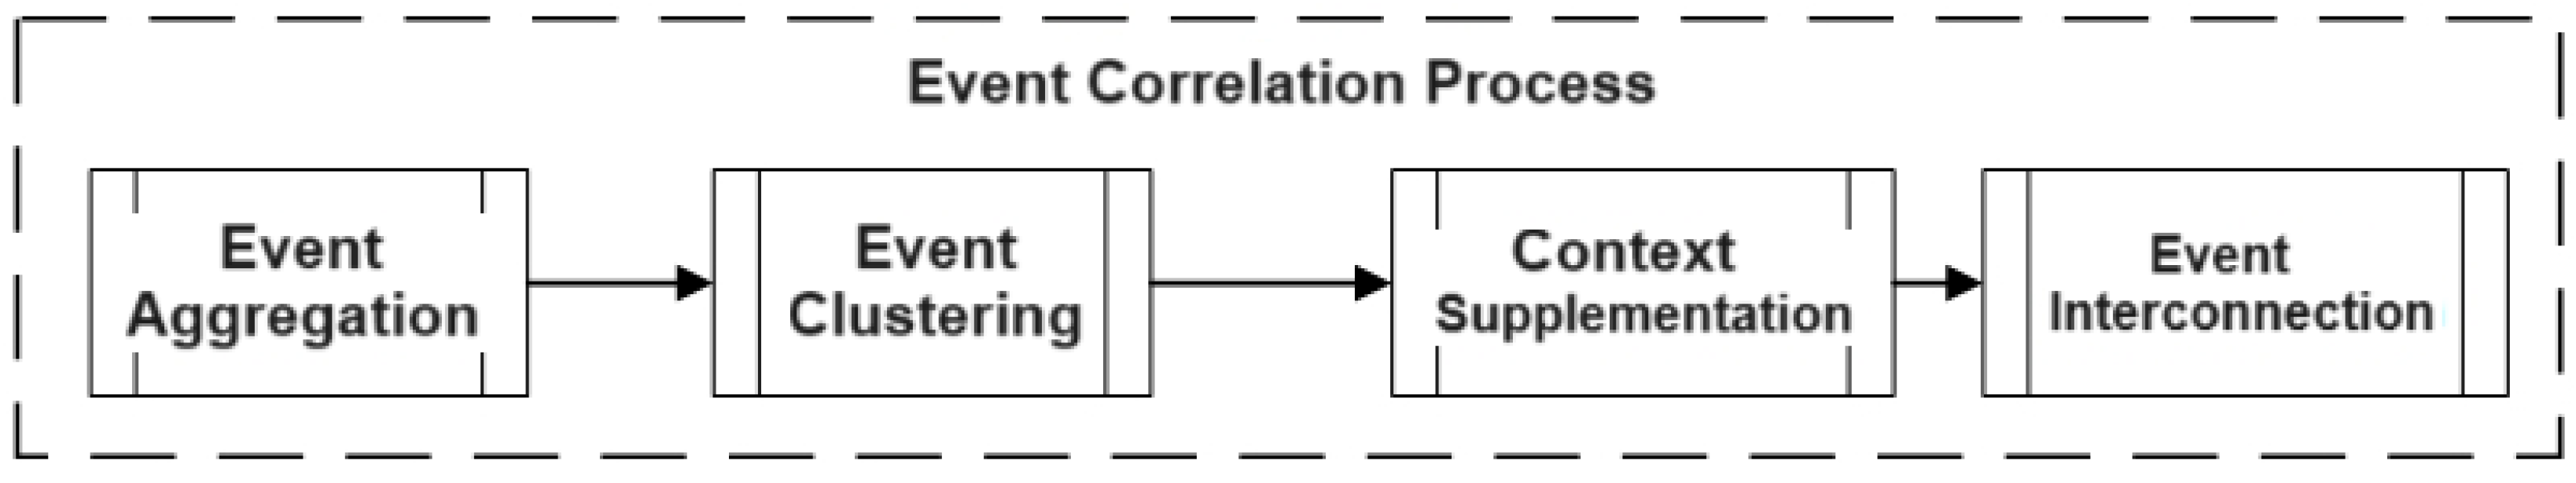
- An event correlation process: All correlation processes reviewed relate to intrusion alerts. Some of the process steps are not relevant to the correlation of raw events. The process model proposed in this research assembles only those process steps that relate to event correlation.
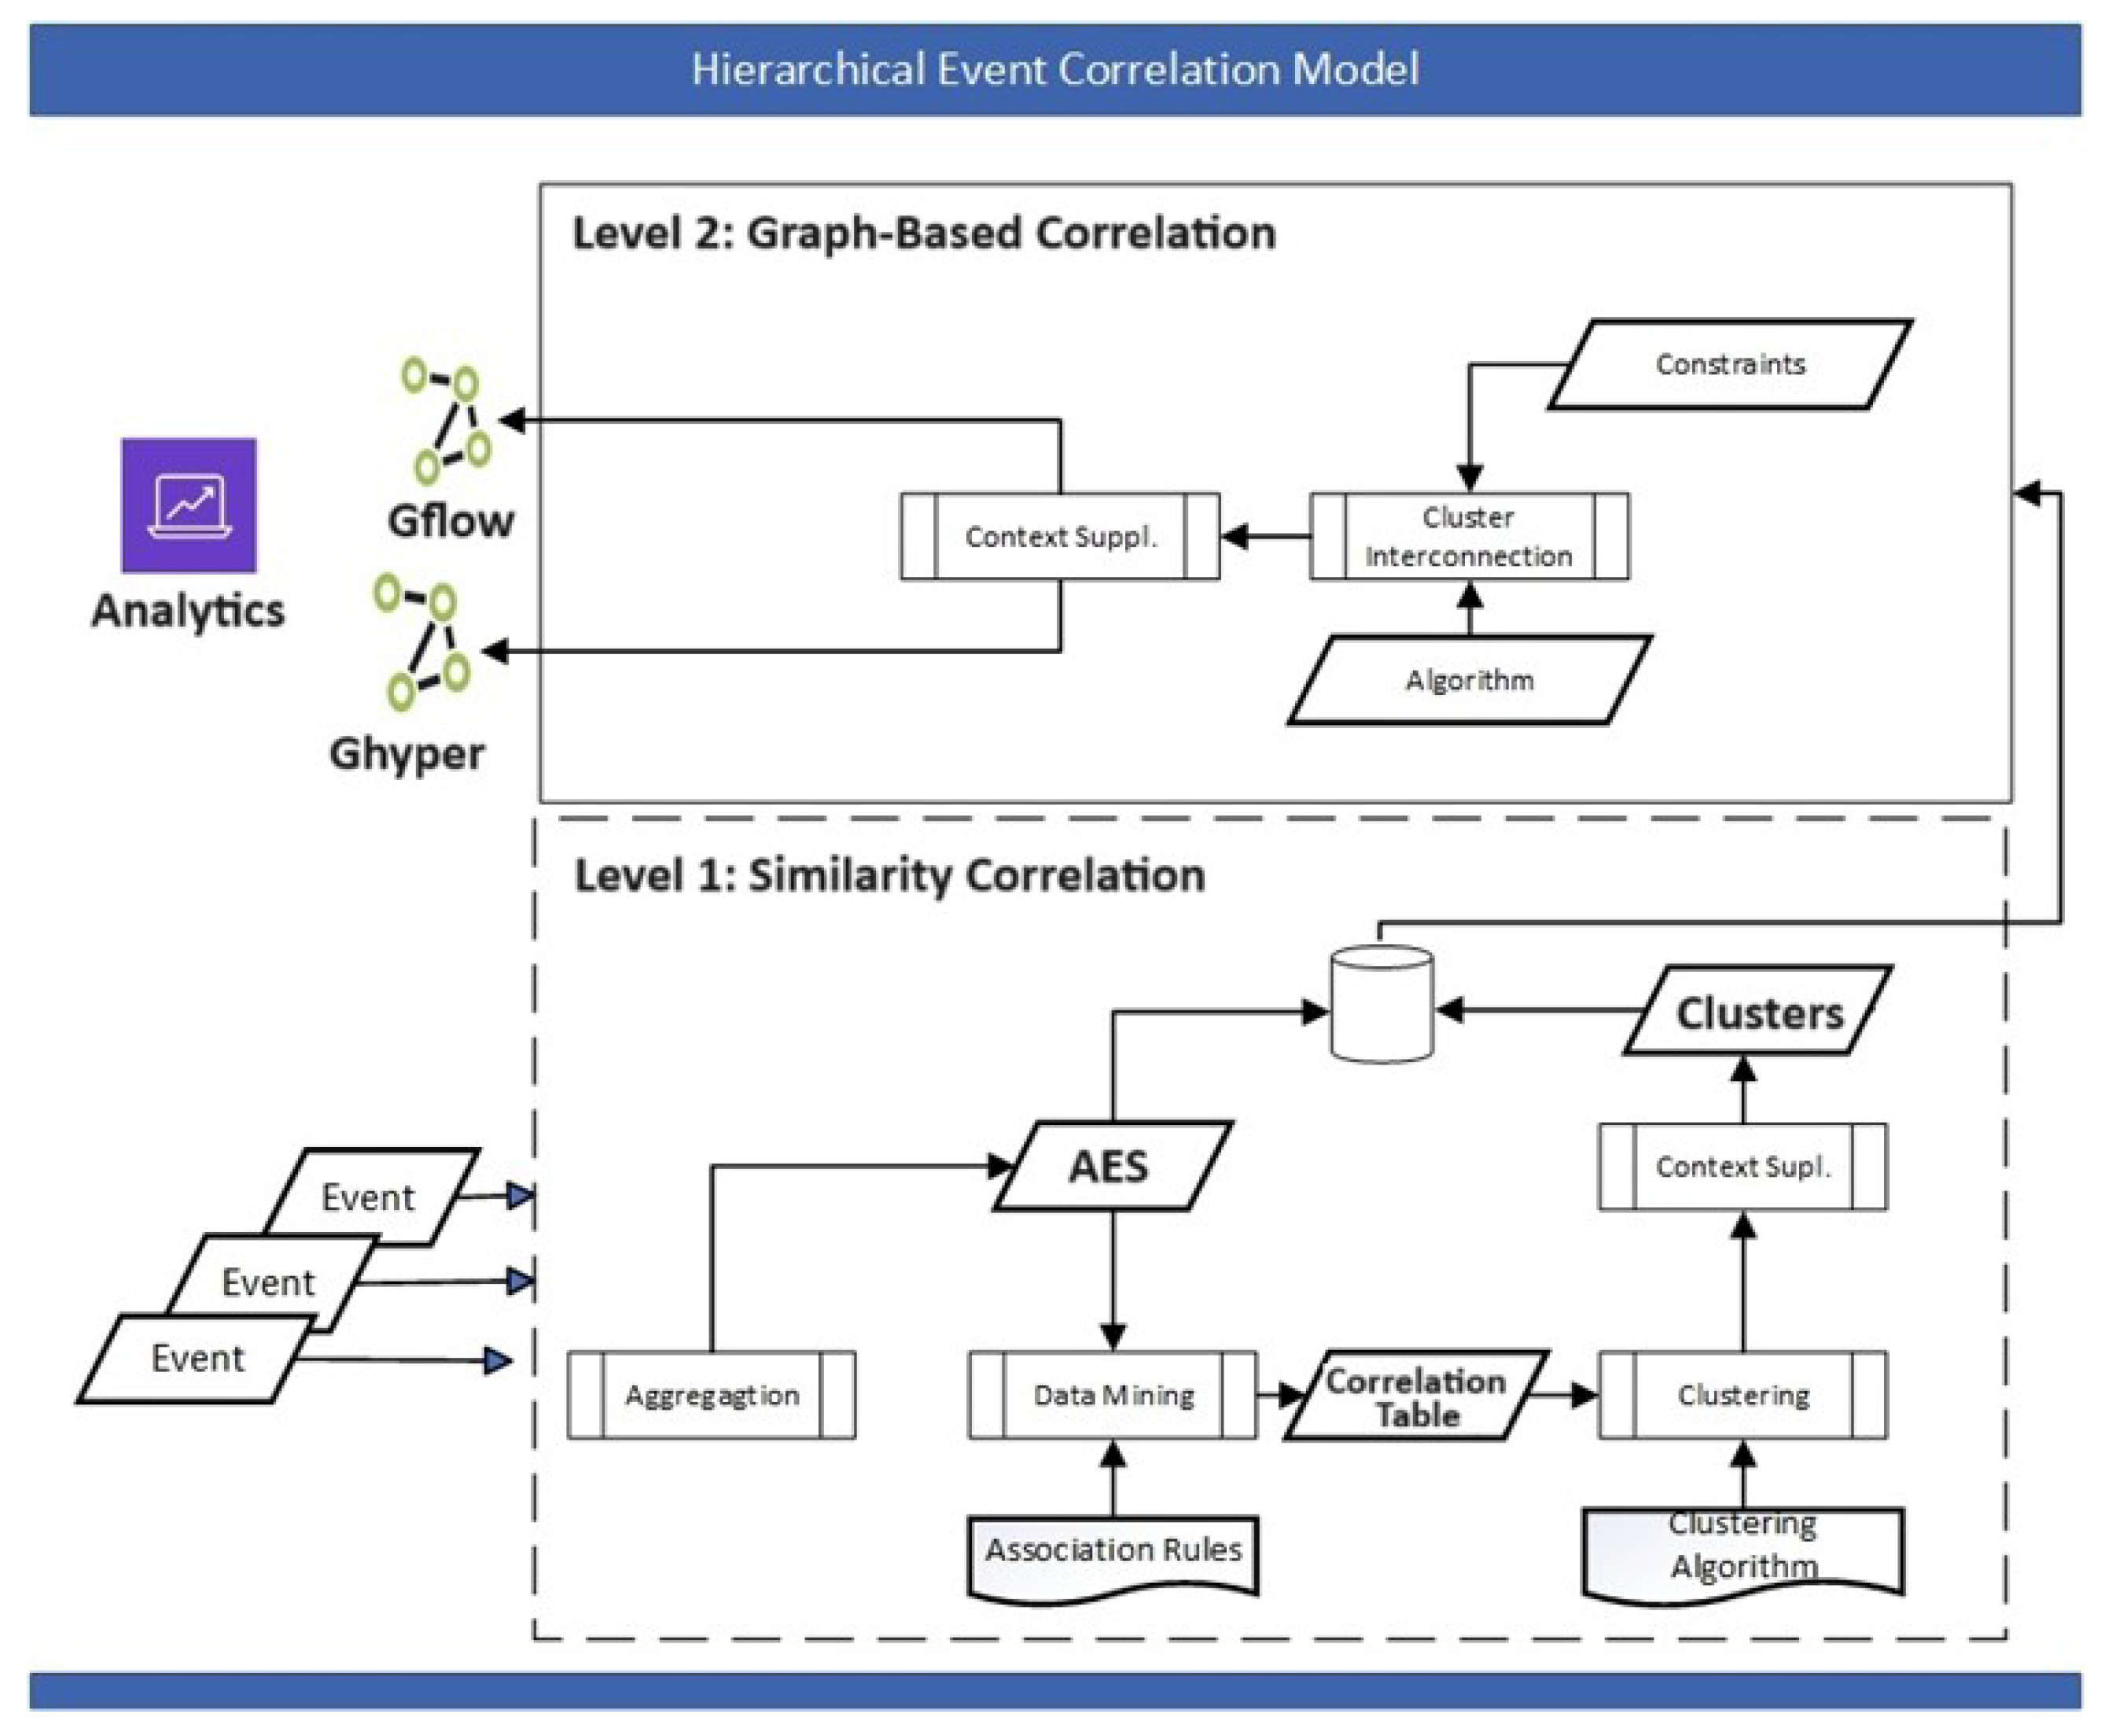
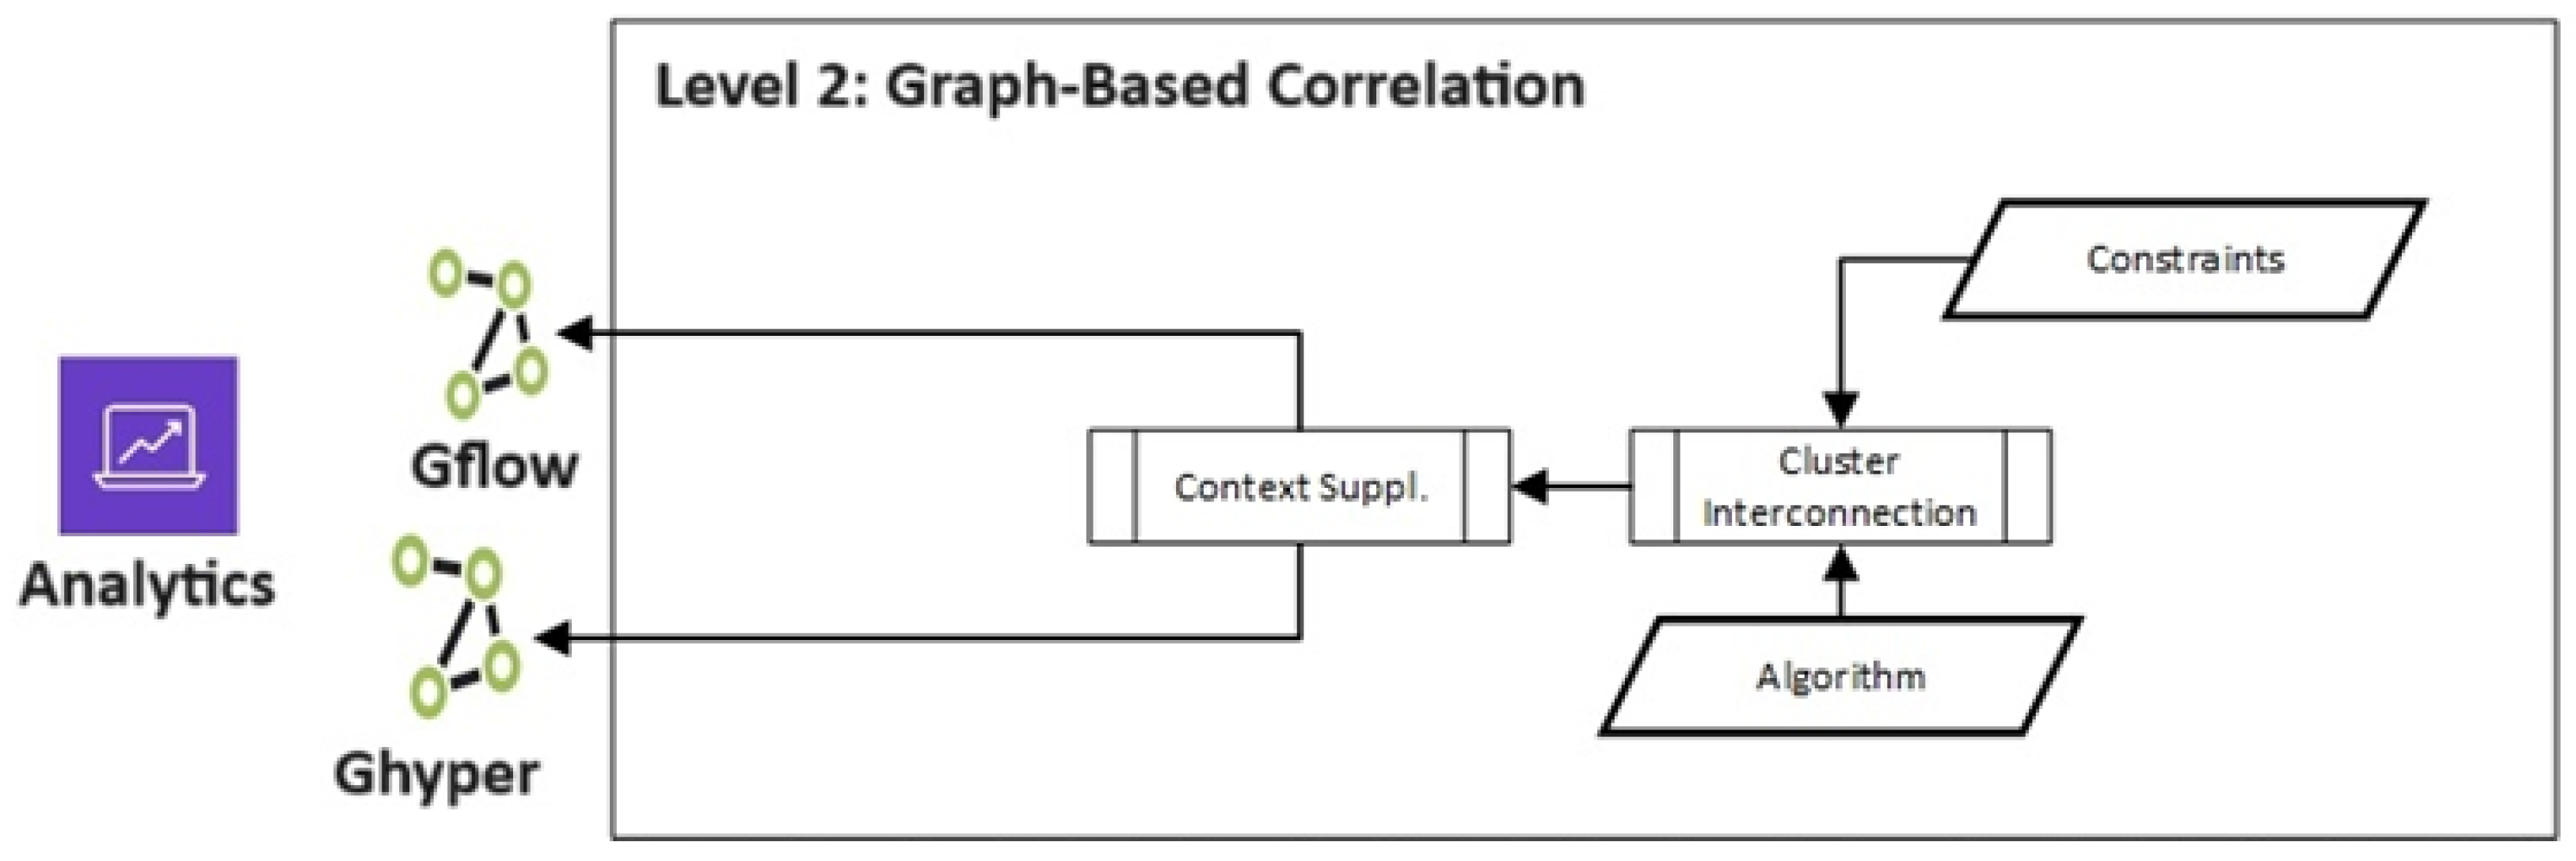
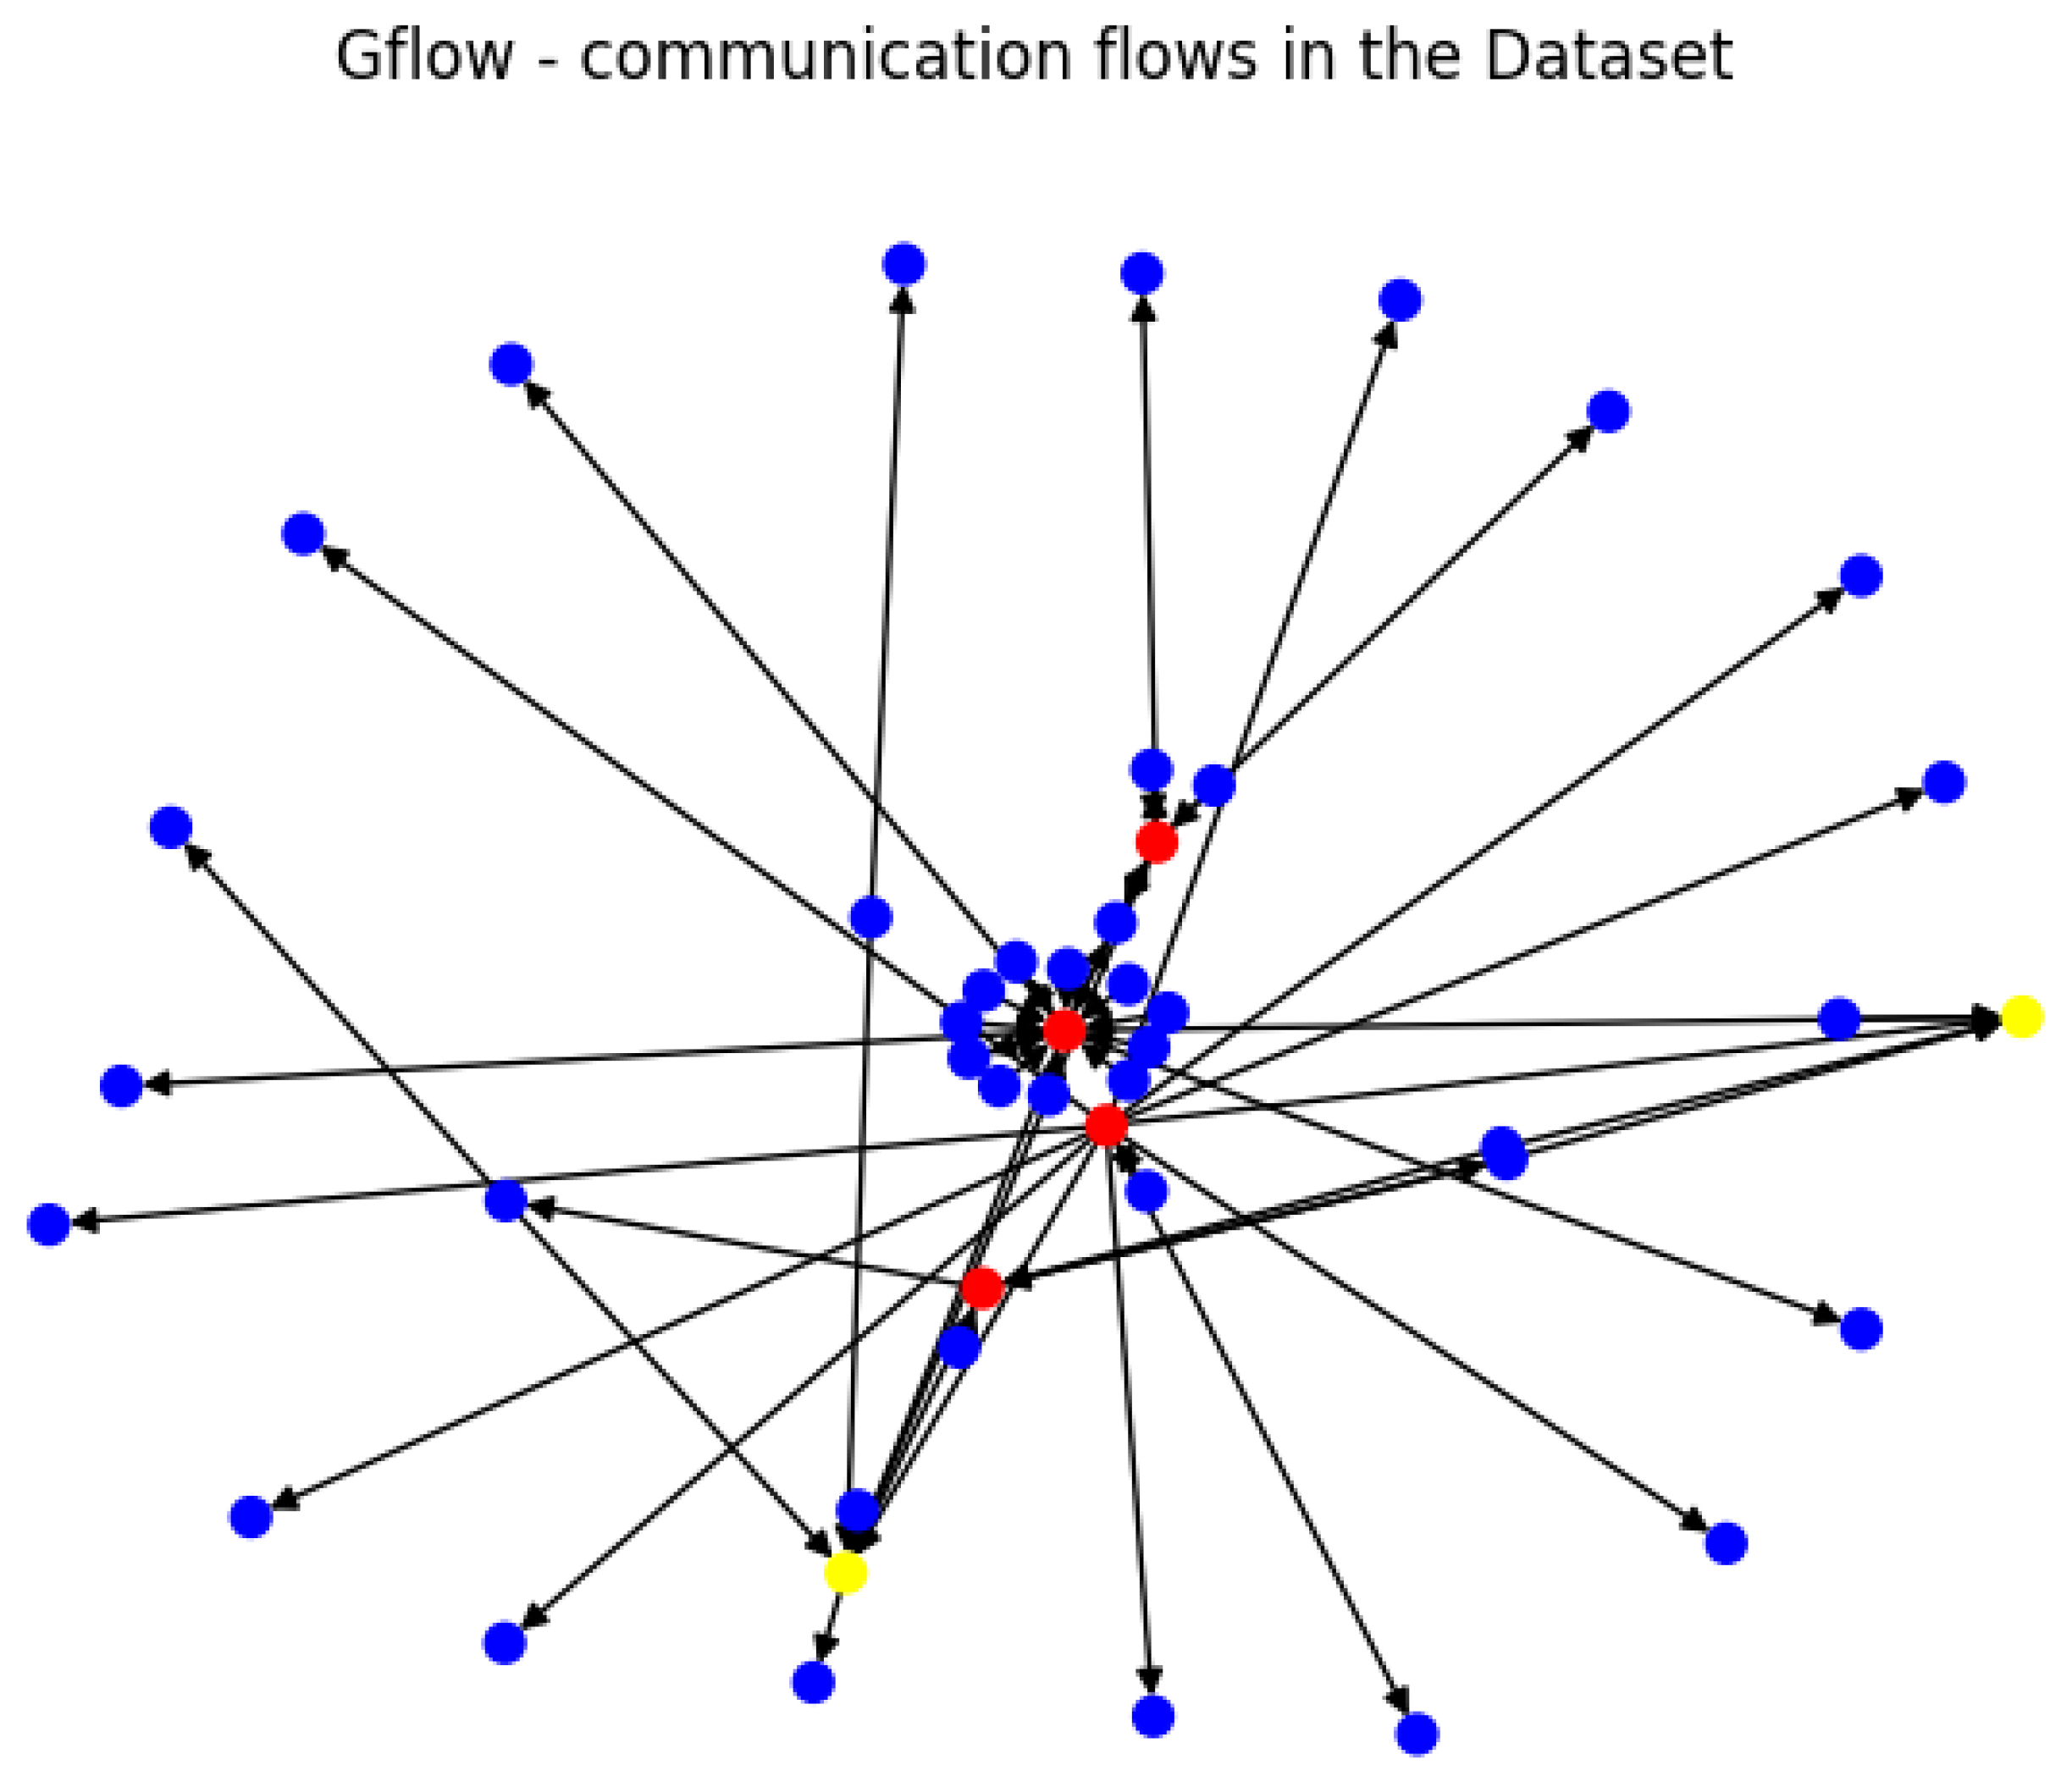
- A hierarchical event correlation model: The model concentrates on the correlation component of an intrusion detection system and combines similarity and graph-based techniques in an ensemble. The first level of the hierarchy performs aggregation, data reduction, and clustering so that the events ingested by the graph correlation algorithm are significantly reduced. The graph correlation then performs cluster interconnections and visualization to reveal communication patterns and visual analytics in real time.
- A clustering algorithm, after considering options for clustering the network event data and their unique characteristics, with a time complexity of .
2. Proposed Approach
2.1. Event Correlation Process
2.2. Hierarchical Event Correlation Model
2.3. Level 1—Similarity-Based Correlation
2.3.1. Event Aggregation
2.3.2. Event Clustering
2.3.3. Context Supplementation
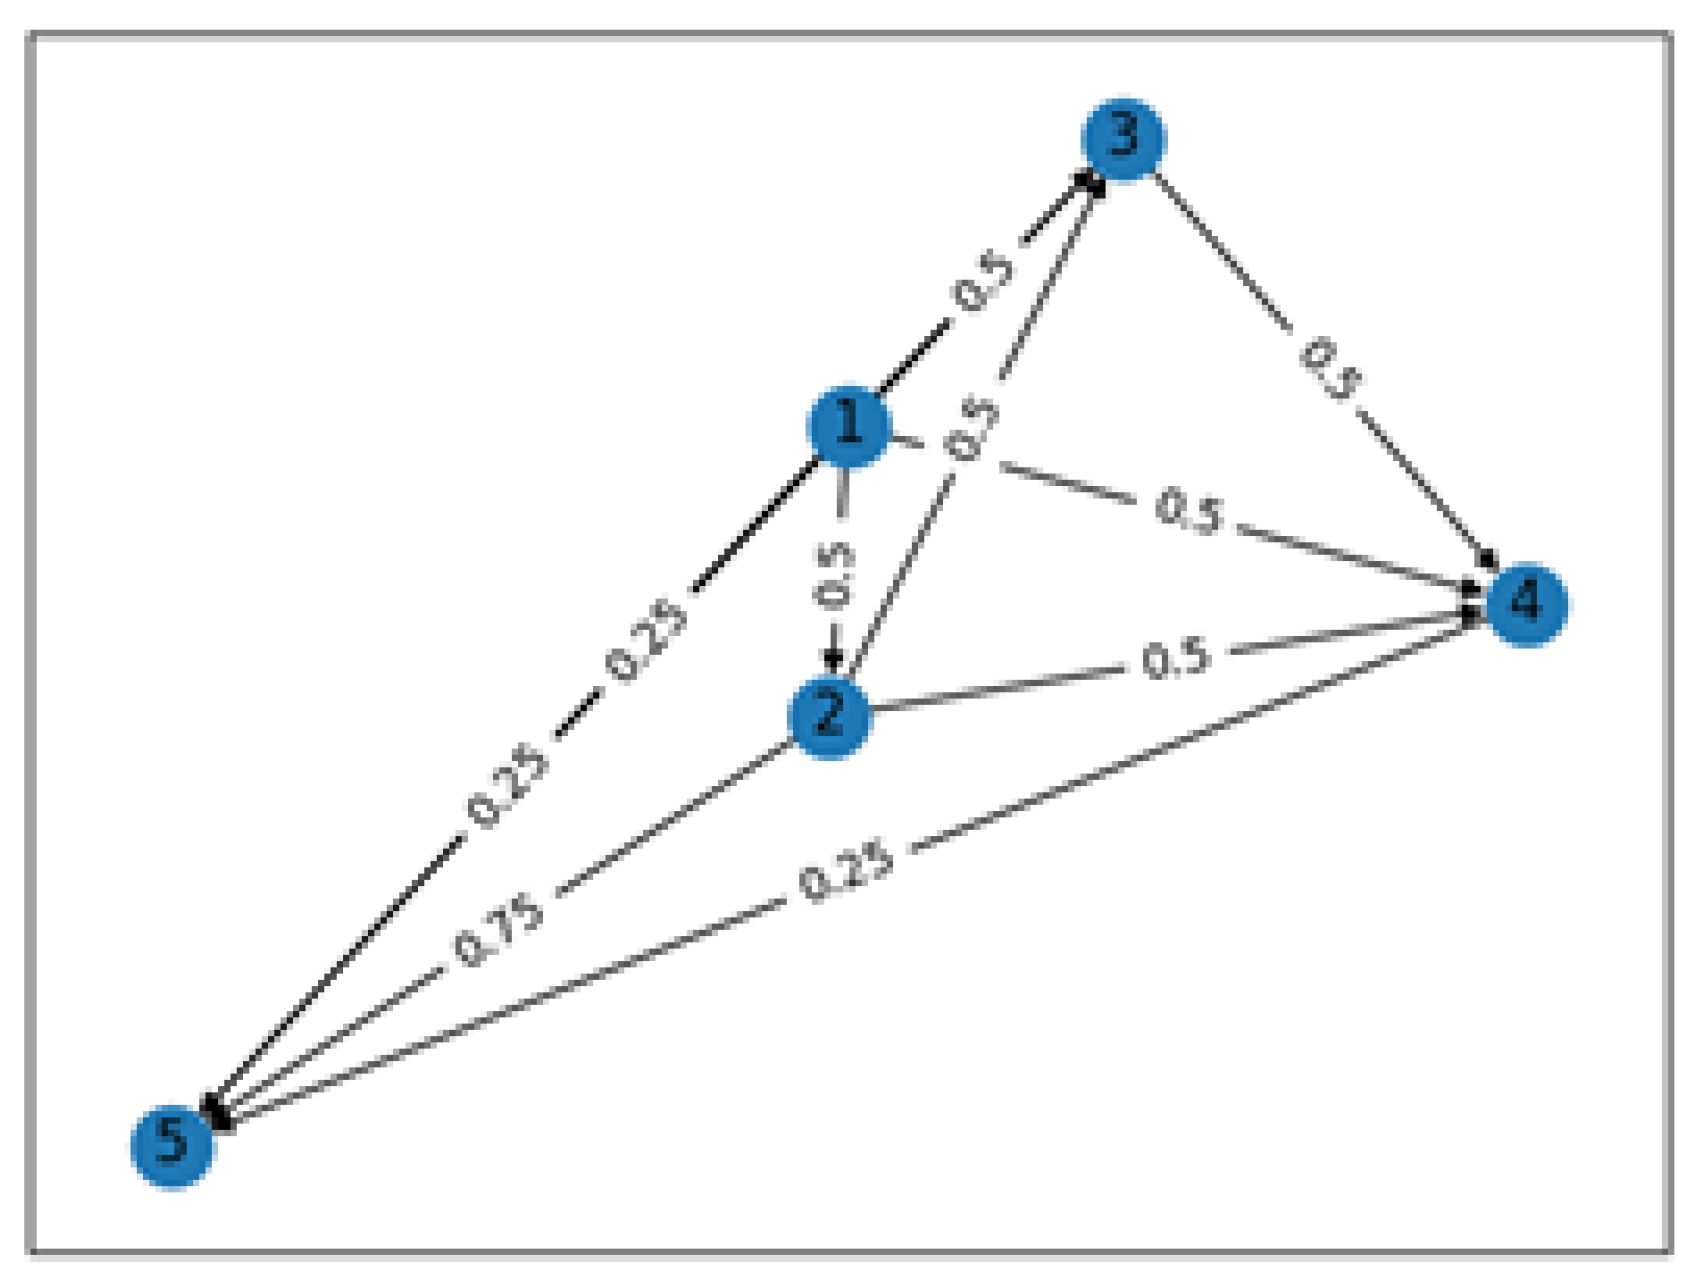
2.4. Level 2—Graph Correlation
Cluster Interconnection
3. Experiments and Results
3.1. Data Sets
3.2. Environment
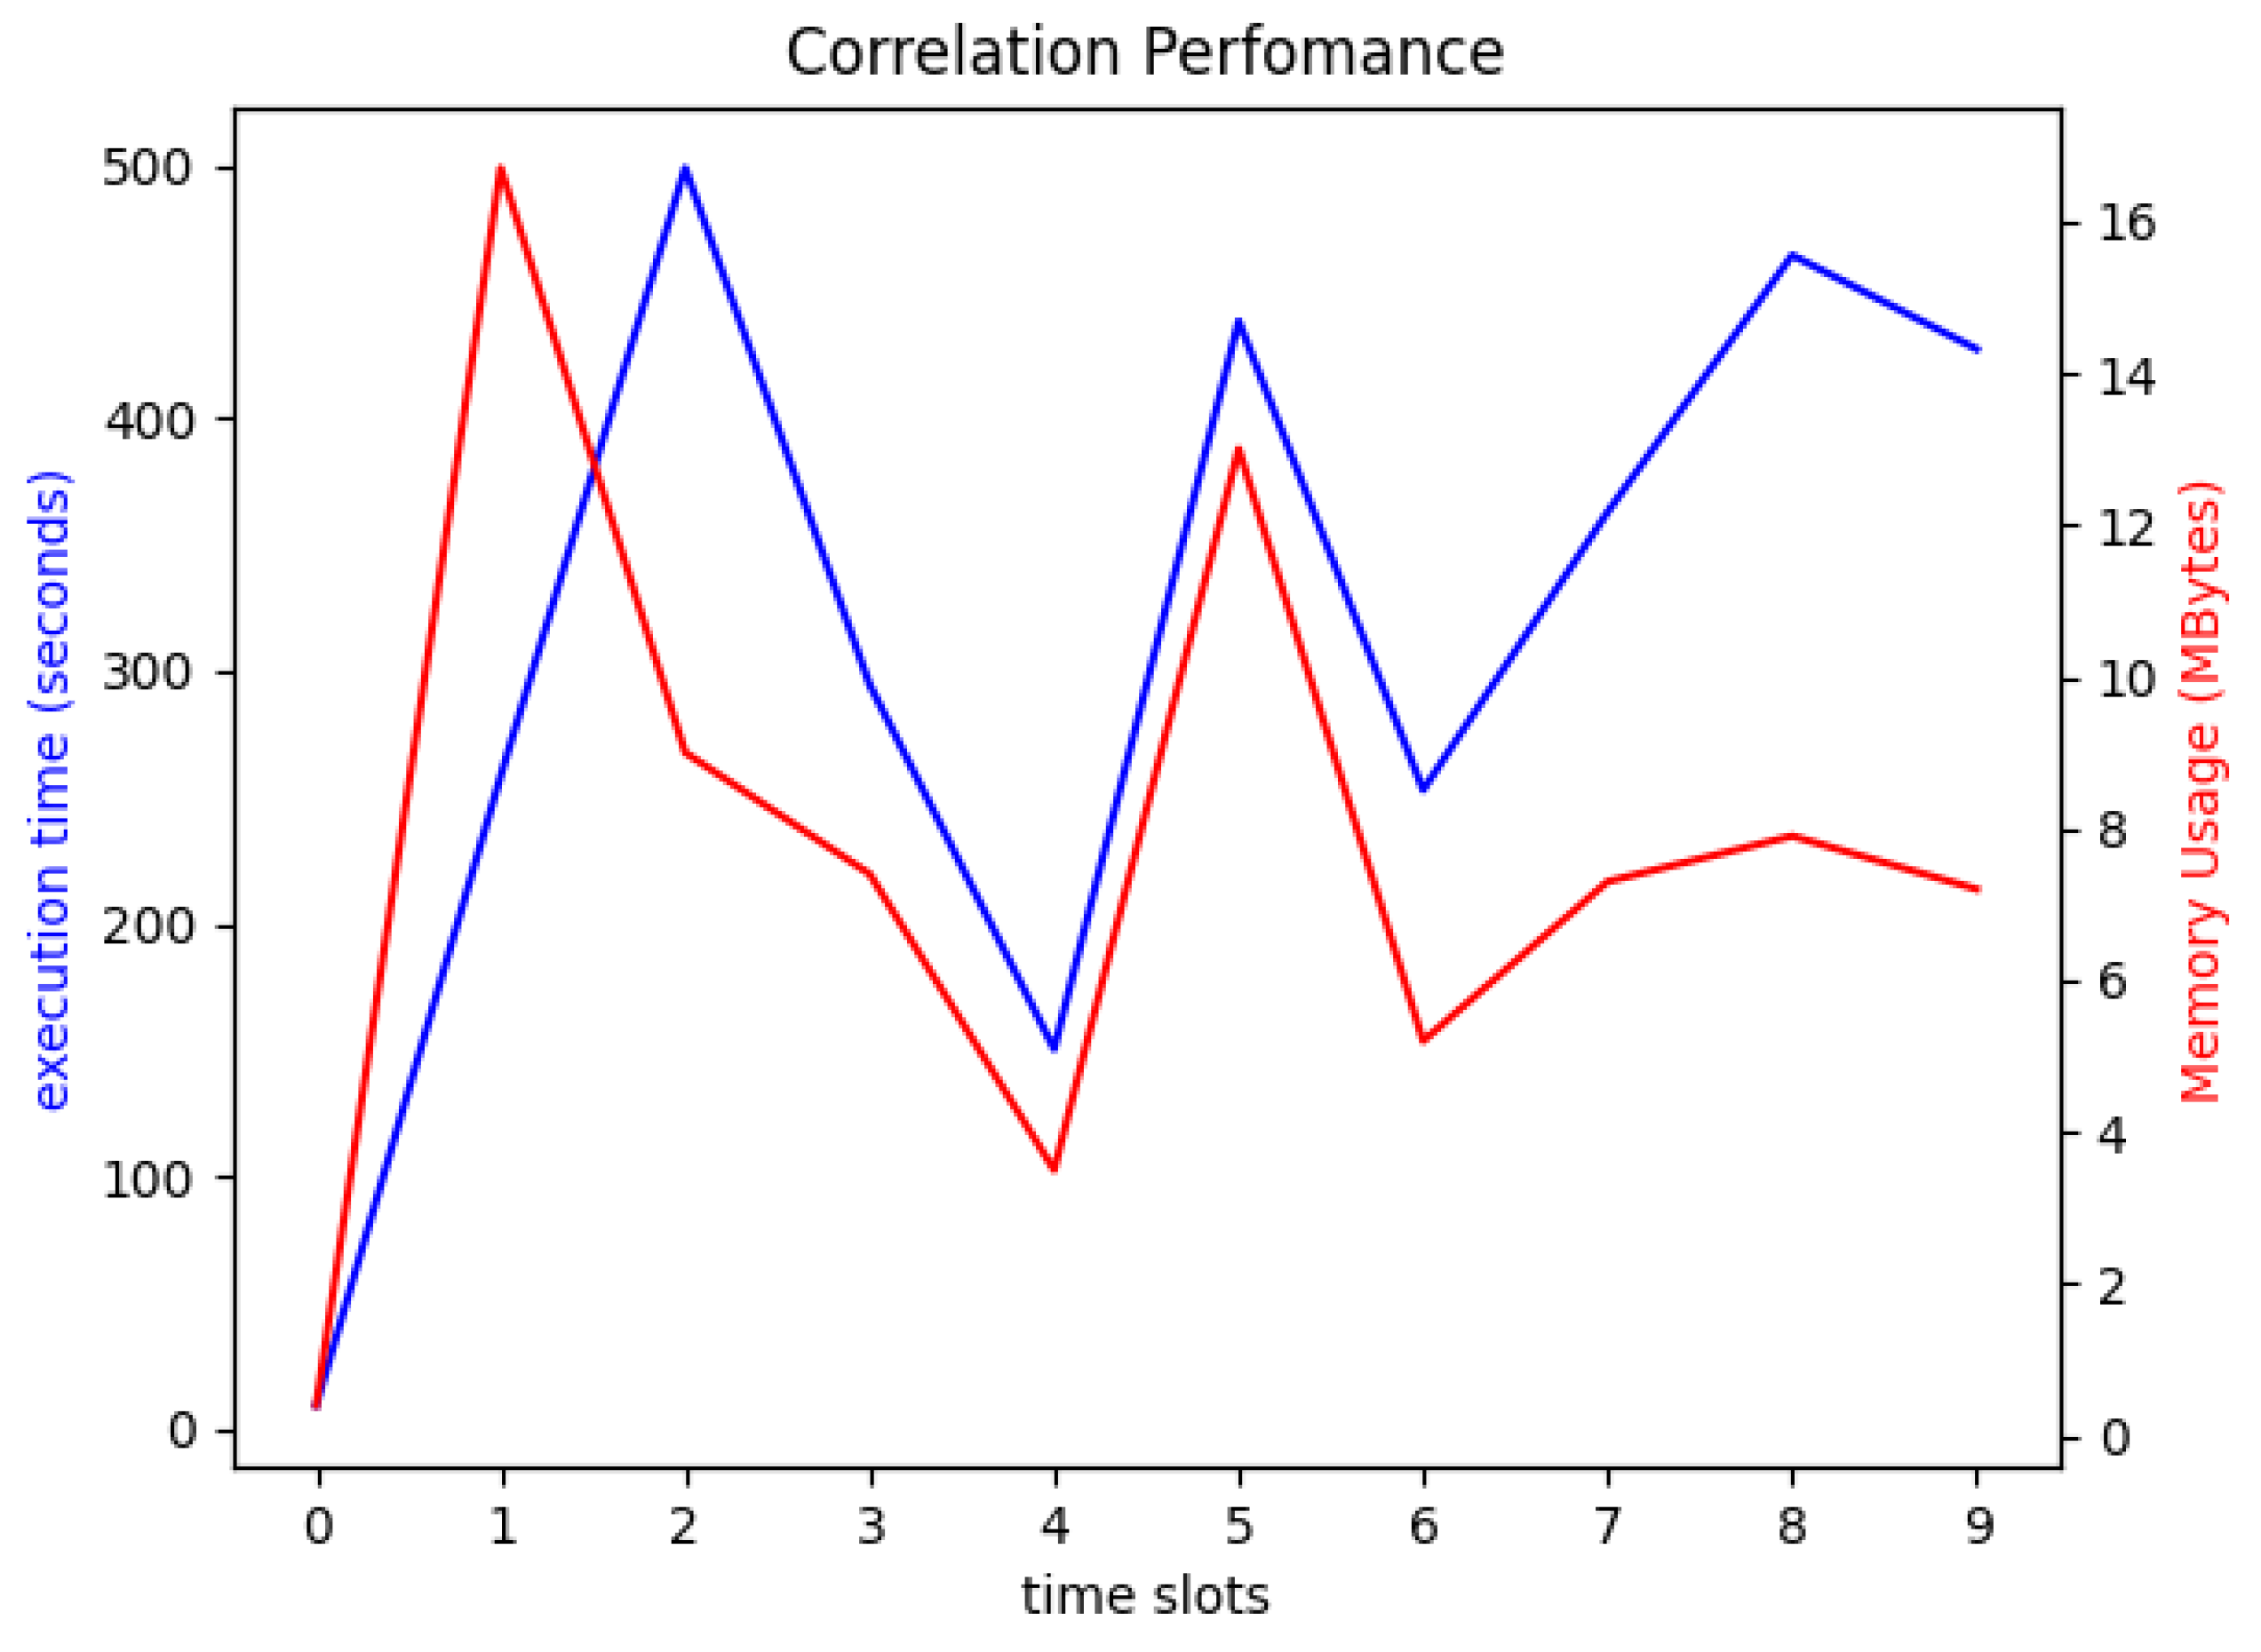
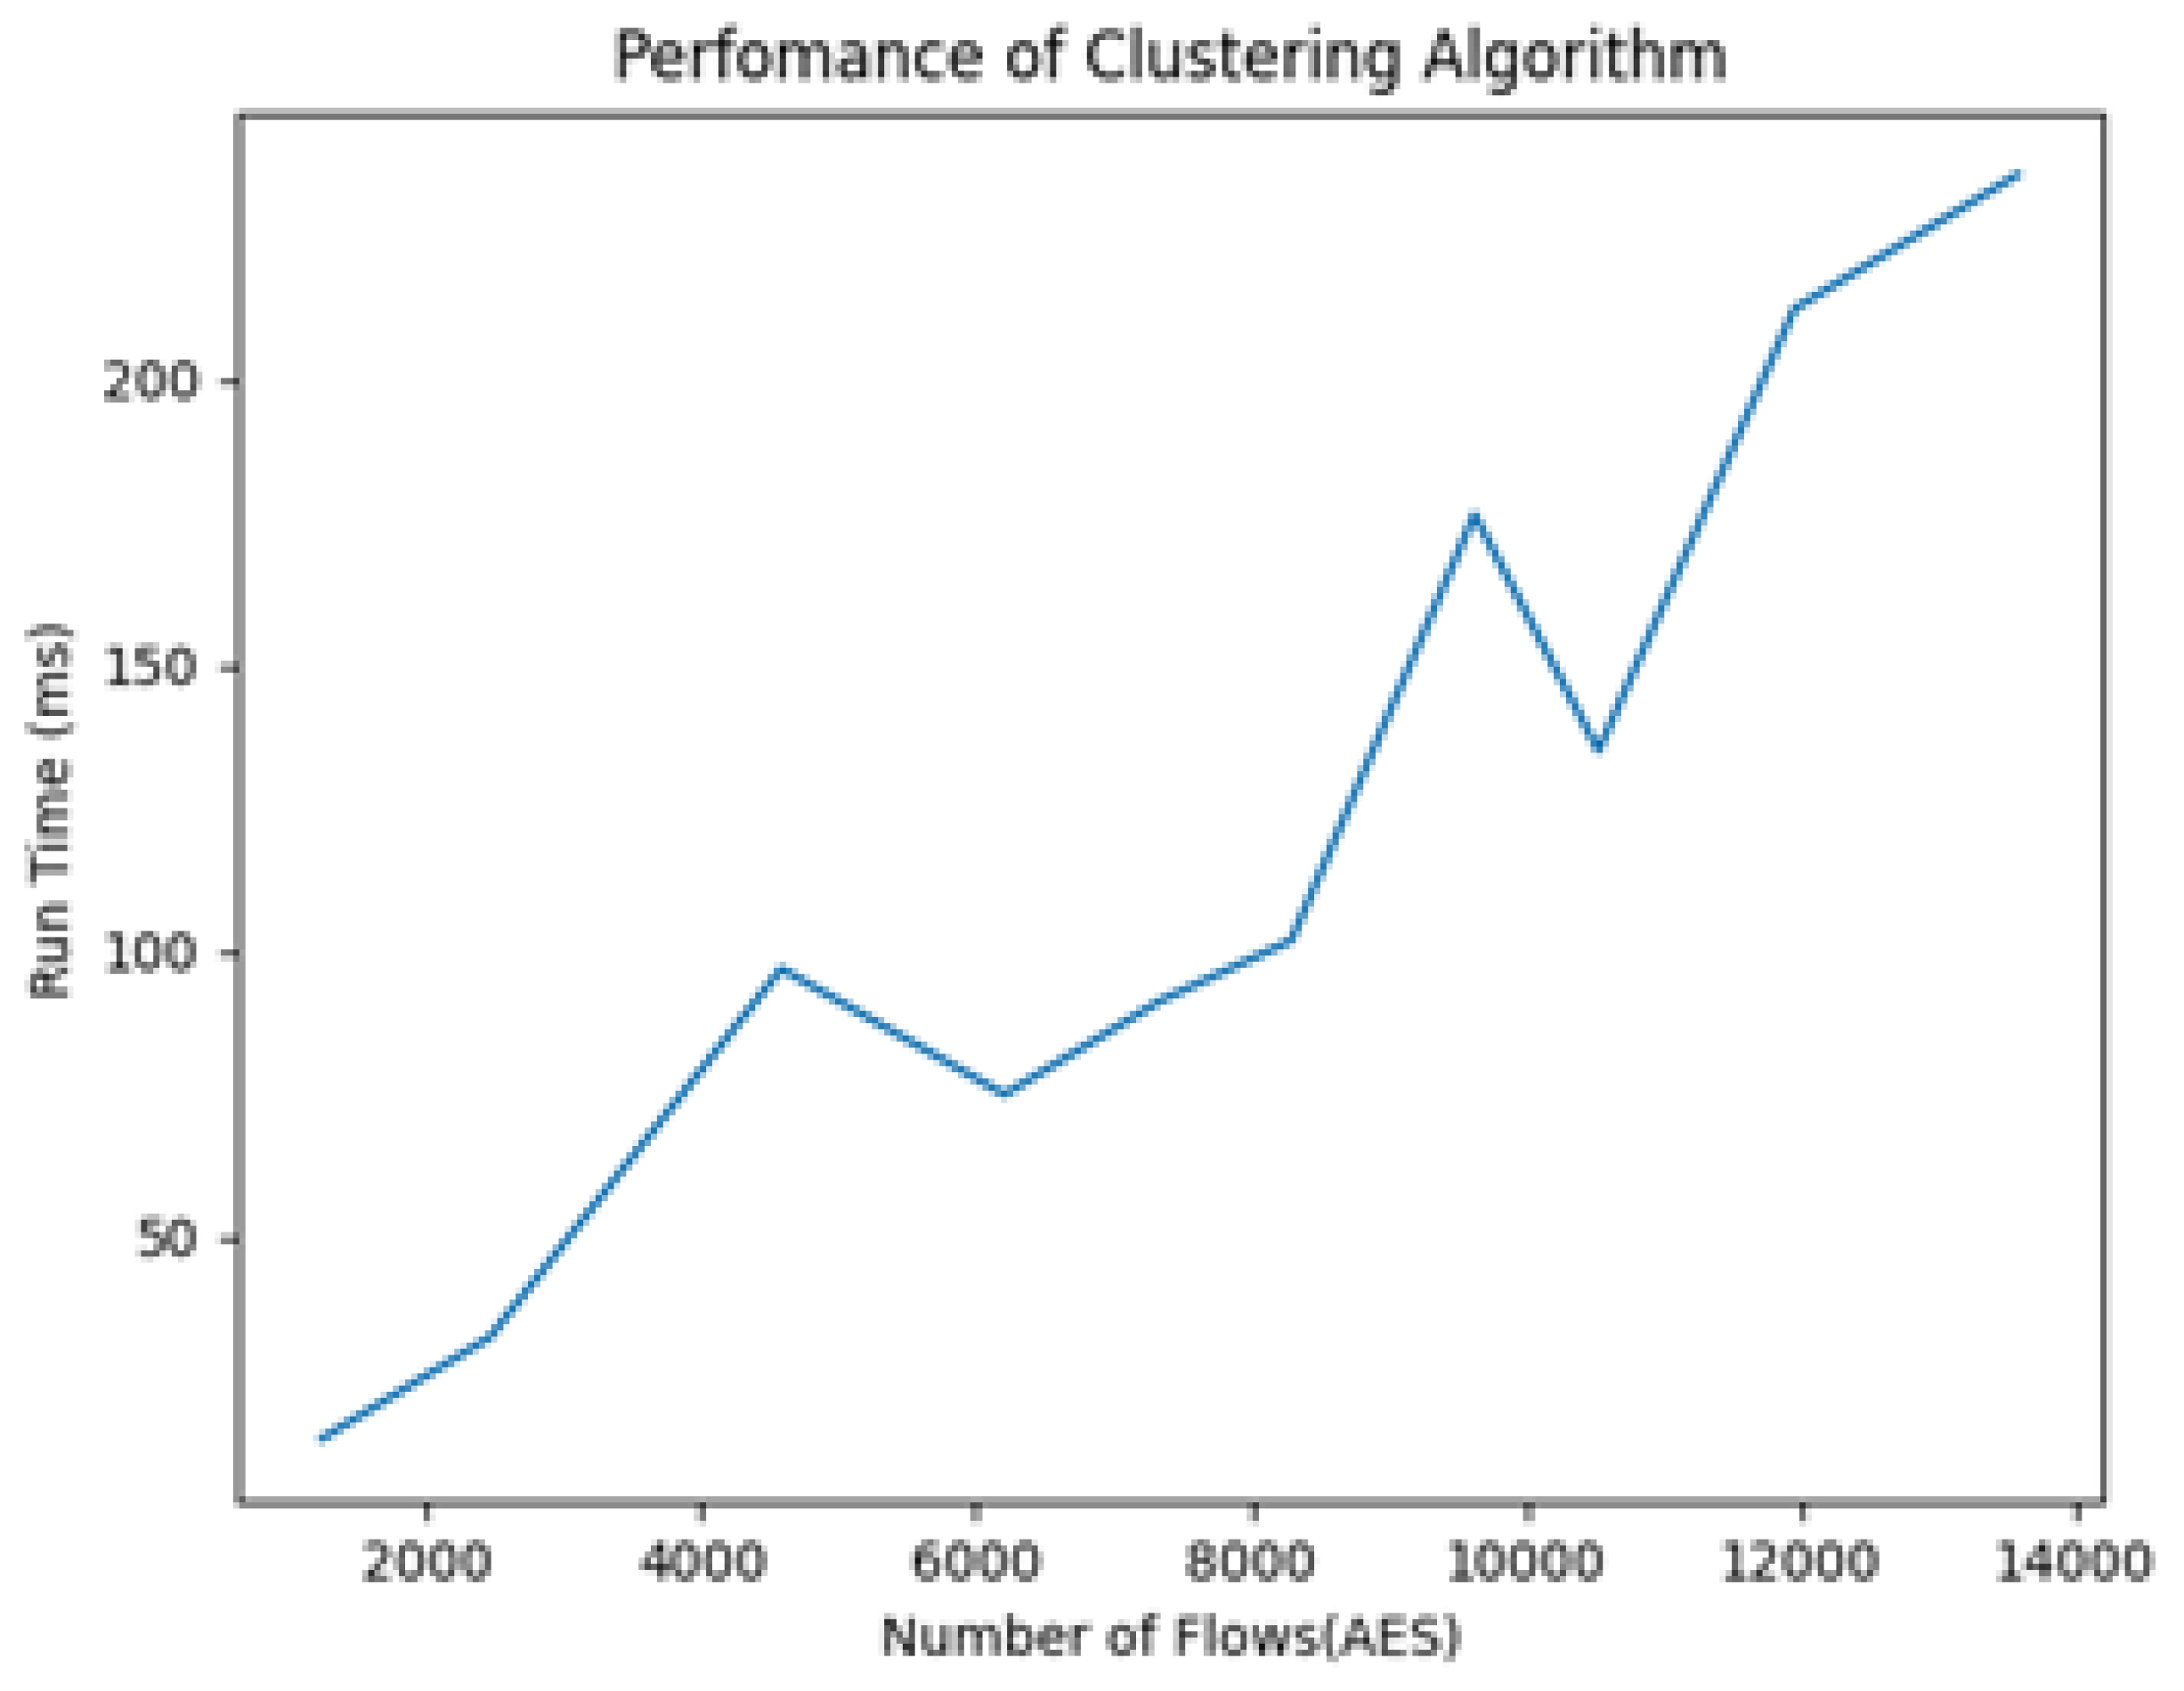
3.3. Results and Discussion
4. Conclusions
Author Contributions
Funding
Informed Consent Statement
Data Availability Statement
Conflicts of Interest
References
- Amoroso, E.G. Intrusion Detection: An Introduction to Internet Surveillance, Correlation, Trace Back, Taps and Response; Intrusion.Net Books: Sparta, NJ, USA, 2009; Volume 1. [Google Scholar]
- Feinstein, B.; Curry, D.; Debar, H. The Intrusion Detection Message Exchange Format (IDMEF); Internet Engineering Task Force, Request for Comments RFC 4765; SecureWorks Inc.: Atlanta, GA, USA, 2007. [Google Scholar] [CrossRef]
- Salah, S.; Maciá-Fernández, G.; Díaz-Verdejo, J.E. A model-based survey of alert correlation techniques. Comput. Netw. 2013, 57, 1289–1317. [Google Scholar] [CrossRef]
- Jakobson, G.; Weissman, M. Real-time telecommunication network management: Extending event correlation with temporal constraints. In Integrated Network Management IV: Proceedings of the Fourth International Symposium on Integrated Network Management, 1995; Sethi, A.S., Raynaud, Y., Faure-Vincent, F., Eds.; Springer: Boston, MA, USA, 1995; pp. 290–301. [Google Scholar] [CrossRef]
- Valeur, F.; Vigna, G.; Kruegel, C.; Kemmerer, R.A. Comprehensive approach to intrusion detection alert correlation. IEEE Trans. Dependable Secure Comput. 2004, 1, 146–169. [Google Scholar] [CrossRef]
- Cuppens, F.; Miege, A. Alert correlation in a cooperative intrusion detection framework. In Proceedings of the 2002 IEEE Symposium on Security and Privacy, Berkeley, CA, USA, 12–15 May 2002; pp. 202–215. [Google Scholar] [CrossRef]
- Tian, D.; Changzhen, H.; Qi, Y.; Jianqiao, W. Hierarchical Distributed Alert Correlation Model. In Proceedings of the 2009 Fifth International Conference on Information Assurance and Security, Xi’an, China, 18–20 August 2009; pp. 765–768. [Google Scholar] [CrossRef]
- Patton, R.M.; Beaver, J.M.; Steed, C.A.; Potok, T.E.; Treadwell, J.N. Hierarchical clustering and visualization of aggregate cyber data. In Proceedings of the 2011 7th International Wireless Communications and Mobile Computing Conference, Istanbul, Turkey, 4–8 July 2011; pp. 1287–1291. [Google Scholar] [CrossRef]
- Diakhame, M.L.; Diallo, C.; Mejri, M. MCM-CASR: Novel Alert Correlation Framework for Cyber Attack Scenario Reconstruction Based on NLP, NER, and Semantic Similarity. In Proceedings of the 2023 7th Cyber Security in Networking Conference (CSNet), Montreal, QC, Canada, 16–18 October 2023; pp. 27–31. [Google Scholar] [CrossRef]
- Croushore, D. Frontiers of Real-Time Data Analysis. J. Econ. Lit. 2011, 49, 72–100. [Google Scholar] [CrossRef]
- Lin, Z.; Li, S.; Ma, Y. Real-Time Intrusion Alert Correlation System Based on Prerequisites and Consequence. In Proceedings of the 2010 6th International Conference on Wireless Communications Networking and Mobile Computing (WiCOM), Chengdu, China, 23–25 September 2010; pp. 1–5. [Google Scholar] [CrossRef]
- Lopez, M.A.; Lobato, A.G.P.; Duarte, O.C.M.B.; Pujolle, G. An evaluation of a virtual network function for real-time threat detection using stream processing. In Proceedings of the 2018 Fourth International Conference on Mobile and Secure Services (MobiSecServ), Miami Beach, FL, USA, 24–25 February 2018; pp. 1–5. [Google Scholar] [CrossRef]
- Dong, Y.; Wang, R.; He, J. Real-Time Network Intrusion Detection System Based on Deep Learning. In Proceedings of the 2019 IEEE 10th International Conference on Software Engineering and Service Science (ICSESS), Beijing, China, 18–20 October 2019; pp. 1–4. [Google Scholar] [CrossRef]
- Maosa, H.; Ouazzane, K.; Sowinski-Mydlarz, V. Real-time cyber analytics data collection framework. Int. J. Inf. Secur. Priv. IJISP 2022, 16, 1–10. [Google Scholar] [CrossRef]
- Kumari, V.P. Real time streaming fastdata and proposed framework for disaster alerts. In Proceedings of the 2016 International Conference on Emerging Trends in Engineering, Technology and Science (ICETETS), Pudukkottai, India, 24–26 February 2016; pp. 1–3. [Google Scholar] [CrossRef]
- Ma, J.; Li, Z.; Li, W. Real-Time Alert Stream Clustering and Correlation for Discovering Attack Strategies. In Proceedings of the 2008 Fifth International Conference on Fuzzy Systems and Knowledge Discovery, Jinan, China, 18–20 October 2008; pp. 379–384. [Google Scholar] [CrossRef]
- Ramaki, A.A.; Khosravi-Farmad, M.; Bafghi, A.G. Real time alert correlation and prediction using Bayesian networks. In Proceedings of the 2015 12th International Iranian Society of Cryptology Conference on Information Security and Cryptology (ISCISC), Rasht, Iran, 8–10 September 2015; pp. 98–103. [Google Scholar] [CrossRef]
- Zhang, H.; Li, Y.; Lv, Z.; Sangaiah, A.K.; Huang, T. A real-time and ubiquitous network attack detection based on deep belief network and support vector machine. IEEE/CAA J. Autom. Sin. 2020, 7, 790–799. [Google Scholar] [CrossRef]
- Li, B.; Chan, K.C.C. A fast big data collection system using MapReduce framework. In Proceedings of the 2014 IEEE 3rd International Conference on Cloud Computing and Intelligence Systems, Shenzhen, China, 27–29 November 2014; pp. 530–535. [Google Scholar] [CrossRef]
- Haas, S.; Fischer, M. On the alert correlation process for the detection of multi-step attacks and a graph-based realization. ACM SIGAPP Appl. Comput. Rev. 2019, 19, 5–19. [Google Scholar] [CrossRef]
- Lee, K.; Kim, J.; Kwon, K.H.; Han, Y.; Kim, S. DDoS attack detection method using cluster analysis. Expert Syst. Appl. 2008, 34, 1659–1665. [Google Scholar] [CrossRef]
- Qin, X.; Xu, T.; Wang, C. DDoS Attack Detection Using Flow Entropy and Clustering Technique. In Proceedings of the 2015 11th International Conference on Computational Intelligence and Security (CIS), Shenzhen, China, 19–20 December 2015; pp. 412–415. [Google Scholar] [CrossRef]
- Palla, G.; Derényi, I.; Farkas, I.; Vicsek, T. Uncovering the overlapping community structure of complex networks in nature and society. Nature 2005, 435, 814–818. [Google Scholar] [CrossRef] [PubMed]
- Xu, R.; Wunsch, D. Survey of clustering algorithms. IEEE Trans. Neural Netw. 2005, 16, 645–678. [Google Scholar] [CrossRef] [PubMed]
- Han, J.; Pei, J.; Yin, Y.; Mao, R. Mining frequent patterns without candidate generation: A frequent-pattern tree approach. Data Min. Knowl. Discov. 2004, 8, 53–87. [Google Scholar] [CrossRef]
- Vaarandi, R. A data clustering algorithm for mining patterns from event logs. In Proceedings of the 3rd IEEE Workshop on IP Operations and Management (IPOM 2003) (IEEE Cat. No.03EX764), Kansas City, MO, USA, 3 October 2003; pp. 119–126. [Google Scholar] [CrossRef]
- Zhang, S.; Li, J.; Chen, X.; Fan, L. Building network attack graph for alert causal correlation. Comput. Secur. 2008, 27, 188–196. [Google Scholar] [CrossRef]
- Wang, L.; Liu, A.; Jajodia, S. Using attack graphs for correlating, hypothesizing, and predicting intrusion alerts. Comput. Commun. 2006, 29, 2917–2933. [Google Scholar] [CrossRef]
- Yao, Z.; Mark, P.; Rabbat, M. Anomaly Detection Using Proximity Graph and PageRank Algorithm. IEEE Trans. Inf. Forensics Secur. 2012, 7, 1288–1300. [Google Scholar] [CrossRef]
- Diao, C.; Zhang, D.; Liang, W.; Li, K.-C.; Hong, Y.; Gaudiot, J.-L. A Novel Spatial-Temporal Multi-Scale Alignment Graph Neural Network Security Model for Vehicles Prediction. IEEE Trans. Intell. Transp. Syst. 2023, 24, 904–914. [Google Scholar] [CrossRef]
- Lundin, E.; Jonsson, E. Survey of Intrusion Detection Research; Chalmers University of Technology: Göteborg, Sweden, 2002. [Google Scholar]
- Roesch, M. Snort: Lightweight intrusion detection for networks. In Proceedings of the LISA ’99: Proceedings of the 13th USENIX Conference on System Administration, Seattle, WA, USA, 7–12 November 1999; pp. 229–238. [Google Scholar]
- Ning, P.; Xu, D.; Healey, C.G.; Amant, R.S. Building Attack Scenarios through Integration of Complementary Alert Correlation Method. In Proceedings of the 10th Annual Network and Distributed System Security Symposium (NDSS ’04), 2004; pp. 97–111. Available online: https://healey.csc.ncsu.edu/publications/15812-building-attack-scenarios-through-integration-of-complementary-alert-correlation-method (accessed on 8 December 2023).
- Schueller, Q.; Basu, K.; Younas, M.; Patel, M.; Ball, F. A Hierarchical Intrusion Detection System using Support Vector Machine for SDN Network in Cloud Data Center. In Proceedings of the 2018 28th International Telecommunication Networks and Applications Conference (ITNAC), Sydney, NSW, Australia, 21–23 November 2018; pp. 1–6. [Google Scholar] [CrossRef]
- Khraisat, A.; Gondal, I.; Vamplew, P.; Kamruzzaman, J. Survey of intrusion detection systems: Techniques, datasets and challenges. Cybersecurity 2019, 2, 20. [Google Scholar] [CrossRef]
- Cheng, Q.; Wu, C.; Zhou, S. Discovering Attack Scenarios via Intrusion Alert Correlation Using Graph Convolutional Networks. IEEE Commun. Lett. 2021, 25, 1564–1567. [Google Scholar] [CrossRef]
- Ghanem, M.C. Towards an Efficient Automation of Network Penetration Testing Using Model-Based Reinforcement Learning. Doctoral Dissertation, University of London, London, UK, 2022. [Google Scholar]
- Ramaki, A.A.; Amini, M.; Atani, R.E. RTECA: Real time episode correlation algorithm for multi-step attack scenarios detection. Comput. Secur. 2015, 49, 206–219. [Google Scholar] [CrossRef]
- Pakhira, M.K. A Linear Time-Complexity k-Means Algorithm Using Cluster Shifting. In Proceedings of the 2014 International Conference on Computational Intelligence and Communication Networks, Bhopal, India, 14–16 November 2014; pp. 1047–1051. [Google Scholar] [CrossRef]
- Tomita, E.; Tanaka, A.; Takahashi, H. The worst-case time complexity for generating all maximal cliques and computational experiments. Theor. Comput. Sci. 2006, 363, 28–42. [Google Scholar] [CrossRef]
- Wang, X.; Gong, X.; Yu, L.; Liu, J. MAAC: Novel alert correlation method to detect multi-step attack. In Proceedings of the 2021 IEEE 20th International Conference on Trust, Security and Privacy in Computing and Communications (TrustCom), Shenyang, China, 20–22 October 2021; pp. 726–733. [Google Scholar]
- Anbarestani, R.; Akbari, B.; Fathi, F. An iterative alert correlation method for extracting network intrusion scenarios. In Proceedings of the 20th Iranian Conference on Electrical Engineering (ICEE2012), Tehran, Iran, 15–17 May 2012; pp. 684–689. [Google Scholar]


| Event ID | Source IP | Destination IP | Port | Timestamp |
|---|---|---|---|---|
| 1 | 192.168.202.103 | 192.168.207.4 | 53 | 2012-03-16 12:40:35 |
| 2 | 192.168.202.89 | 192.168.207.4 | 53 | 2012-03-16 12:40:41 |
| 3 | 192.168.202.95 | 192.168.207.4 | 53 | 2012-03-16 12:40:48 |
| 4 | 192.168.202.61 | 192.168.207.4 | 53 | 2012-03-16 12:41:25 |
| 5 | 192.168.202.89 | 192.168.207.4 | 53 | 2012-03-16 12:40:41 |
| Ref. | Data Source | Technique Used | Approach |
|---|---|---|---|
| Patton et al. [8] | Network alerts | (1) Splunk is used to aggregate alerts (2) Text analysis of the created hyperalerts | Splunk is used to perform the first level of the correlation to aggregate IDS alerts. The aggregated alerts are then further clustered using text analysis. |
| Tian et al. [7] | Network alerts | (1) Attribute similarity (2) Prerequisite and consequences | IDS alerts are initially correlated using attribute similarity to create hyperalerts. The resulting hyperalerts are then correlated using prerequisites and consequences. |
| Cuppens and Miege [6] | Network alerts | Pre–post conditions | IDS alerts are correlated using pre–post conditions to discover and generate hyperalerts and discover local attacks. The same technique is applied again on the hyperalerts to discover global attacks. |
| Ning et al. [33] | Network alerts | (1) Attribute similarity (2) Prerequisite and consequences | IDS alerts are initially correlated using attribute similarity to create hyperalerts. The resulting hyperalerts are then correlated using prerequisites and consequences. |
| Diakhame et al. [9] | IDS alerts | NLP using NER and semantic similarity | Attributes of aggregated alerts are extracted using NER and then correlated based on semantic similarity. |
| Proposed Model | Network events | (1) Attribute similarity and (2) graph correlation based on time and association rules | Raw event records are initially correlated based on attribute similarity to achieve aggregation and create hyperalerts. The hyperalerts are then correlated using both temporal features and association rules to establish global traffic patterns that may flag suspicious flows. |
| Timestamp | Src_IP | Dst_IP | Src_Port | Dst_Port | Protocol | Bytes |
|---|---|---|---|---|---|---|
| 12:31:57.740 | 192.168.204.69 | 192.168.204.1 | 68 | 67 | UDP | 328 |
| 12:33:02.540 | 192.168.204.69 | 192.168.204.1 | 68 | 67 | UDP | 328 |
| 12:35:00.750 | 192.168.204.69 | 192.168.204.1 | 68 | 67 | UDP | 328 |
| 12:38:03.760 | 192.168.204.69 | 192.168.204.1 | 68 | 67 | UDP | 328 |
| Timestamp | Src_IP | Dst_IP | Src_Port | Dst_Port | Proto | Bytes |
|---|---|---|---|---|---|---|
| 12:31:57.740 | 192.168.204.69 | 192.168.204.1 | 68 | 67 | UDP | 1312 |
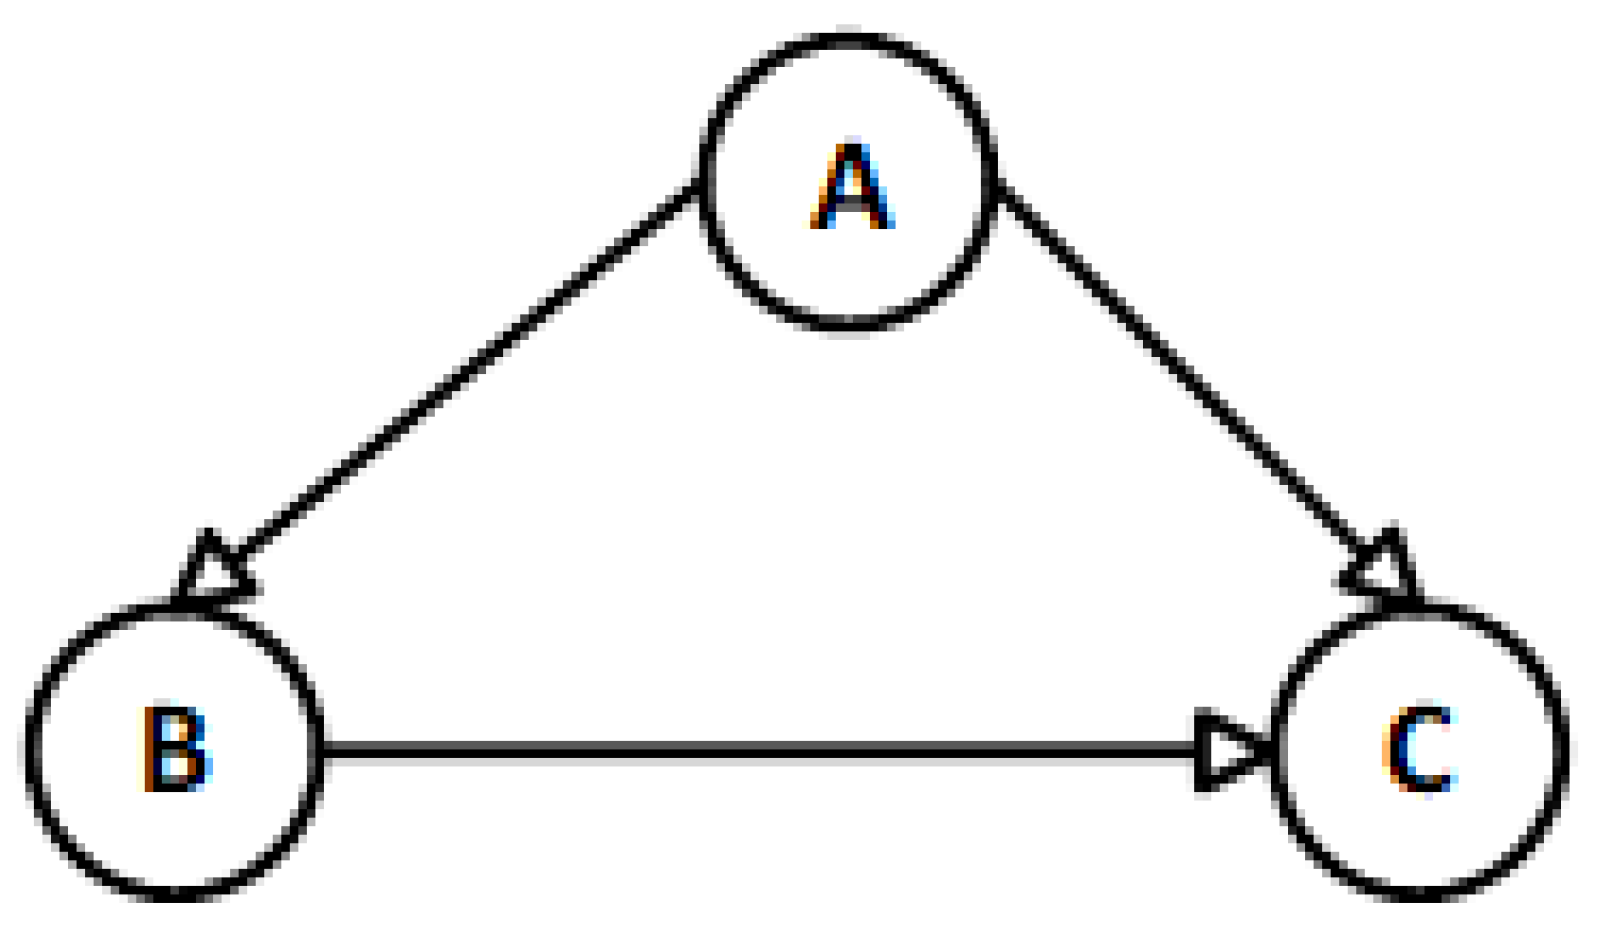
| Source | Destination |
|---|---|
| A | B |
| A | C |
| B | C |
| Function | Hardware | Virtual Machines | |
|---|---|---|---|
| Client machine | Data collector | Lenovo IdeaPad S340 Intel i7 4 Core Processor 8 GB RAM Windows 10 Pro | None |
| Server | Cloud server | DELL AMD Ryzen 7 PRO 3700 64 GB RAM Ubuntu 22.04 | Corellator app MongoDB Snort IDS |
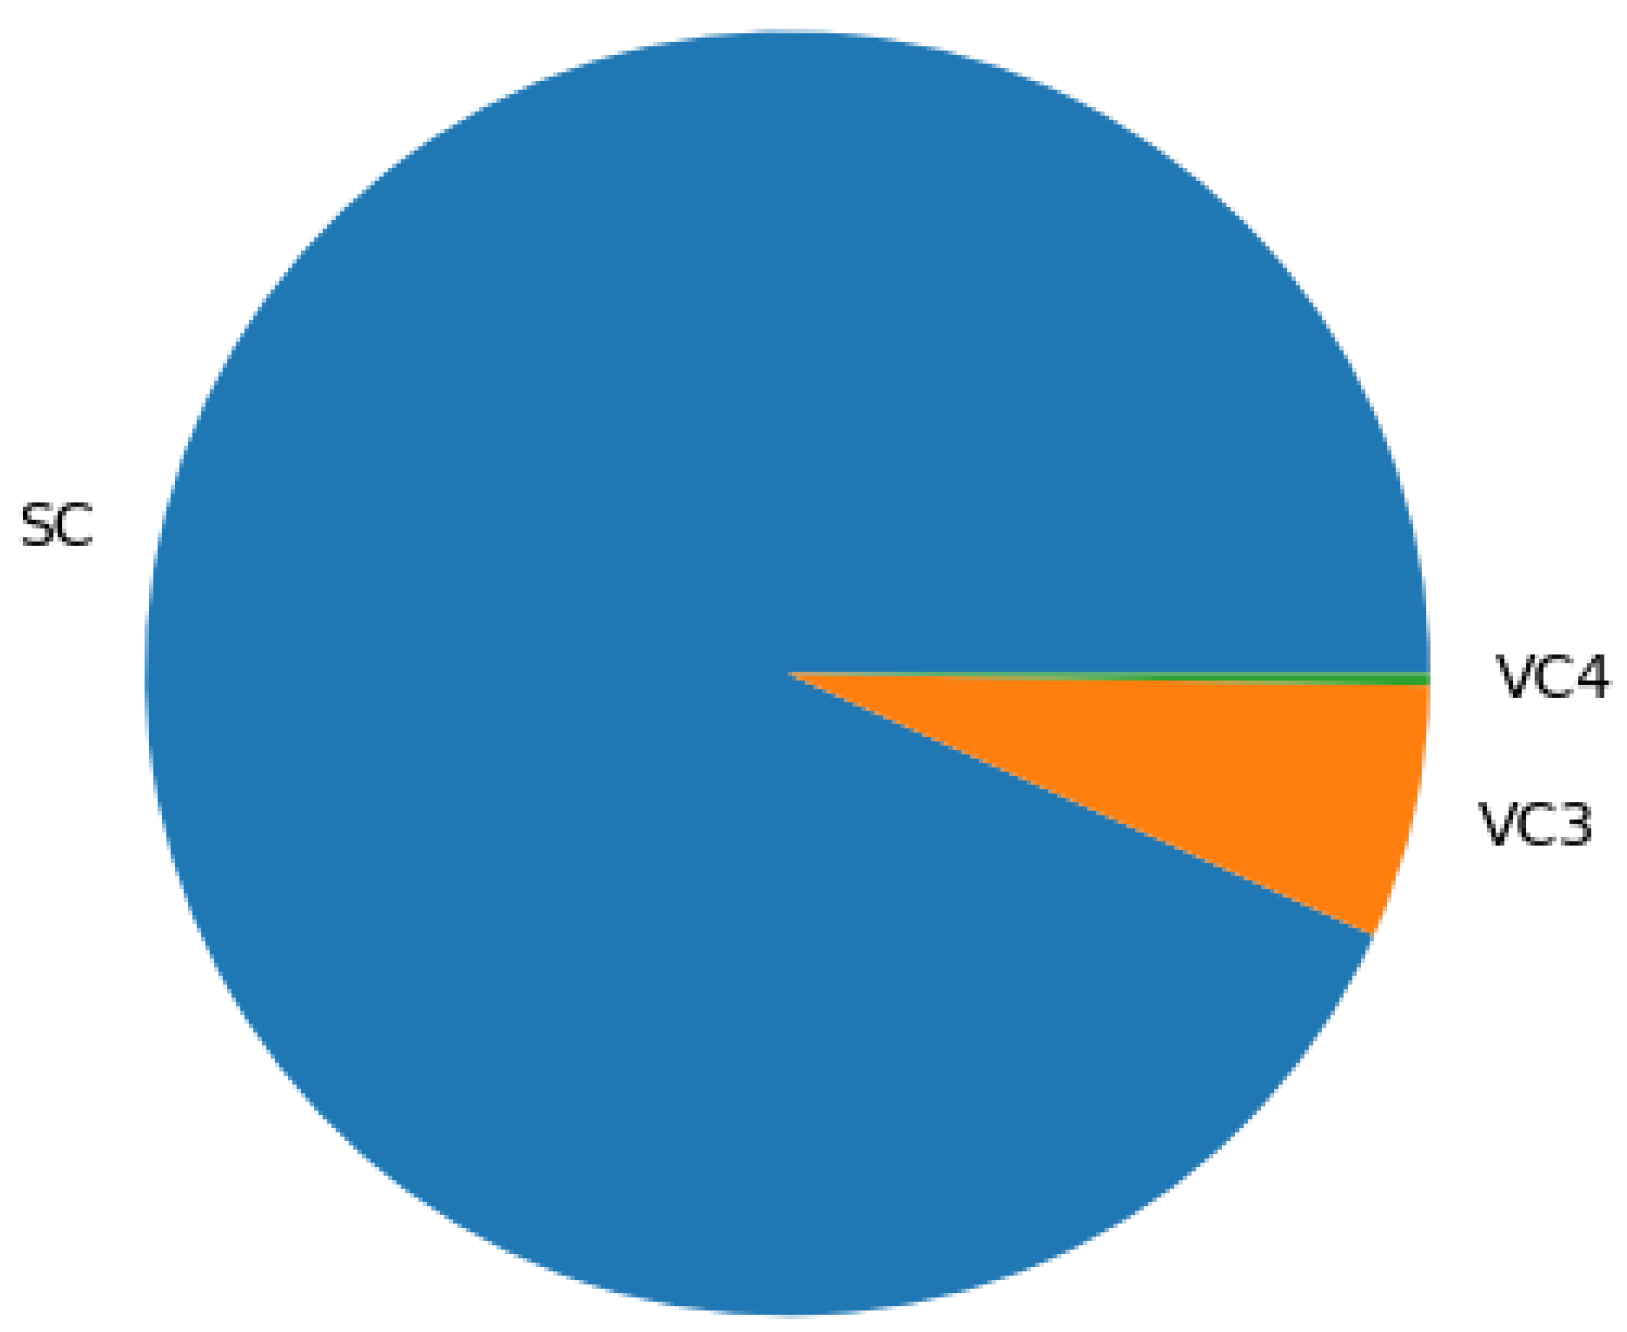
| Time_Slot | Events | AES | VC1 | VC2 | VC3 | VC4 | Meta_Events | Graphs |
|---|---|---|---|---|---|---|---|---|
| 0 | 258 | 228 | 0 | 0 | 25 | 11 | 82 | 31 |
| 1 | 1258 | 1156 | 0 | 0 | 64 | 3 | 206 | 78 |
| 2 | 1558 | 1432 | 0 | 0 | 104 | 6 | 314 | 155 |
| 3 | 1362 | 1261 | 0 | 0 | 86 | 7 | 374 | 118 |
| 4 | 968 | 8960 | 0 | 0 | 79 | 4 | 272 | 114 |
| 5 | 1597 | 1470 | 0 | 0 | 92 | 9 | 361 | 133 |
| 6 | 1225 | 1094 | 0 | 0 | 77 | 2 | 322 | 141 |
| 7 | 1504 | 1354 | 0 | 0 | 97 | 5 | 328 | 128 |
| 8 | 1461 | 1327 | 0 | 0 | 81 | 5 | 311 | 117 |
| 9 | 1582 | 1438 | 0 | 0 | 115 | 5 | 382 | 174 |
| Ref. | Approach | Dataset | RC | RS |
|---|---|---|---|---|
| Lin et al. [11] | The correlation is based on prerequisite and consequence with real-time data collection based on software agents. | CERCNET2 TESTBED | 0.77 | 0.81 |
| Wang et al. [41] | They propose a correlation system that uses alert semantics (based on the description field) and attack stages. | DARPA LLDOS 1.0 | 0.92 | - |
| Anbarestani et al. [42] | They use Bayesian network-based alert correlation to discover attack strategies | DARPA LLDOS2.0.2 | 0.91 | 0.72 |
| Diakhame et al. [9] | They develop a correlation framework for cyberattack reconstruction utilizing natural language processing (NLP) and semantic similarity techniques | UNSW-NB15 | 0.54 | - |
| Our model | The correlation of raw events is performed using a hierarchy of (1) temporal and attribute similarity and (2) graph-based correlation for uncovering suspicious network communication patterns | CICIDS-2017 | 0.87 | 1 |
Disclaimer/Publisher’s Note: The statements, opinions and data contained in all publications are solely those of the individual author(s) and contributor(s) and not of MDPI and/or the editor(s). MDPI and/or the editor(s) disclaim responsibility for any injury to people or property resulting from any ideas, methods, instructions or products referred to in the content. |
© 2024 by the authors. Licensee MDPI, Basel, Switzerland. This article is an open access article distributed under the terms and conditions of the Creative Commons Attribution (CC BY) license (https://creativecommons.org/licenses/by/4.0/).
Share and Cite
Maosa, H.; Ouazzane, K.; Ghanem, M.C. A Hierarchical Security Event Correlation Model for Real-Time Threat Detection and Response. Network 2024, 4, 68-90. https://doi.org/10.3390/network4010004
Maosa H, Ouazzane K, Ghanem MC. A Hierarchical Security Event Correlation Model for Real-Time Threat Detection and Response. Network. 2024; 4(1):68-90. https://doi.org/10.3390/network4010004
Chicago/Turabian StyleMaosa, Herbert, Karim Ouazzane, and Mohamed Chahine Ghanem. 2024. "A Hierarchical Security Event Correlation Model for Real-Time Threat Detection and Response" Network 4, no. 1: 68-90. https://doi.org/10.3390/network4010004