
IDSMatch: A Novel Deployment Method for IDS Chains in SDNs †

Center of Networked Computing, Temple University, Philadelphia, PA 19122, USA
*
Author to whom correspondence should be addressed.
†
This article is a revised and expanded version of a paper entitled Enhancing Load Balancing by Intrusion Detection System Chain on SDN Data Plane, which was presented at the IEEE Conference on Communications and Network Security (CNS), Austin, TX, USA, held on 3–5 October 2022.
Network 2024, 4(1), 48-67; https://doi.org/10.3390/network4010003
Submission received: 13 October 2023
/
Revised: 17 January 2024
/
Accepted: 4 February 2024
/
Published: 7 February 2024
Abstract
:With the surge in cyber attacks, there is a pressing need for more robust network intrusion detection systems (IDSs). These IDSs perform at their best when they can monitor all the traffic coursing through the network, especially within a software-defined network (SDN). In an SDN configuration, the control plane and data plane operate independently, facilitating dynamic control over network flows. Typically, an IDS application resides in the control plane, or a centrally located network IDS transmits security reports to the controller. However, the controller, equipped with various control applications, may encounter challenges when analyzing substantial data, especially in the face of high traffic volumes. To enhance the processing power, detection rates, and alleviate the controller’s burden, deploying multiple instances of IDS across the data plane is recommended. While deploying IDS on individual switches within the data plane undoubtedly enhances detection rates, the associated costs of installing one at each switch raise concerns. To address this challenge, this paper proposes the deployment of IDS chains across the data plane to boost detection rates while preventing controller overload. The controller directs incoming traffic through alternative paths, incorporating IDS chains; however, potential delays from retransmitting traffic through an IDS chain could extend the journey to the destination. To address these delays and optimize flow distribution, our study proposes a method to balance flow assignments to specific IDS chains with minimal delay. Our approach is validated through comprehensive testing and evaluation using a test bed and trace-based simulation, demonstrating its effectiveness in reducing delays and hop counts across various traffic scenarios.
1. Introduction
Software-defined networking (SDN) allows a computer network to be intelligently and centrally controlled through software applications. There is a separation between the control plane (SDN controllers and network applications) and the data plane (switches and their connections) of the network [1]. The network can be programmed and managed more effectively by using a controller. In the SDN application layer, the typical network applications, such as intrusion detection systems (IDS), load balancing, and firewalls, are present [2]. Based on reports received from applications installed, the controller analyzes traffic for forwarding, anomaly detection, and other purposes. There is a possibility of overhead for the controller since there is a large volume of traffic and multiple applications that it must handle [3]. IDS is one of the network applications in SDN. Using IDS, the controller can detect anomalous traffic flows and then install rules in the switch’s flow tables in order to block or reroute abnormal traffic. Although the IDS application improves the controller’s performance, there are some challenges to implementing intrusion detection. SDN applications for security services result in significant overhead for the controller. It is possible to reduce the controller’s overhead by incorporating security applications, such as IDS and firewalls, into the data plane.
The assignment of IDS to all switches can improve detection rates. However, employing IDS on switches is expensive and not feasible within a limited budget. In addition to being costly, IDS requires a considerable amount of time and causes delays in the transmission process. Thus, it would not be helpful to process traffic on all switches along the path from source to destination. Due to the global view and control capabilities of the controller in SDN, significant communication overhead among switches in the data plane is minimized. In the control plane, we offer an application that orchestrates detection actions to facilitate coordination among various IDS in the event of an attack detection. Hence, there is not a significant deal in terms of communication overhead for the data plane.
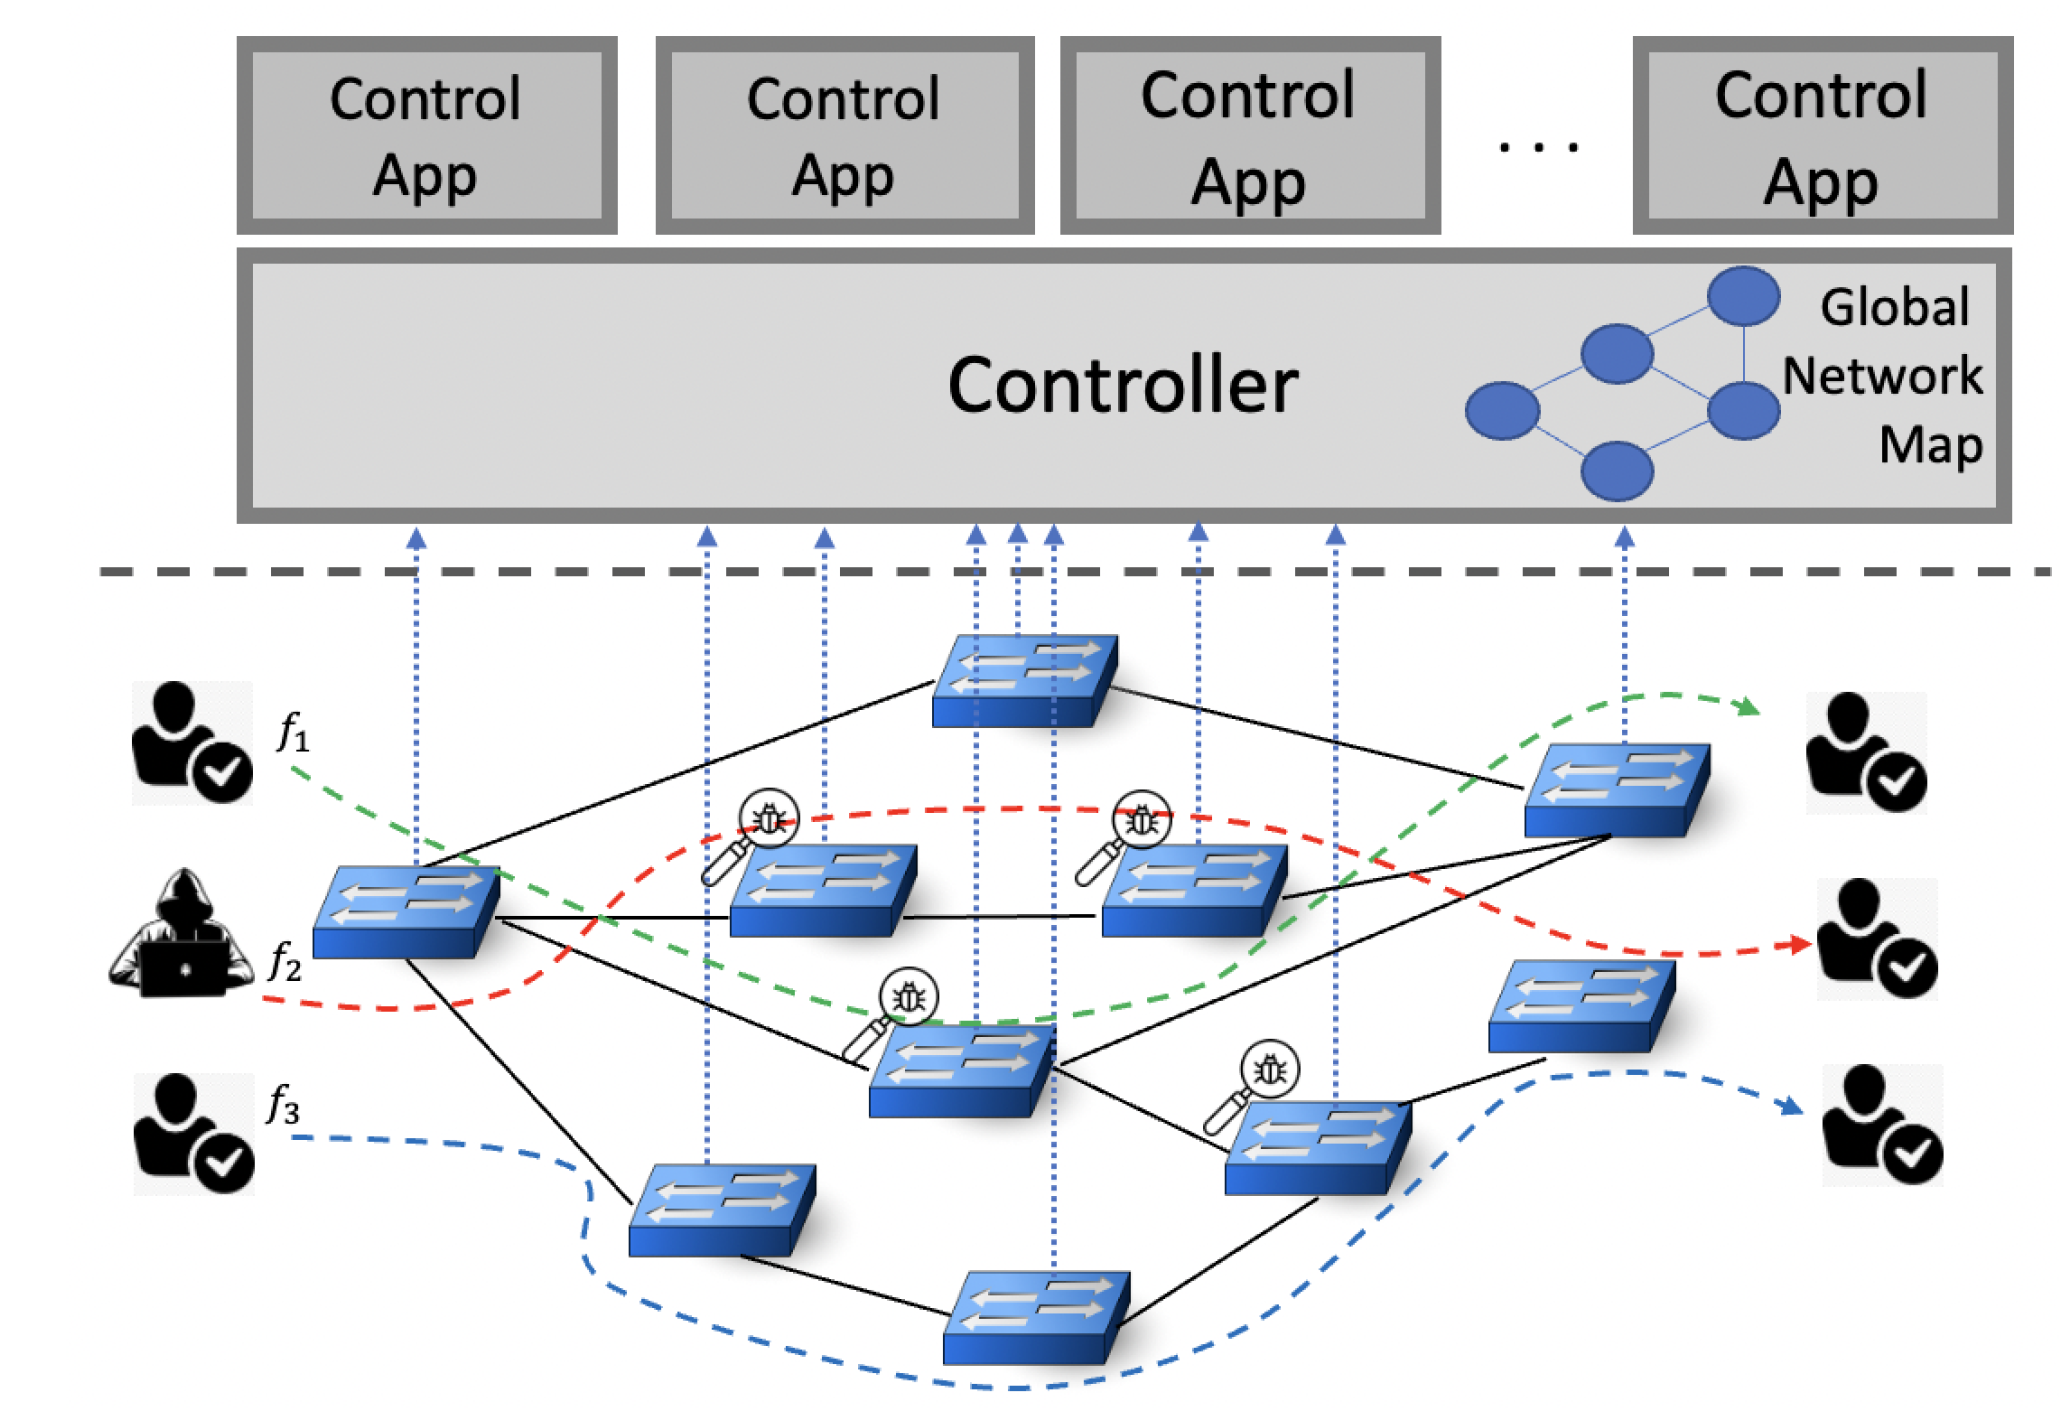
It would be beneficial if we could provide some chains of IDS across the data plane. The result would be a higher attack detection rate and a lower controller overhead. Figure 1 illustrates the application layer, control plane, and data plane in an SDN. The blue dashed lines from the switches to the controller show the control network lines, and the solid black lines between the switches are the data network lines. Originally, there is not any IDS across the data plane. Here, several IDSs are deployed on the switches in the data plane. In the data plane, four switches are equipped with IDS components. This network has some flows, such as , , and . The dashed lines in different colors present the routing path of these three traffic flows: , , and . The controller redirects each of these flows through an alternative path instead of the shortest one, including an IDS chain, to perform intrusion detection. Each IDS chain consists of some IDS components, and there is at least one IDS in every IDS chain. It is reasonable to assume that the lengths of the IDS chains are the same. A measure of the effectiveness of an IDS is its detection rate. The detection rate of blocked malicious packets can be determined by dividing the number of blocked malicious packets by the total number of malicious packets received. The controller is responsible for installing flow rules. Rather than sending traffic to the shortest path, these rules redirect traffic to alternative paths. Intruder detection systems are placed along these alternative paths. It is difficult to determine the best path and to select an IDS chain for each flow. In general, IDS applications cannot achieve an acceptable detection rate due to their limitations. It may be possible to resolve this problem by deploying a chain of IDSs. It is not possible to install IDS on all switches due to the installation costs and limitations associated with the flow tables. Therefore, it is necessary to limit the number of IDSs. As incoming traffic is grouped, there is no need for many IDSs. Performance measurements can be affected significantly by the grouping and assignment of flows, particularly when high loads are present and transmission delays are caused by non-shortest path routing.
In this paper, we discuss how to maintain a balanced flow group and how to match them with IDS chains. This paper presents a design and implementation of SDN to deploy IDS on selected switches in the data plane, with the goal of increasing the detection rate and preventing controller overload. We address the challenge of forwarding flows from a source to a destination when traffic passes through specific switches [4]. To this end, we propose a method of flow grouping and matching IDSs for a balance between the detection rate and delay. Our approach involves deploying chains of IDSs across the data plane and redirecting flows through these chains, which can be arranged in either a fixed or dynamic order. However, as IDSs are only placed on certain switches, this can result in additional hops and increased latency. To mitigate this, we also propose a method of grouping incoming traffic to reduce the limitations of maintaining a large flow table and transmission delay, which leads to fewer rules in flow tables and all flows in a group following the same path.
We initially used K-means clustering but found it unsuitable for this problem since each flow has a source and a destination. Therefore, we proposed using a 1-dimensional space to calculate distances in G, where the distance between the two points is the Euclidean distance. We also determined that the number of hops between them should calculate the distance between the source/destination of flows and centroids. We introduce an adapted form of K-means clustering, featuring a novel distance metric within a two-dimensional (2-D) space. Expanding on the motivation articulated in the prior paper [4], we aim to refine the method, focusing on improvements in delay and balancing factors during the matching and balancing process. The meanings of various symbols used in this study are provided in the Table of Notations (Table 1).
Our main contributions to this study are as follows:
- We introduce a novel approach to deploying chains of IDSs in the data plane, enhancing intrusion detection rates and reducing overload on the controller. This strategic distribution of multiple IDS chains in the data plane not only avoids controller overload but also contributes to effective intrusion detection.
- We propose a creative centroid-based modification of the k-means clustering method, which efficiently groups incoming data flows to reduce data transmission delays.
- To address the complex joint optimization problem, we present a two-phase algorithm that effectively achieves our optimization goals.
- Our paper delves deep into the intricacies of flow grouping and the association of flow groups with IDS chains under varying scenarios. We introduce two distinct models for this association process: the minimum cost 2-D matching and the minimum cost 3-D matching.
- We provide a comprehensive evaluation of our approach on a real test bed under various measurements, demonstrating its practical effectiveness in the case of network delay, number of hops, and detection rate.
The structure of the paper is as follows: In Section 2, the related works on deploying IDS on SDN, load balancing, and grouping traffic approaches are reviewed. The background and rationale behind the proposed approach are presented in Section 3. The proposed approach, which is based on grouping flows and assigning them to IDS chains, is detailed in Section 4. The evaluation and performance of the scheme are discussed in Section 5. Lastly, we provide a brief conclusion in Section 6.
2. Related Work
In this section, our focus is on the relevant literature pertaining to the utilization of Service Function Chaining (SFC) and the integration of IDS into SDN. The integration of SDN and Network Function Virtualization (NFV) empowers virtualization and enhances network services, with Service Function Chaining being a pivotal mechanism in this context [5]. SFC enables the definition of ordered lists of service functions, dynamically guiding network traffic through diverse service function paths. In [6], the authors introduce a distributed deep reinforcement learning approach, leveraging edge intelligence to deploy Service Chains (SCs). This deployment aims to jointly balance the load on physical nodes and links at the edge. Additionally, in [7], the authors address the deployment of Virtual Network Functions (VNFs) and scheduling arriving requests among computing nodes to achieve low latency and high reliability. They employ state-of-the-art reinforcement learning to formulate an SFC scheduling policy, enhancing the success rate of SFC requests.
Several works focus on the detection and prevention of specific types of attacks through the use of SFC [8]. In [9], the combination of multiple SFCs into a Security Service Function Tree (SecSFT) is proposed to optimize resource allocation for virtual security functions. The authors in [10] present a security SFC path selection scheme utilizing deep reinforcement learning. This scheme dynamically selects the optimal path for security SFC in real time using the DQN algorithm, considering the features of incoming traffic and the detection results of security service functions. Furthermore, in [11], a SDN/NFV-enabled security solution is proposed for enterprises, leveraging the commodity hardware to reduce both capital and operational expenditures.
During recent years, there has been a considerable amount of research that integrate IDS into SDN [12,13,14,15,16,17,18]. Latah et al. in [19] proposed an efficient multi-level hybrid intrusion detection method for SDNs. A kNN is used as the first level; an Extreme Learning Machine (ELM) is used as the second level; and a Hierarchical Extreme Learning Machine (H-ELM) is used as the third level. According to the experimental study, this system achieves the highest level of accuracy when compared to conventional supervised machine learning algorithms based on the NSL-KDD benchmark dataset. The overall accuracy was significantly improved as a result of this approach. Zhao et al. in [20] presented a novel IDS model for SDN that is designed to collect and analyze traffic at the control plane. The proposed IDS model addresses the limitation of the data processing capacity using a probability-based traffic sampling method, using a genetic algorithm that estimates the sampling probability for each sampling point by analyzing the total number of false negatives. Based on the limited detection capacity of the IDS, this technique determines the best sampling rate for each switch. As a result, they improved the effectiveness of intrusion detection under medium network loads. Cui et al. in [21] proposed a mechanism for detecting and defending against DDoS attacks in SDN environments. In order to implement the detection, an unbalanced distribution of traffic was taken into account. An algorithm such as k-means can detect the imbalance in traffic. As an unsupervised machine learning algorithm, k-means enhanced the adaptability of the detection method and allowed the detection of attacks of different scales and types. By using an entropy-based anomaly detection system, Niknami et al. in [22] proposed a method of determining a method to detect abnormal traffic variations; they combined entropy and relative entropy. Using KL-divergence, entropy, and machine learning methods simultaneously eliminates the uncertainty associated with the entropy threshold and enhances detection performance.
In a study by Yazdinejadna et al. [23], a novel approach to attack detection within the data plane, centered on SDN architecture, is presented. Their work introduced a zone-based architecture for KIDS (Kangaroo Intrusion Detection System) to enhance scalability and anomaly detection. An innovative IDS design was employed, which leverages consecutive jumps after attack detection to efficiently notify the SDN controller and other IDS components. Goo et al. [24] introduced a methodology for traffic categorization rooted in a correlation model. Their approach assesses traffic flow similarity using Euclidean distance and examines flow connectivity by considering factors such as flow occurrence time, source and destination IP addresses, port pairs, and the Transport-Layer protocol. To alleviate the controller’s load and enhance attack detection rates, Niknami et al. proposed a distinctive extension for SDN [4]. They advocated for the deployment of IDSs in the data plane, where a chain of IDSs is interconnected with various switches. This novel approach incorporates a new distance measurement technique and a modified version of the K-means algorithm to group incoming data flows and steer flow groups toward the IDS chains. The authors in [25] introduced a novel approach called Reconstruction from Partial Observation (RePO) for constructing a network IDS. Their method leverages denoising autoencoders, demonstrating their effectiveness in detecting diverse network attacks with minimal false alerts. RePO exhibits enhanced robustness against adversarial example attacks, surpassing the accuracy of current state-of-the-art methods in building a more effective and resilient network IDS in [26].
The present paper expands on the findings presented in [4]. The utilization of multiple IDSs, in contrast to a single IDS, increases the likelihood of detecting anomalous flows. The previous study [4] investigated controller overhead, drop rates, missing rates, and detection rates across various scenarios involving attack rates and different scales of traffic. Their results demonstrated that increasing the number of IDSs has a positive impact on detecting malicious packets. However, it is crucial to note that the controller directs incoming traffic through alternative paths, incorporating IDS chains, and potential delays may arise from retransmitting traffic through an IDS chain, thus elongating the journey to the destination. To mitigate these delays and optimize flow distribution, the current study proposes a method to balance flow assignments to specific IDS chains with minimal delay. The primary objective of this paper is to present K-means clustering and subsequent matching and balancing between virtual centers and IDS. The experimental section includes entirely new evaluations. In our approach, the location of IDS is any switch in the given network, and it can be the center for multiple clusters. We run K-mean and adjust the location of groups based on closeness for the distance of flow and centroid of groups. Then, by providing balanced groups and assigning flow groups to IDS chains, the controller installs a forwarding rule for each group.
3. Background and Motivation
This paper aims to deploy IDS chains across a data plane to increase the attack detection rate and decrease overhead on the controller when there is a large amount of traffic in the SDN. An IDS describes a suspected intrusion and then signals an alarm once it has happened [27]. Regarding detection techniques, IDS can be divided into three categories: signature-based (knowledge-based), anomaly-based (behavior-based), and hybrid. A signature-based IDS detects network traffic for signs of attacks and uses those signatures as a reference to detect future attacks. An anomaly detection IDS detects traffic anomalies based on tracking them. It is the hybrid IDS that uses both knowledge and anomaly technologies. By using hybrid detection, it is possible to identify both predefined and undefined intrusions [28]. Similarly, IDSs can be categorized into three types according to their data collection techniques—host-based, network-based, and hybrid systems, which combine two approaches [29]. The SDN architecture separates the control plane’s decision-making from the data plane’s traffic forwarding while logically centralizing decision-making into a controller whose functionality can be extended via network applications. A centralized control plane provides a global view in SDN, enabling traffic engineering, security, load balancing, and other network management strategies to be implemented based on defined network policies. All switches in the network are monitored by the controller, which sets rules in the flow tables on each switch. Through the use of OpenFlow [30], a centralized controller communicates with switches and handles the routing and forwarding of the data plane. The controller monitors all switches in the network and sets rules for each switch’s flow tables. Switches send packet-in messages to controllers whenever new packets arrive that do not match entries in the flow table. An SDN-based IDS detects and reports malicious behavior or attacks to the controller. In SDN, the IDS is currently designed using a machine learning approach [31]. A machine learning-based IDS can be trained more easily with the centralization of the SDN [32].
Clustering algorithms are designed to partition the set of nodes into distinct clusters, and the challenge revolves around choosing the cluster head, often referred to as the centroid, and effectively managing these clusters. The K-means clustering technique aims to group similar items into clusters [33]. Each cluster begins with centroids selected at random, and then the positions of these centroids are optimized iteratively. The centroid of a cluster represents its central point. In the K-means algorithm, K centroids are determined, and each data point is assigned to the nearest cluster, with the goal of minimizing the size of these centroids. K is a hyper-parameter to the K-means algorithm. There is usually a heuristic approach to determining the number of clusters K. Most strategies involve running K-means with a variety of K values in order to determine which value is the most appropriate. In order to solve minimum-cost assignment problems [34], the balanced K-means algorithm can be implemented using the Munkres algorithm [35] or the Hungarian algorithm [36].
Matching problems are generally concerned with finding a set of edges whose vertex belongs to at least one of these edges. Suppose a network G has nodes and a set of links E between nodes . In the Weighted Matching method, there is weight for the edges, and the algorithm tries to identify a set of disjoint edges that have the greatest weight sum. A bipartite graph consists of two vertex sets of equal size [37], and the Perfect Weighted Matching algorithm is intended to generate an edge set on this graph. The authors in [38] presented an extension of Weighted Matching called the Weighted 3-D Matching algorithm by utilizing 3-D hyper-graphs. A general weight 3-D matching problem can be approximated using the Iterative Round Search technique.
4. IDSMatch: Deploying IDS Chains in SDN
In this paper, we introduce an innovative extension to the data plane within SDNs, with a specific focus on tackling issues related to anomaly detection and controller overload. Within the network infrastructure, IDS applications are commonly integrated into the control plane layer. However, when the network experiences a substantial influx of incoming traffic, its ability to effectively identify anomalies becomes constrained. Moreover, there exists a limited bandwidth for communication between the data plane and the control plane. Since SDNs rely exclusively on a centralized controller to manage network traffic, a high volume of incoming traffic can overwhelm the controller, potentially leading to network failures. Deploying IDSs on specific data plane switches can relieve the SDN controller’s load, and increasing the number of IDSs enhances attack detection chances in specific traffic flows. However, deploying IDS on all switches is impractical due to costs and delays. Our proposal involves strategically placing IDS chains across the data plane and directing flows through specific paths that include these IDS chains. This routing approach increases transmission delay compared to the shortest path. To mitigate this delay, we group incoming flows and route all flows within a group through the same path. A classifier categorizes traffic patterns upon entry into the network to assign the most suitable IDS chain. Grouping is based on the proximity of source and destination flows to the group’s centroid. The proposed approach organizes incoming flows by measuring the distance between their source and destination points relative to a central reference point. Flows sharing the same cluster ID are regarded as part of a cohesive cluster and are subjected to identical security protocols. Subsequently, each cluster of flows is allocated a dedicated sequence of IDSs. To direct packet flow within each group through the designated IDS chain, the controller establishes rules. The task of assigning each group to an appropriate IDS chain is known to be NP-hard, and to address this complexity, we propose a modified version of the k-means algorithm as an approximate solution.
Theorem 1.
The complexity of the flow grouping problem being NP-hard implies that the likelihood of discovering highly efficient algorithms to achieve optimal solutions is quite low.
Proof.
The overall strategy involves clustering flows and defining a set of rules applicable to each cluster. Flow categorization hinges on the proximity of source and destination hosts to the cluster’s centroid. Subsequently, the task is to allocate each cluster to an IDS chain, which can be likened to solving a matching problem. Following this, the controller configures flow rules that reroute packets from flows within each cluster through a predetermined sequence of IDSs within the assigned chain. The conventional K-means algorithm typically relies on assessing the distance between data points and their respective centroids. Nevertheless, in our specific problem, we encounter a distinct challenge that necessitates a different similarity metric than the standard K-means approach. We must devise a unique grouping strategy and similarity measurement. In our context, the data points represent flows with distinct source () and destination () attributes. To adapt the K-means clustering to our scenario, we apply it to pairs . The distance measurement employed is , where and denote the centroids of a cluster with center c. Here, we present formal definitions for flow grouping, distance measurement, and the process of matching IDS, inspired by the concepts introduced in [4].
Definition 1
(Grouping strategy and GroupFlow). Grouping strategy Δ partitions the incoming traffic flow based on the similarity of specific features, such as the same source or same destination. The total number of groups K is a predefined parameter. is the j-th group or j-th GroupFlow, including multiple flows with similar features. All flows in are routed through the same path and passed through some specific IDSs.
Definition 2
(Distance). The distance measurement is the summation of the distance of each source to the cluster centroid ’s source, and the distance of each destination to the cluster centroid ’s destination. Distance value is used to find the nearest cluster centroid for each GroupFlow [4].
Definition 3
(Matching GroupFlow with IDS Chain). For a specific GroupFlow , an IDS chain I is assigned by matching the centroid of that GroupFlow with the head of an IDS chain. The assignment is based on the weight of the link between the source of the cluster and the head or tail of the IDS chain [4].
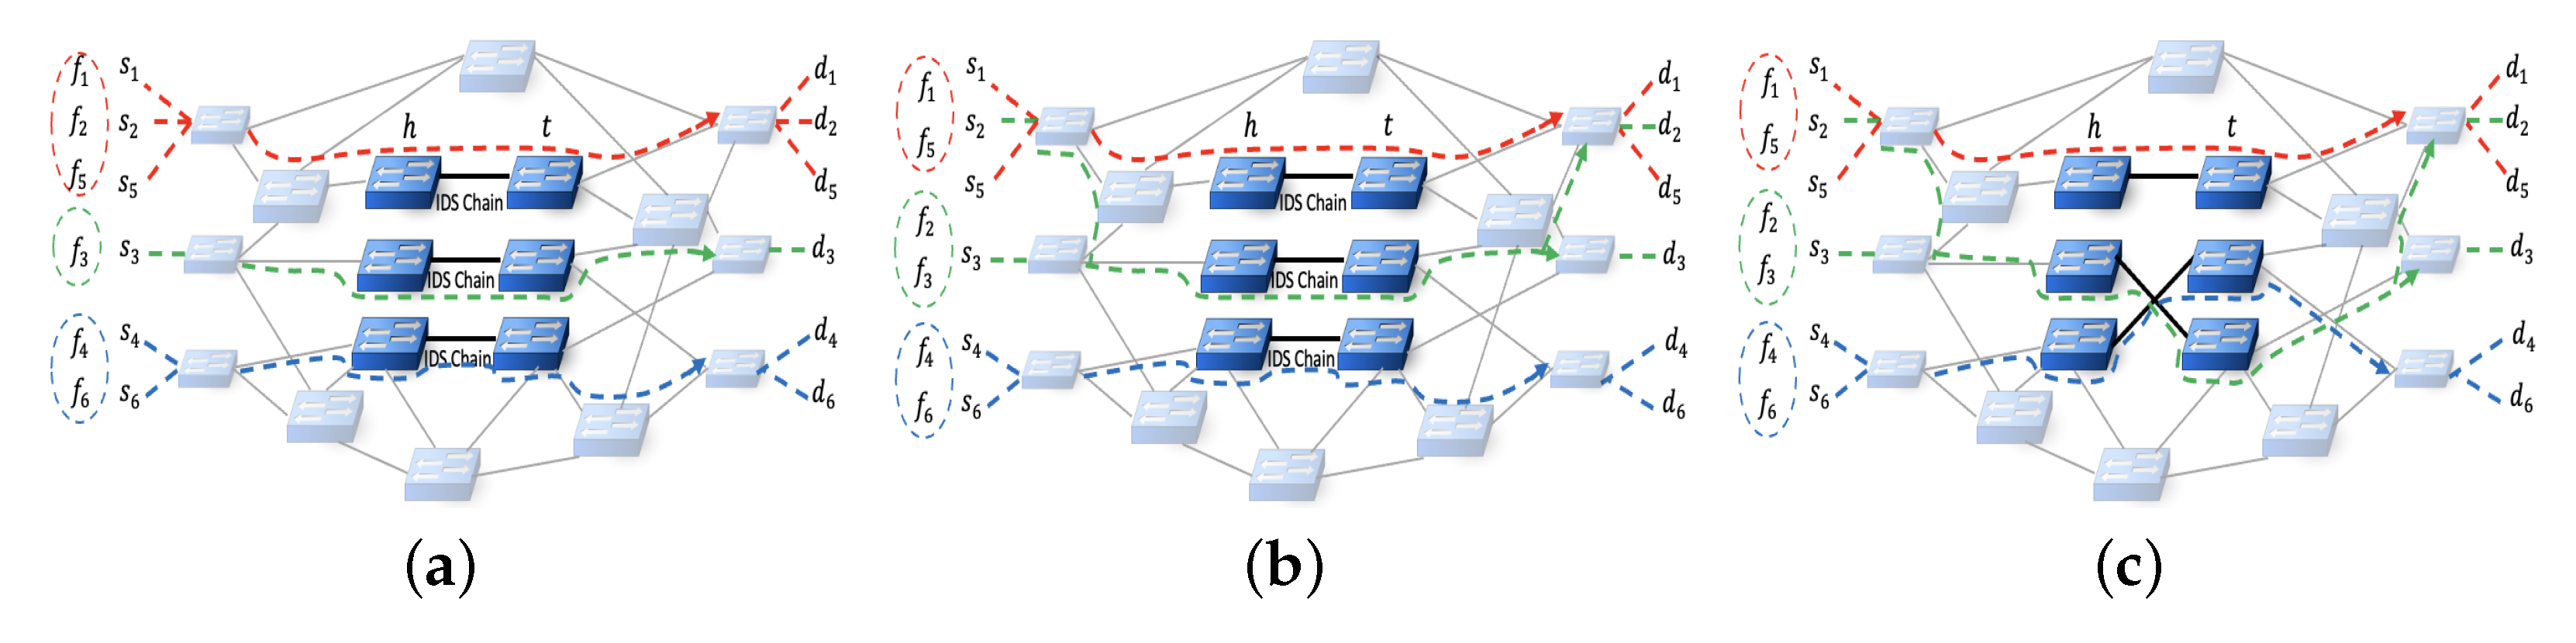
Figure 2 illustrates an example for three clusters and three IDS chains. h represents the head of the IDS chain, while t signifies the tail of this IDS chain. Figure 2a shows the shortest path method, which calculates the distance between sources and destinations of flows and initial centroids. We have the distance measurement , and flows would be divided into three clusters with centroids . The GroupFlows would be assigned to the IDS chain based on the shortest hop count. , , and are assigned to the first IDS chain based on the shortest path. is assigned to the second IDS chain. and are assigned to the third IDS chain. Figure 2b illustrates the balanced grouping method. After grouping the flows, groups will have different numbers of members. Balanced clustering aims to achieve an equitable distribution of data points within each cluster, ensuring an equal workload for each cluster. Our approach is different from common techniques. Instead of relying on the count of group members to assess balance, we determine balance by considering the total data rate of the groups. For this example, Figure 2a shows that the first cluster has three members, the second one has only one member, and the third one has two members. In order to create balance for the amount of processing on each IDS chain, we make a balance for the total amount of traffic in each group. The weight of a group can be defined as . For this example, we assume that the data rate of flow is the same; therefore, balancing would be based on the total number of members in each group. Figure 2b shows the balanced groups.
Utilizing a perfect matching algorithm, each balanced GroupFlow is assigned to a head and tail based on the shortest path, which encompasses the sum of hops from the source to the chain’s head, the hops between the head and tail, and the hops between the tail and the destination. In Figure 2c, you can observe the allocation of IDS chain heads and tails to the source and destination of the centroids. Every cluster K has a virtual center, comprising both the source and the destination . The matching process involves connecting to and associating with , where and correspond to the head and tail of two distinct IDS chains. This arrangement results in interconnections between IDS chains. In the real test bed, we consider network delay, which is based on the number of hops and congestion on links. Table 2 shows the hop counts and the assigned IDS chain for each method.
We summarize the steps of the proposed approach as follows:
- Perform clustering for the pair using a distance metric defined as the sum of distances from to the center and from to the center within a cluster with its central point at . The distance between each host and the cluster center is computed as the cumulative number of hops.
- Find balanced GroupFlows based on the amount of traffic for each group.
- Employ the standard perfect matching technique to establish pairs between cluster centers and IDS chain configurations. Note that the connections between IDS chain heads and tails are not fixed and can be reconfigured as needed.
The process of grouping flows is achieved by employing a modified variant of the K-means clustering technique. In Algorithms 1 and 2, the procedures for grouping incoming traffic into K clusters, creating balanced groups, and then matching the GroupFlows to the IDS chains are delineated. The initial step involves the random initialization of K cluster centroids. Subsequently, in the second step, the distances between each pair and the centroid are computed, and flows are assigned to their respective clusters based on these distances. Once all the flows have been clustered, the centroids are updated by identifying new centroids in a way that minimizes the sum of the shortest path distances from all flows in the cluster j to the new centroid. This iterative process continues until it reaches a stable state. When using any clustering method, it is important to ensure that the algorithm is converging in a meaningful way. To answer this question, we need to define a related optimization problem and make the concept of convergence more precise as per the reference [41]. Convergence in this context means that the algorithm has successfully completed the clustering or grouping of data points into K clusters. The algorithm will be deemed to have correctly grouped the data points if the difference in the values of the last two iterations is less than a specified threshold. The classical K-means algorithm is designed for the Euclidean distance, which is known to satisfy the triangle inequality as per reference [42].
| Algorithm 1 Balanced flow grouping. |
|
| Algorithm 2 Perfect minimum bipartite matching. |
|
In order to avoid redundant distance calculations, it is necessary to use triangle inequality in order to determine the bounds. Since most distance calculations using standard k-means are redundant, the optimized algorithm uses a more efficient calculation method. The distance between a point and a center does not need to be calculated in order to determine that the point should not be assigned to that center if it is far from the center. It is not necessary to calculate the exact distance to determine that a point should be assigned to the first center if a point is substantially closer to it than to any other [43,44].
In order to have balanced GroupFlows, there is some transferring of flows between GroupFlows, resulting in an even number of flows in each group. Eventually, there would be an equal number of flows in each GroupFlow. In the experiment section, we consider the number of flows and traffic rate for balancing groups. The perfect matching method is performed based on the hop count between the GroupFlows and the heads and tails of the IDS chains. There is not any fixed connection between heads and tails. Perfect matching makes some cross-connection between heads and tails based on finding the best chain for GroupFlows. This algorithm returns a list of balanced groups and their matched IDS chain.
This problem is NP-hard. To address it, we take an approach that relies on an approximation technique involving the reconfiguration of incoming flows using a modified version of the K-means clustering algorithm. We formulate the problem of grouping incoming traffic as an optimization problem with the primary aim of reducing overhead or minimizing costs. This issue is divided into two sub-problems: one involving the grouping of incoming traffic, and the other focused on IDS assignment. They can be formulated as follows.
The first objective is to group incoming traffic in a balanced manner to reduce transmission delay. Factors that should be considered when determining the appropriate grouping include the distance of flows to the cluster’s centroid and the total amount of traffic flows in each cluster:
Here, represents the cost of clustering incoming traffic. This cost represents the overhead of the controller due to the additional work required for grouping the incoming traffic. The cost is based on the total number of traffic flows and total traffic rate in each cluster . For the purpose of simplification, we can assume that the value of is equal to 1 in our calculations.
Problem 2. The secondary goal is to allocate an IDS chain to each GroupFlow in a manner that reduces the overall count of malicious packets while guaranteeing that all traffic passes through an IDS chain prior to reaching its final destination. Given that the positions of IDS chains are pre-established, the problem can be formulated as follows:
Here, we evaluate the cost associated with assigning a GroupFlow to an IDS chain , denoted as . This cost is determined by considering the cumulative traffic rate of each GroupFlow and the distance between the GroupFlow’s centroid and the IDS chain. The traffic rate of the j-th GroupFlow is represented as , and the data rate of a flow f is denoted as . The distance between the IDS chain I and the GroupFlow is quantified as , which signifies the number of hops between the cluster’s head and . The matrix is employed to indicate the assignment of each GroupFlow to a specific IDS chain .
Theorem 2.
The proposed approach is a 3-approximation algorithm [45] for flows with different sources to different destinations in a network with some IDS chains.
Proof.
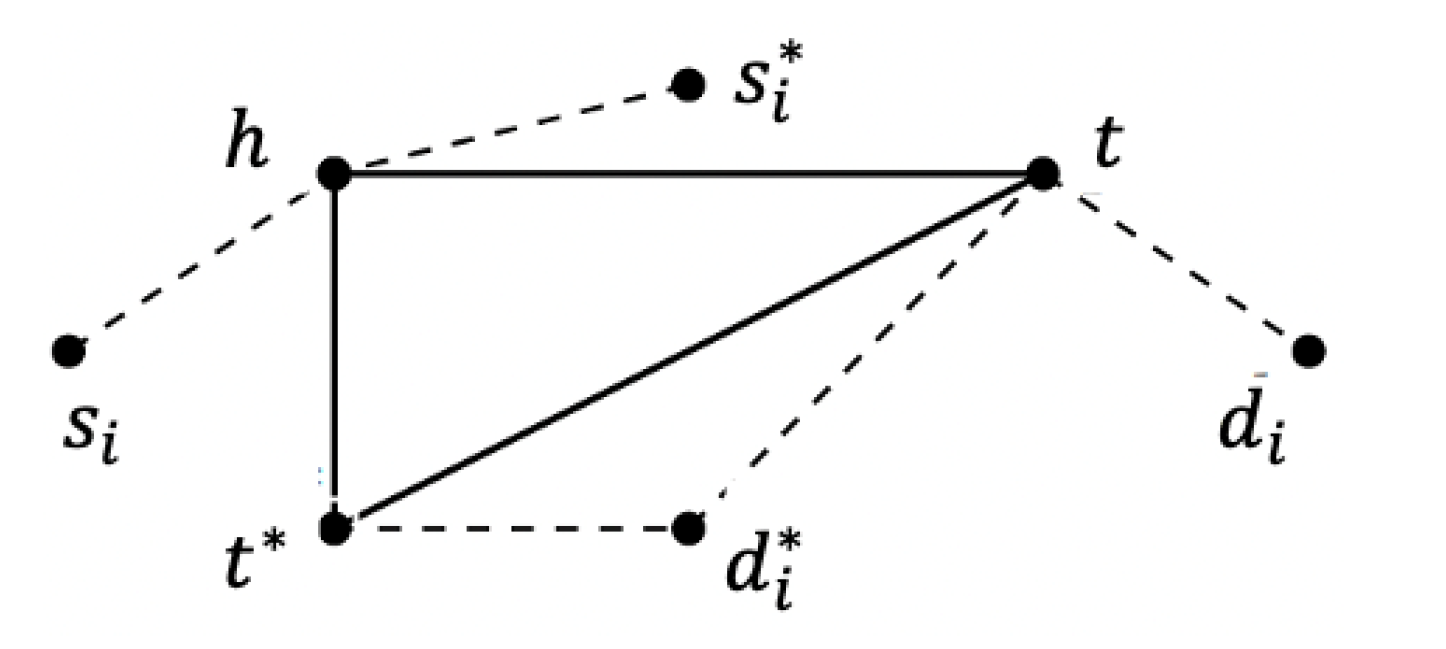
The calculation of the 3-approximation ratio is based on the triangle inequality and the optimality of each matching stage. For each head node , there is a corresponding tail node , which is assigned in the first round of approach. In addition, the pair is matched to a group of flows with source and destination in the second round of the approach. We assume that in the optimal solution, the node h should be paired with node , and the pair should be balanced by the GroupFlow whose source and destination are and , respectively. The relation among these nodes is shown in Figure 3 and Figure 4, which is a geometric graph. The total distance generated by our algorithm is , and the optimal value is . □
Based on the triangle inequality theorem, it can be deduced that and for each . Based on the optimality of the first round of matching, it can be inferred that . Furthermore, the optimality of the second round of matching ensures that:
Combining these inequity relationships:
Therefore,
5. Evaluation
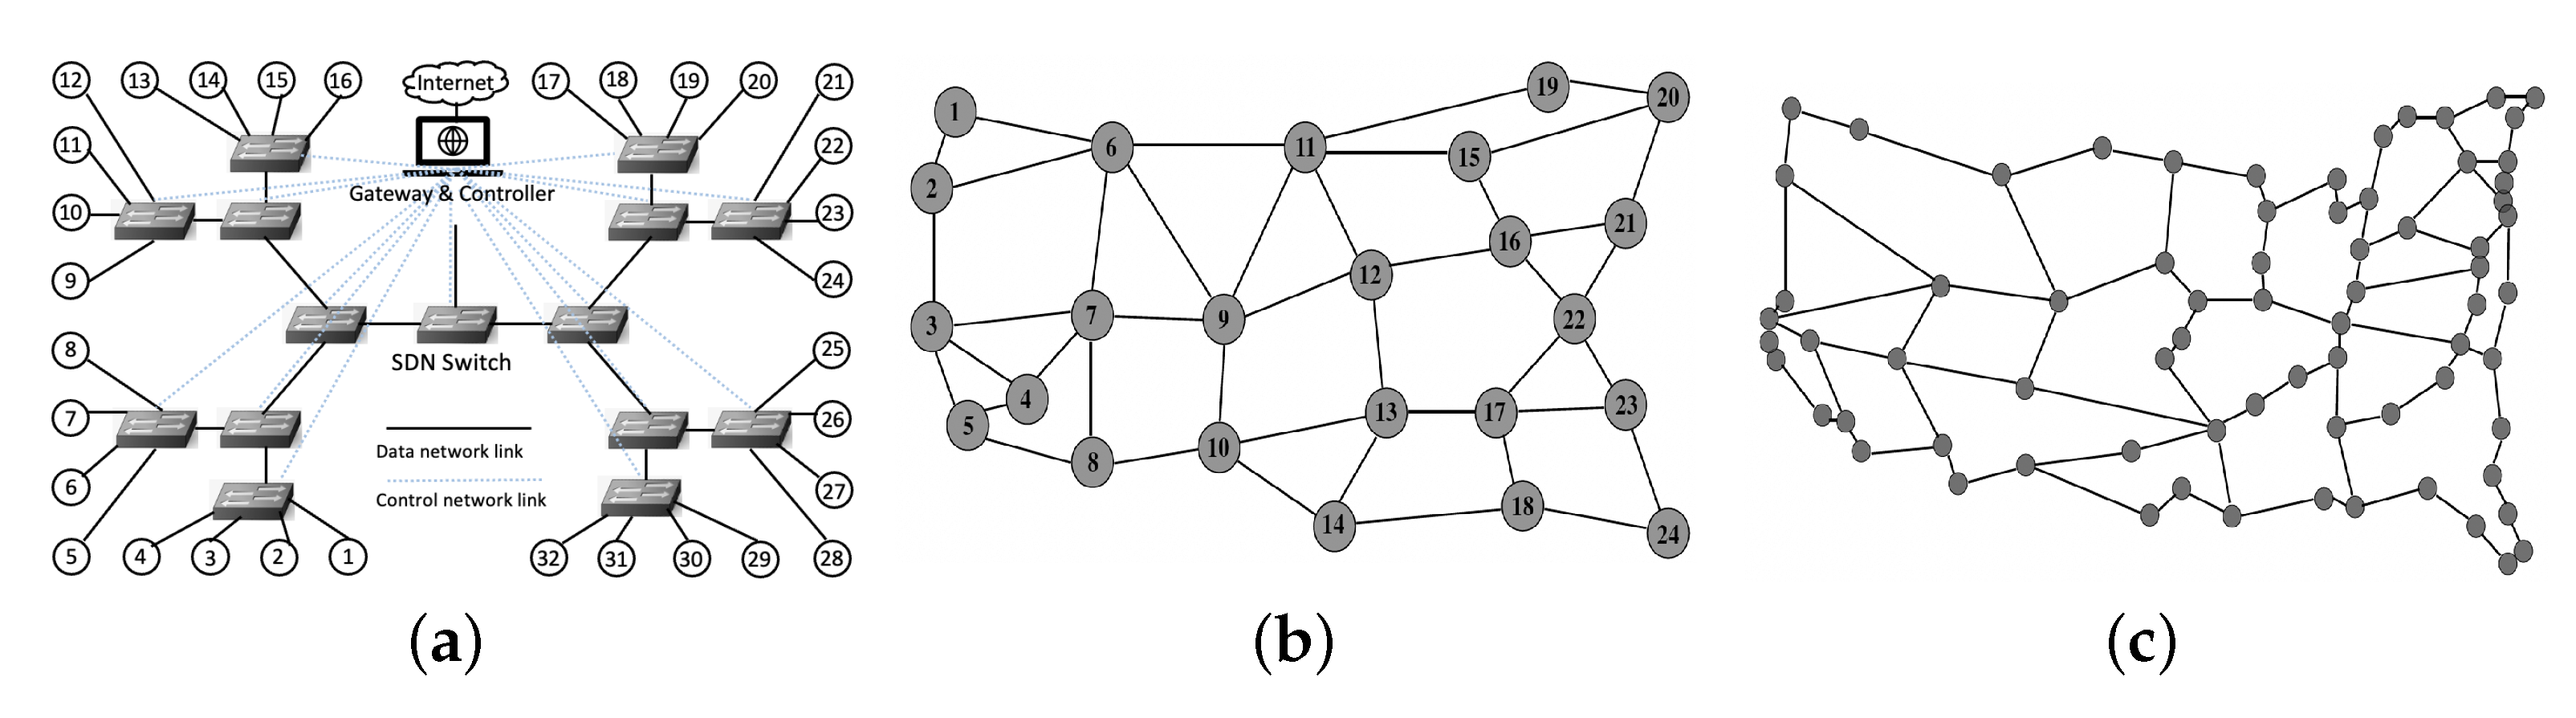
In order to validate our proposed method, we conduct real-world experiments on our test bed network. This network includes gateway nodes, SDN switches, and servers that serve as sources and destinations. The topology of the network is arranged in a perfect tree with four layers. The network is equipped with 32 servers, 15 SDN switches, and some regular L2 switches. The structure of the data center is illustrated in Figure 5a. The servers, except for the gateway, are equipped with dual-core processors running at 2.4 GHz, 4 GB of RAM, and a 500 GB hard disk drive [46]. The topology is arranged in a three-level complete binary tree. Each server is equipped with at least two-gigabit Ethernet ports. The dotted lines in the star topology in Figure 5a indicate the control network. Our setup includes a control network and a data network. The control network connects all management ports of the SDN switches (Pica8 p-3922) and the SDN controller through an L2 switch. The SDN switches are configured as out-of-band controllers, which separate the control and data planes. There are two types of SDN switches: the root switch and the leaf switch, for the gateway. There is a connection between the gateway and the root SDN switch, and there is a connection between the servers and the leaf SDN switch.
The controller used in our experiment is a Dell 3248 PowerEdge server running the ONOS software [47]. We installed some default applications over ONOS and one customized application which we named CustomRouting. Default applications include LLDP Link Provider, Host Location Provider, OpenFlow Provider Suite, OpenFlow Base Provider, and FWD. In the CustomRouting application, there is an input text file that allows us to set paths between any source and destination using the index of the switch, input port, and output port for each switch. The index of switches is associated with the ID of each switch in the network. Additionally, there are time parameters in the input file for the start of installing customized rules and the time of changing the rule to the new one. By running ONOS, the customized rules will be installed on the switches, and traffic will be directed through the customized path, including the IDS chain.
For simulation purposes, we evaluate the performance of our approach over 75-node CORONET and 24-node USNET network topologies as shown in Figure 5b,c, respectively. For the test bed, the performance measurement is the network delay, based on hops and link congestion, whereas in the simulation, the performance measurement is hop counts.
In our network, IDSs are installed on servers associated with each switch. The controller is aware of the links, their utilization, and the SDN switches, allowing for a global perspective of the network. After configuring the network and flow settings, we analyze the results from various perspectives to provide insight into the performance of the proposed algorithm. To demonstrate its feasibility and efficiency, we conduct experiments on a real test bed using Snortas the IDS. Legitimate traffic is generated using the Ostinatotraffic generator in normal and burst modes, while malicious traffic is generated using Kali Linux. Deploying IDSs into the network leads to an increase in transmission delay as packets are redirected to the server for detection before being sent back to the network to continue their path. There is also constant background traffic between all servers, with 64-byte packets and randomly selected sources and destinations.
In the original paper [4], it is evident that deploying more IDSs enhances detection rates. Multiple IDSs can introduce slightly higher delays due to using alternative paths, but this delay is not significant. Higher attack rates boost detection rates and reduce missed detections, as more samples improve detection probability. Surprisingly, attack rates have little impact on dropping rates, mainly influenced by switch capacity rather than attack ratios. Increased attack rates lead to higher delays, as switches need to alert the controller before taking action. Consequently, with more attack samples, detection rates, missed detection rates, and dropping rates all rise. In this study, we evaluate our approach using measurements of network delay in the real test bed and the number of hops in the simulation.
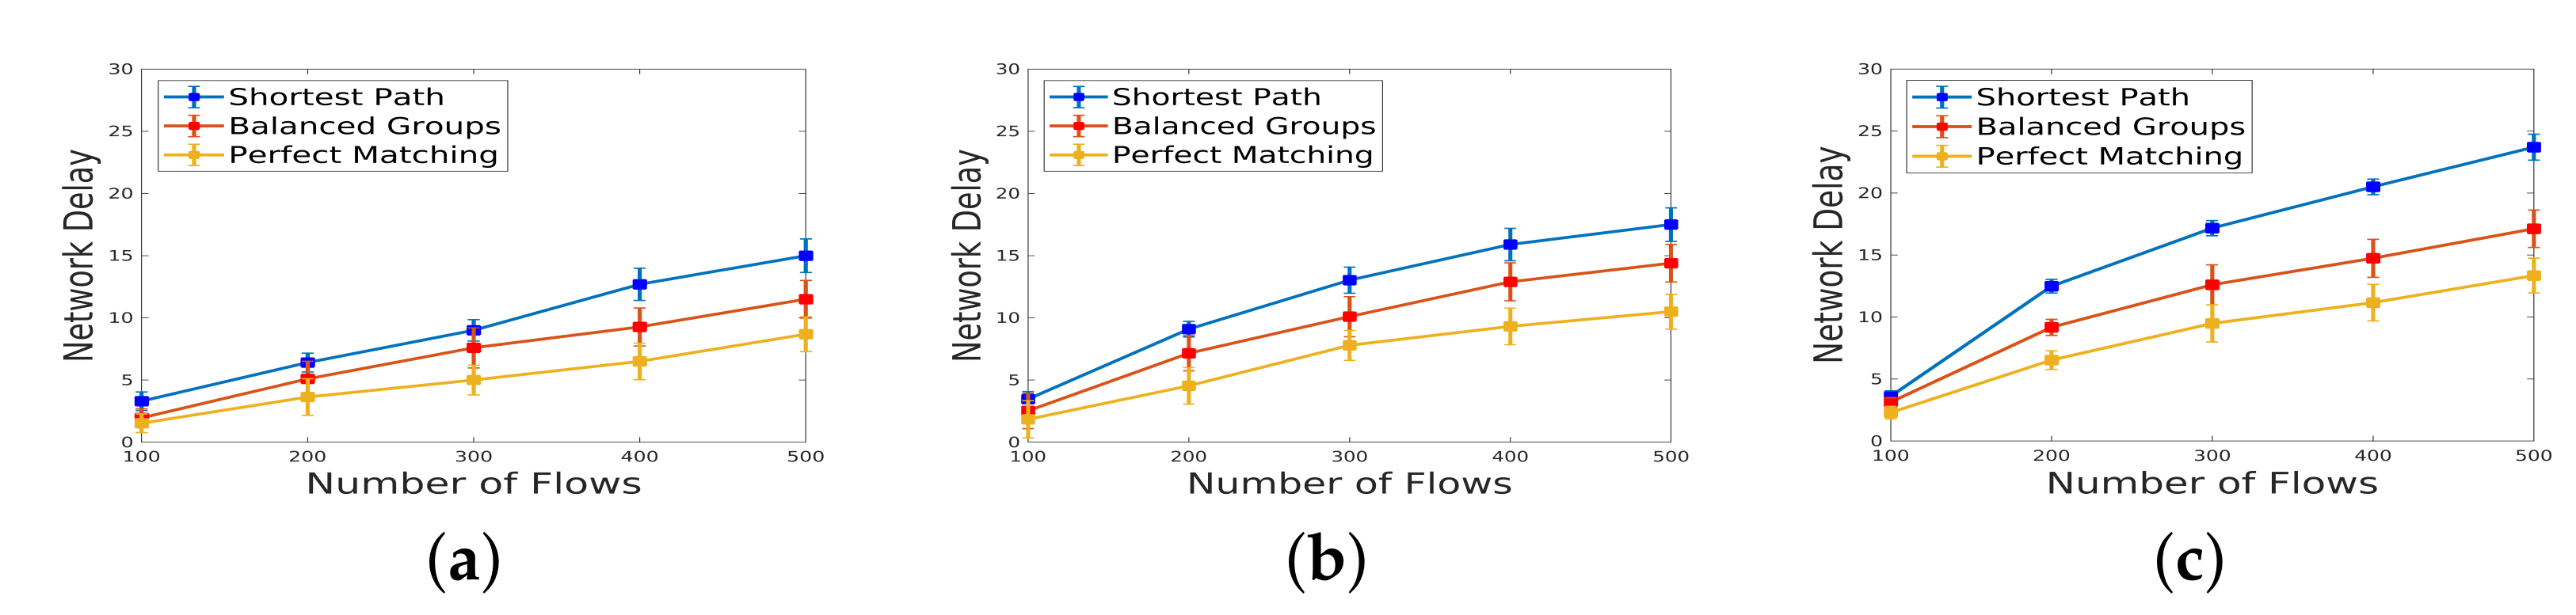
5.1. Network Delay under Different Scale of Incoming Traffic
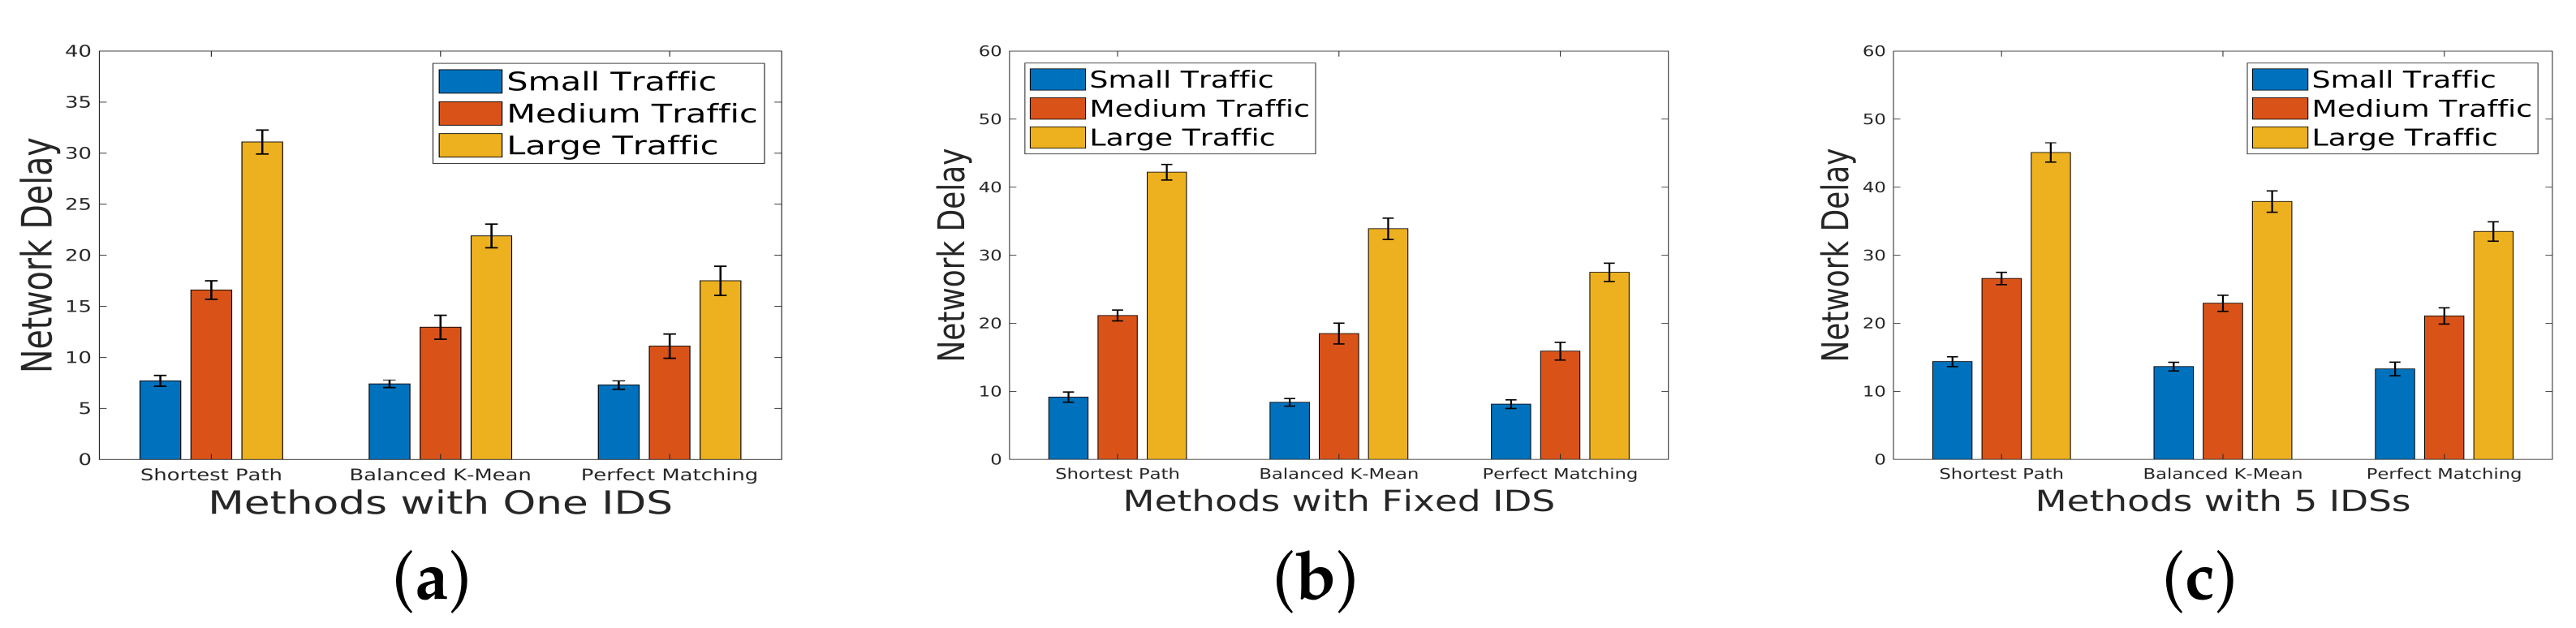
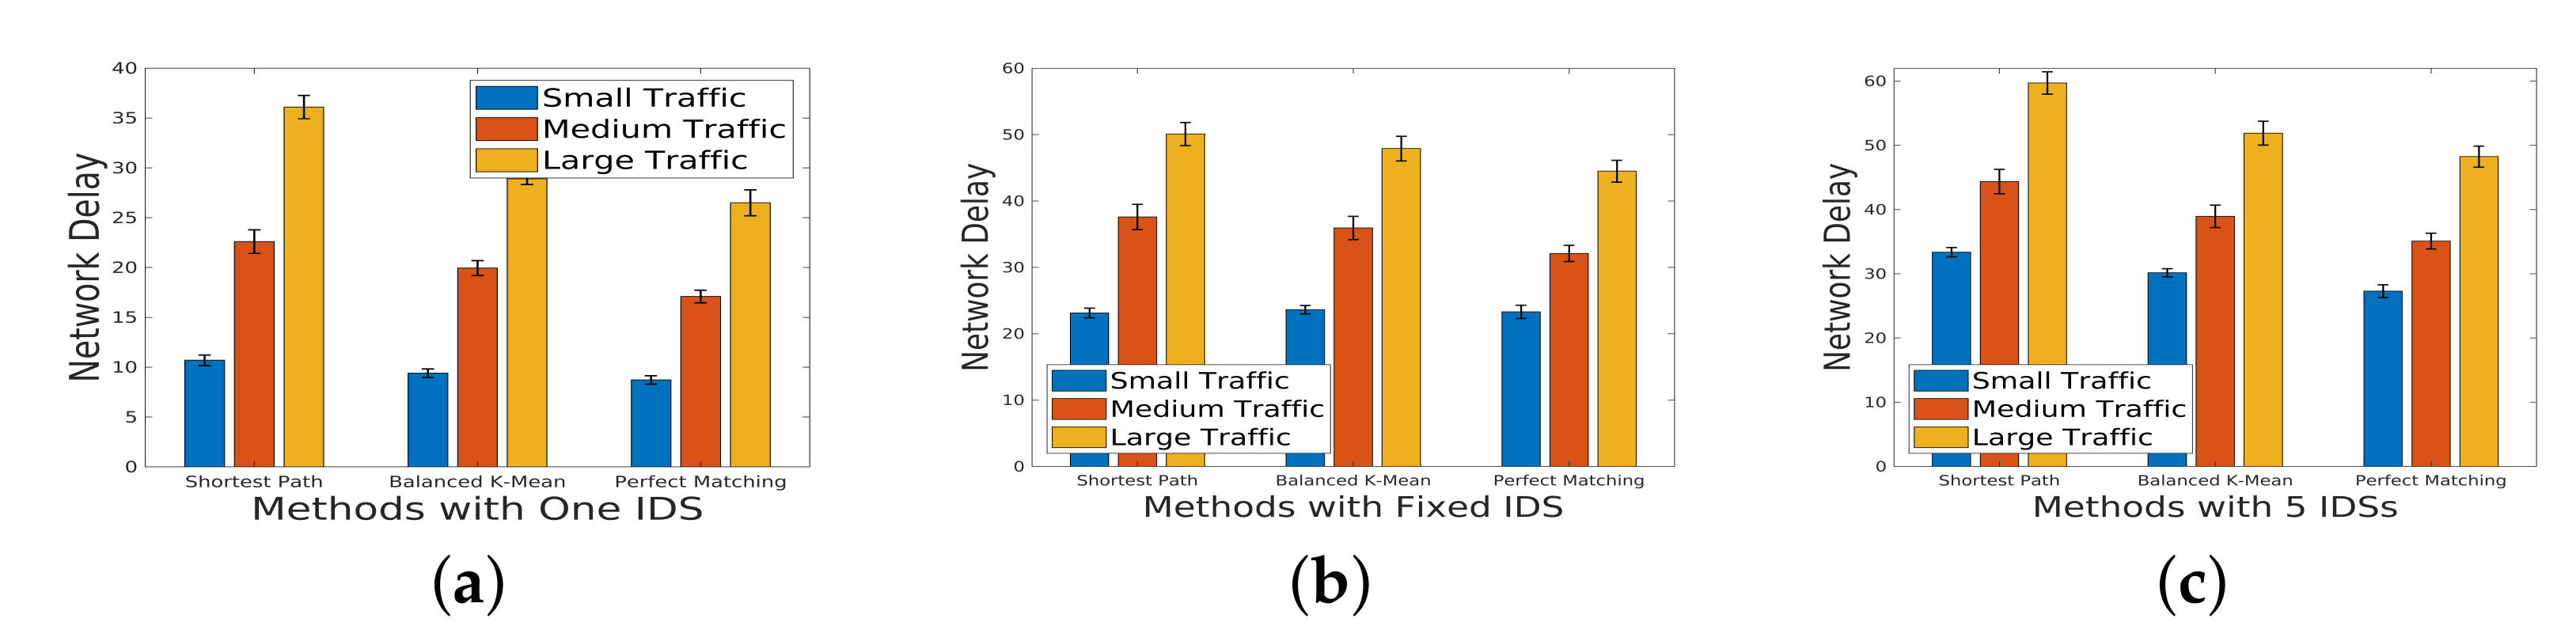
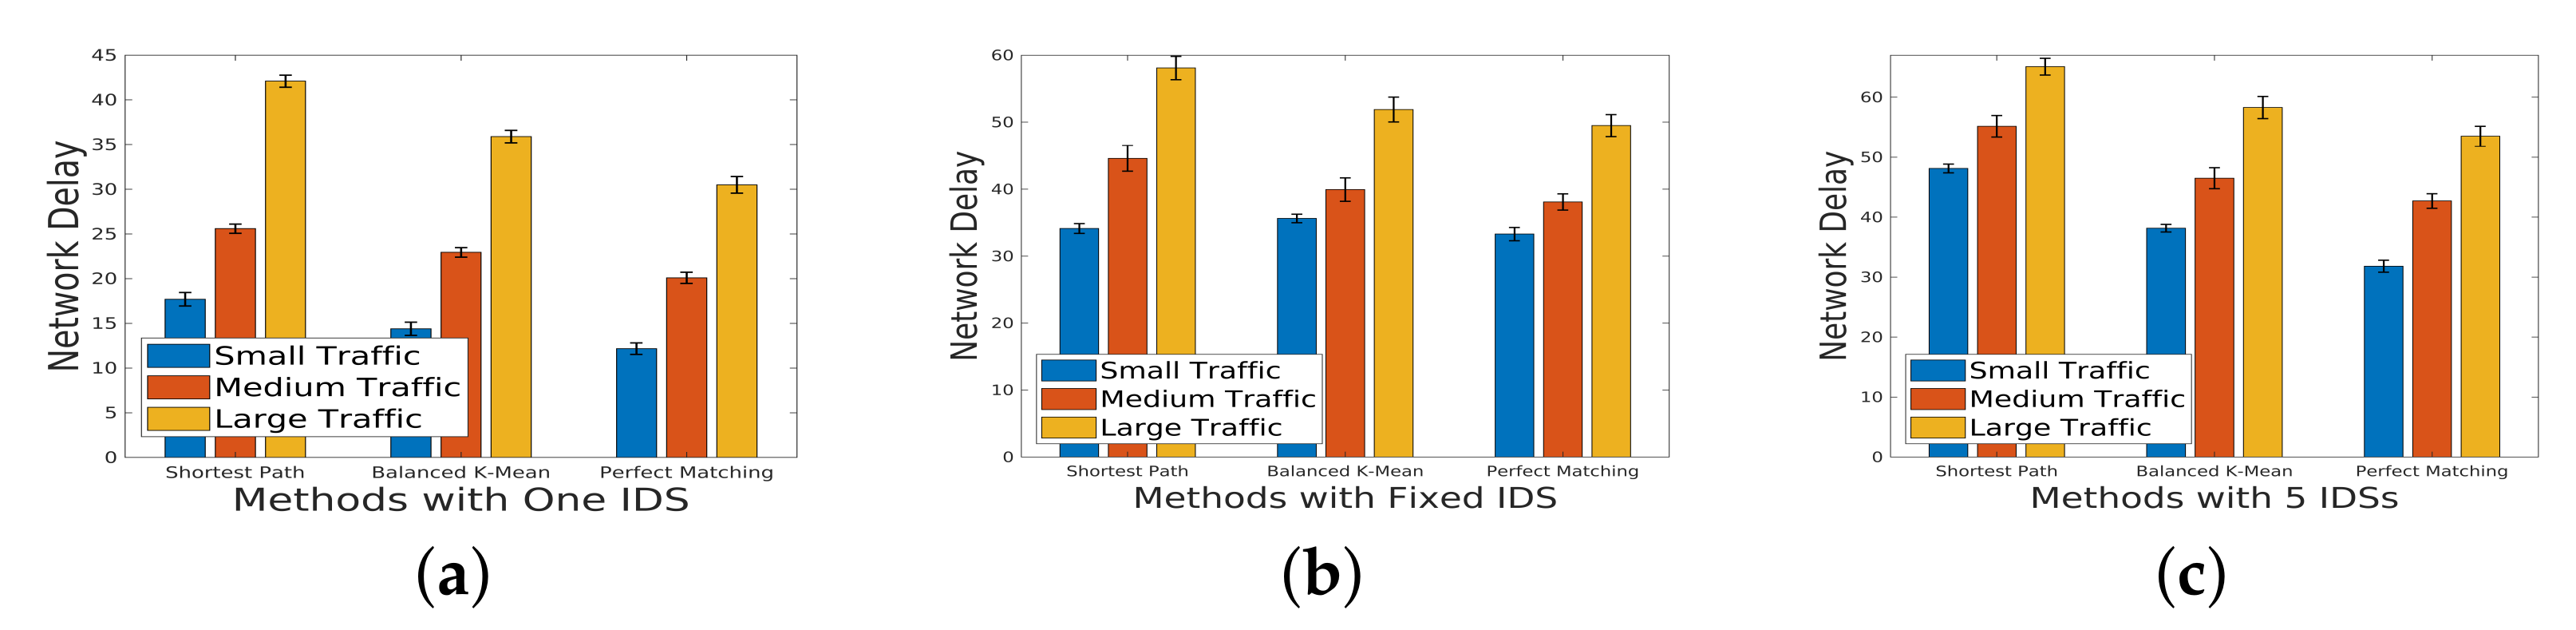
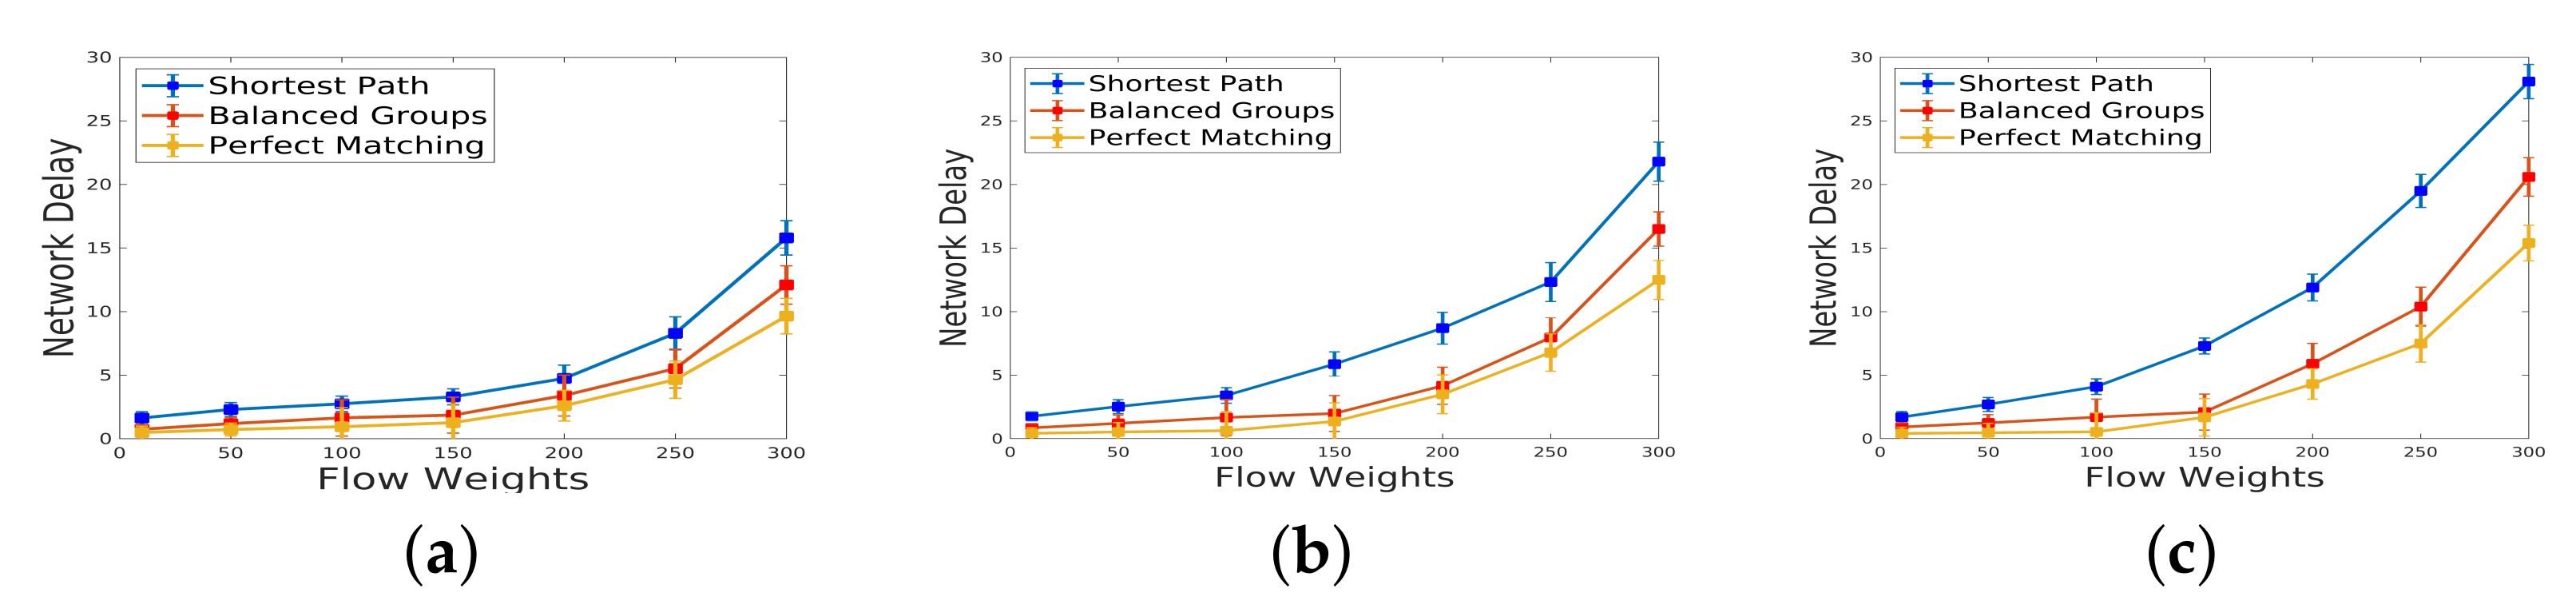
In this analysis, we delve into the impact of incoming traffic scale on network delay. Our investigation encompasses three distinct scales of incoming traffic—small, medium, and large—classified based on the production of the number of flows and the weight assigned to each flow. The traffic scenarios are categorized into three sizes: small (500 flows), medium (2000 flows), and large (4000 flows). These scenarios are tailored for different network topologies, each characterized by unique sparsity levels. Sparsity, defined as the ratio of the number of direct connections between servers to the total number of possible direct connections, is a crucial parameter influencing network behavior. Figure 6, Figure 7 and Figure 8 serve as visual representations of the network delay under varying scales of incoming traffic and different sparsity. For our experiments, we consider three specific scenarios:
- One IDS in the Chain: A single intrusion detection system (IDS) integrated into the service chain.
- Three Fixed IDSs in the Chain: Three fixed IDSs strategically placed within the service chain.
- Five IDSs in the Chain: A more extensive deployment with five IDSs integrated into the service chain.
Figure 6 (sparsity ): The results reveal that even for a large scale of traffic, perfect matching mitigates network delay. However, despite the potential for a higher detection rate with a longer IDS chain, Figure 6c demonstrates an increase in network delay. This suggests a trade-off between detection efficiency and network performance. Figure 7 (sparsity ): Similar trends are observed for a topology with increased sparsity. The impact of sparsity on network delay is apparent, and the trade-off between detection capabilities and network efficiency persists. Figure 8 (sparsity ): In a topology with higher sparsity, the network delay is notably higher compared to a topology with lower sparsity (). This emphasizes the influence of network topology on delay, with denser connections resulting in improved performance.
These findings underscore the intricate relationship between the incoming traffic scale, IDS deployment strategy, and network delay across diverse sparsity levels. The trade-offs revealed in the experiments provide valuable insights for optimizing network configurations based on specific traffic characteristics and security requirements.
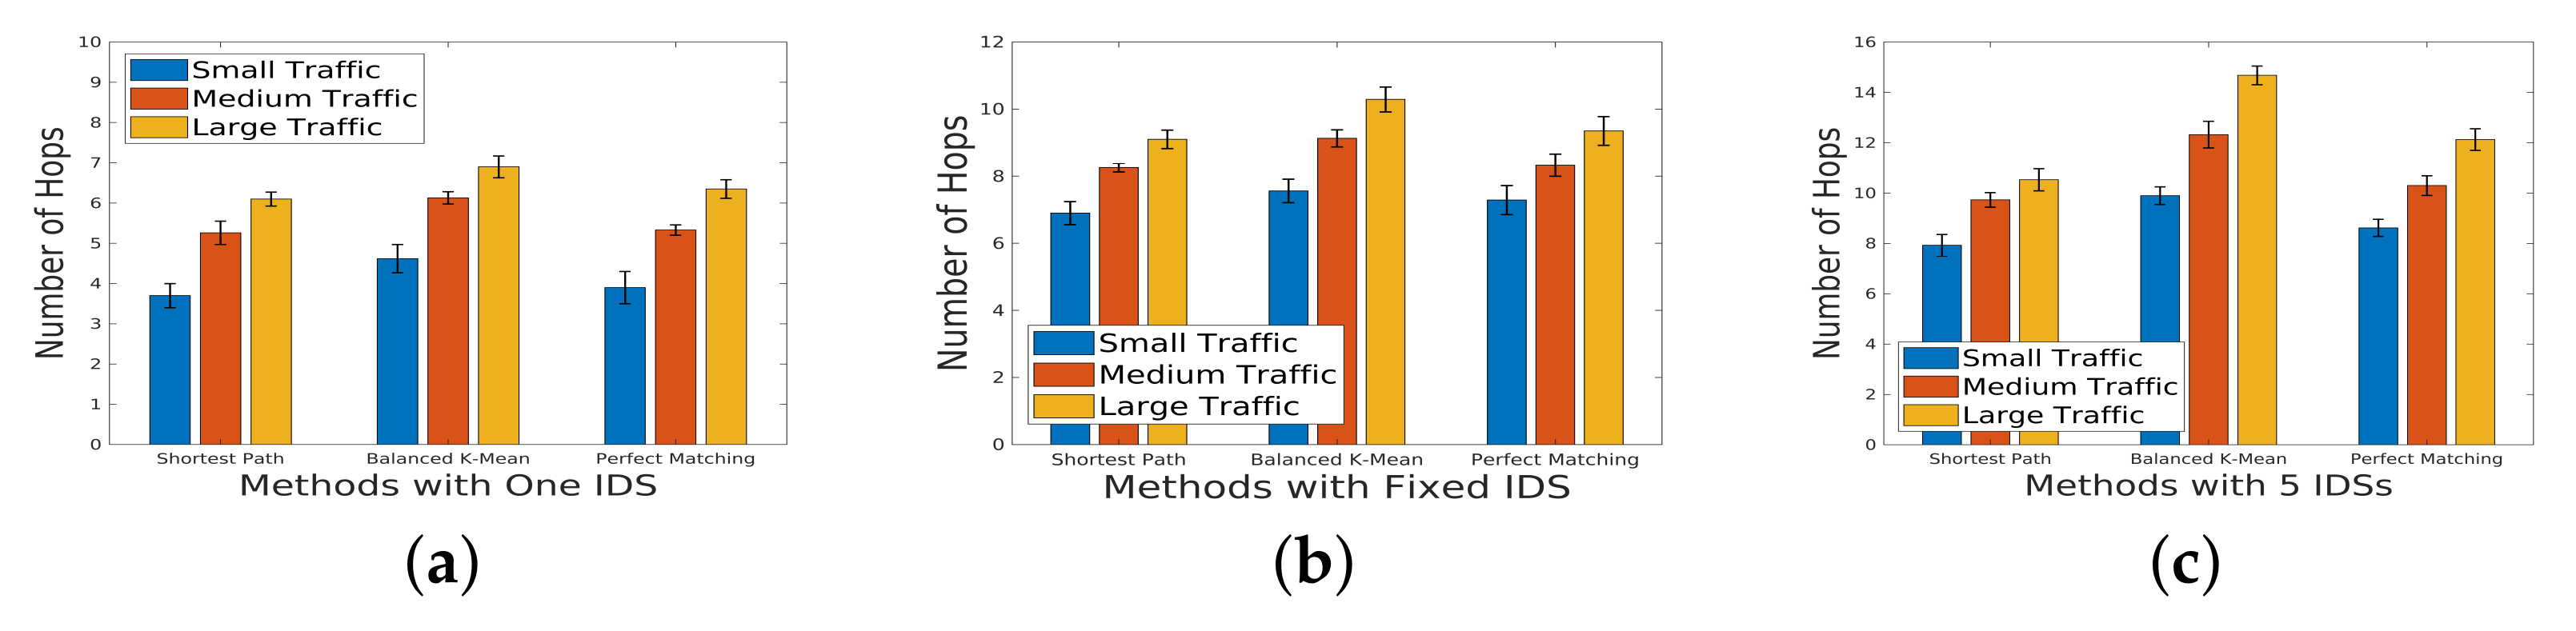
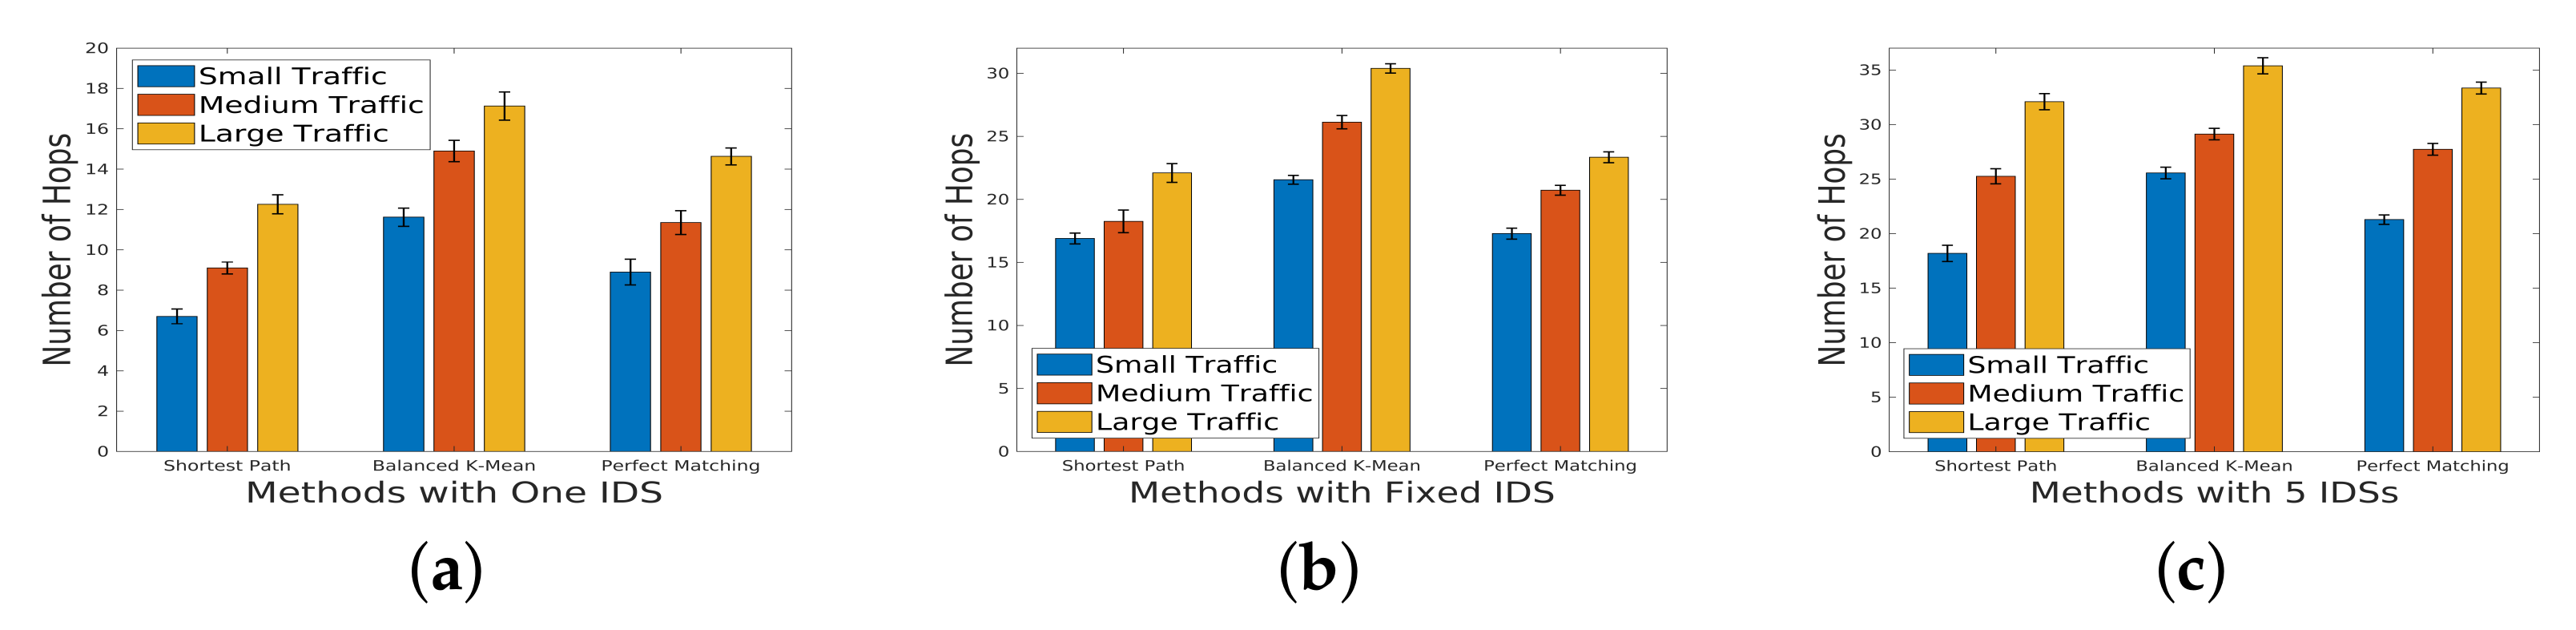
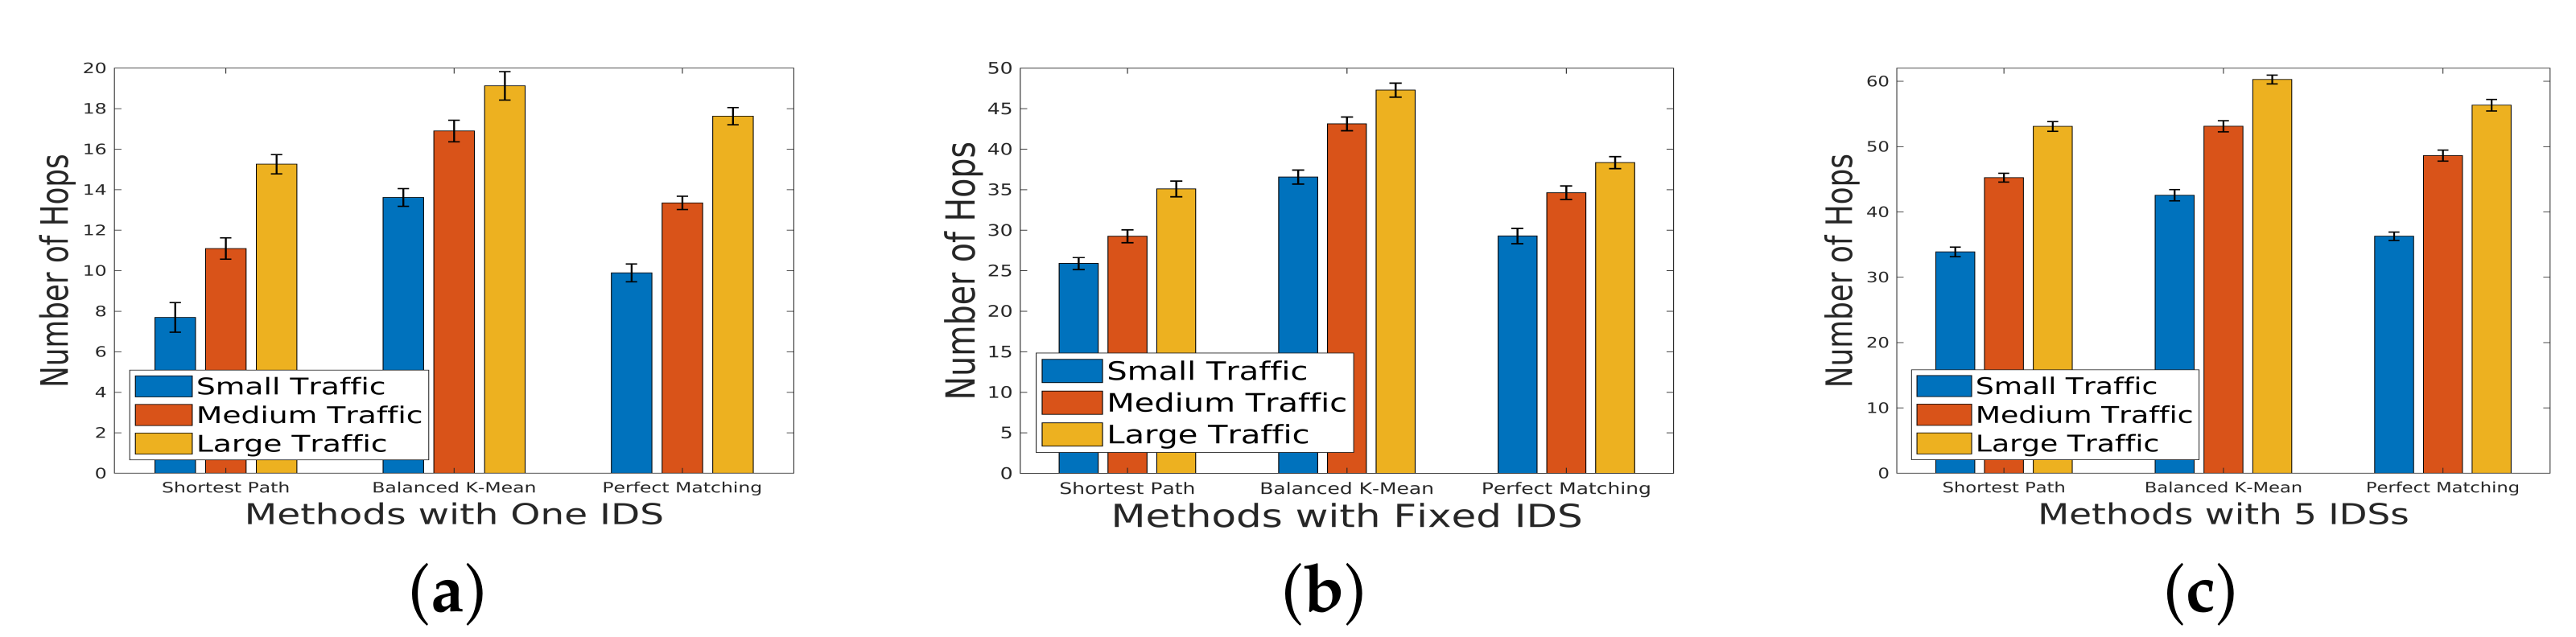
5.2. Number of Hops under Different Scales of Incoming Traffic
In the investigation of the number of hops under varying scales of incoming traffic, Figure 9 serves as a visual representation of the measurements. The results for the topology with a sparsity of highlight a notable contrast between the perfect matching and the balanced group method. Specifically, perfect matching demonstrates a smaller number of hops in comparison to the balanced group method. Expanding our analysis to different network scenarios, Figure 10 and Figure 11 present the results for networks with sparsity levels of and , respectively. In the case of the sparse network with sparsity, there is a substantial difference in the number of hops between the perfect matching and balanced methods. This discrepancy underscores the impact of network topology on the efficiency of these routing strategies. As the number of flows increases, the IDSs integrated into the service chain experience a heightened load. In response to this increased load, there arises a necessity for load balancing, resulting in an augmented number of hops. This phenomenon is particularly evident in the perfect matching method, where the load balancing is not as inherently managed as in the balanced group method. The escalation in the number of hops contributes to an increased delay in both the detection process and overall data transmission.
This analysis sheds light on the intricate relationship between the traffic scale, IDS deployment strategies, and network efficiency in terms of the number of hops. The observed trends emphasize the importance of considering both the network topology and load-balancing mechanisms for optimizing the performance of service chains under diverse traffic scenarios.
5.3. Network Delay under Varying Weights and Varying Number of Flows
The findings reported in [4] emphasize the crucial role of incoming traffic volume as a key metric in evaluating the efficacy of IDS deployment within the data plane. Additionally, the quantity of IDSs within each chain is highlighted as a significant factor influencing all recorded metrics. To delve further into these dynamics, we conducted experiments to explore the impact of both the weight of flows and the number of flows in incoming traffic on network delay. In Figure 12, the network delay is depicted when there is a fixed amount of incoming traffic and a varying weight, ranging from 10 to 300. The results, considering the flow numbers of 100, 300, and 500, indicate that a higher rate of traffic correlates with an increase in network delay. This observation underscores the direct relationship between traffic volume and delay, with larger flow rates contributing to heightened delays in network transmission and processing.
According to Figure 13, the network delay is illustrated for varying amounts of incoming traffic, ranging from 100 to 500, while maintaining fixed flow weights of 100, 200, and 300. Notably, the results reveal that, although a larger volume of incoming traffic does lead to an increase in network delay, the impact of the weight of flows surpasses that of the traffic volume. This suggests that the characteristics of individual flows, as represented by their weights, exert a more pronounced influence on network delay than the overall volume of traffic. As a result, optimizing the weight assignment for flows emerges as a critical consideration for mitigating network delays. These experiments contribute valuable insights into the nuanced interplay between traffic characteristics and network delay, shedding light on factors that can be strategically managed to enhance the overall efficiency of IDS deployment within the SDN data plane.
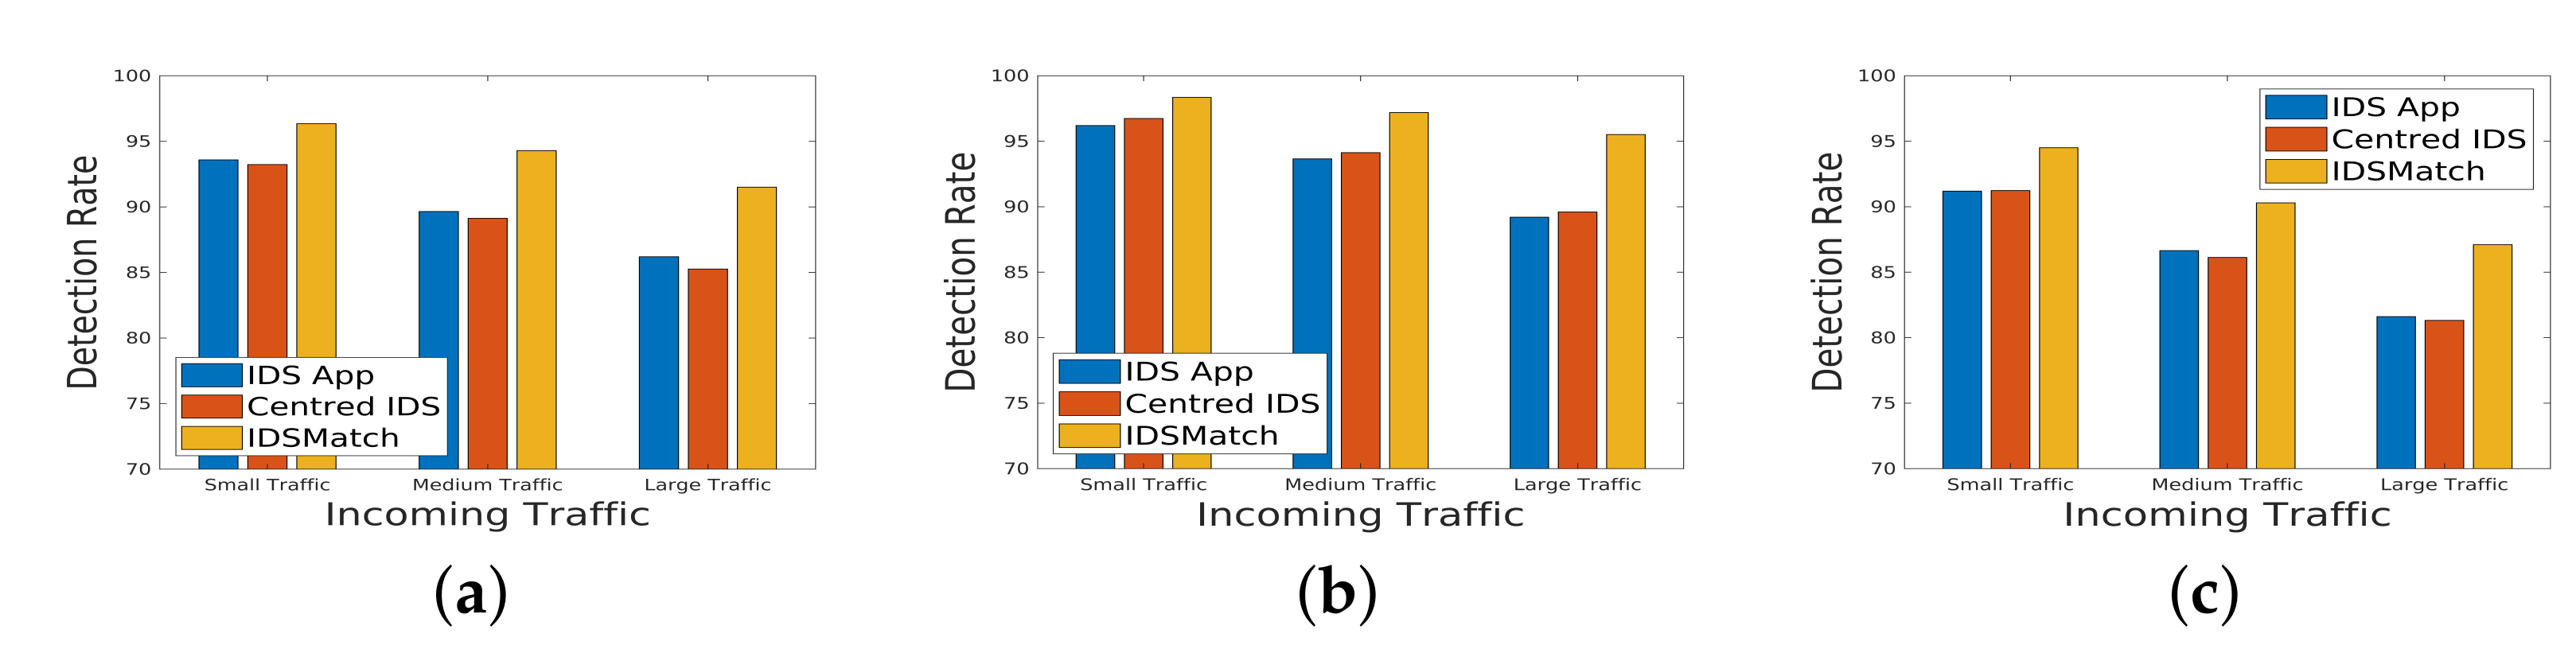
5.4. Detection Rate under Varying Topology
In Figure 14, the detection rate of the IDS is visually presented, showcasing the performance under various deployment methods. The three deployment strategies examined are as follows:
- Centered IDS: This method involves placing an IDS in the SDN architecture. The NIDS monitors all switches and subsequently sends a comprehensive security report to the SDN controller.
- IDS App: In this scenario, an IDS application is integrated into the control plane of the SDN. Collaborating with other monitoring applications, it analyzes network traffic and assists the controller in establishing appropriate rules on switches for enhanced security.
- IDSMatch: This represents the proposed method, which deploys a set of IDS chains on the data plane of the SDN. IDSMatch aims to optimize intrusion detection by strategically distributing IDSs in the data plane to efficiently analyze and mitigate potential security threats.
The results indicate that, under different topologies and even in the case of a large-scale traffic scenario, IDSMatch outperforms other methods in terms of detection rate. This superior performance underscores the effectiveness of strategically deploying IDS chains on the data plane, providing enhanced capabilities for identifying and mitigating security threats within the SDN environment. These findings contribute valuable insights for selecting an optimal intrusion detection deployment strategy tailored to specific network requirements.
5.5. The Ratios of Redundant Packet Inspection
With the proposed SDN-based IDS architecture, a crucial aspect we examined is the prevalence of redundant packet inspection across varying numbers of deployed IDSs. Redundant packet inspection refers to the scenario where network traffic traverses multiple IDSs in a chain, leading to duplicated efforts in packet analysis. We conducted a series of simulations to quantify the ratios of redundant packet inspection under different configurations, considering both the fixed and dynamically adjusted numbers of IDSs within the detection chain. The goal is to discern how the system’s capacity limitations on individual IDS units may contribute to an increase in redundant inspections, particularly in situations of high network flow.
To present our simulation results, we have compiled Table 3, detailing the impact of redundant packet inspection across different scenarios. The table includes the number of deployed IDSs in each chain, the corresponding volume of network traffic, and the resultant ratios of redundant packet inspection. This analysis aims to provide insights into the trade-offs between increased accuracy through multiple IDS layers and the associated costs in terms of redundant packet inspection, aiding in the optimization of the proposed SDN-based IDS architecture for real-world deployment. The table below summarizes the key findings:
Table 3 contains the calculated ratios of redundant packet inspection for each combination of IDSs and traffic volumes. The ratio reflects the proportion of packets that undergo redundant inspection as they traverse multiple IDSs in the detection chain. These results highlight the dynamic nature of redundant packet inspection in relation to the IDS deployment strategy and network conditions, providing valuable insights for system optimization and resource allocation in SDN environments. For example, in the cell at the intersection of “6 IDSs” and “Moderate Traffic Volume,” the value of suggests that, under these conditions, approximately of the packets undergo redundant inspection.
5.6. Unbalancing Factor
In evaluating the assignment process of IDS chains within the SDN data plane, assessing the balancing factor becomes crucial after allocating the GroupFlow of the network. This factor serves as a metric to gauge the extent to which the data are balanced among the IDS chains, providing insights into the effectiveness of the assignment process. In this context, balance is achieved when there is an equitable distribution of traffic among the IDS chains, ensuring that each chain handles a comparable amount of data. Table 4 presents the balancing factor for three distinct methods: shortest path, balancing, and matching. The experiment is conducted on the topology depicted in Figure 5c, offering a practical scenario for assessing the balancing of IDS chains. A higher balancing factor indicates a more uneven distribution of traffic among the IDS chains.
These unbalancing factors shed light on the effectiveness of different assignment methods in achieving a balanced distribution of traffic among IDS chains. Analyzing these factors provides valuable insights into the robustness and efficiency of the IDS chain assignment process, facilitating informed decisions for optimizing network performance and security.
6. Conclusions
It is necessary to have a chain of IDSs on a large and busy network, as a single IDS may be susceptible to packet loss. Further, a centralized controller is responsible for handling all underlying network packets for security services, which results in significant overhead. As an alternative, security services can be deployed as network functions on switches within the data plane. By creating an approximation model, we propose a novel method of detecting attacks in the data plane. We developed a novel method for grouping incoming flows intuitively. Each group consists of a number of flows that are processed into an IDS chain. As a result of assigning flows to IDS chains, grouped flows are diverted on a longer path and processed by the assigned IDS chain. To evaluate our approach, we discussed several factors, including the detection rate, hop count, and delay time. Under different scenarios, the proposed approach meets these measurements. Future work will focus on grouping flows based on the common K links in their path to the destinations. The flows with the same K sub-path would be assigned to the same group.
Author Contributions
Conceptualization, N.N. and J.W.; methodology, N.N.; writing—original draft preparation, N.N.; review and editing, J.W.; supervision, J.W.; funding acquisition, J.W. All authors have read and agreed to the published version of the manuscript.
Funding
This research was funded by NSF grants CNS 2214940, CPS 2128378, CNS 2107014, CNS 2150152, CNS 1824440, and CNS 1828363.
Data Availability Statement
Derived data of this study are available from the corresponding author on request.
Conflicts of Interest
The authors declare no conflicts of interest.
References
- Cox, J.H.; Chung, J.; Donovan, S.; Ivey, J.; Clark, R.J.; Riley, G.; Owen, H.L. Advancing software-defined networks: A survey. IEEE Access 2017, 5, 25487–25526. [Google Scholar] [CrossRef]
- Hakiri, A.; Gokhale, A.; Berthou, P.; Schmidt, D.C.; Gayraud, T. Software-defined networking: Challenges and research opportunities for future internet. Comput. Netw. 2014, 75, 453–471. [Google Scholar] [CrossRef]
- Yoon, C.; Park, T.; Lee, S.; Kang, H.; Shin, S.; Zhang, Z. Enabling security functions with SDN: A feasibility study. Comput. Netw. 2015, 85, 19–35. [Google Scholar] [CrossRef]
- Niknami, N.; Wu, J. Enhancing Load Balancing by Intrusion Detection System Chain on SDN Data Plane. In Proceedings of the 2022 IEEE Conference on Communications and Network Security (CNS), Austin, TX, USA, 3–5 October 2022. [Google Scholar]
- Mostafavi, S.; Hakami, V.; Sanaei, M. Quality of service provisioning in network function virtualization: A survey. Computing 2021, 103, 917–991. [Google Scholar] [CrossRef]
- Khoshkholghi, M.A.; Mahmoodi, T. Edge intelligence for service function chain deployment in NFV-enabled networks. Comput. Netw. 2022, 219, 109451. [Google Scholar] [CrossRef]
- Jia, J.; Yang, L.; Cao, J. Reliability-aware dynamic service chain scheduling in 5g networks based on reinforcement learning. In Proceedings of the IEEE INFOCOM 2021-IEEE Conference on Computer Communications, Vancouver, BC, Canada, 10–13 May 2021; pp. 1–10. [Google Scholar]
- Phan, T.V.; Park, M. Efficient distributed denial-of-service attack defense in SDN-based cloud. IEEE Access 2019, 7, 18701–18714. [Google Scholar] [CrossRef]
- Luo, J.L.; Yu, S.Z.; Peng, S.J. SDN/NFV-based security service function tree for cloud. IEEE Access 2020, 8, 38538–38545. [Google Scholar] [CrossRef]
- Deng, S.; Li, M.; Guo, Q.; Zhou, H. Security SFC Path Selection Using Deep Reinforcement Learning. In Proceedings of the International Symposium on Mobile Internet Security, Jeju Island, Republic of Korea, 15–17 December 2022; Springer: Berlin/Heidelberg, Germany, 2022; pp. 97–107. [Google Scholar]
- Saeed, R.; Qureshi, S.; Farooq, M.U.; Zeeshan, M. SDN/NFV Enabled Security for an Enterprise Network using Commodity Hardware. In Proceedings of the IEEE International Conference on Computing, Electronics & Communications Engineering (iCCECE), Southend, UK, 17–18 August 2022; pp. 25–30. [Google Scholar]
- Tang, T.A.; Mhamdi, L.; McLernon, D.; Zaidi, S.A.R.; Ghogho, M. Deep recurrent neural network for intrusion detection in sdn-based networks. In Proceedings of the 4th IEEE Conference on Network Softwarization and Workshops (NetSoft), Montreal, QC, Canada, 25–29 June 2018; pp. 202–206. [Google Scholar]
- Shipulin, K. We need to talk about IDS signatures. Netw. Secur. 2018, 2018, 8–13. [Google Scholar] [CrossRef]
- Zwane, S.; Tarwireyi, P.; Adigun, M. Ensemble learning approach for flow-based intrusion detection system. In Proceedings of the 2019 IEEE AFRICON, Accra, Ghana, 25–27 September 2019; pp. 1–8. [Google Scholar]
- Sultana, N.; Chilamkurti, N.; Peng, W.; Alhadad, R. Survey on SDN based network intrusion detection system using machine learning approaches. Peer-Peer Netw. Appl. 2019, 12, 493–501. [Google Scholar] [CrossRef]
- Alzahrani, A.O.; Alenazi, M.J. Designing a network intrusion detection system based on machine learning for software defined networks. Future Internet 2021, 13, 111. [Google Scholar] [CrossRef]
- Muthamil Sudar, K.; Deepalakshmi, P. An intelligent flow-based and signature-based IDS for SDNs using ensemble feature selection and a multi-layer machine learning-based classifier. J. Intell. Fuzzy Syst. 2021, 40, 4237–4256. [Google Scholar] [CrossRef]
- Niknami, N.; Inkrott, E.; Wu, J. Towards Analysis of the Performance of IDSs in Software-Defined Networks. In Proceedings of the 19th IEEE International Conference on Mobile Ad Hoc and Smart Systems (MASS), Denver, CO, USA, 19–23 October 2022. [Google Scholar]
- Latah, M.; Toker, L. An efficient flow-based multi-level hybrid intrusion detection system for software-defined networks. CCF Trans. Netw. 2020, 3, 261–271. [Google Scholar] [CrossRef]
- Zhao, X.; Su, H.; Sun, Z. An Intrusion Detection System Based on Genetic Algorithm for Software-Defined Networks. Mathematics 2022, 10, 3941. [Google Scholar] [CrossRef]
- Cui, J.; Zhang, J.; He, J.; Zhong, H.; Lu, Y. DDoS detection and defense mechanism for SDN controllers with K-Means. In Proceedings of the IEEE/ACM 13th International Conference on Utility and Cloud Computing (UCC), Leicester, UK, 7–10 December 2020; pp. 394–401. [Google Scholar]
- Niknami, N.; Wu, J. Entropy-KL-ML: Enhancing the Entropy-KL-based Anomaly Detection on Software-Defined Networks. IEEE Trans. Netw. Sci. Eng. 2022, 9, 4458–4467. [Google Scholar] [CrossRef]
- Yazdinejadna, A.; Parizi, R.M.; Dehghantanha, A.; Khan, M.S. A kangaroo-based intrusion detection system on software-defined networks. Comput. Netw. 2021, 184, 107688. [Google Scholar] [CrossRef]
- Goo, Y.H.; Lee, S.H.; Choi, S.; Choi, M.J.; Kim, M.S. A traffic grouping method using the correlation model of network flow. In Proceedings of the IEEE 19th Asia-Pacific Network Operations and Management Symposium (APNOMS), Seoul, Republic of Korea, 27–29 September 2017; pp. 386–390. [Google Scholar]
- Hashemi, M.J.; Keller, E. Enhancing robustness against adversarial examples in network intrusion detection systems. In Proceedings of the IEEE Conference on Network Function Virtualization and Software Defined Networks (NFV-SDN), Leganes, Spain, 10–12 November 2020; pp. 37–43. [Google Scholar]
- Albahar, M.A. Recurrent neural network model based on a new regularization technique for real-time intrusion detection in SDN environments. Secur. Commun. Netw. 2019, 2019, 8939041. [Google Scholar] [CrossRef]
- Chakraborty, N. Intrusion detection system and intrusion prevention system: A comparative study. Int. J. Comput. Bus. Res. (IJCBR) 2013, 4, 1–8. [Google Scholar]
- Qaddoori, S.L.; Ali, Q.I. An in-depth characterization of intrusion detection systems (IDS). J. Mod. Technol. Eng. 2021, 6, 161–188. [Google Scholar]
- Khraisat, A.; Gondal, I.; Vamplew, P.; Kamruzzaman, J. Survey of intrusion detection systems: Techniques, datasets and challenges. Cybersecurity 2019, 2, 20. [Google Scholar] [CrossRef]
- McKeown, N.; Anderson, T.; Balakrishnan, H.; Parulkar, G.; Peterson, L.; Rexford, J.; Shenker, S.; Turner, J. OpenFlow: Enabling innovation in campus networks. ACM SIGCOMM Comput. Commun. Rev. 2008, 38, 69–74. [Google Scholar] [CrossRef]
- Hande, Y.; Muddana, A. A survey on intrusion detection system for software defined networks (SDN). In Research Anthology on Artificial Intelligence Applications in Security; IGI Global: Hershey, PA, USA, 2021; pp. 467–489. [Google Scholar]
- Hande, Y.; Muddana, A.; Darade, S. Software-defined network-based intrusion detection system. In Innovations in Electronics and Communication Engineering; Springer: Berlin/Heidelberg, Germany, 2018; pp. 535–543. [Google Scholar]
- MacQueen, J. Some methods for classification and analysis of multivariate observations. In Proceedings of the 5th Berkeley Symposium on Mathematical Statistics and Probability, Berkeley, CA, USA, 7 January 1967; Volume 1, pp. 281–297. [Google Scholar]
- Malinen, M.I.; Fränti, P. Balanced k-means for clustering. In Proceedings of the International Workshops on Statistical Techniques in Pattern Recognition and Structural and Syntactic Pattern Recognition, Joensuu, Finland, 20–22 August 2014; Springer: Berlin/Heidelberg, Germany, 2014; pp. 32–41. [Google Scholar]
- Chang, X.; Nie, F.; Ma, Z.; Yang, Y. Balanced k-means and min-cut clustering. arXiv 2014, arXiv:1411.6235. [Google Scholar]
- Burkard, R.; Dell’Amico, M.; Martello, S. Assignment Problems: Revised Reprint; SIAM: Philadelphia, PA, USA, 2012. [Google Scholar]
- Karp, R.M. An algorithm to solve the m× n assignment problem in expected time O (mn log n). Networks 1980, 10, 143–152. [Google Scholar] [CrossRef]
- Johnson, T.; Wu, J. Improvements to Worker Assignment in Bike Sharing Systems. In Proceedings of the 2021 IEEE 18th International Conference on Mobile Ad Hoc and Smart Systems (MASS), Denver, CO, USA, 4–7 October 2021; pp. 639–644. [Google Scholar]
- Vattani, A. The hardness of k-means clustering in the plane. Manuscript 2009, 617. Available online: https://api.semanticscholar.org/CorpusID:8497124 (accessed on 11 October 2023).
- Mahajan, M.; Nimbhorkar, P.; Varadarajan, K. The planar k-means problem is NP-hard. In Proceedings of the International Workshop on Algorithms and Computation, Kolkata, India, 18–20 February 2009; pp. 274–285. [Google Scholar]
- Thorpe, M.; Theil, F.; Johansen, A.M.; Cade, N. Convergence of the k-means minimization problem using Γ-convergence. SIAM J. Appl. Math. 2015, 75, 2444–2474. [Google Scholar] [CrossRef]
- Coates, A.; Ng, A.; Lee, H. An analysis of single-layer networks in unsupervised feature learning. In Proceedings of the 14th International Conference on Artificial Intelligence and Statistics, Fort Lauderdale, FL, USA, 11–13 April 2011; pp. 215–223. [Google Scholar]
- Elkan, C. Using the triangle inequality to accelerate k-means. In Proceedings of the 20th International Conference on Machine Learning (ICML), Washington, DC, USA, 21–24 August 2003; pp. 147–153. [Google Scholar]
- Hamerly, G. Making k-means even faster. In Proceedings of the International Conference on Data Mining (SIAM), Columbus, OH, USA, 29 April–1 May 2010; pp. 130–140. [Google Scholar]
- Duan, Y.; Wu, J. Spatial-temporal inventory rebalancing for bike sharing systems with worker recruitment. IEEE Trans. Mob. Comput. 2020, 21, 1081–1095. [Google Scholar] [CrossRef]
- Biswas, R. Mitigation of Different Network Attacks and Optimization in Software Defined Network. Ph.D. Thesis, Temple University, Philadelphia, PA, USA, 2021. [Google Scholar]
- Kim, W.; Li, J.; Hong, J.W.K.; Suh, Y.J. OFMon: OpenFlow monitoring system in ONOS controllers. In Proceedings of the 2016 IEEE NetSoft Conference and Workshops (NetSoft), Seoul, Republic of Korea, 6–10 June 2016; pp. 397–402. [Google Scholar] [CrossRef]
Figure 1.
Forwarding traffic flows through IDSs in an SDN.

Figure 2.
Different methods of assigning IDS chain to incoming traffic. (a) Shortest path. (b) Balancing. (c) Perfect matching.
Figure 2.
Different methods of assigning IDS chain to incoming traffic. (a) Shortest path. (b) Balancing. (c) Perfect matching.

Figure 3.
Relationship between assignment and OPT.

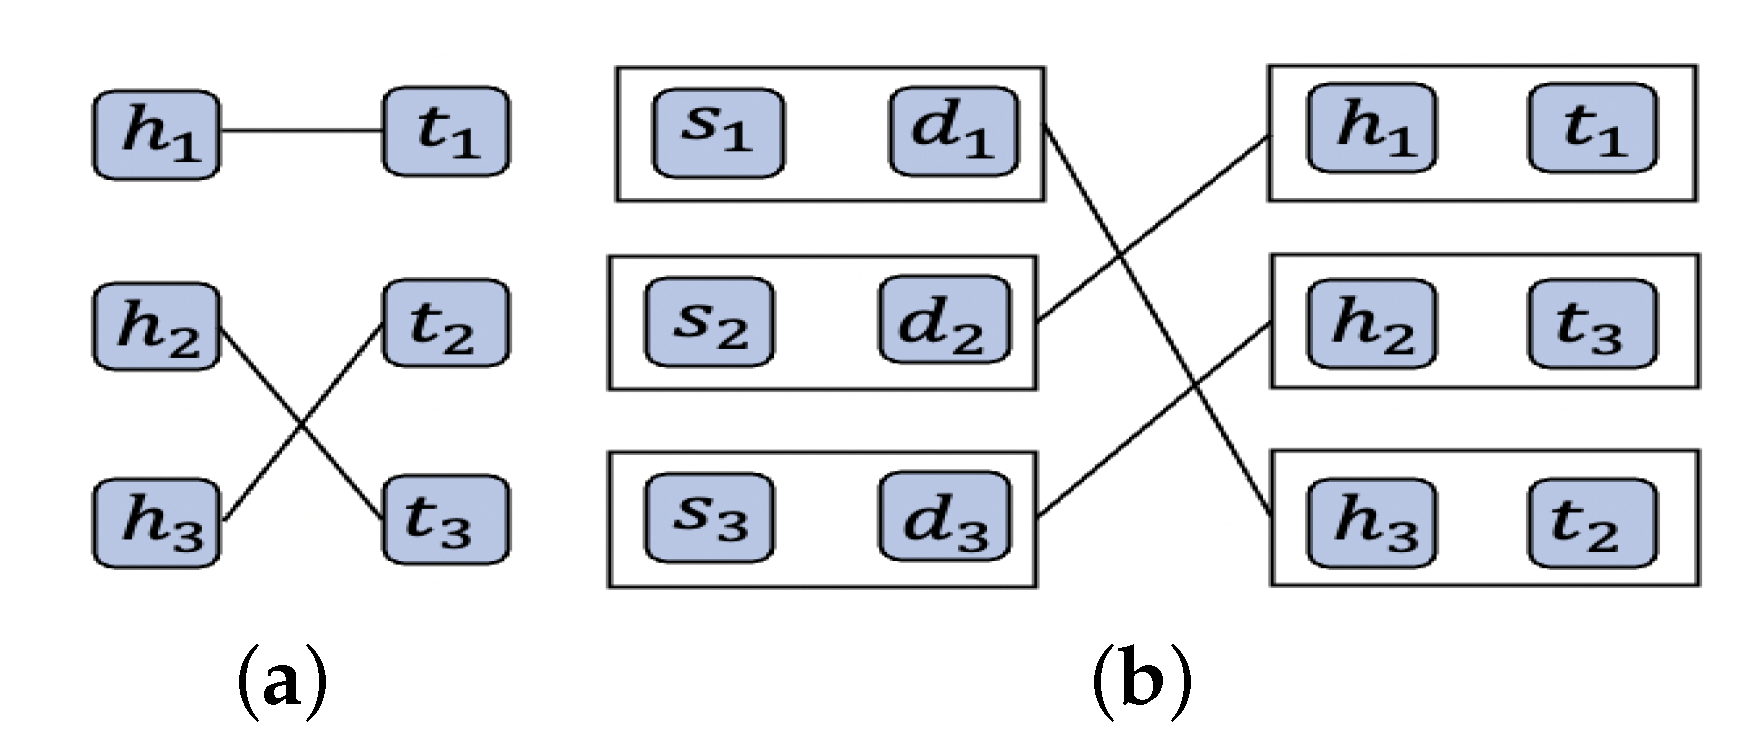
Figure 4.
Procedures of the matching algorithm. (a) First step. (b) Second step.

Figure 5.
Topologies. (a) Data center topology. (b) 24-node USNET topology. (c) 75-node CORONET topology.
Figure 5.
Topologies. (a) Data center topology. (b) 24-node USNET topology. (c) 75-node CORONET topology.

Figure 6.
Detection time for topology 1 (Sparsity = ). (a) Delay with one IDS. (b) Delay with fixed two IDS. (c) Delay with long IDS chain.
Figure 6.
Detection time for topology 1 (Sparsity = ). (a) Delay with one IDS. (b) Delay with fixed two IDS. (c) Delay with long IDS chain.

Figure 7.
Detection time for topology 2 (Sparsity = ). (a) Delay with one IDS. (b) Delay with fixed two IDS. (c) Delay with fixed two IDS.
Figure 7.
Detection time for topology 2 (Sparsity = ). (a) Delay with one IDS. (b) Delay with fixed two IDS. (c) Delay with fixed two IDS.

Figure 8.
Detection time for topology 3 (Sparsity = ). (a) Delay with one IDS. (b) Delay with fixed two IDS. (c) Delay with long IDS chain.
Figure 8.
Detection time for topology 3 (Sparsity = ). (a) Delay with one IDS. (b) Delay with fixed two IDS. (c) Delay with long IDS chain.

Figure 9.
Number of hops for topology 1 (Sparsity = ). (a) Number of hops with one chain. (b) Number of hops with fixed chain. (c) Number of hops with long chain.
Figure 9.
Number of hops for topology 1 (Sparsity = ). (a) Number of hops with one chain. (b) Number of hops with fixed chain. (c) Number of hops with long chain.

Figure 10.
Number of hops for topology 2 (Sparsity = ). (a) Number of hops with one chain. (b) Number of hops with fixed chain. (c) Number of hops with long chain.
Figure 10.
Number of hops for topology 2 (Sparsity = ). (a) Number of hops with one chain. (b) Number of hops with fixed chain. (c) Number of hops with long chain.

Figure 11.
Number of hops for topology 3 (Sparsity = ). (a) Number of hops with one chain. (b) Number of hops with fixed chain. (c) Number of hops with long chain.
Figure 11.
Number of hops for topology 3 (Sparsity = ). (a) Number of hops with one chain. (b) Number of hops with fixed chain. (c) Number of hops with long chain.

Figure 12.
Network delay for different flow weights. (a) Number of flows = 100. (b) Number of flows = 300. (c) Number of flows = 500.
Figure 12.
Network delay for different flow weights. (a) Number of flows = 100. (b) Number of flows = 300. (c) Number of flows = 500.

Figure 13.
Network delay for the different number of flows. (a) Weight of flows = 100. (b) Weight of flows = 200. (c) Weight of flows = 200.
Figure 13.
Network delay for the different number of flows. (a) Weight of flows = 100. (b) Weight of flows = 200. (c) Weight of flows = 200.

Figure 14.
Comparison of different strategies for IDS based on detection rate. (a) Data center topology. (b) 4-node USNET topology. (c) 75-node CORONET topology.
Figure 14.
Comparison of different strategies for IDS based on detection rate. (a) Data center topology. (b) 4-node USNET topology. (c) 75-node CORONET topology.


Table 1.
List of symbols with their definitions.
| Symbol | Meaning |
|---|---|
| Traffic flow, Set of traffic flows | |
| j-th flow’s source/destination | |
| j-th cluster’s centroid | |
| j-th GroupFlow | |
| j-th GroupFlow’s source/destination | |
| Set of IDS chains/i-th IDS chain | |
| i-th IDS chain’s head/tail | |
| Defined distance between x and y | |
| Traffic rate of j-th flow |
Table 2.
Fixed IDS chain for each flow.
| Shortest Path | Balanced | Matching | ||||
|---|---|---|---|---|---|---|
| Flow | Group | IDS | Group | IDS | Group | IDS |
| Total | 34 | 38 | 34 | |||
Table 3.
Impact of redundant packet inspection with different numbers of IDSs and different network traffic volume.
Table 3.
Impact of redundant packet inspection with different numbers of IDSs and different network traffic volume.
| Number of IDSs | Network Traffic Volume | Redundant Packet Inspection Ratio |
|---|---|---|
| 2 | Low | 0.15 |
| Medium | 0.20 | |
| High | 0.25 | |
| 4 | Low | 0.18 |
| Medium | 0.23 | |
| High | 0.28 | |
| 6 | Low | 0.21 |
| Medium | 0.26 | |
| High | 0.32 | |
| 8 | Low | 0.25 |
| Medium | 0.30 | |
| High | 0.35 |
Table 4.
Unbalancing factor.
| Flows | Shortest Path | Balancing | Matching |
|---|---|---|---|
| IDS Chain 1 | |||
| IDS Chain 2 | |||
| IDS Chain 3 |
Disclaimer/Publisher’s Note: The statements, opinions and data contained in all publications are solely those of the individual author(s) and contributor(s) and not of MDPI and/or the editor(s). MDPI and/or the editor(s) disclaim responsibility for any injury to people or property resulting from any ideas, methods, instructions or products referred to in the content. |
© 2024 by the authors. Licensee MDPI, Basel, Switzerland. This article is an open access article distributed under the terms and conditions of the Creative Commons Attribution (CC BY) license (https://creativecommons.org/licenses/by/4.0/).
Share and Cite
MDPI and ACS Style
Niknami, N.; Wu, J. IDSMatch: A Novel Deployment Method for IDS Chains in SDNs. Network 2024, 4, 48-67. https://doi.org/10.3390/network4010003
AMA Style
Niknami N, Wu J. IDSMatch: A Novel Deployment Method for IDS Chains in SDNs. Network. 2024; 4(1):48-67. https://doi.org/10.3390/network4010003
Chicago/Turabian StyleNiknami, Nadia, and Jie Wu. 2024. "IDSMatch: A Novel Deployment Method for IDS Chains in SDNs" Network 4, no. 1: 48-67. https://doi.org/10.3390/network4010003