Article

Foam Pressure Mapping with Optimized Electrodes †

1
Department of Electrical and Computer Engineering, Brigham Young University, Provo, UT 84602, USA
2
Xonano, Orem, UT 84057, USA
*
Author to whom correspondence should be addressed.
This paper is an extension version of the conference paper: Sundet, J.; Merrell, J.; Schultz, S.; Tree, M.; Christensen, T.; Nielsen, M.; Samudio, M. Smartfoam Based Pressure Mapping. In Proceedings of the 2023 Intermountain Engineering, Technology and Computing (IETC), Provo, UT, USA, 5–7 May 2023.
Metrology 2024, 4(1), 82-97; https://doi.org/10.3390/metrology4010006
Submission received: 15 December 2023 / Revised: 13 January 2024 / Accepted: 25 January 2024 / Published: 7 February 2024

Abstract

:
Nano-composite piezo-responsive foam (NCPF) is an inexpensive foam that can be used to measure a static load while still providing a comfortable interface. The purpose of this study was to create a modularized foam-based pressure measurement system. A measurement system was developed that uses an interdigitated electrode applied to the NCPF. Applied pressure changes the impedance of the NCPF, which, in turn, is converted into a voltage using a voltage divider. A modular measurement system is described that uses an ATtiny 1627 microcontroller to measure the pressure at nine electrodes. The nine electrode modules are controlled by an ESP32 microcontroller that aggregates the data and wirelessly transmits the data to a tablet. The modular system was demonstrated with 1008 individual electrodes. The characterization of the electrode combined with the NCPF is presented, along with optimization of the electrode geometry.
Keywords:
sensor; pressure; foam

1. Introduction

Pressure ulcers are painful products of pressure against the surface of the body [1,2,3,4]. Sadly, pressure injuries are very difficult to prevent or predict as there are not any pressure sensing features in surfaces that a body encounters daily. Placing traditional load cells in bedding, seating, or insoles is not realistic, as most load cells are large, rigid, and uncomfortable interfaces for the body [5,6]. Artificial skin has also been developed [7,8,9,10]. Artificial skin is accurate but lacks the comfort of foam. Foam is a material that most people interact with daily, and by enabling pressure measurements through foam, data can be obtained in unique and novel ways [11,12].
Several research groups have worked on using foam as a piezoresistive material by surrounding the foam in electrodes to measure the change in current as the foam is compressed [13,14]. Tolvanen et al. have shown that this method for measuring pressure can measure down to 21 Pa being loaded or unloaded. Liu et al. used single-sided electrodes topped with foam to measure the change in current if the foam acted as a piezoresistive material [14].
Nano-composite piezo-responsive foam (NCPF) allows for measurements to be taken in places that are normally very difficult or expensive. NCPF has properties that allow it to behave as a pressure or impact sensor. Nano-composite piezo-responsive foam (NCPF) is a foam that is enabled through a particle formula that can be added to most foams before the foaming process [15].
Foam loading defines the number of additives that are added to the foam as it is manufactured. Often, a higher loading of additives correlates to a more rigid and less comfortable foam. NCPF requires a low percentage of loading, which directly reduces any negative effects foam loading would incur. These favorable material properties provide an opportunity when introducing NCPF into wearable technology, which can benefit both health and safety without compromising comfort. In summary, NCPF is produced by adding a patented particle formula to foam before the foaming process. The particles added provide the foam with advantageous characteristics that other foams do not have. These characteristics include electrical conductivity, thermal conductivity, and minimal rigidity modifications.
NCPF has been used as a dynamic load measurement system for several years. Figure 1 illustrates one application NCPF is used for as a dynamic load measuring system, although NCPF is used in other fields that are under development, including toys and sporting equipment [16].
The dynamic measurement method is unable to capture static loads because it relies on a triboelectric charge that is generated when the particles move within the foam matrix [16]. Dynamic load measuring with NCPF uses a single electrode. This single electrode behaves as a path for the triboelectric charge to reach the voltage reading device [17]. The voltage that the triboelectric charge produces correlates with force and can be used to generate force data [18].
However, many applications require the measurement of static pressures rather than dynamic measurements. In addition to the triboelectric charge, as the foam particles become closer together, the resistance between electrodes decreases as more particles bridge the gap. Interdigitated electrode geometry must be used and optimized for increased SNR. Excitation frequency, as well as conditioning circuitry, must also be considered. In addition, to showcase this technology in a usable and convincing manner, a modular system is needed, which will allow a variety of surfaces to be mapped using the same hardware. Lastly, an application is needed to allow for instant user feedback when using this technology. By implementing the improvements described, a persuasive system using foam to map pressure in real-world applications has been engineered.
Researchers have shown that foams can behave as resistive materials [19,20,21,22]. NCPF amplifies the conductive properties of foam, increasing the signal-to-noise ratio while retaining the comfortable foam feel. NCPF is unique because it requires very low loading, allowing particles to be added to nearly any foam without modifying the comfort, making this system additionally versatile. NCPF has a set formulation with dependable and consistent manufacturing in place; therefore, systems can be designed to work in any location that NCPF can be applied.
Some pressure measurement applications are unable to use typical strain gauges, but are prime candidates for NCPF-enabled strain sensors. NCPF can be used as a smart interface between the body and wearables, where a soft, flexible contact point is required. Due to the comfortable characteristics of NCPF, real-time pressure can be mapped using surfaces such as bedding, foot insoles, seating, and any other foam surfaces that a body may encounter.

2. Materials and Methods

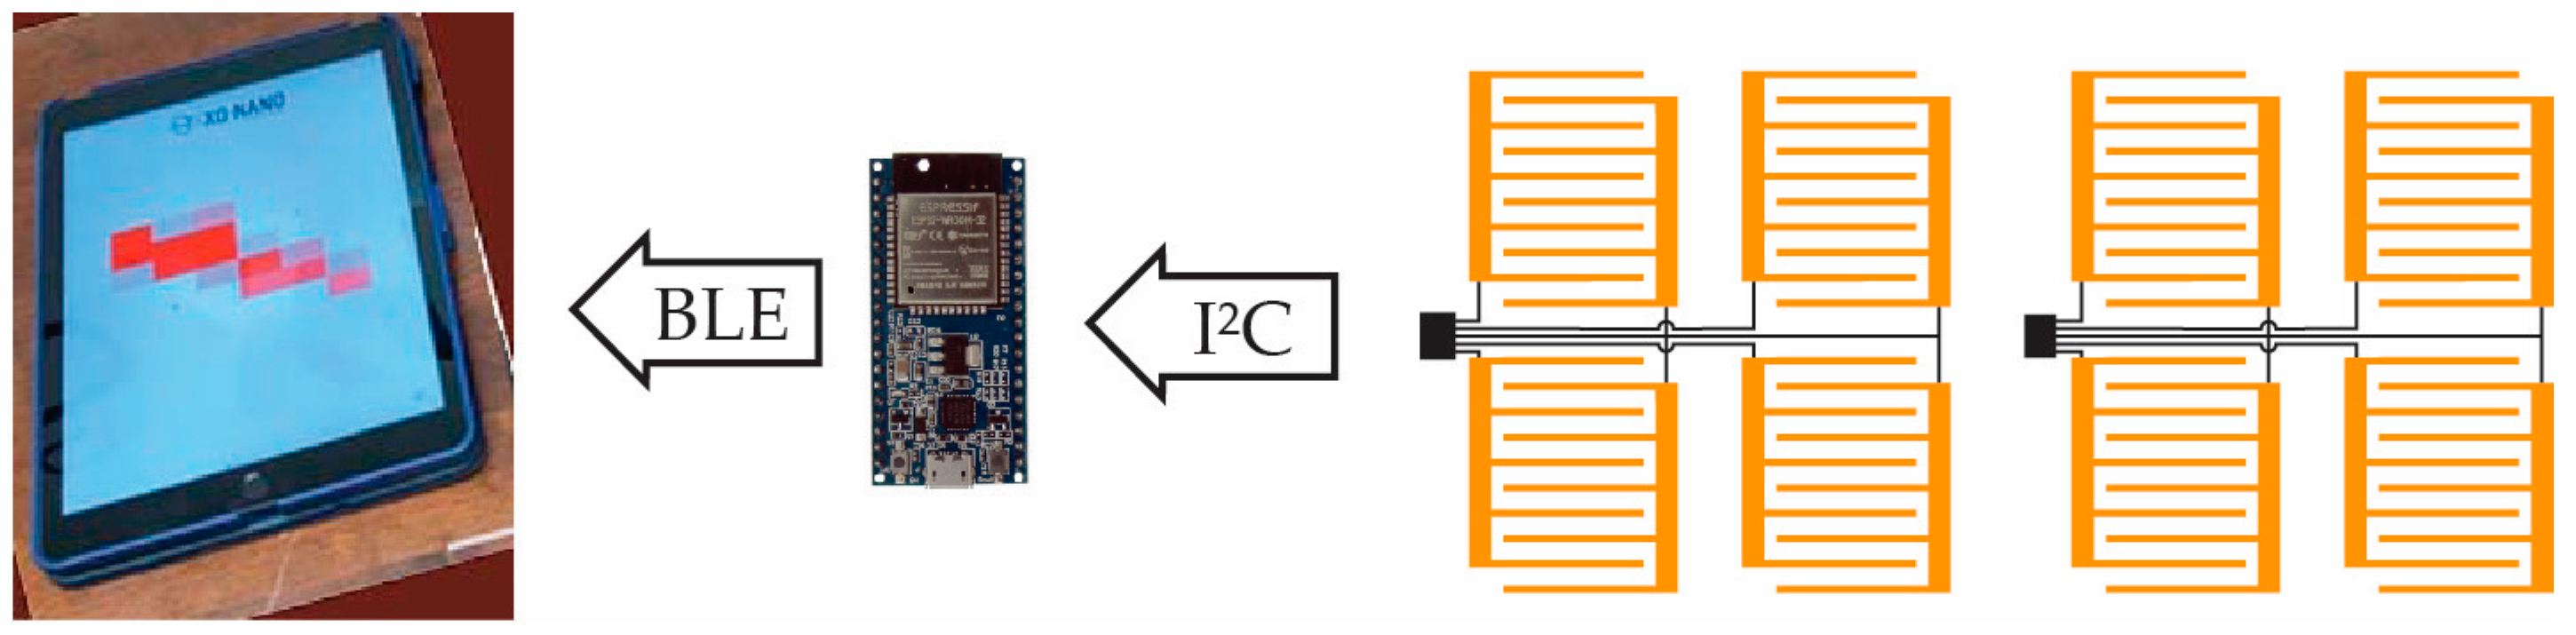
2.1. System Overview

Low-cost measurements of pressure over a large area require a simple system that can be modularized to work over a range of different applications and areas. Quasi-static pressure results in a change in the impedance of the NCPF. The impedance of the NCPF is measured by attaching the foam to interdigitated electrodes, applying an excitation voltage to a resistive voltage divider, and measuring the change in the voltage.
Figure 2 shows that the measurement system was built around a simple microcontroller. The ideal excitation would be a pure sinusoidal voltage; however, a simple square wave voltage attains a sufficient signal-to-noise ratio. The square wave signal was attained using the pulse width modulation (PWM) output of a typical low-cost microcontroller. The PWM output was simply set to have a frequency of 1 kHz and duty cycle of 50% to produce the desired square wave. Each electrode impedance was sampled using the built-in analog–digital converters (ADCs) incorporated into simple microcontrollers.
Figure 3 shows the arrays of electrodes measured using a small microcontroller connected to a master microcontroller with Bluetooth, which is connected to a display device such as a tablet or phone. The small microcontroller used in this study was the ATtiny1627. Writing firmware for the ATtiny1627 requires writing directly to registers to initialize and prepare each peripheral [23]. The ATtiny1627, which behaved as the slave in this system, was programmed using MPLAB [24]. The programming started with creating a PWM using an IO pin. The impedance of each electrode was sequentially measured using the ADC channels. The root-mean-squared (RMS) voltage amplitude was calculated from the sampled data.
An interrupt state routine is used to allow the master device to ask for the RMS value of the array. In this study, the master device was an ESP32 and the communication was performed following the Inter-Integrated Circuit (I2C) Protocol. The master device received the RMS data and converted the RMS voltage to pressure. The decision to program the master device to contain the conversion model was made for several reasons. Each flexible array matrix had measured impedances that were nearly identical to the next array. This means that once one flexible array had been modeled, that same model could be used for any other flexible array with the same geometry. Writing the model in the firmware for the master device also allows for model modifications to be implemented much quicker than updating the firmware for each slave device.
The master device can connect to any Bluetooth low-energy (BLE)-capable device, making the system more flexible by having the conversion model on the master device rather than the device used to display data. The master writes the model’s output to serial and broadcasts the values via BLE. A smart device that is capable of receiving BLE data can connect to the master device to receive, display, and save all the captured data.

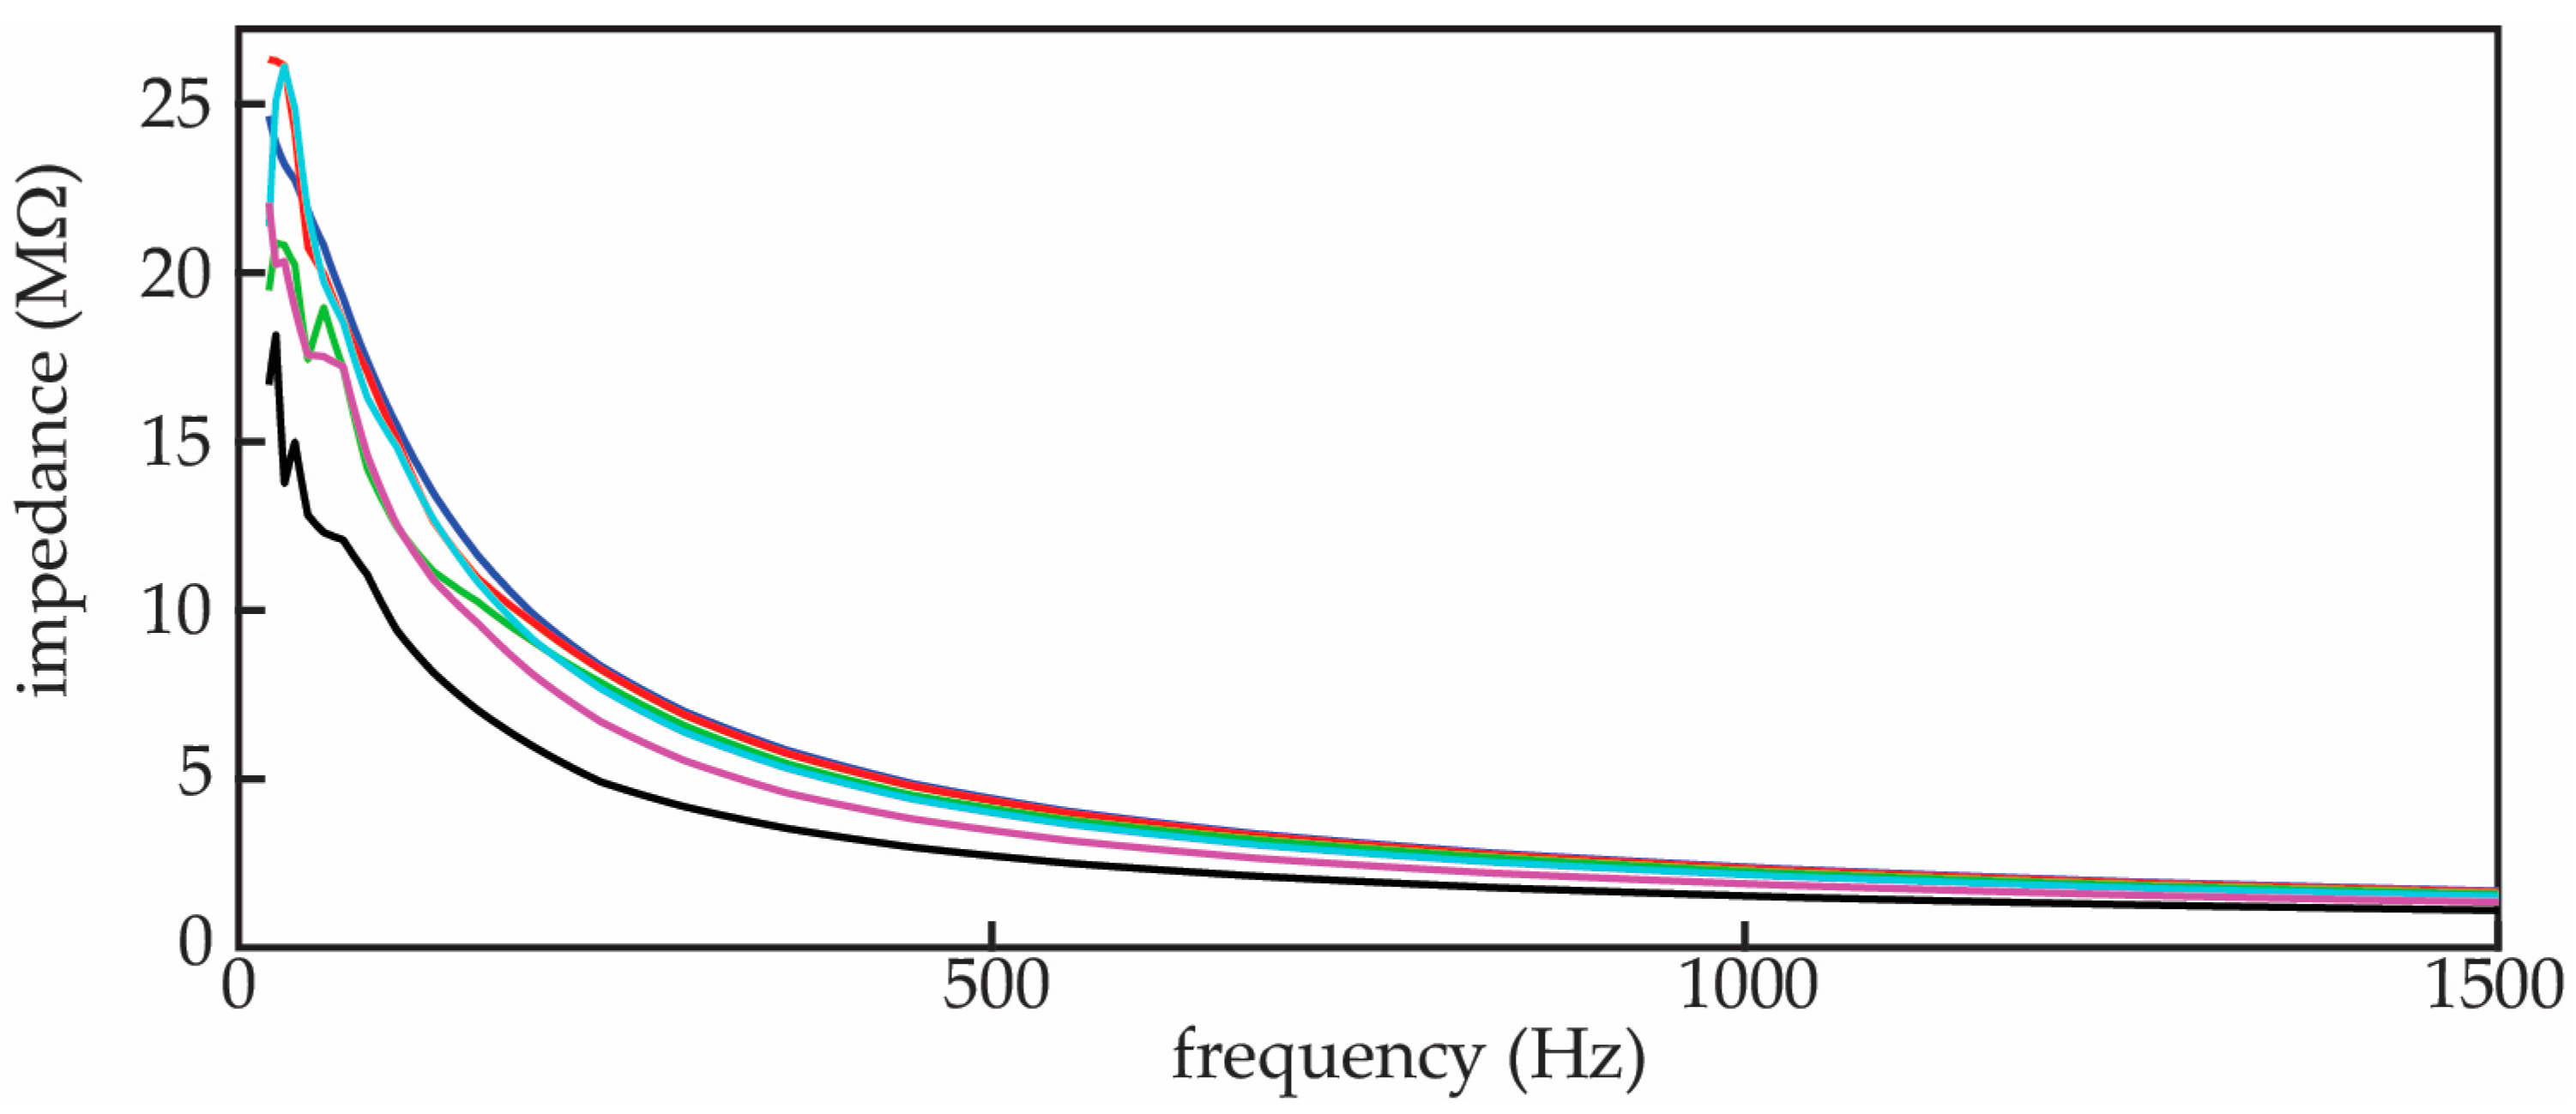
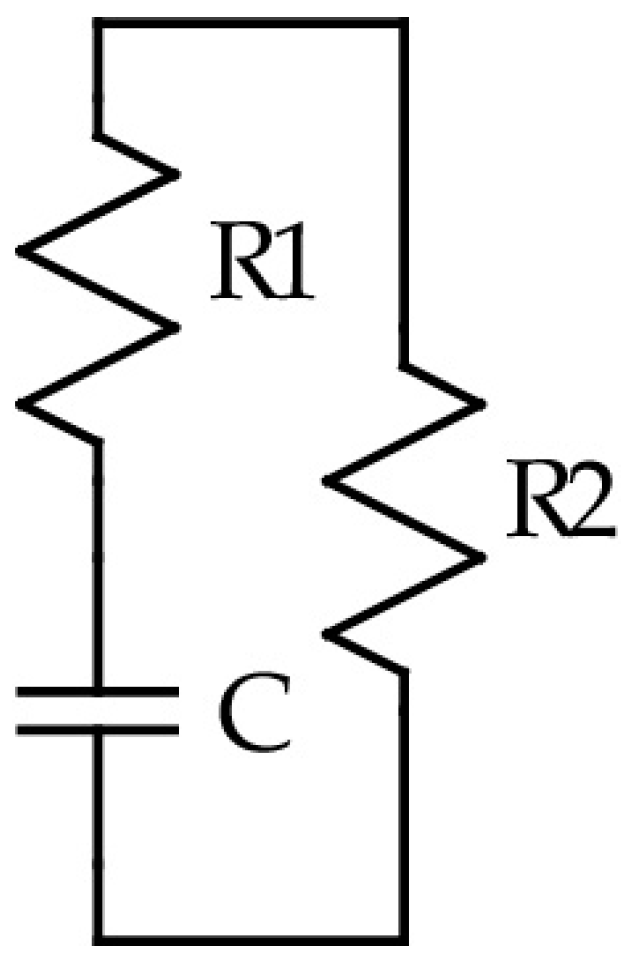
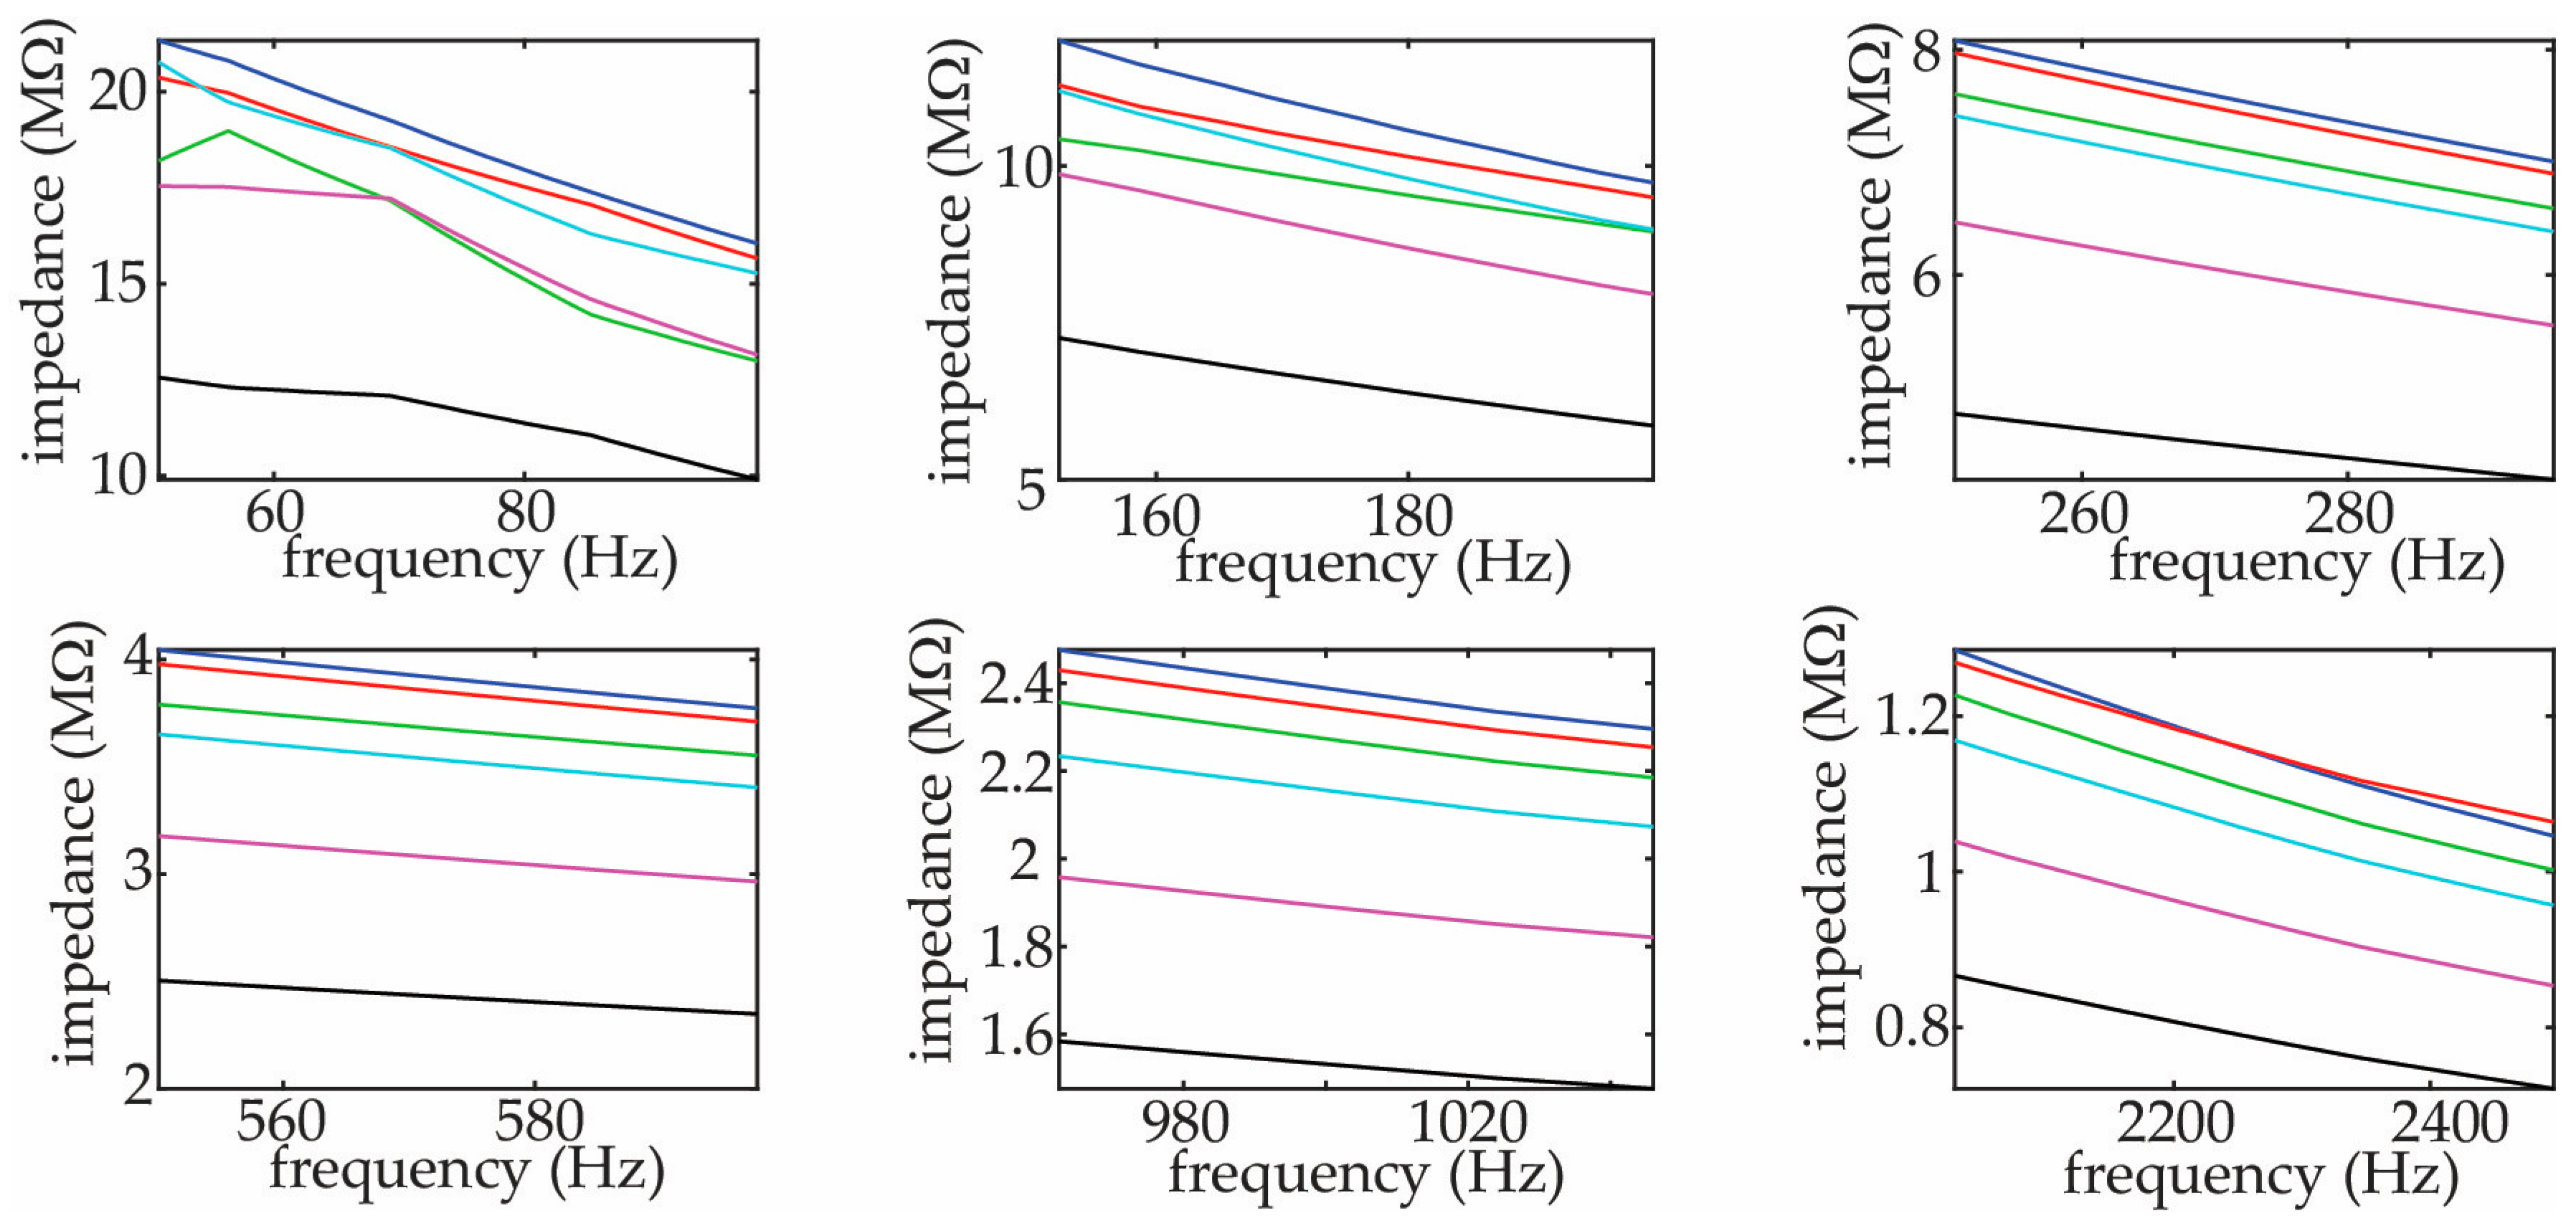
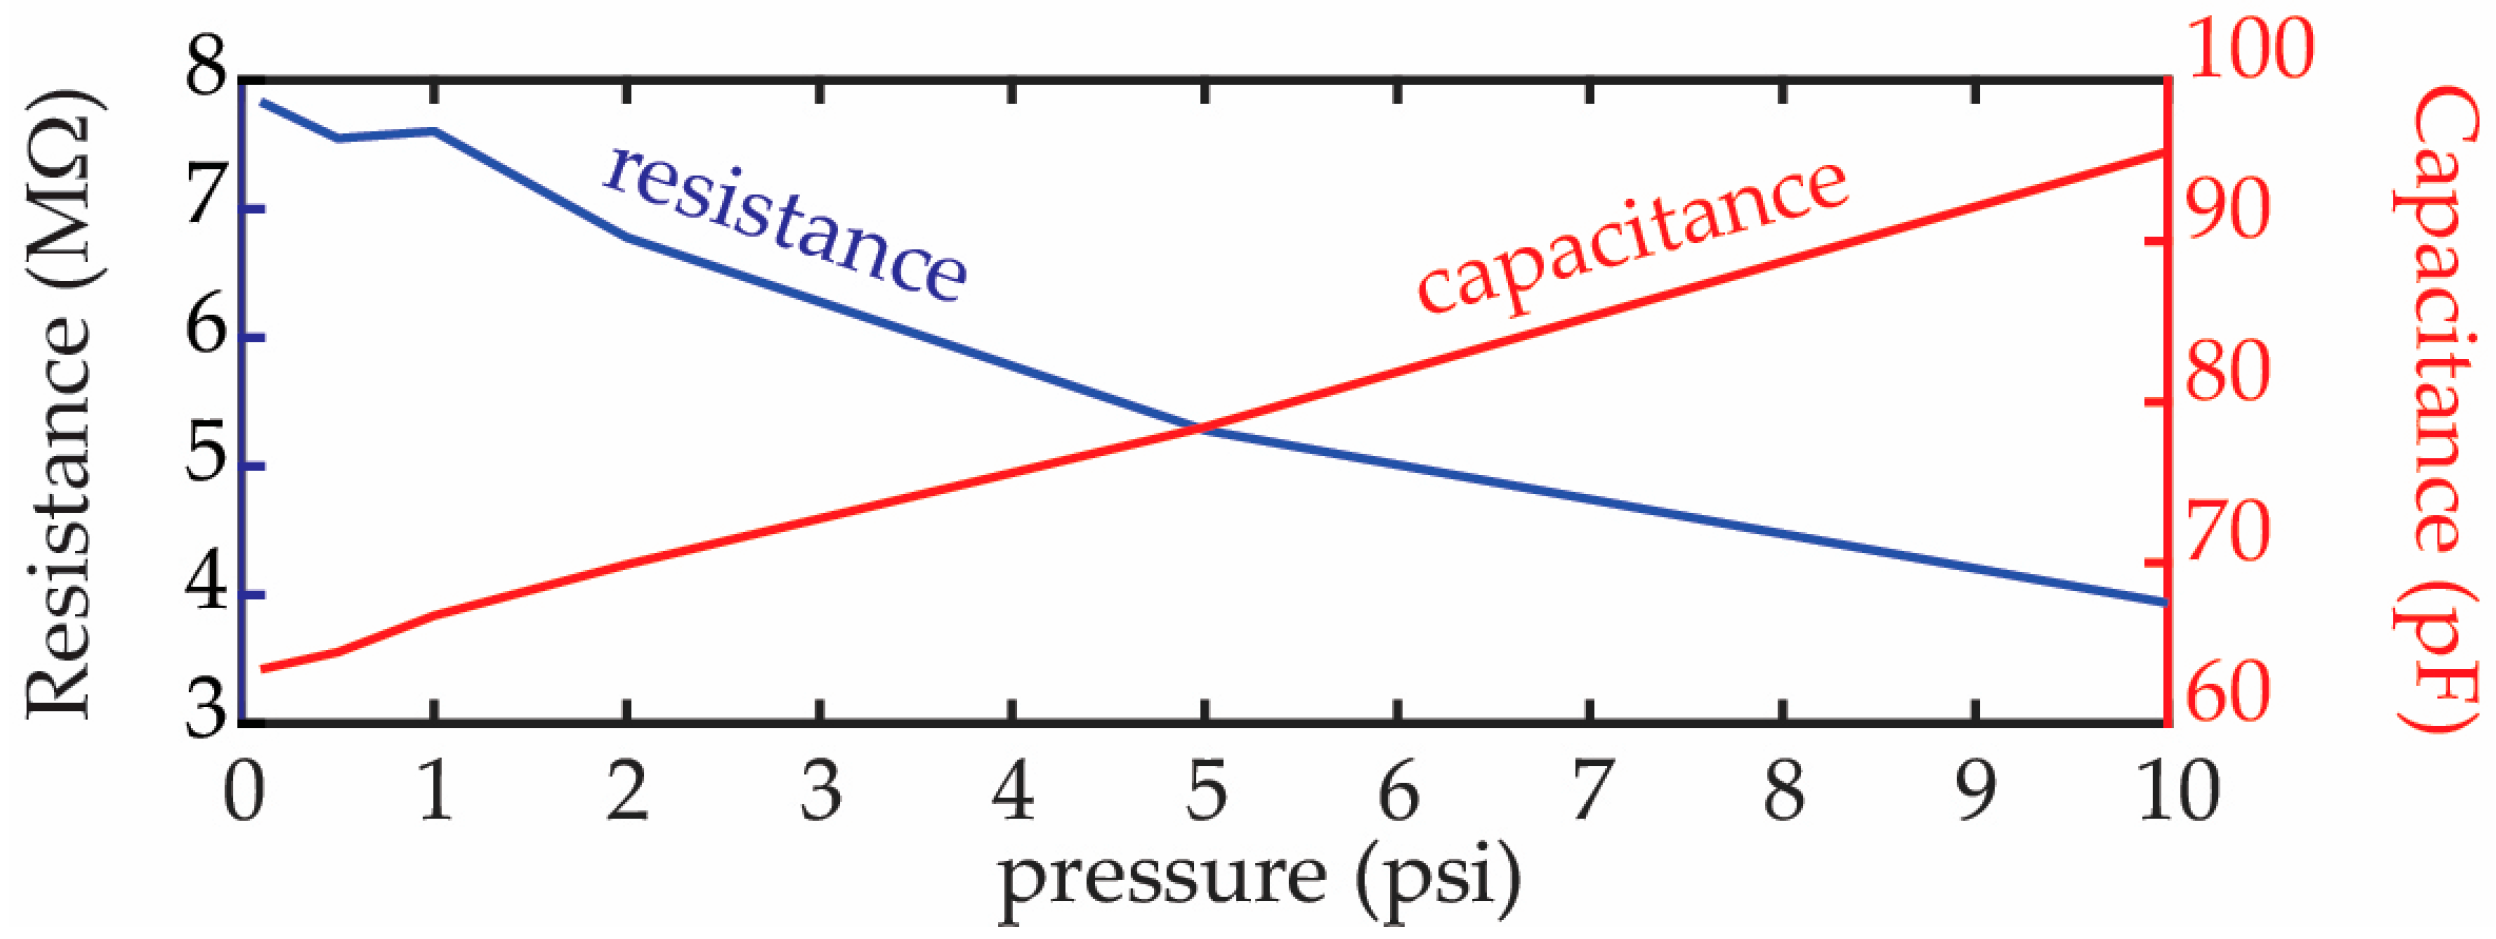
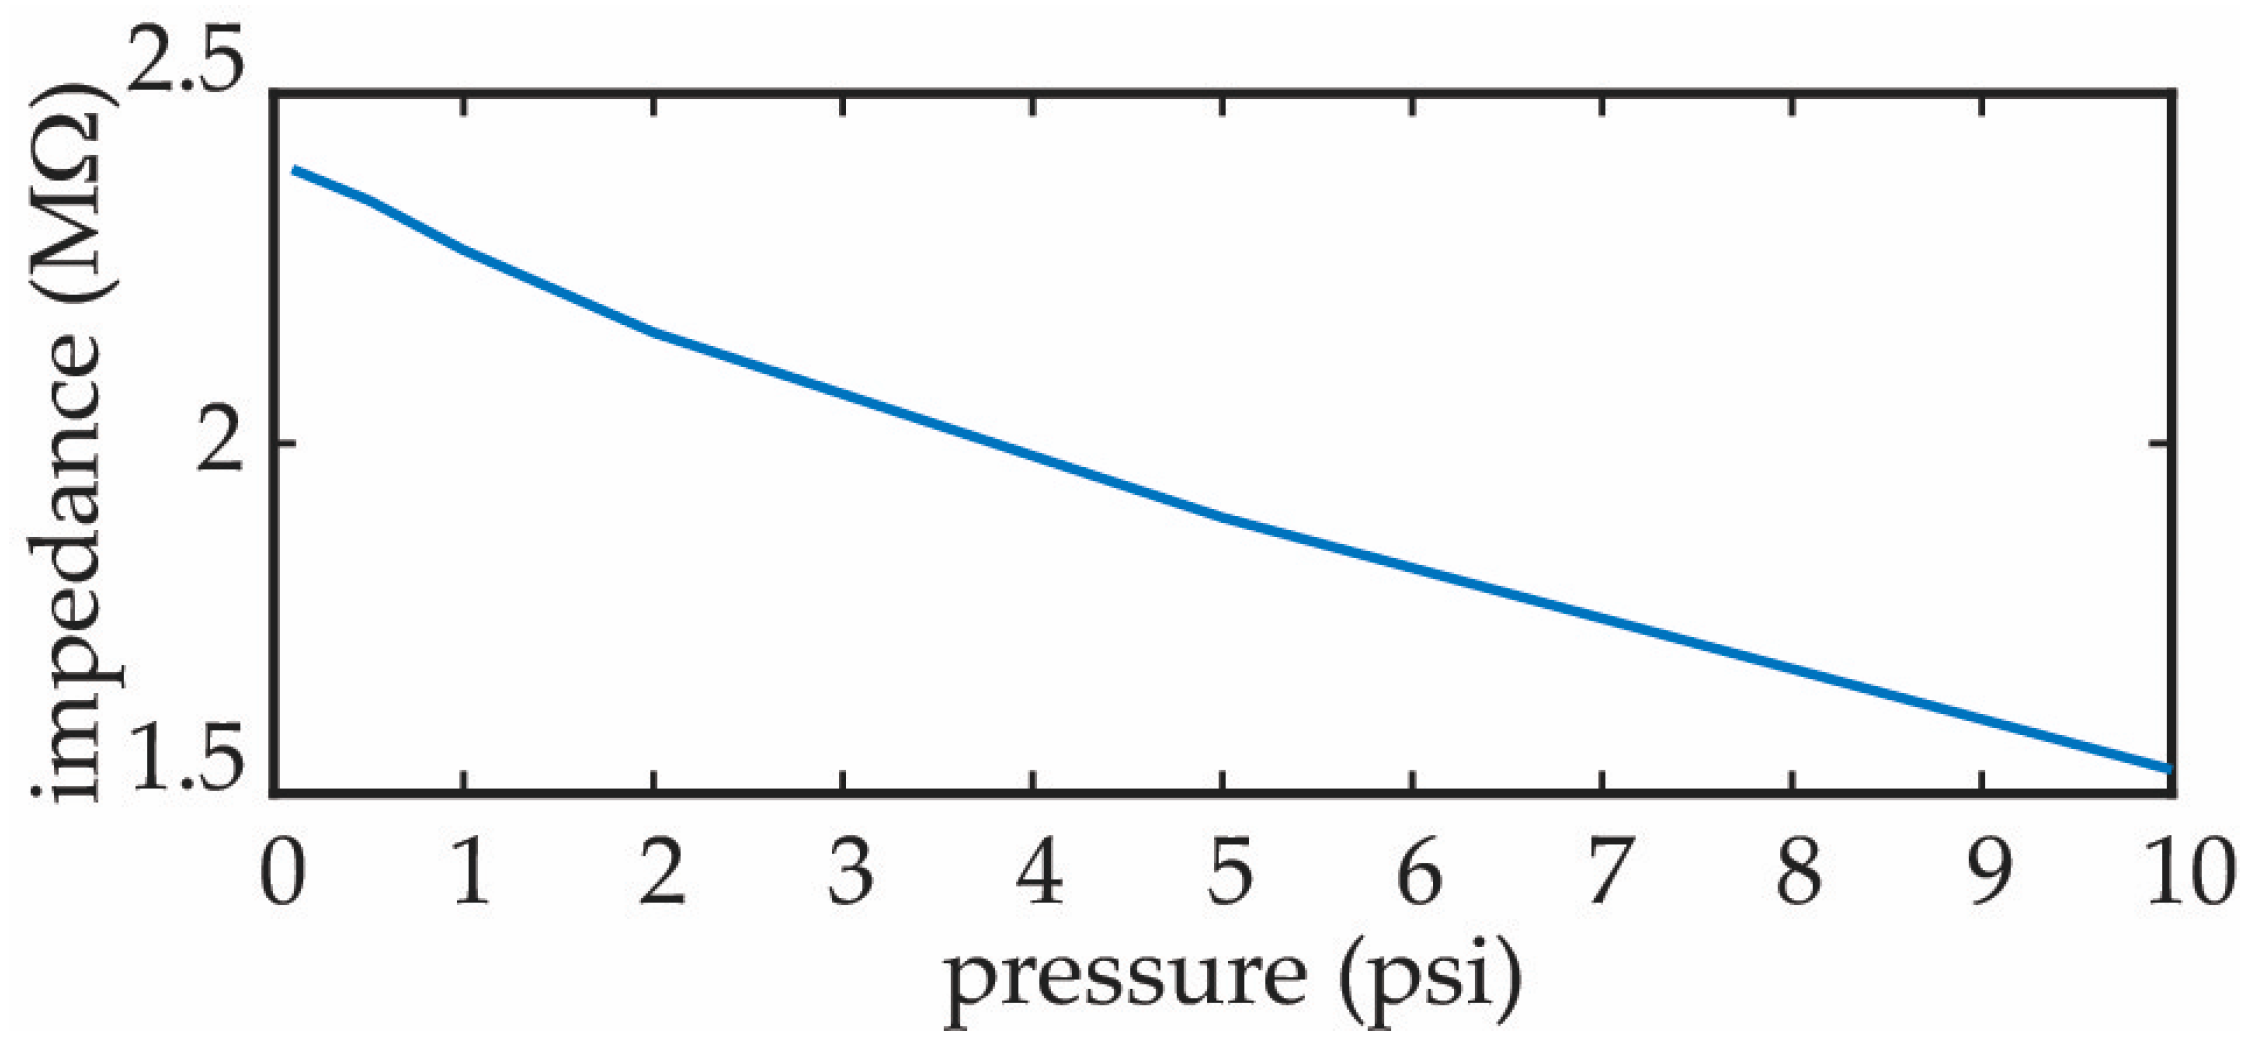
2.2. NCPF Material Impedance

The pressure was measured by determining the impedance of the NCPF. The NCPF was attached to interdigitated electrodes and an excitation voltage was applied between the electrodes. Three-millimeter-thick NCPF samples were measured by bridging gaps in the electrodes. Figure 4 shows an interdigitated electrode topped with NCPF. The NCPF covered the entirety of the exposed electrodes. The ADMET eXpert 5603F was used to compress the foam [25]. The BK Precision 891 Benchtop LCR meter was used to record impedance [26]. The compression tester was set to ramp to the desired pressure and hold the position for five seconds. After five seconds, the compression tester would return to the zeroed position for five seconds, giving the NCPF time to recover before moving to the next pressure.
Figure 5 shows that the impedance decreased from 20 Hz to 15 kHz. This was expected because NCPF has suspended conductive materials, resulting in the impedance being a combination of its resistive and capacitive portion. Figure 6 shows that the approximate lumped element circuit model had a capacitive portion that caused the impedance to decrease with frequency.
To use the NCPF for static pressure metrology, the sensing system uses a narrow frequency band where the primary impedance change is caused by the applied pressure. There is a balance between stability in impedance, and a reasonably low excitation frequency. Figure 7 shows the impedance over various frequency bands. For excitation frequencies under 200 Hz, the various lines that correspond to the various pressures are not parallel, resulting in increased noise. For frequencies above 2 kHz, there is crossover between the low pressures. The non-monotonic relationship between pressure and impedance also contributes to increased noise.
The impedance at 1 kHz is a balance of high impedance stability while maintaining a relatively low frequency. At a frequency of 1 kHz, the impedance of the capacitor dominates over the series resistance, R1, resulting in the total impedance being modeled as a resistor in parallel with a capacitor. Figure 8 shows the impedance versus frequency around the excitation voltage of 1 kHz for the various pressures.
The measurement data points are shown with ‘×’ symbols, and the lines are the best fit of the impedance with the lumped element impedance modeled as a resistor and capacitor in parallel with values that vary with pressure. Figure 9 shows the resistance and capacitance as a function of pressure. Increasing the pressure pushed the particles closer together, resulting in a decrease in the electrical resistance and increase in the capacitance. The exact relationship between pressure and impedance was not entirely linear because of the complex material interaction.
Figure 10 shows the measured impedance as a function of pressure changes with an excitation frequency of 1 kHz.

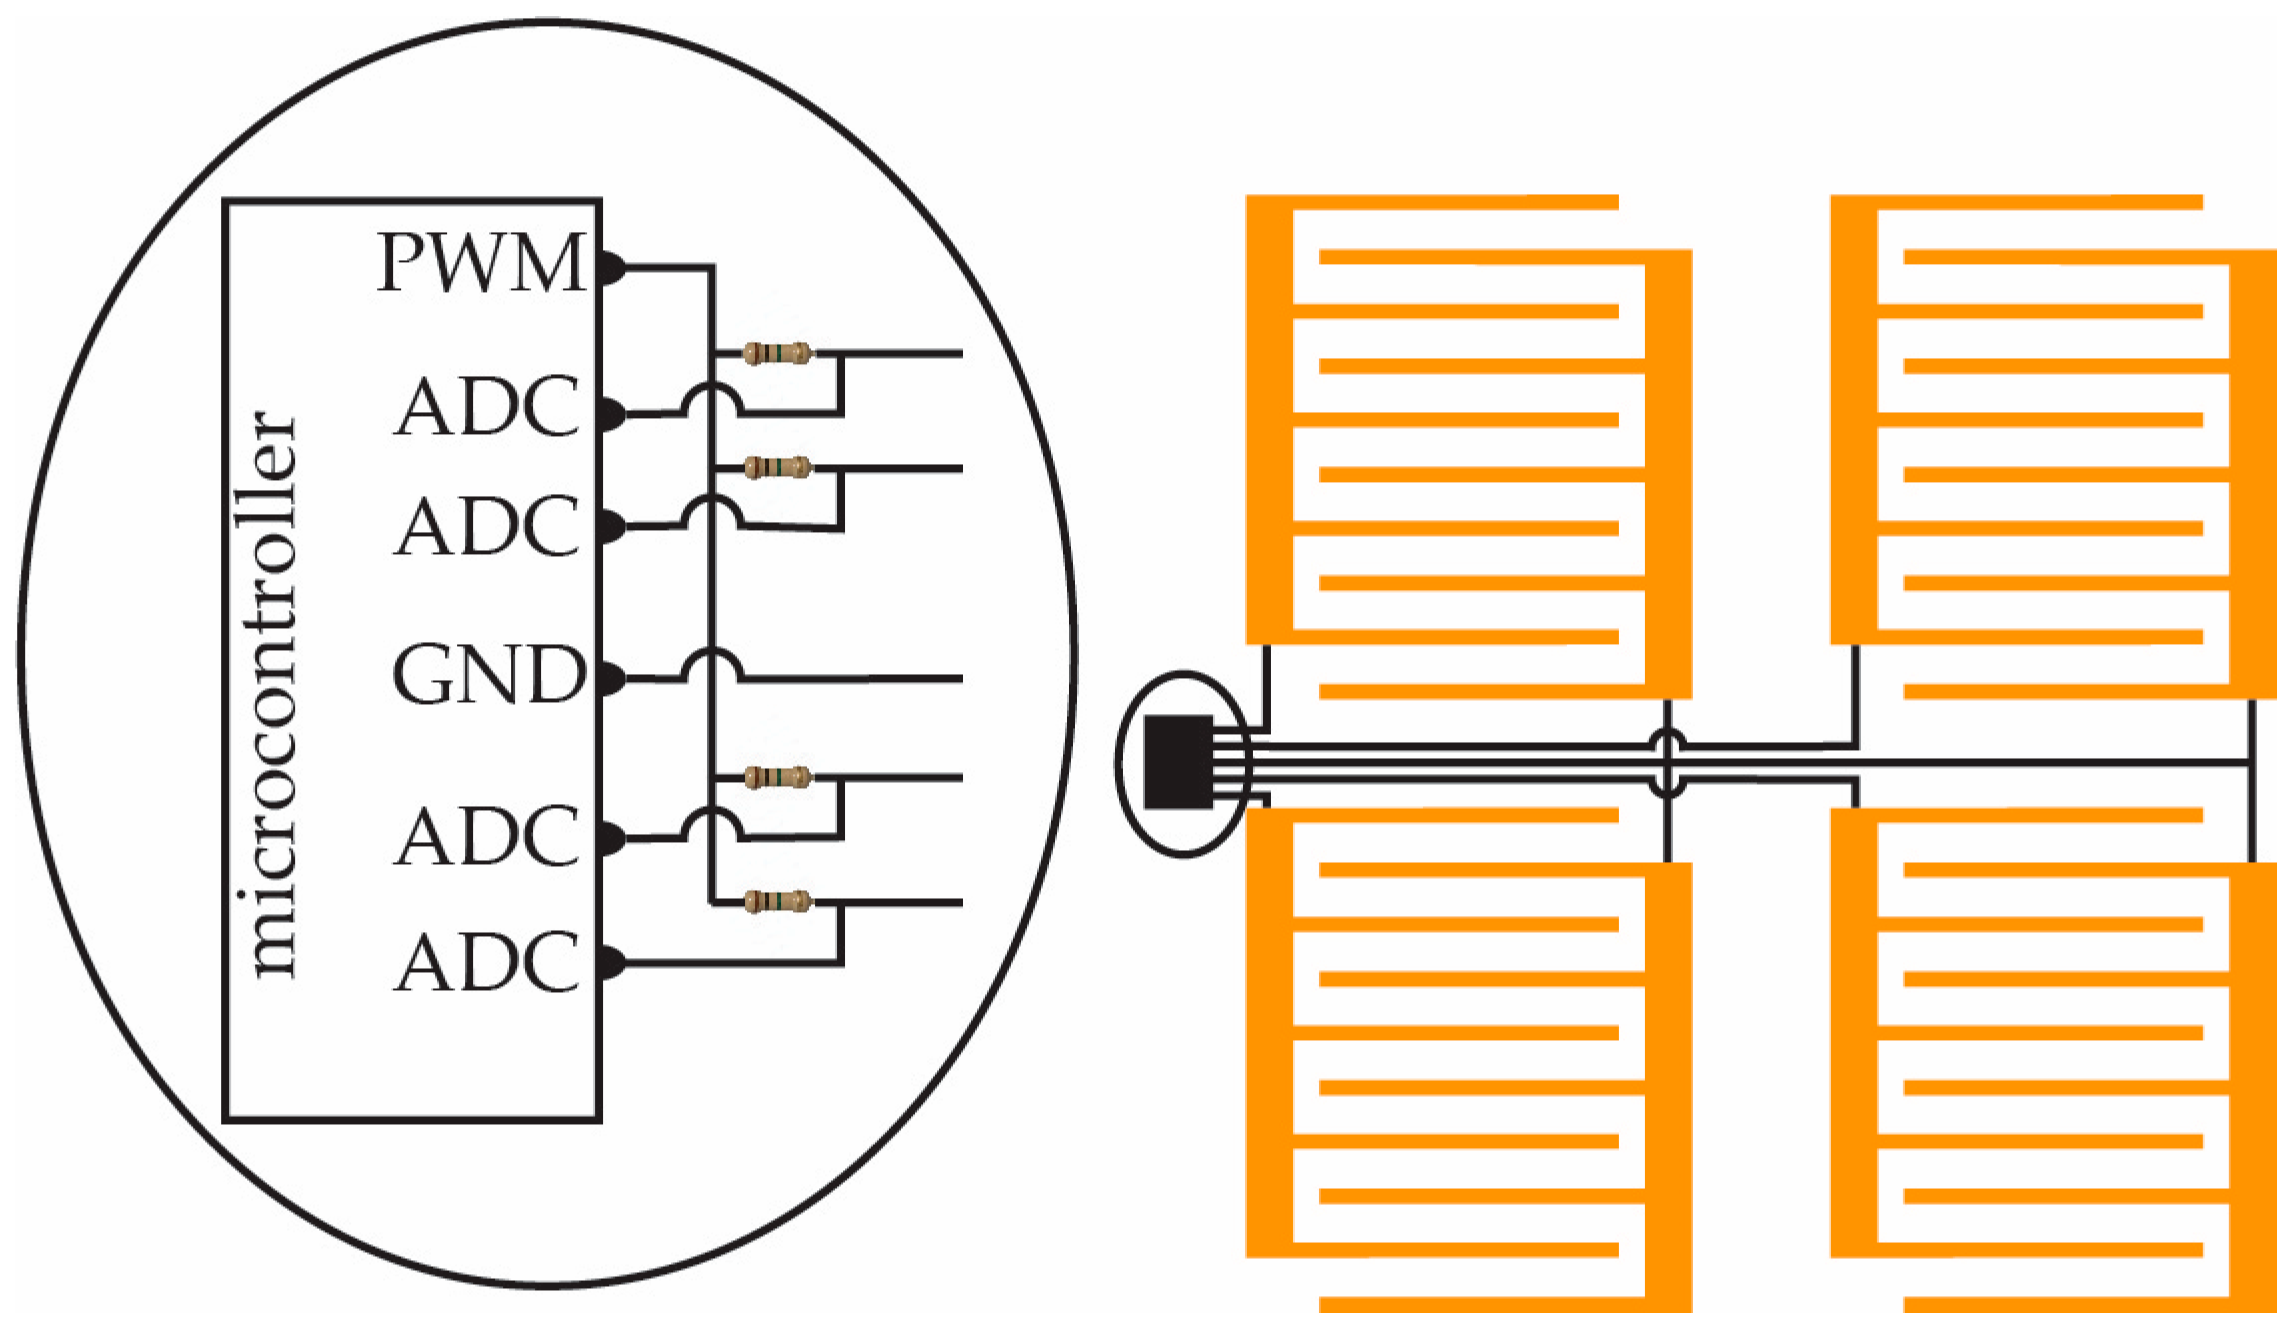
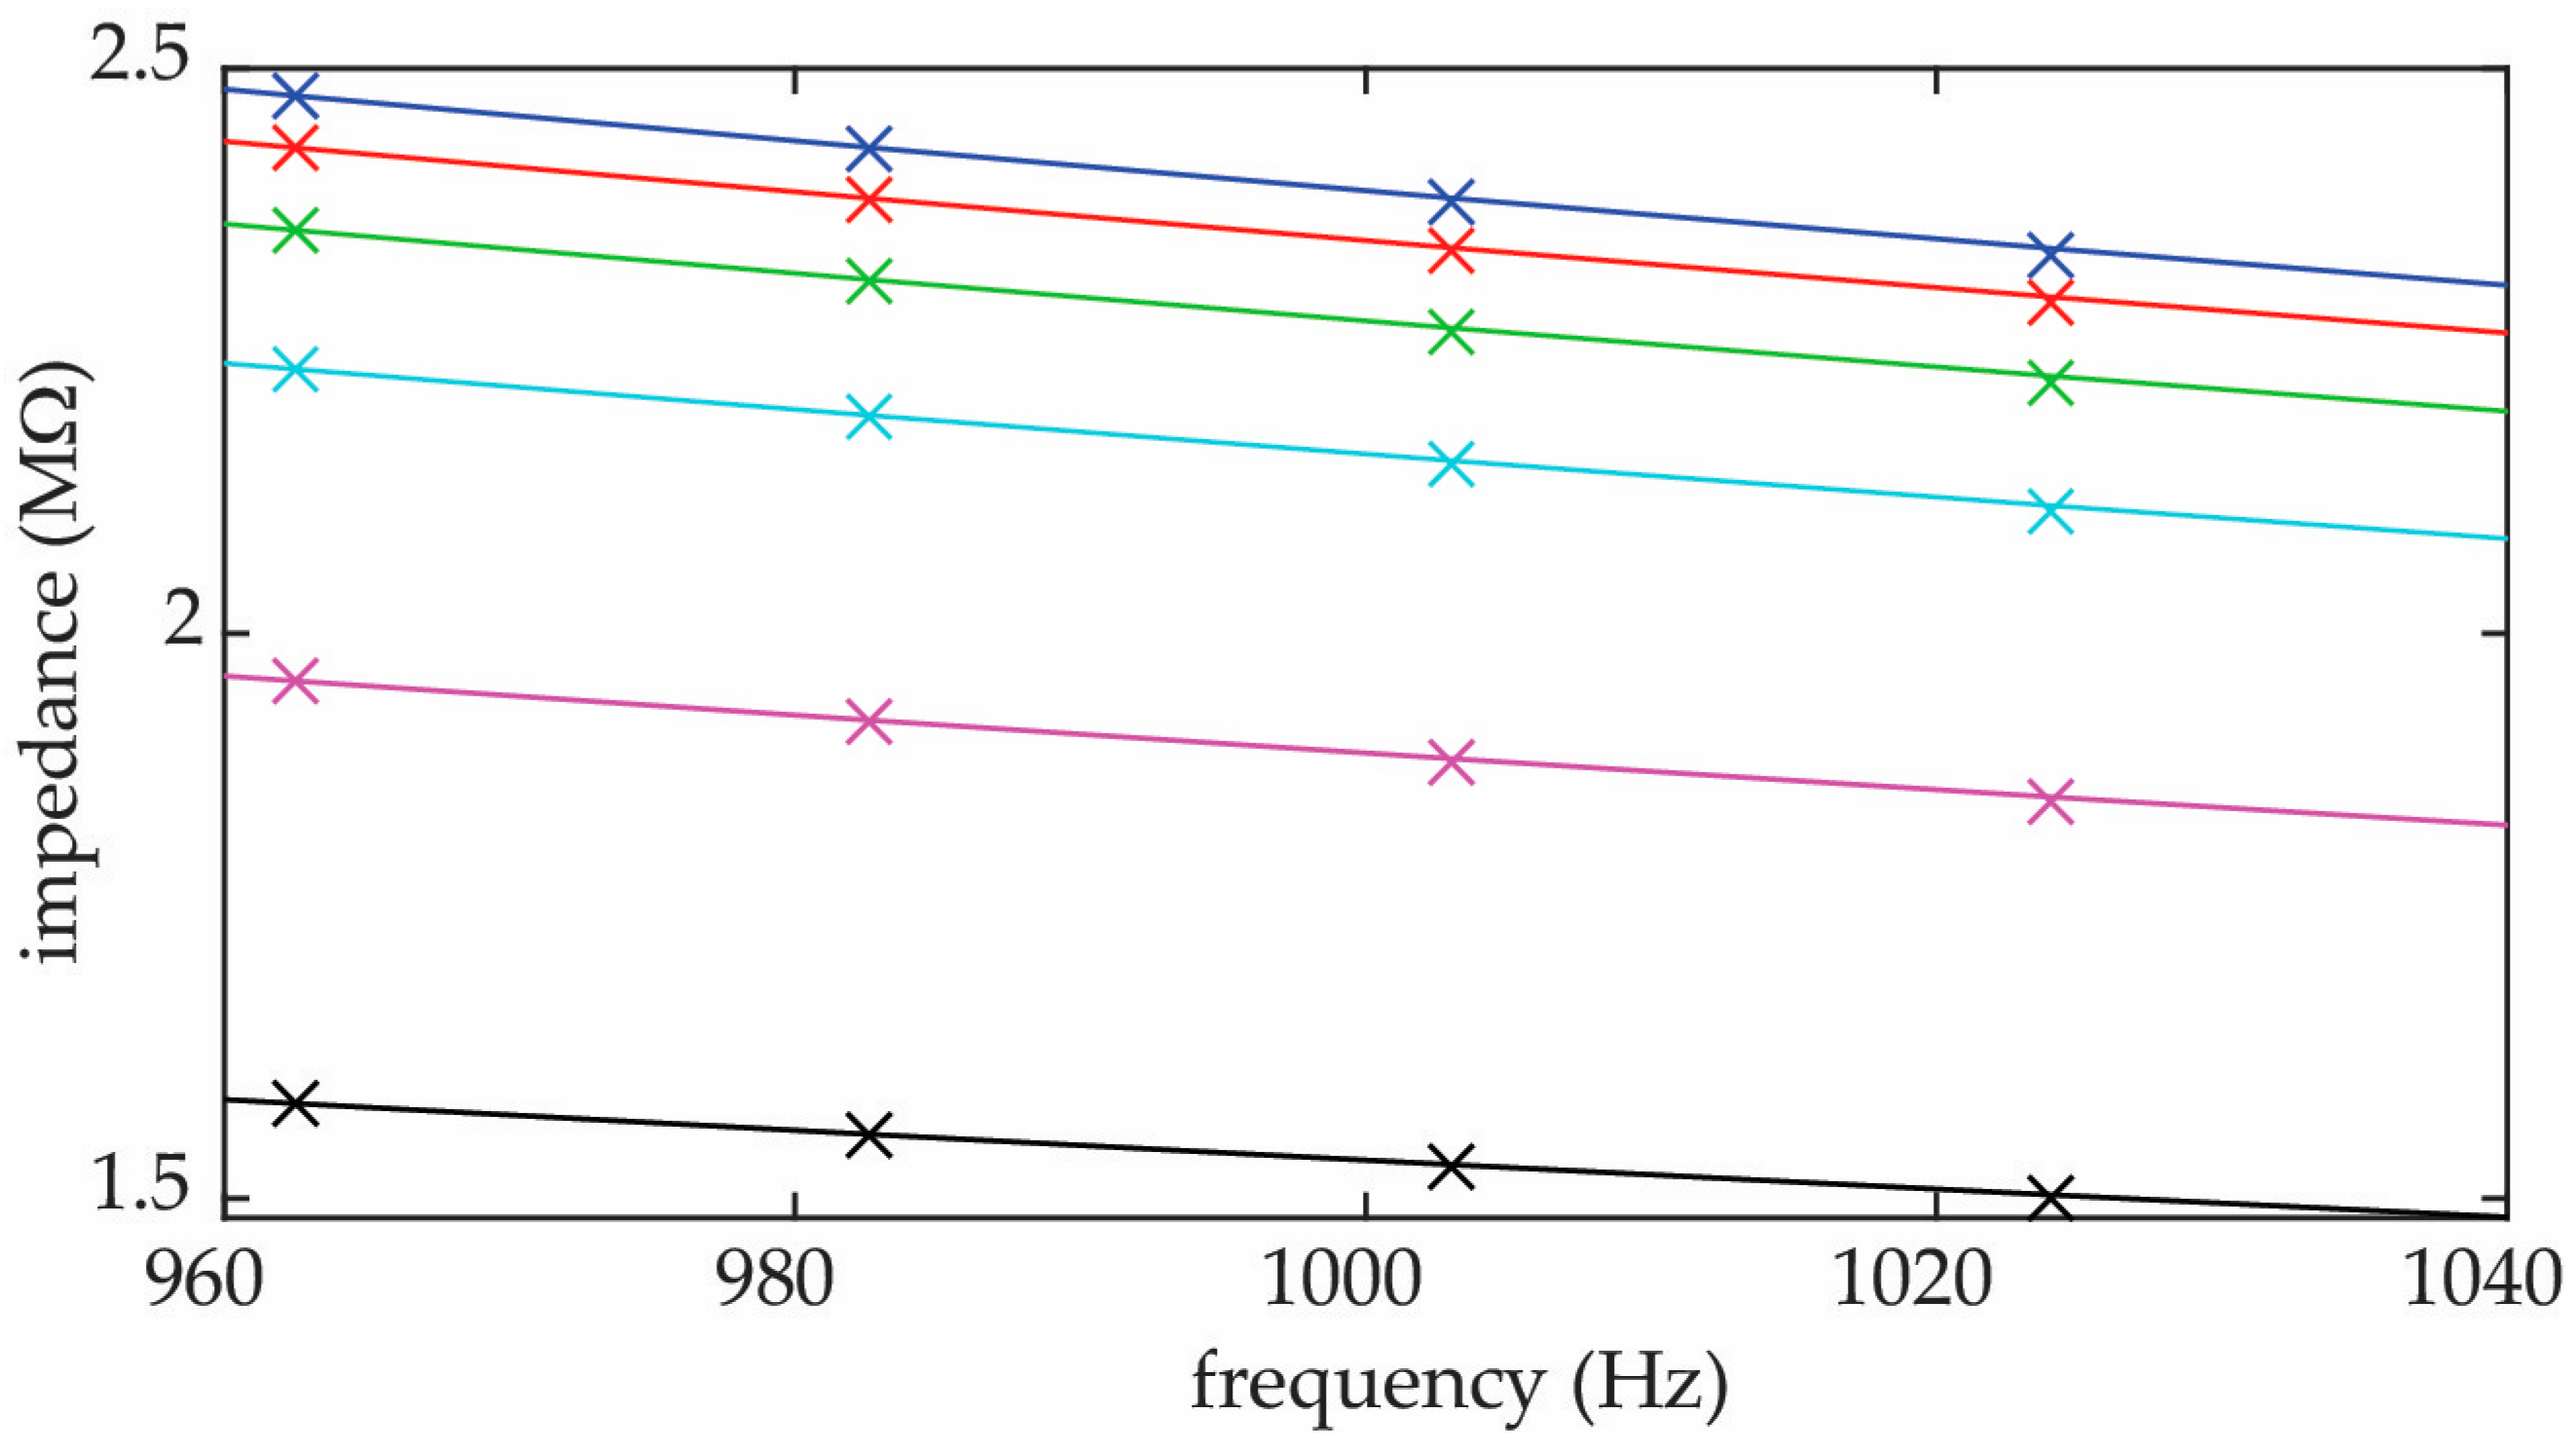
2.3. Impedance Measurement

The electrode geometry was optimized to attain the largest change in voltage as a function of pressure change. The inset in Figure 11 shows that the specific parameters that were varied were the electrode width and the gap between the electrodes. This requires optimizing the electrode geometry. To find the optimal electrode geometry, we designed a PCB with 36 varying finger widths and gaps: 6 finger gaps of 0.25 mm to 1.5 mm with 0.25 mm increments and 6 finger widths between 0.25 mm and 1.5 mm with similar increments of 0.25 mm. Figure 11 shows the board used to select the optimal geometry. Each electrode measured 25 mm by 25 mm.
The goal of the experiment was to determine what electrode characteristics maximize the change in impedance due to pressure, as well as considering the strength of the impedance to pressure correlation. The impedance-to-pressure correlation is critical because some electrode geometries may have appeared to exhibit the maximum impedance change due to pressure, but are not repeatable.
To adequately test the 36 different electrode geometries, JMP Version 17 statistical software was used [27]. Using JMP, the experiment was set up as a full factorial experiment. The experiment consisted of two independent variables for each test pressure in psi (0, 0.05, 0.075, 0.1, 0.2, 0.5, 1, and 2) and sensor electrode geometry (based on finger gap and finger width combinations). In total, 2592 tests were conducted. Each electrode was tested 72 times. Each of the defined pressures were tested 9 times per electrode in a random order. Each block tested one electrode 24 different times, testing each of the eight predefined pressures 3 times.
Figure 12 shows the ADMET eXpert 5603F [25] that was used to compress the foam to the listed pressure. The BK Precision 891 Benchtop LCR meter [26] was used to record impedance. The compression tester was set to ramp to the desired pressure and hold the position for five seconds. After five seconds, the compression tester returned to the zeroed position for five seconds, giving the NCPF time to recover before moving to the next pressure.
Once a block was complete, a data file that included the pressure and impedance was recorded. The data were recorded at a frequency of 4 Hz throughout the duration of the block test. After the 2592 tests had been performed and the average impedance at each pressure level was obtained, the data were analyzed using JMP. Table 1 shows the results of the data with respect to the effect of the finger width, w, and finger gap, g.
The relationship between the impedance and the finger gap, g, and finger width, w, is given by Equation (1):
Z = 2.43 · 10 6 + 2.69 · 10 6 g + 0.244 · 10 6 w .
Finger gaps of 0.25 mm to 1.5 mm with 0.25 mm increments were found to increase the impedance by 2.69 MΩ per mm, with a 95% confidence interval of 2.62 MΩ to 2.75 MΩ. The finger widths between 0.25 mm and 1.5 mm with similar increments of 0.25 mm were found to decrease the measured impedance by 207 kΩ per mm, with a 95% confidence interval of 269 kΩ to 144 kΩ. There was an intercept of 2.44 MΩ, with a 95% confidence interval of 2.36 MΩ to 2.52 MΩ. These results demonstrate that the design variables are significant and meaningful when designing for non-loaded impedance.
The analysis found that the electrode structure with the smallest finger gap produced the best correlation and best sensitivity to pressure. The finger width was less sensitive. Therefore, the electrode used had a finger gap of 0.25 mm and finger width of 1.5 mm. Applied pressures between 0 and 2 psi were shown to decrease the normalized impedance by 0.25% per PSI, with a confidence interval of 0.265% to 0.253% (p-value < 0.0001).
In addition to the measurement of the impedance versus pressure of the electrodes, there was concern about the effect of the electrode changes on the reliability and durability. None of the 36 electrodes failed during the 2592 tests; therefore, it was assumed that electrode optimization does not affect the durability and reliability. However, testing to failure should be left as a focus for future studies.
The second factor in estimating the measuring the pressure is measuring the impedance using the voltage divider. The voltage divider produces a voltage given by
V A D C = Z N C P F Z N C P F + R V P W M ,
where VADC is the measured voltage amplitude, VPWM is the excitation amplitude, ZNCPF is the impedance being measured, and R is the known resistance. The amplitude of the PWM signal was known, and had a root-mean-square (RMS) amplitude of V P W M = 3.3 2 = 2.33 .

3. Results

A modular method allows different surfaces to be mapped without the need for a custom design. A modular design would allow a car seat to be mapped with the same hardware and circuitry as a bed, shoe, helmet, or any other surface. Creating large PCBs is expensive, making a large matrix on a single PCB a poor approach and not modular. Small PCBs provide the ability to daisy-chain; however, the capacitance of long traces would negatively affect the measured pressure signal. The electrode capacitance was around 60 pF (see Figure 9); thus, the traces between electrode and MCU needed to be sufficiently short that they would not add more than a couple of picofarads to the trace, as much more than that would incur a significant change to the impedance of the NCPF electrode.
With this restriction in mind, a direct solution was to place an MCU on each small PCB to measure the electrode matrix. Once the signal was measured and recorded by the MCU, the data were transferred via I2C to a master device to compile the data from each pressure matrix. The data were then saved to a file or displayed on a user’s device.

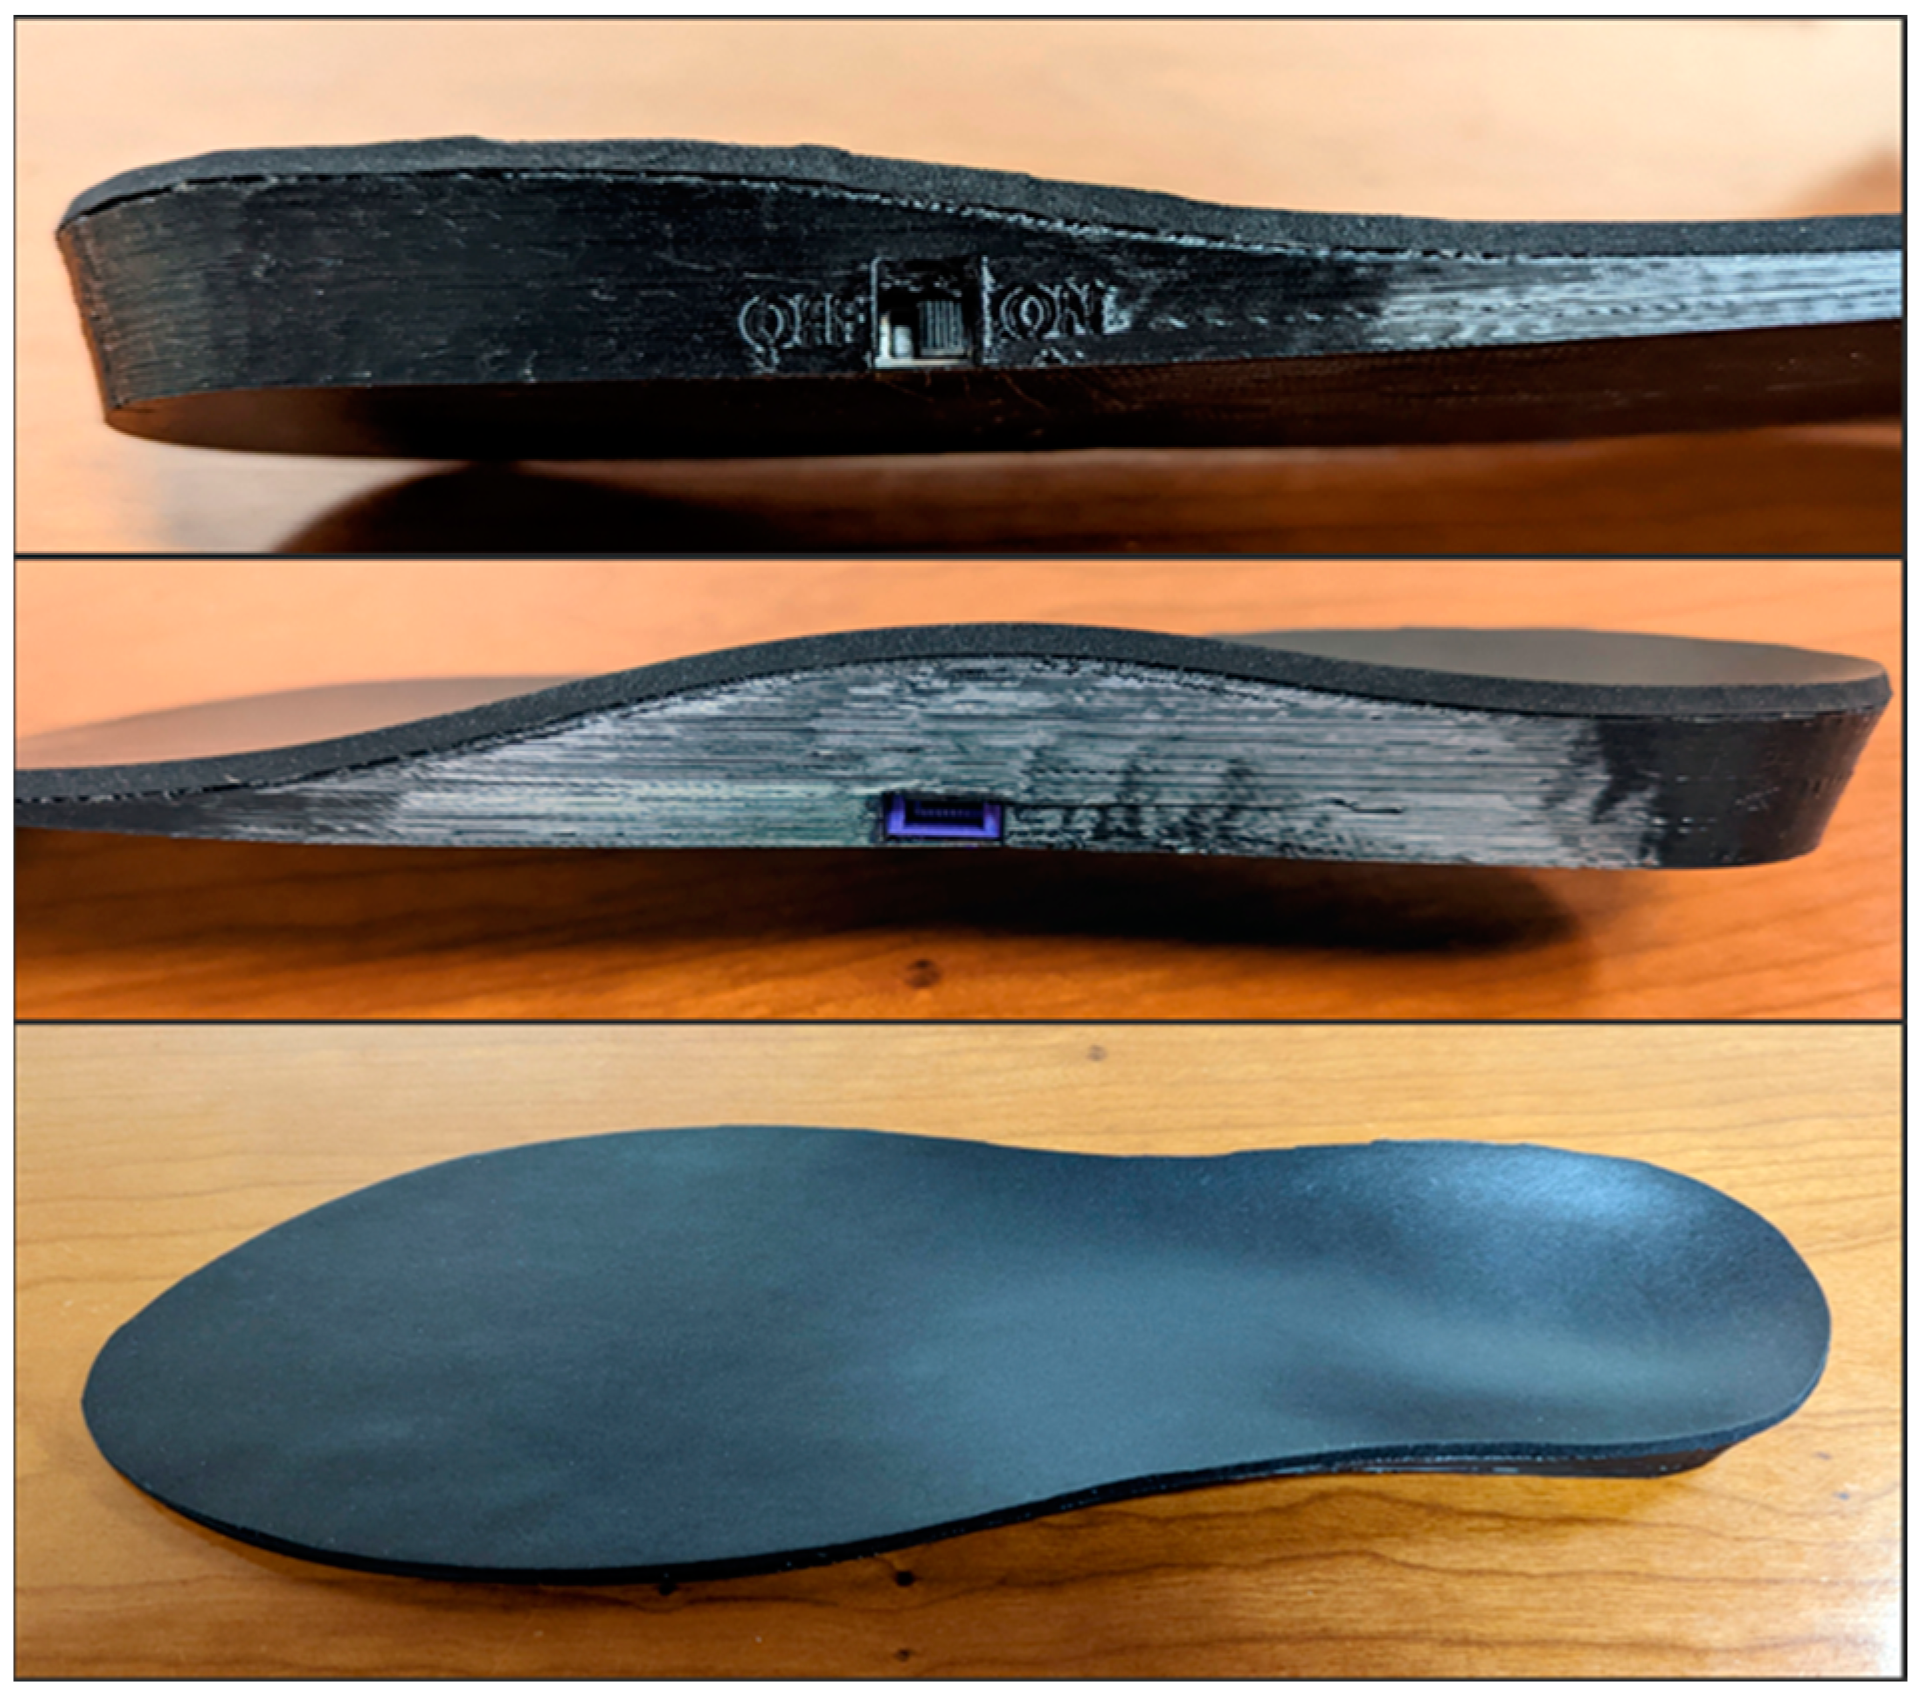
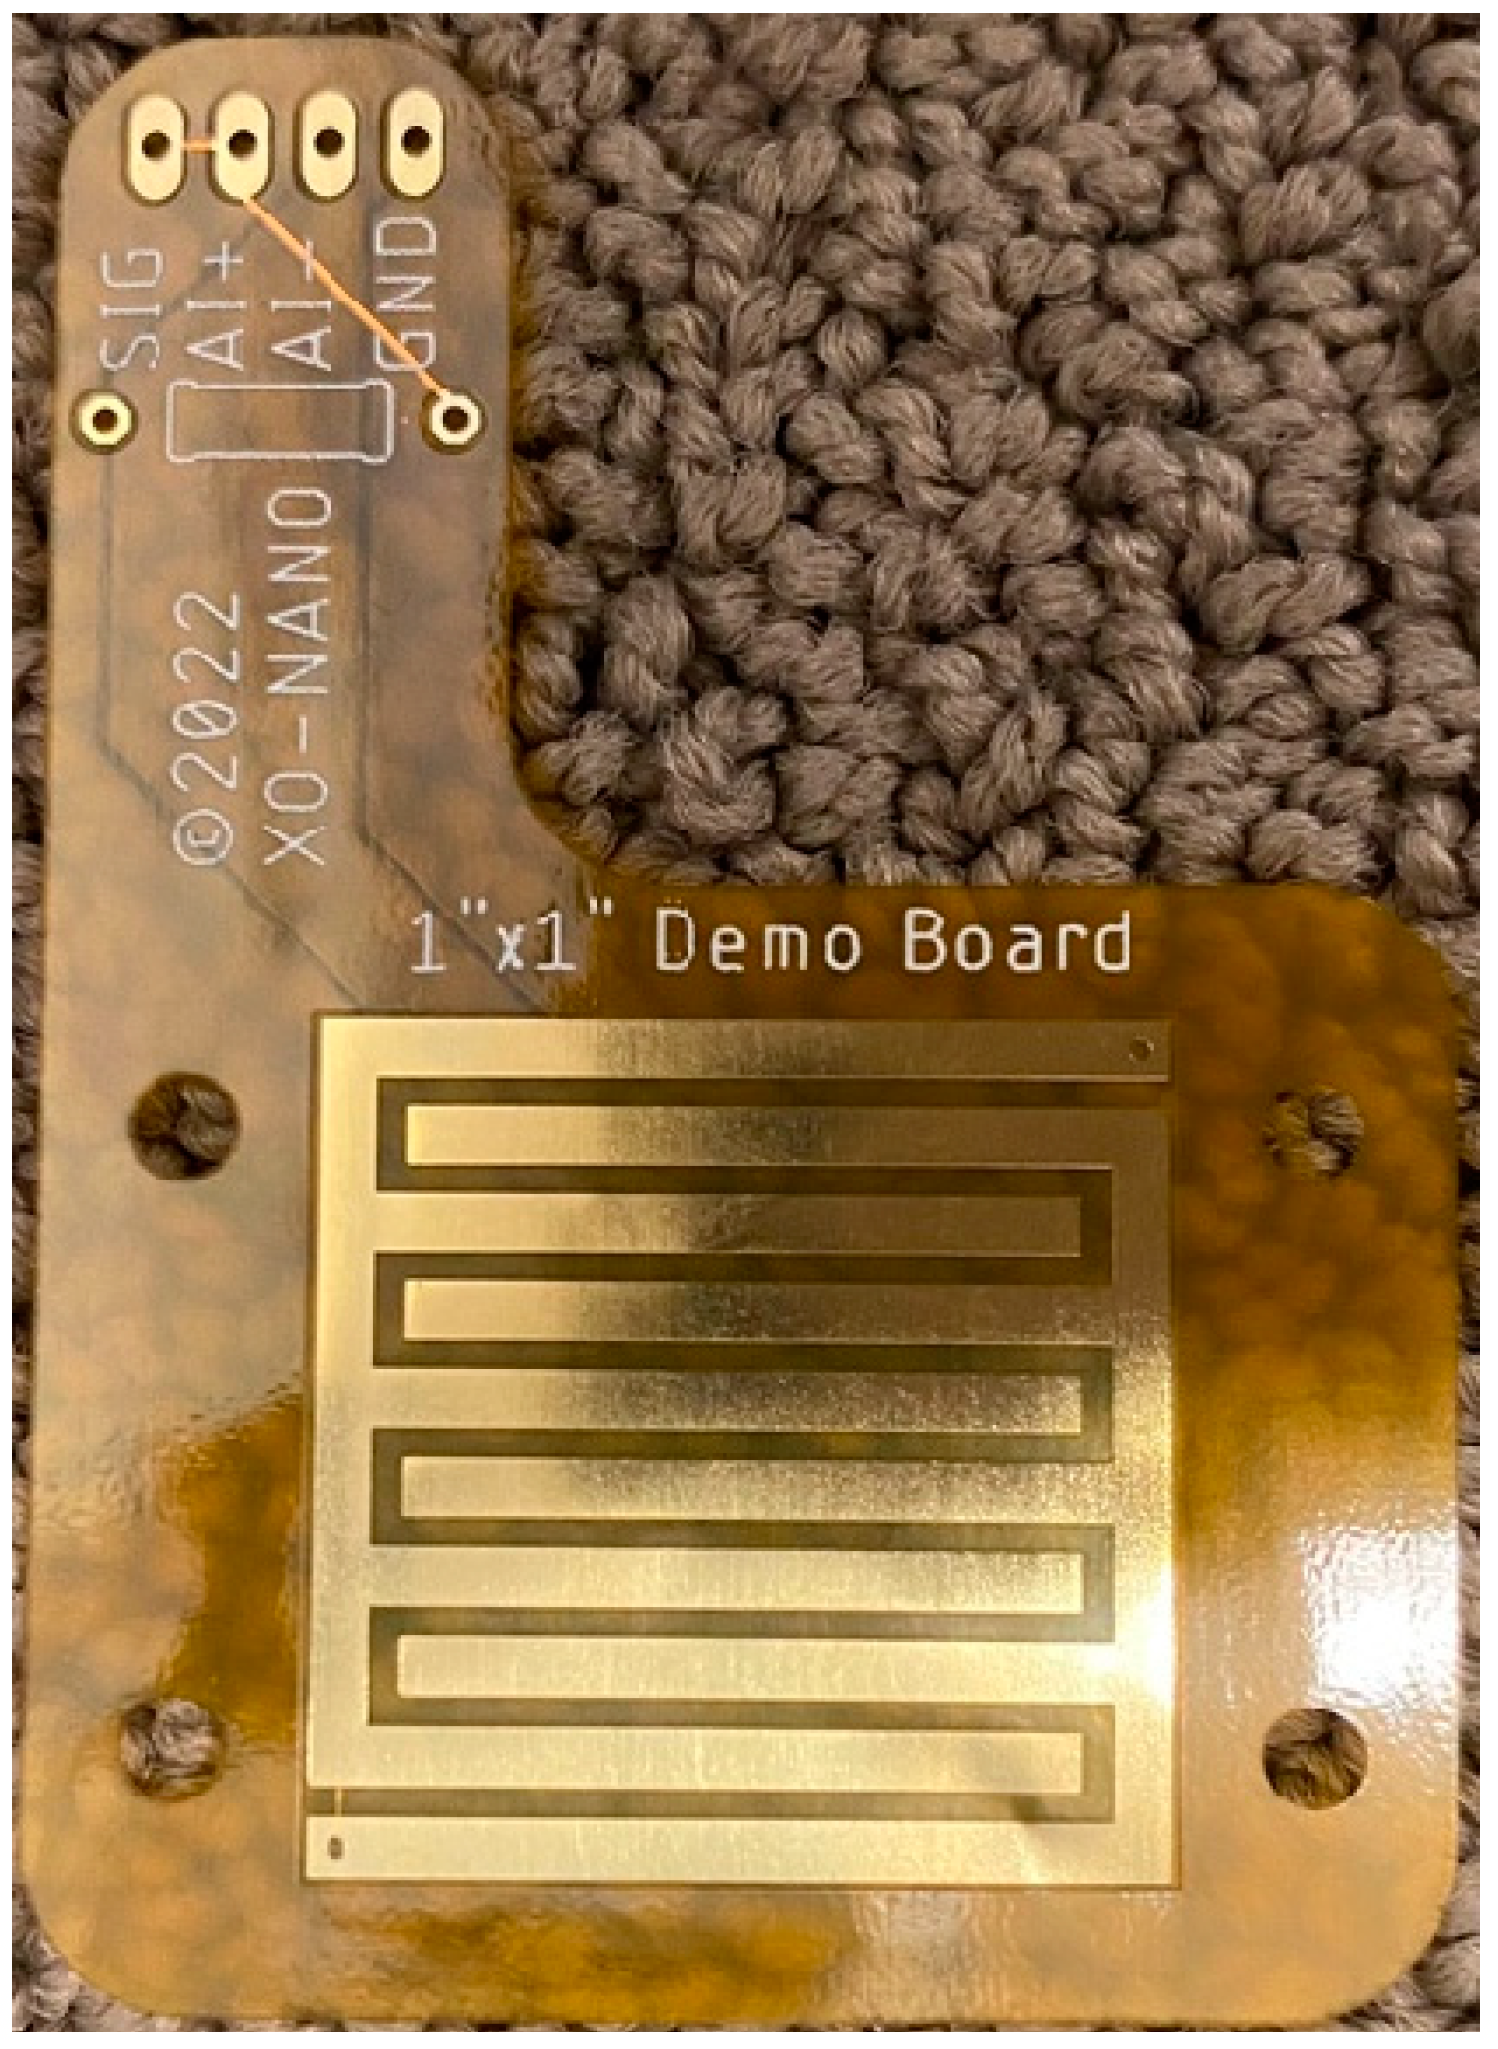
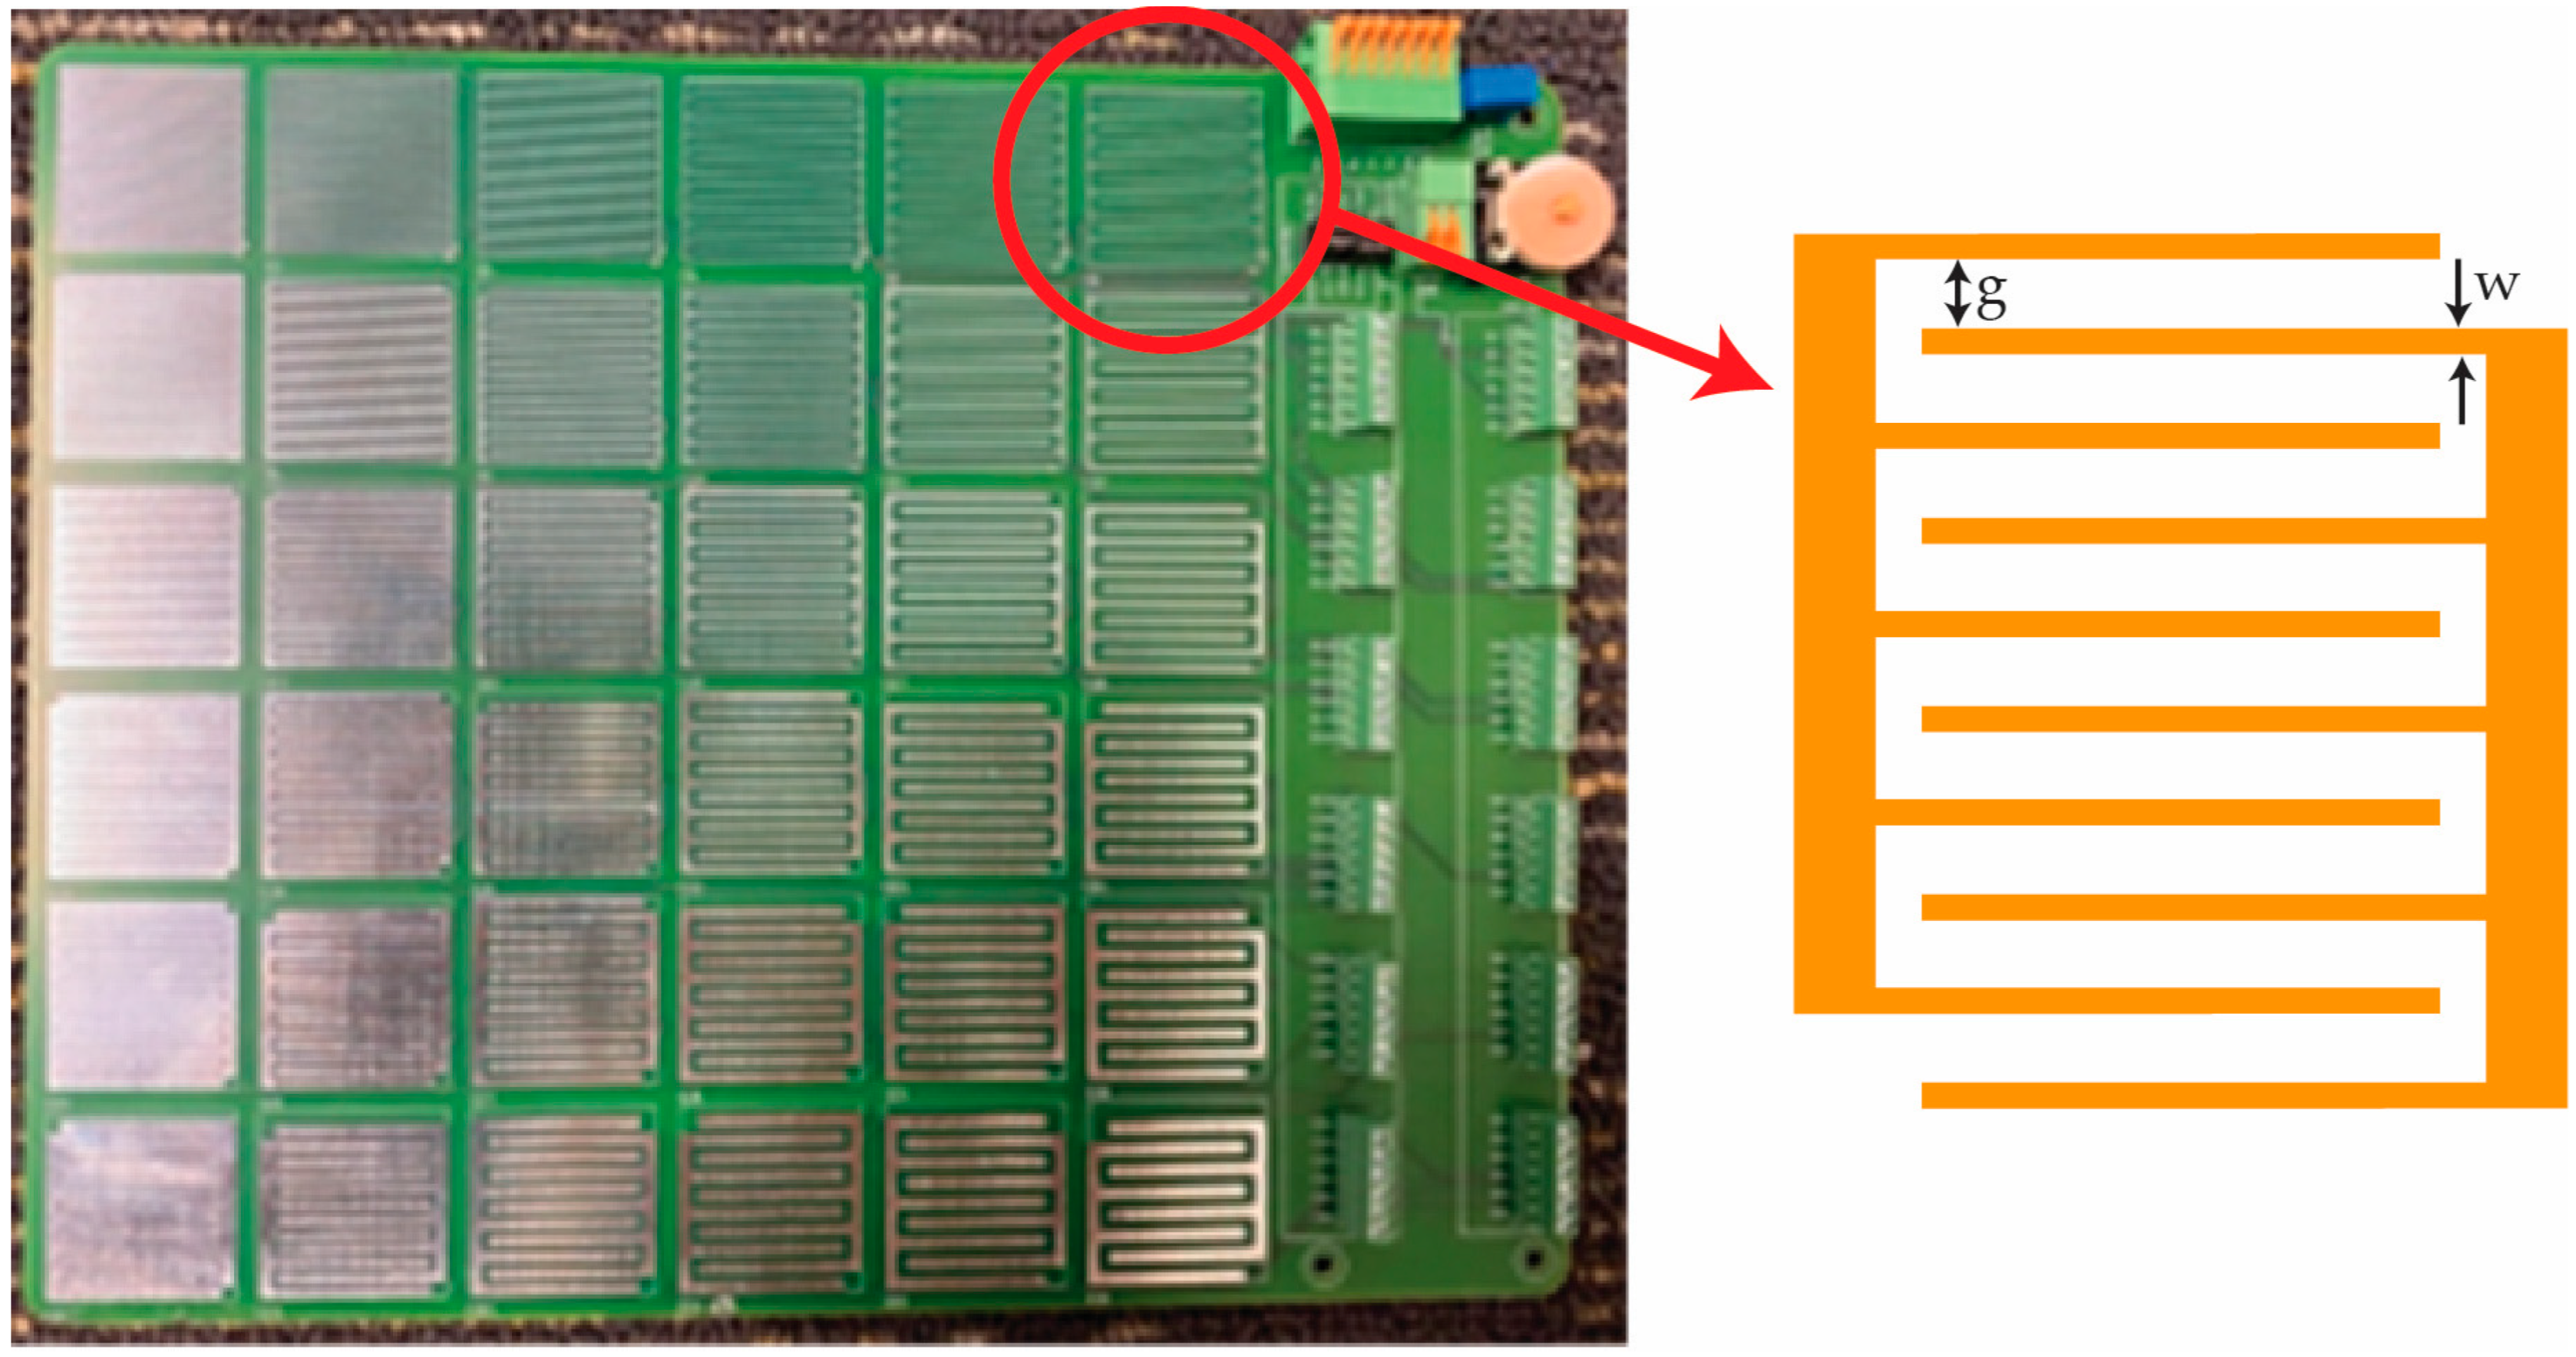
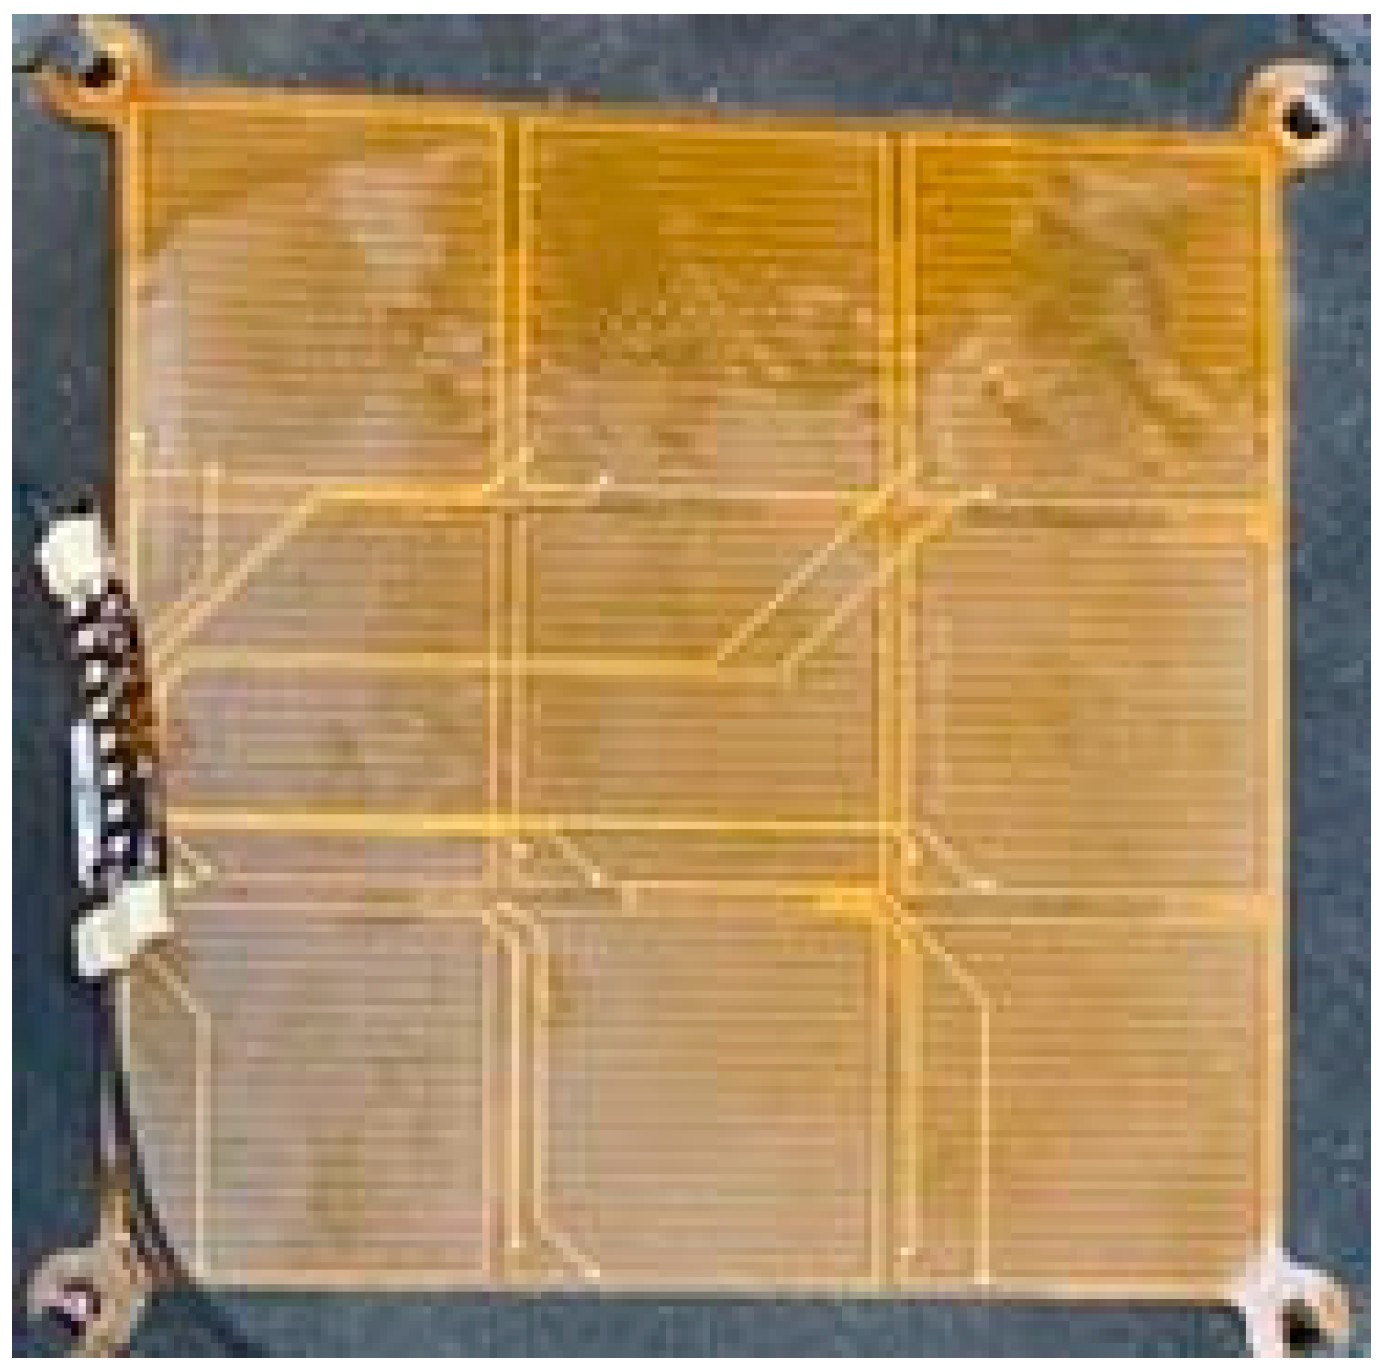
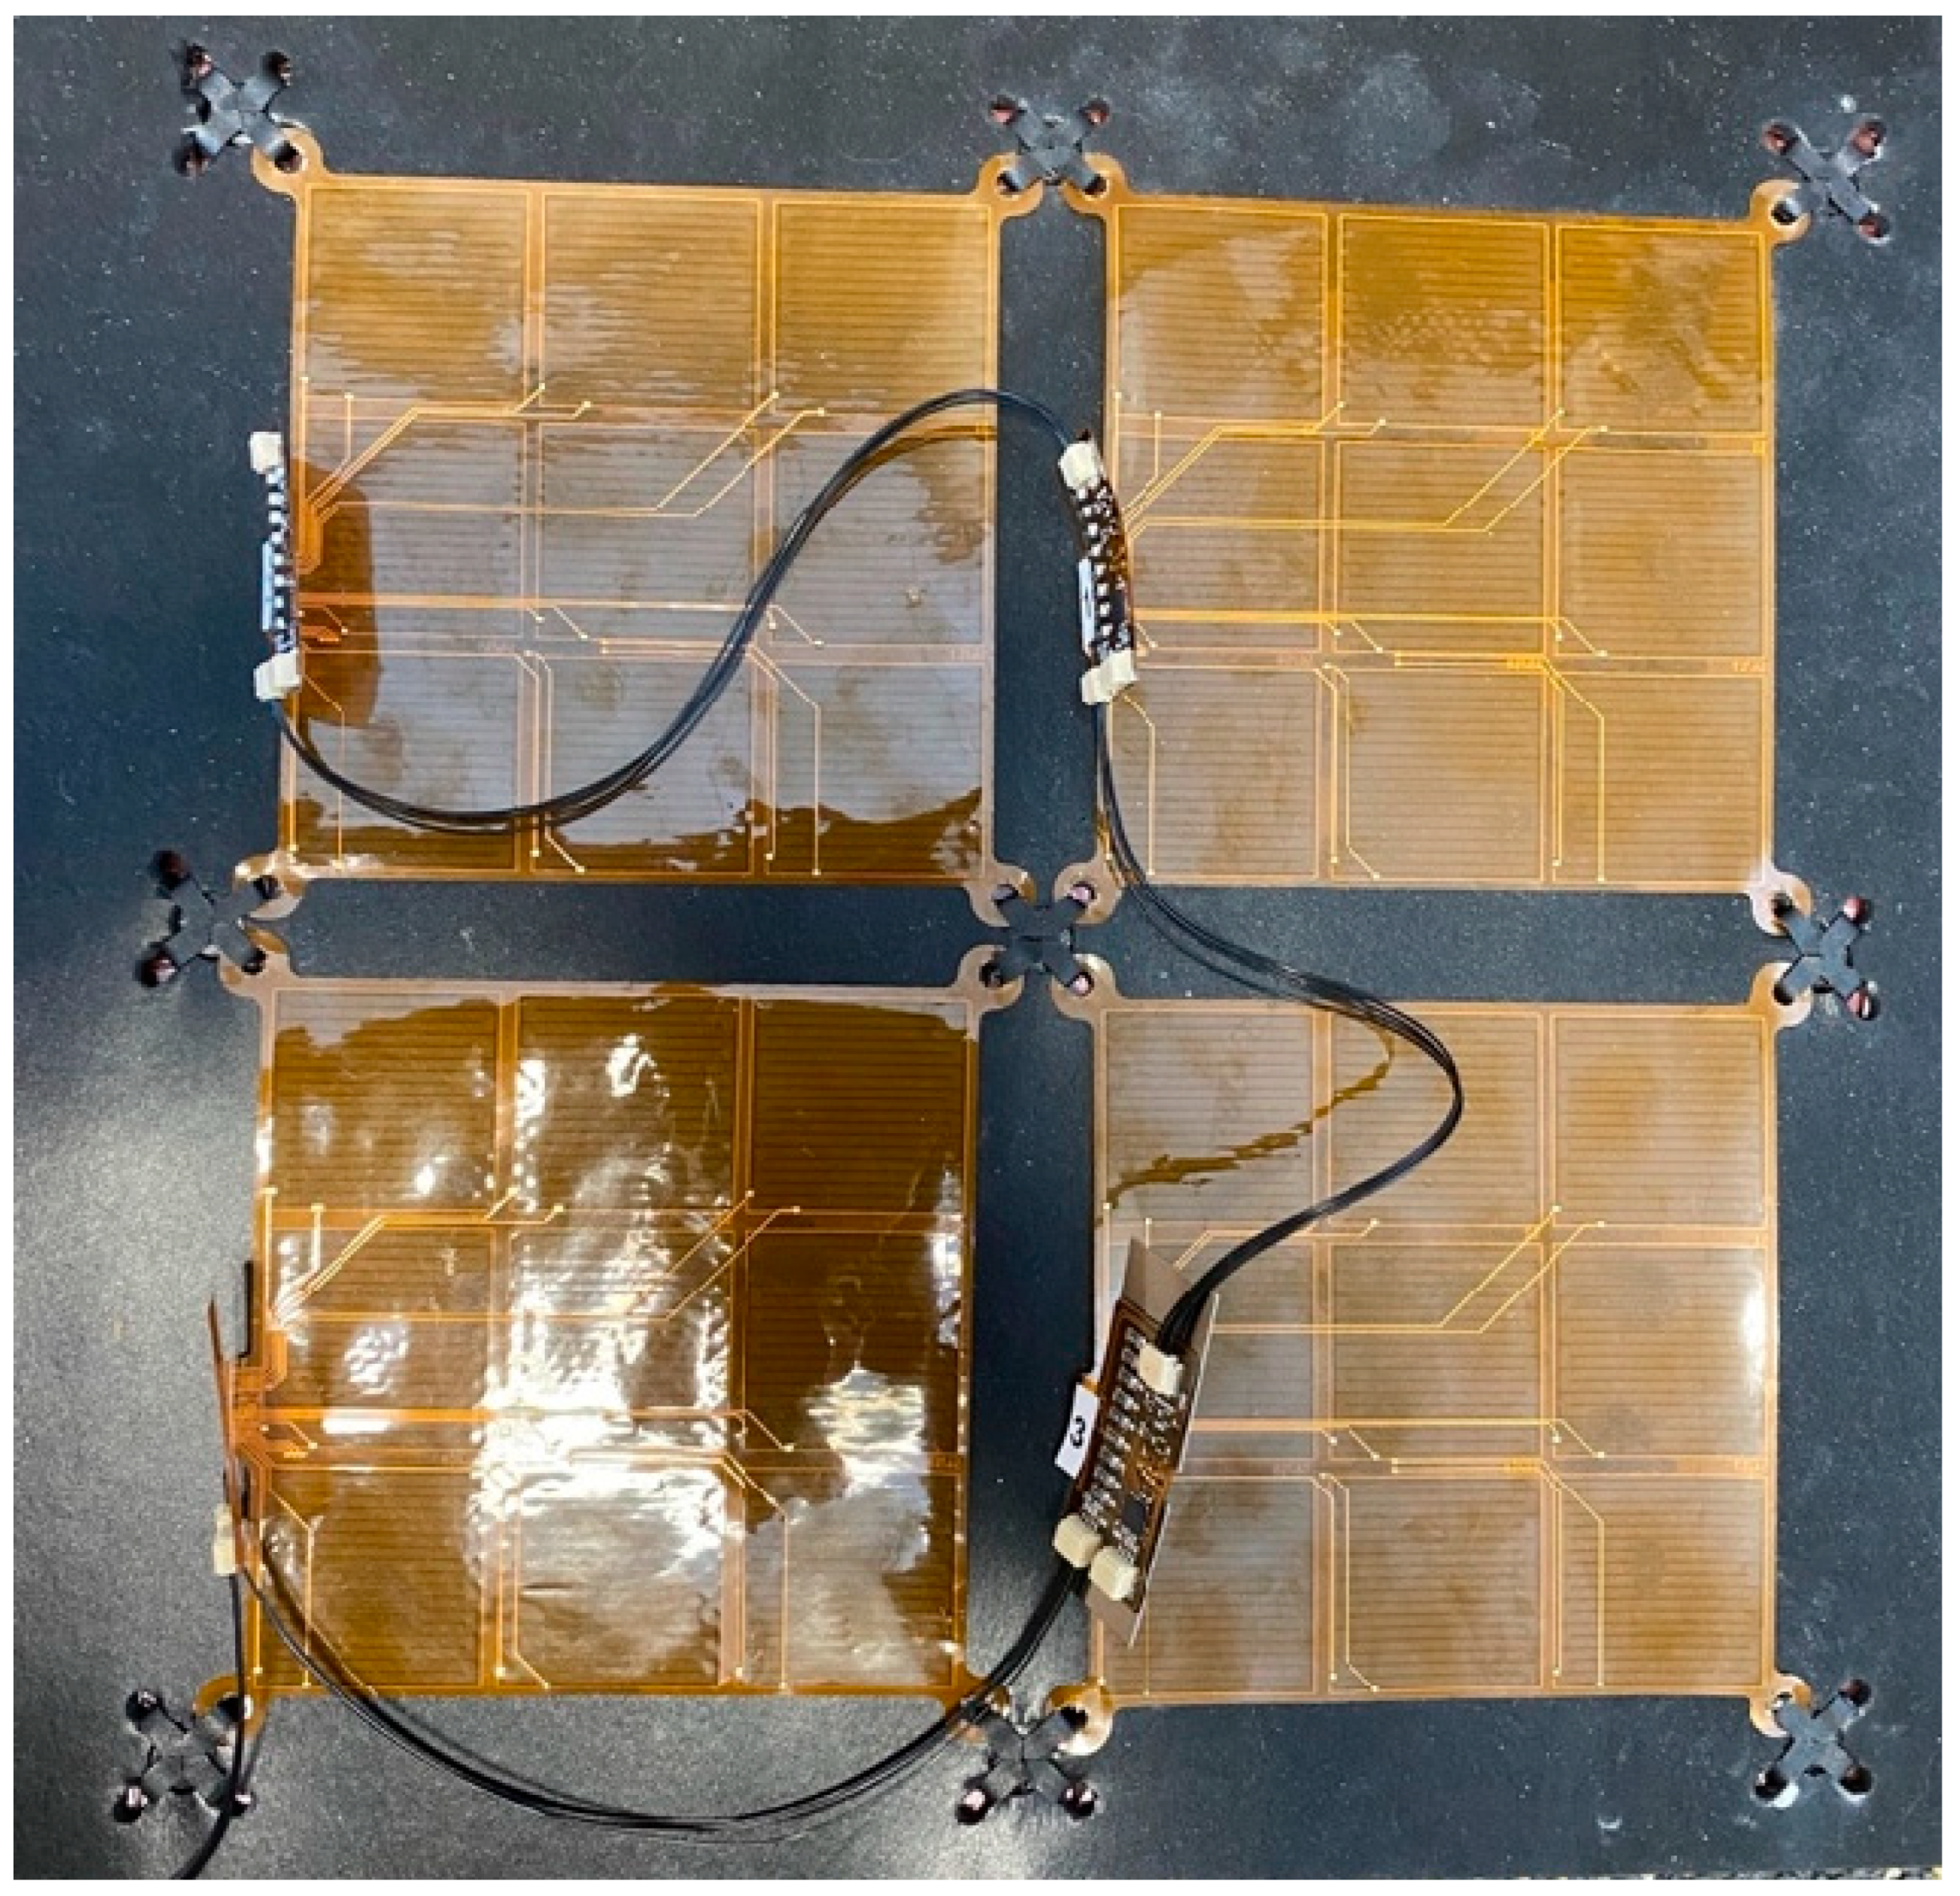
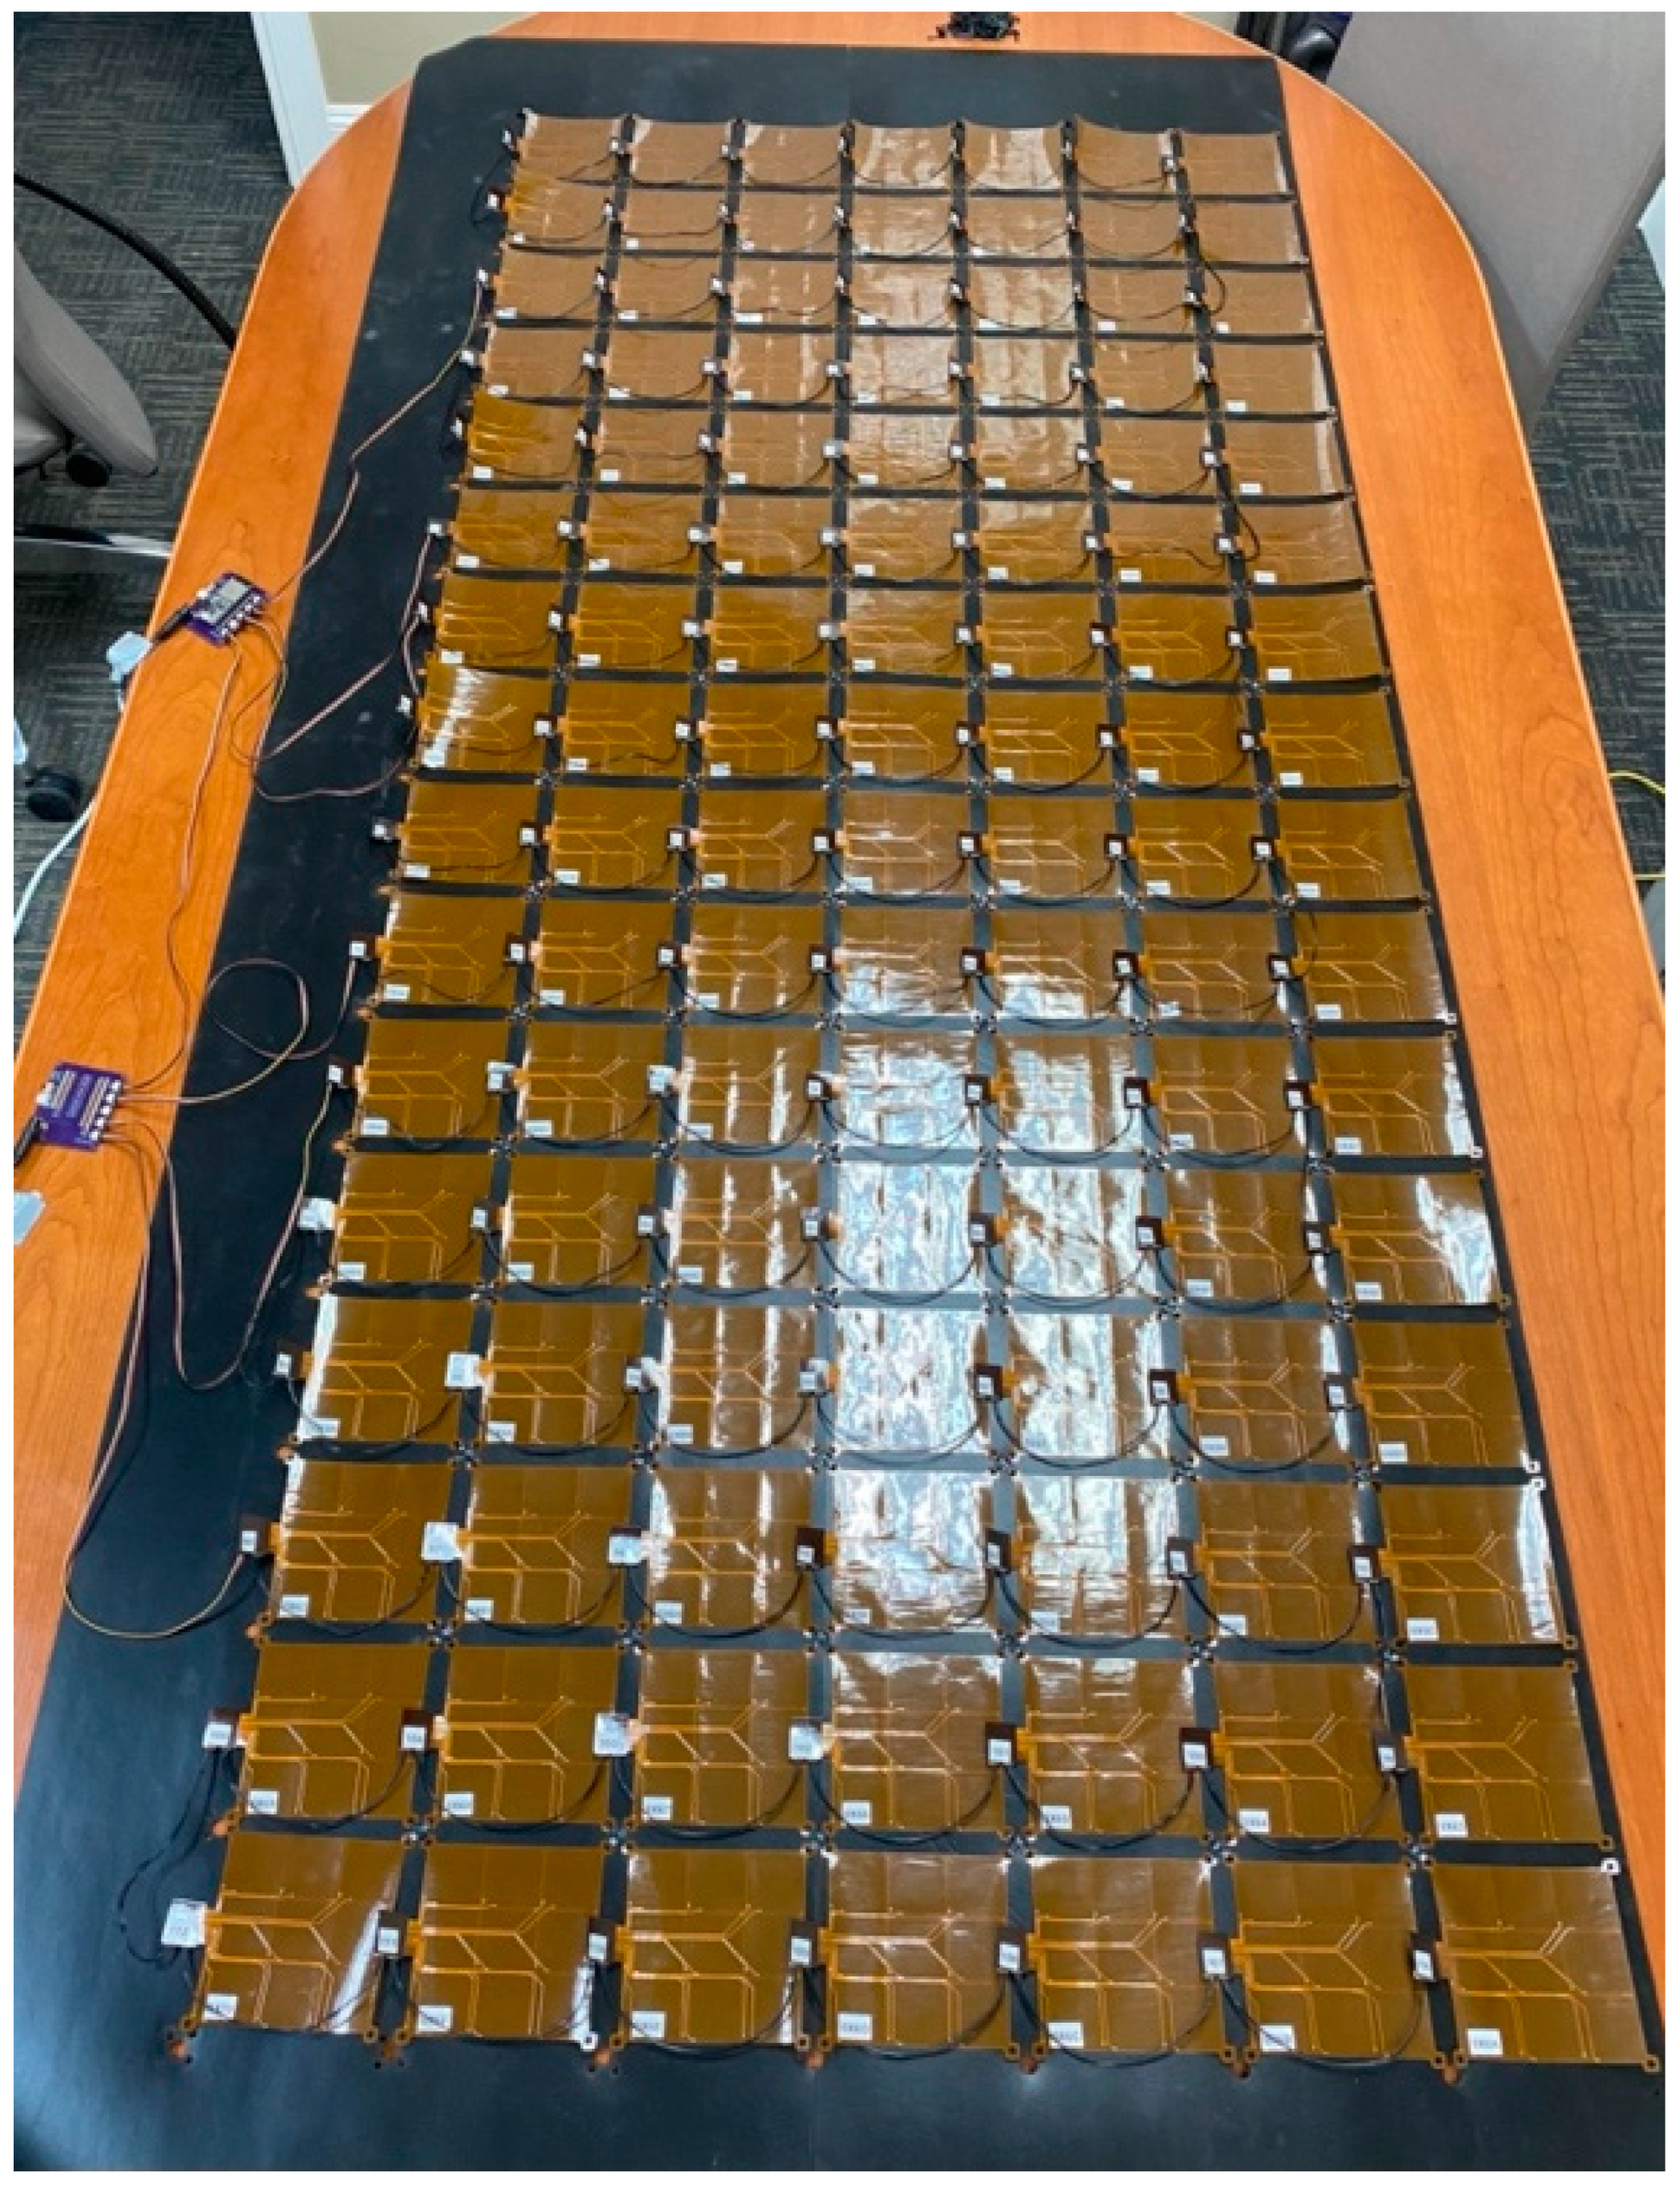
3.1. Electrode Array

Figure 13 shows the electrode replicated a total of nine times on the small PCB in a matrix, which allowed for some spatial resolution for the pressure mapping. The electrode was fabricated on a flexible PCB with a total area of 25 mm by 25 mm with a finger width of 1.5 mm and finger gap of 0.25 mm. A polyimide electrode was used for the PCB body. The flexibility this PCB offers enables the system to be positioned in places that favor the NCPF-enabled pressure sensing system. Notably, there is a stiffener used behind the area where the components are soldered to the flexible PCB to increase durability. The stiffener contains extra layers of polyimide, as well as a ground plane to also reduce noise.
A single ATtiny1627 was placed near the set of nine electrodes. As shown in Figure 2, the ATtiny produced a 1 kHz PWM signal that was connected to nine resistors and then to each electrode and nine ADC channels. The nine resistor values were 10 MΩ, 12 MΩ, 13 MΩ, 12 MΩ, 12 MΩ, 12 MΩ, 12 MΩ, 13 MΩ, and 13 MΩ. The ATtiny1627, which behaved as the slave in this system, was programmed using MPLAB [24]. The programming started with creating a PWM using an IO pin. The ADC channels were set to sample at a rate of 18.5 kHz. The RMS amplitude was determined using 250 ADC samples for each electrode. Pressure was applied to the flexible electrode while monitoring the RMS voltage. The voltage was fit using the following equation:
P = 1.523183 1.030069 · V 0.7731754 ,
where P is the pressure measured in psi and V is the RMS voltage.
Figure 14 shows how the flexible arrays were connected to each other and to the NCPF. There were 3D-printed clasps made of thermoplastic polyurethane to secure the electrode array to the NCPF. Each clasp had four legs, each of which threaded the ear hole on each corner of adjacent flexible arrays, and then plugged into the body of the clasp. Each flexible PCB had a unique I2C address which allowed the master device to communicate with each array independently and retrieve the RMS data. Combining the four flexible arrays seen in Figure 14 served as an initial proof that combining several arrays could function with a single master device.
After verifying the four-array system, the design was scaled to a larger surface. Figure 15 illustrates how using the modular design could provide the ability to pressure-map very large surfaces. This image shows 112 arrays working together to allow for pressure mapping while maintaining the use of a single master device to receive data from each array via I2C. The master device was capable of a refresh rate of 3 Hz when managing all 1008 electrodes.

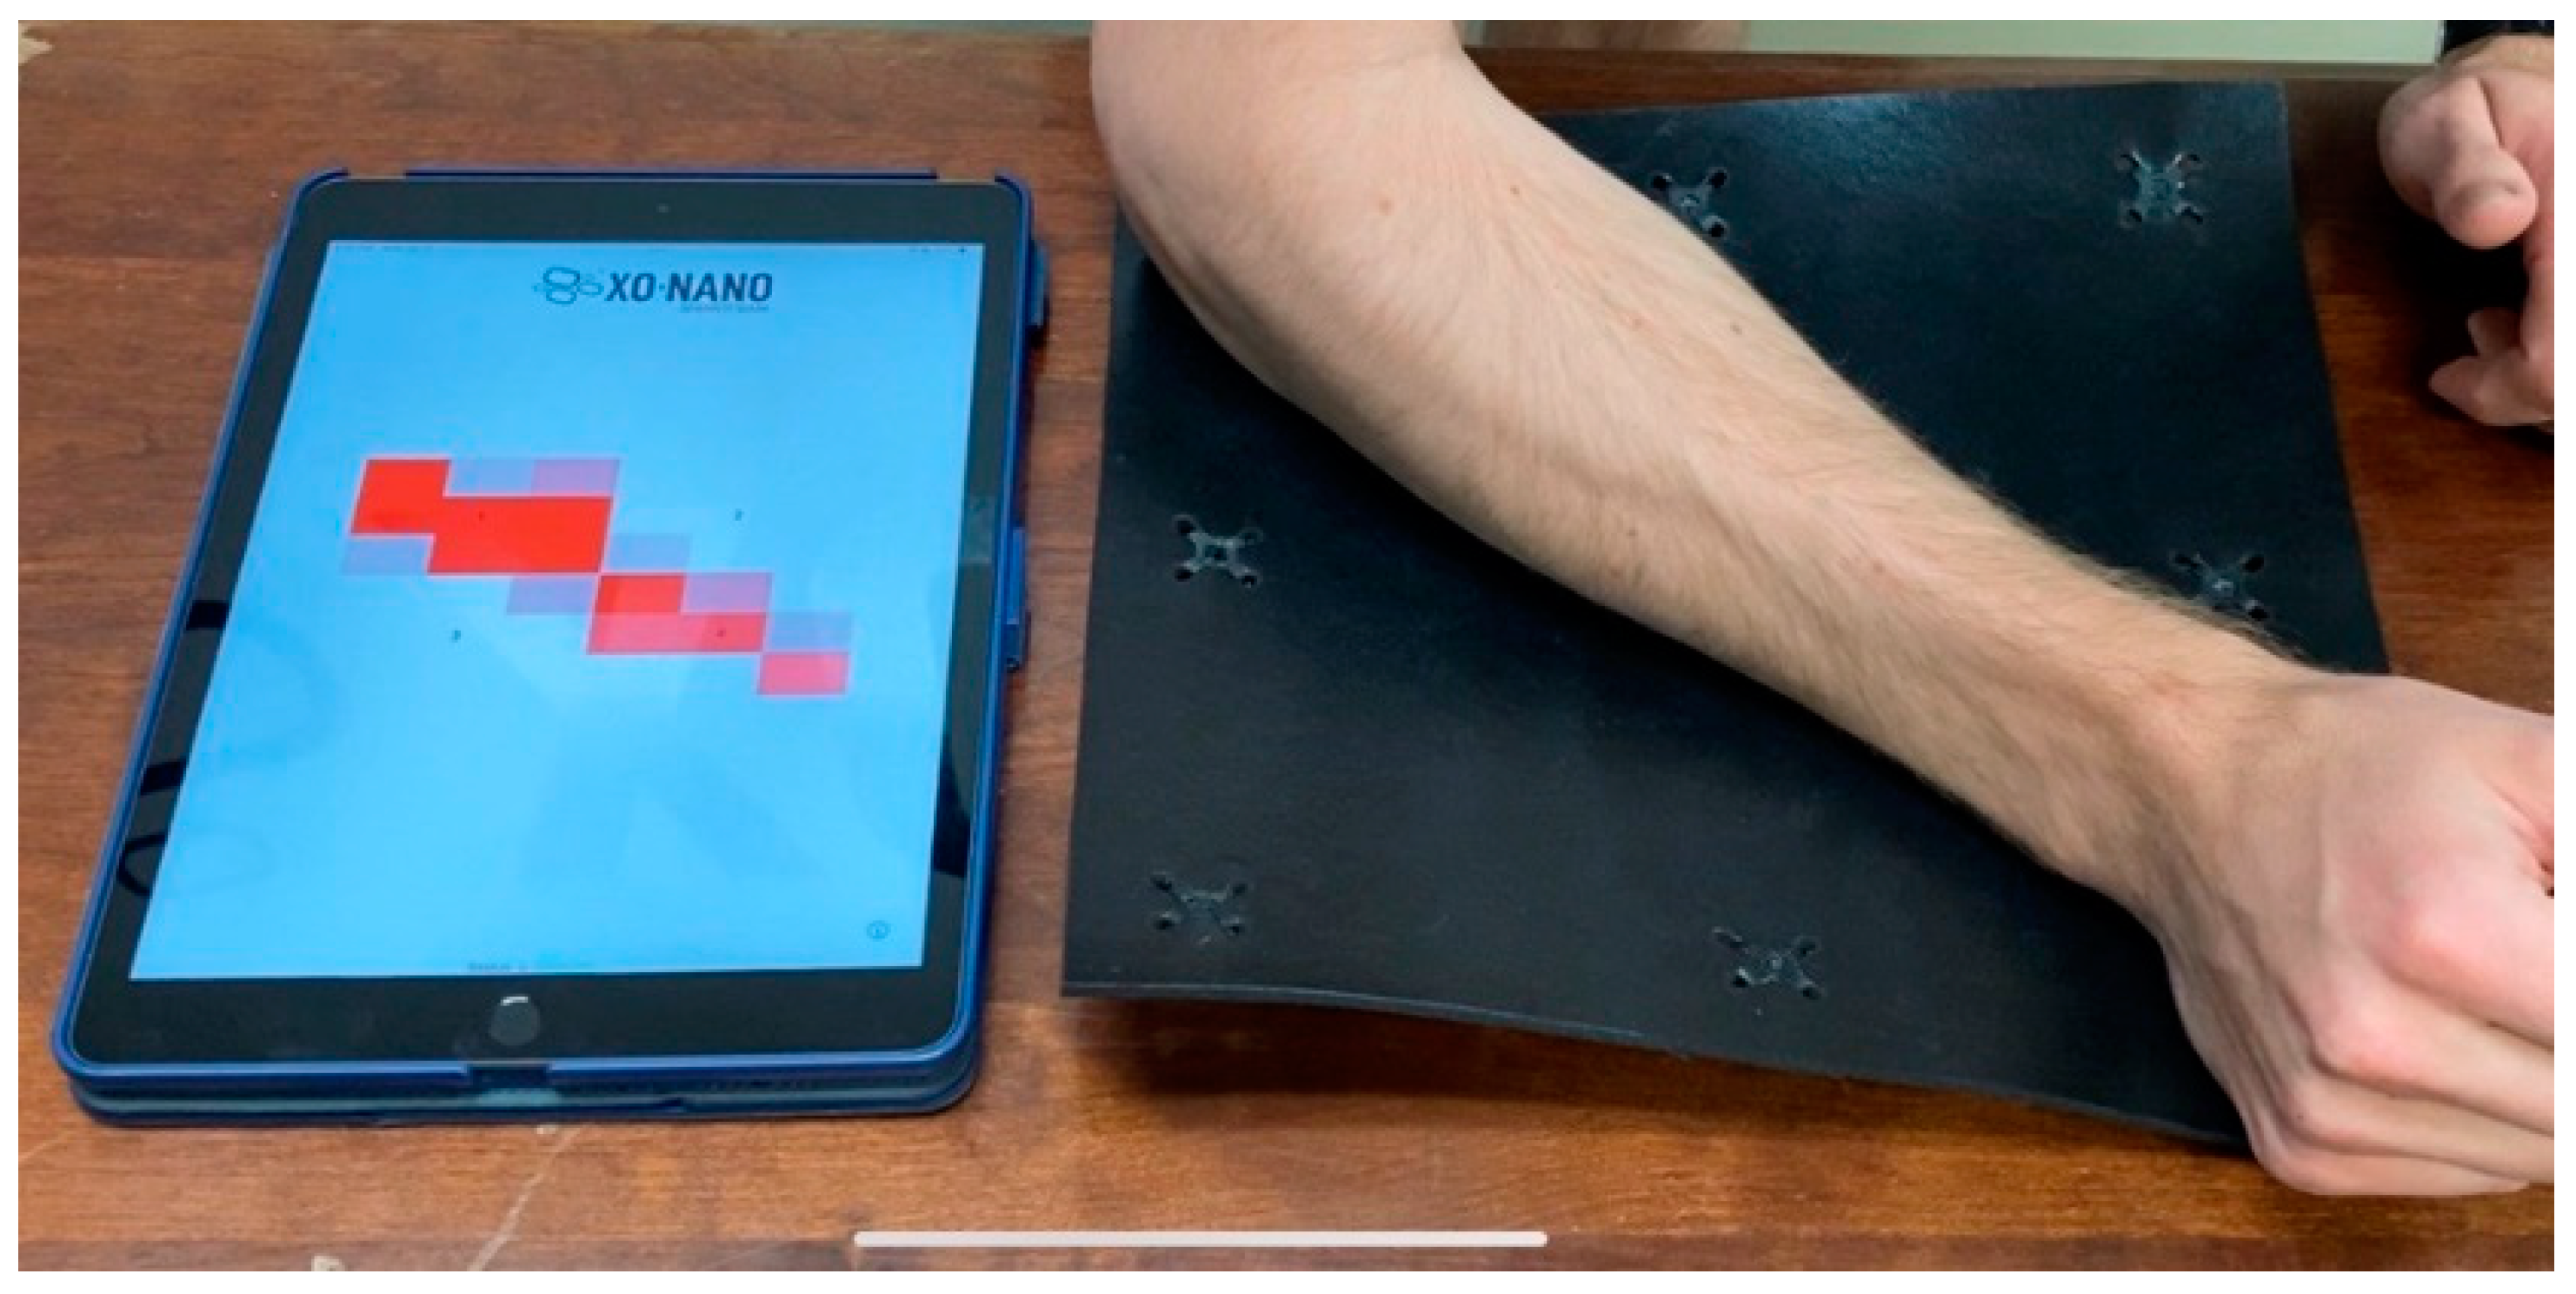
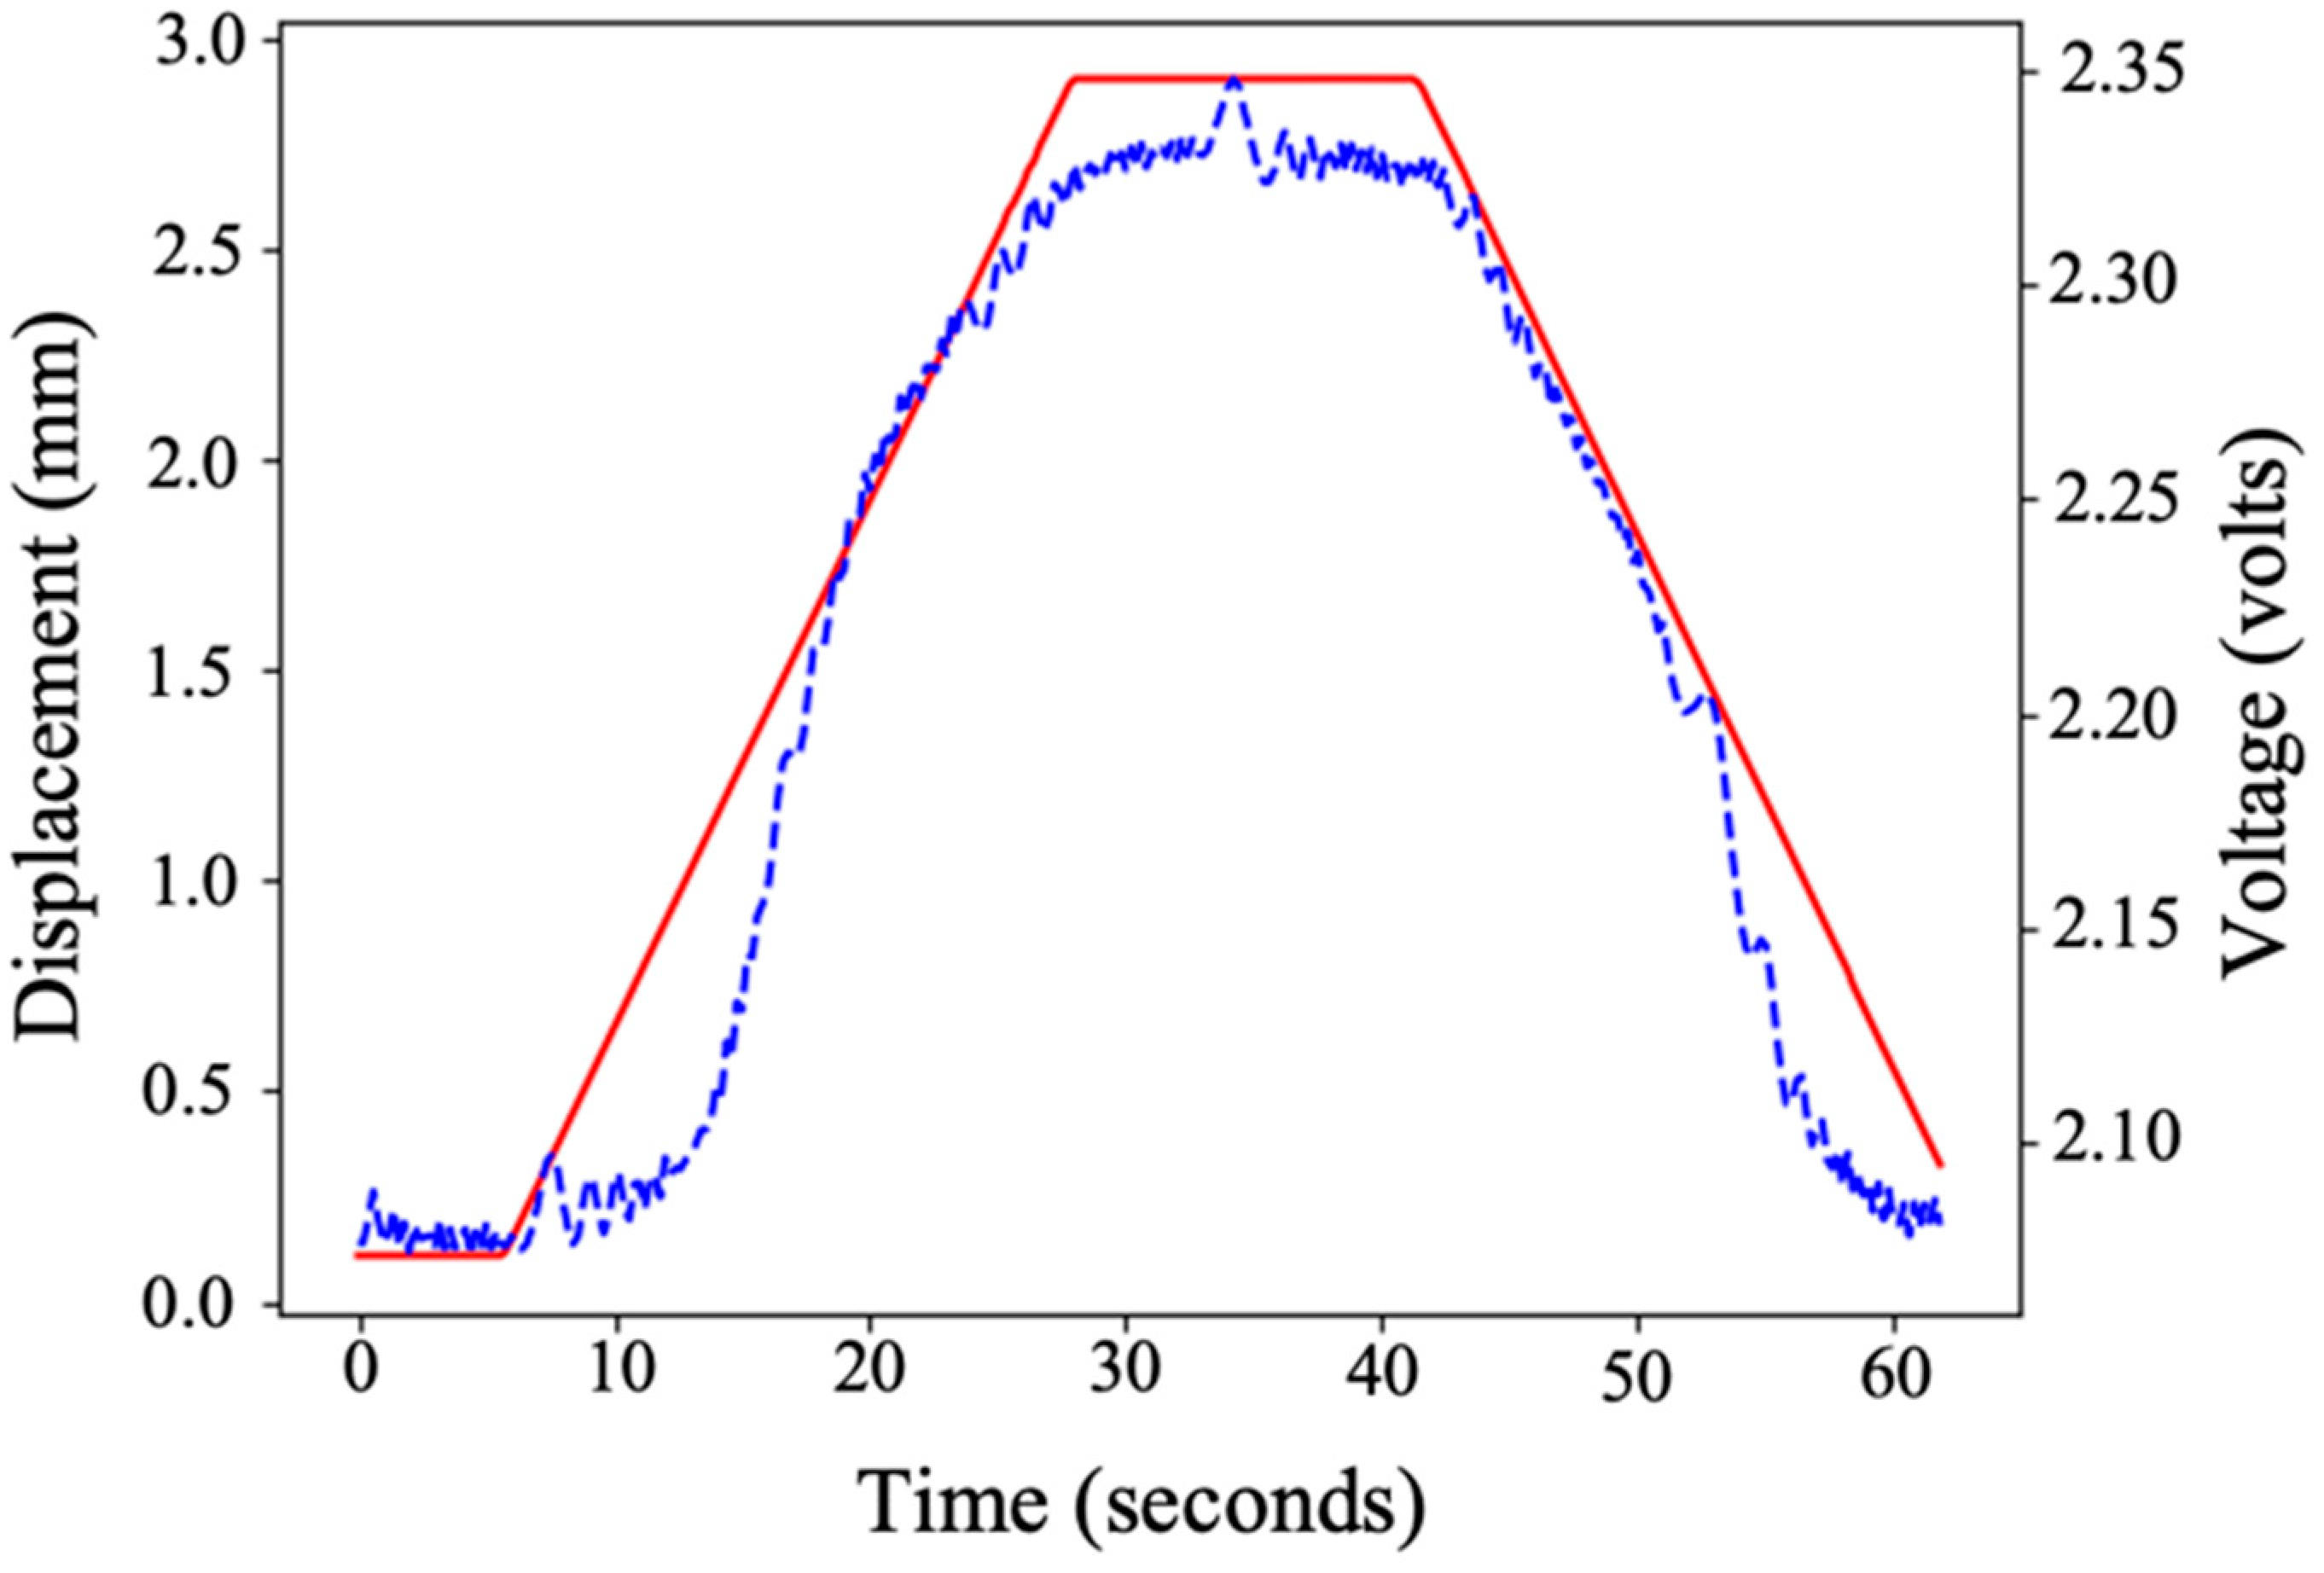
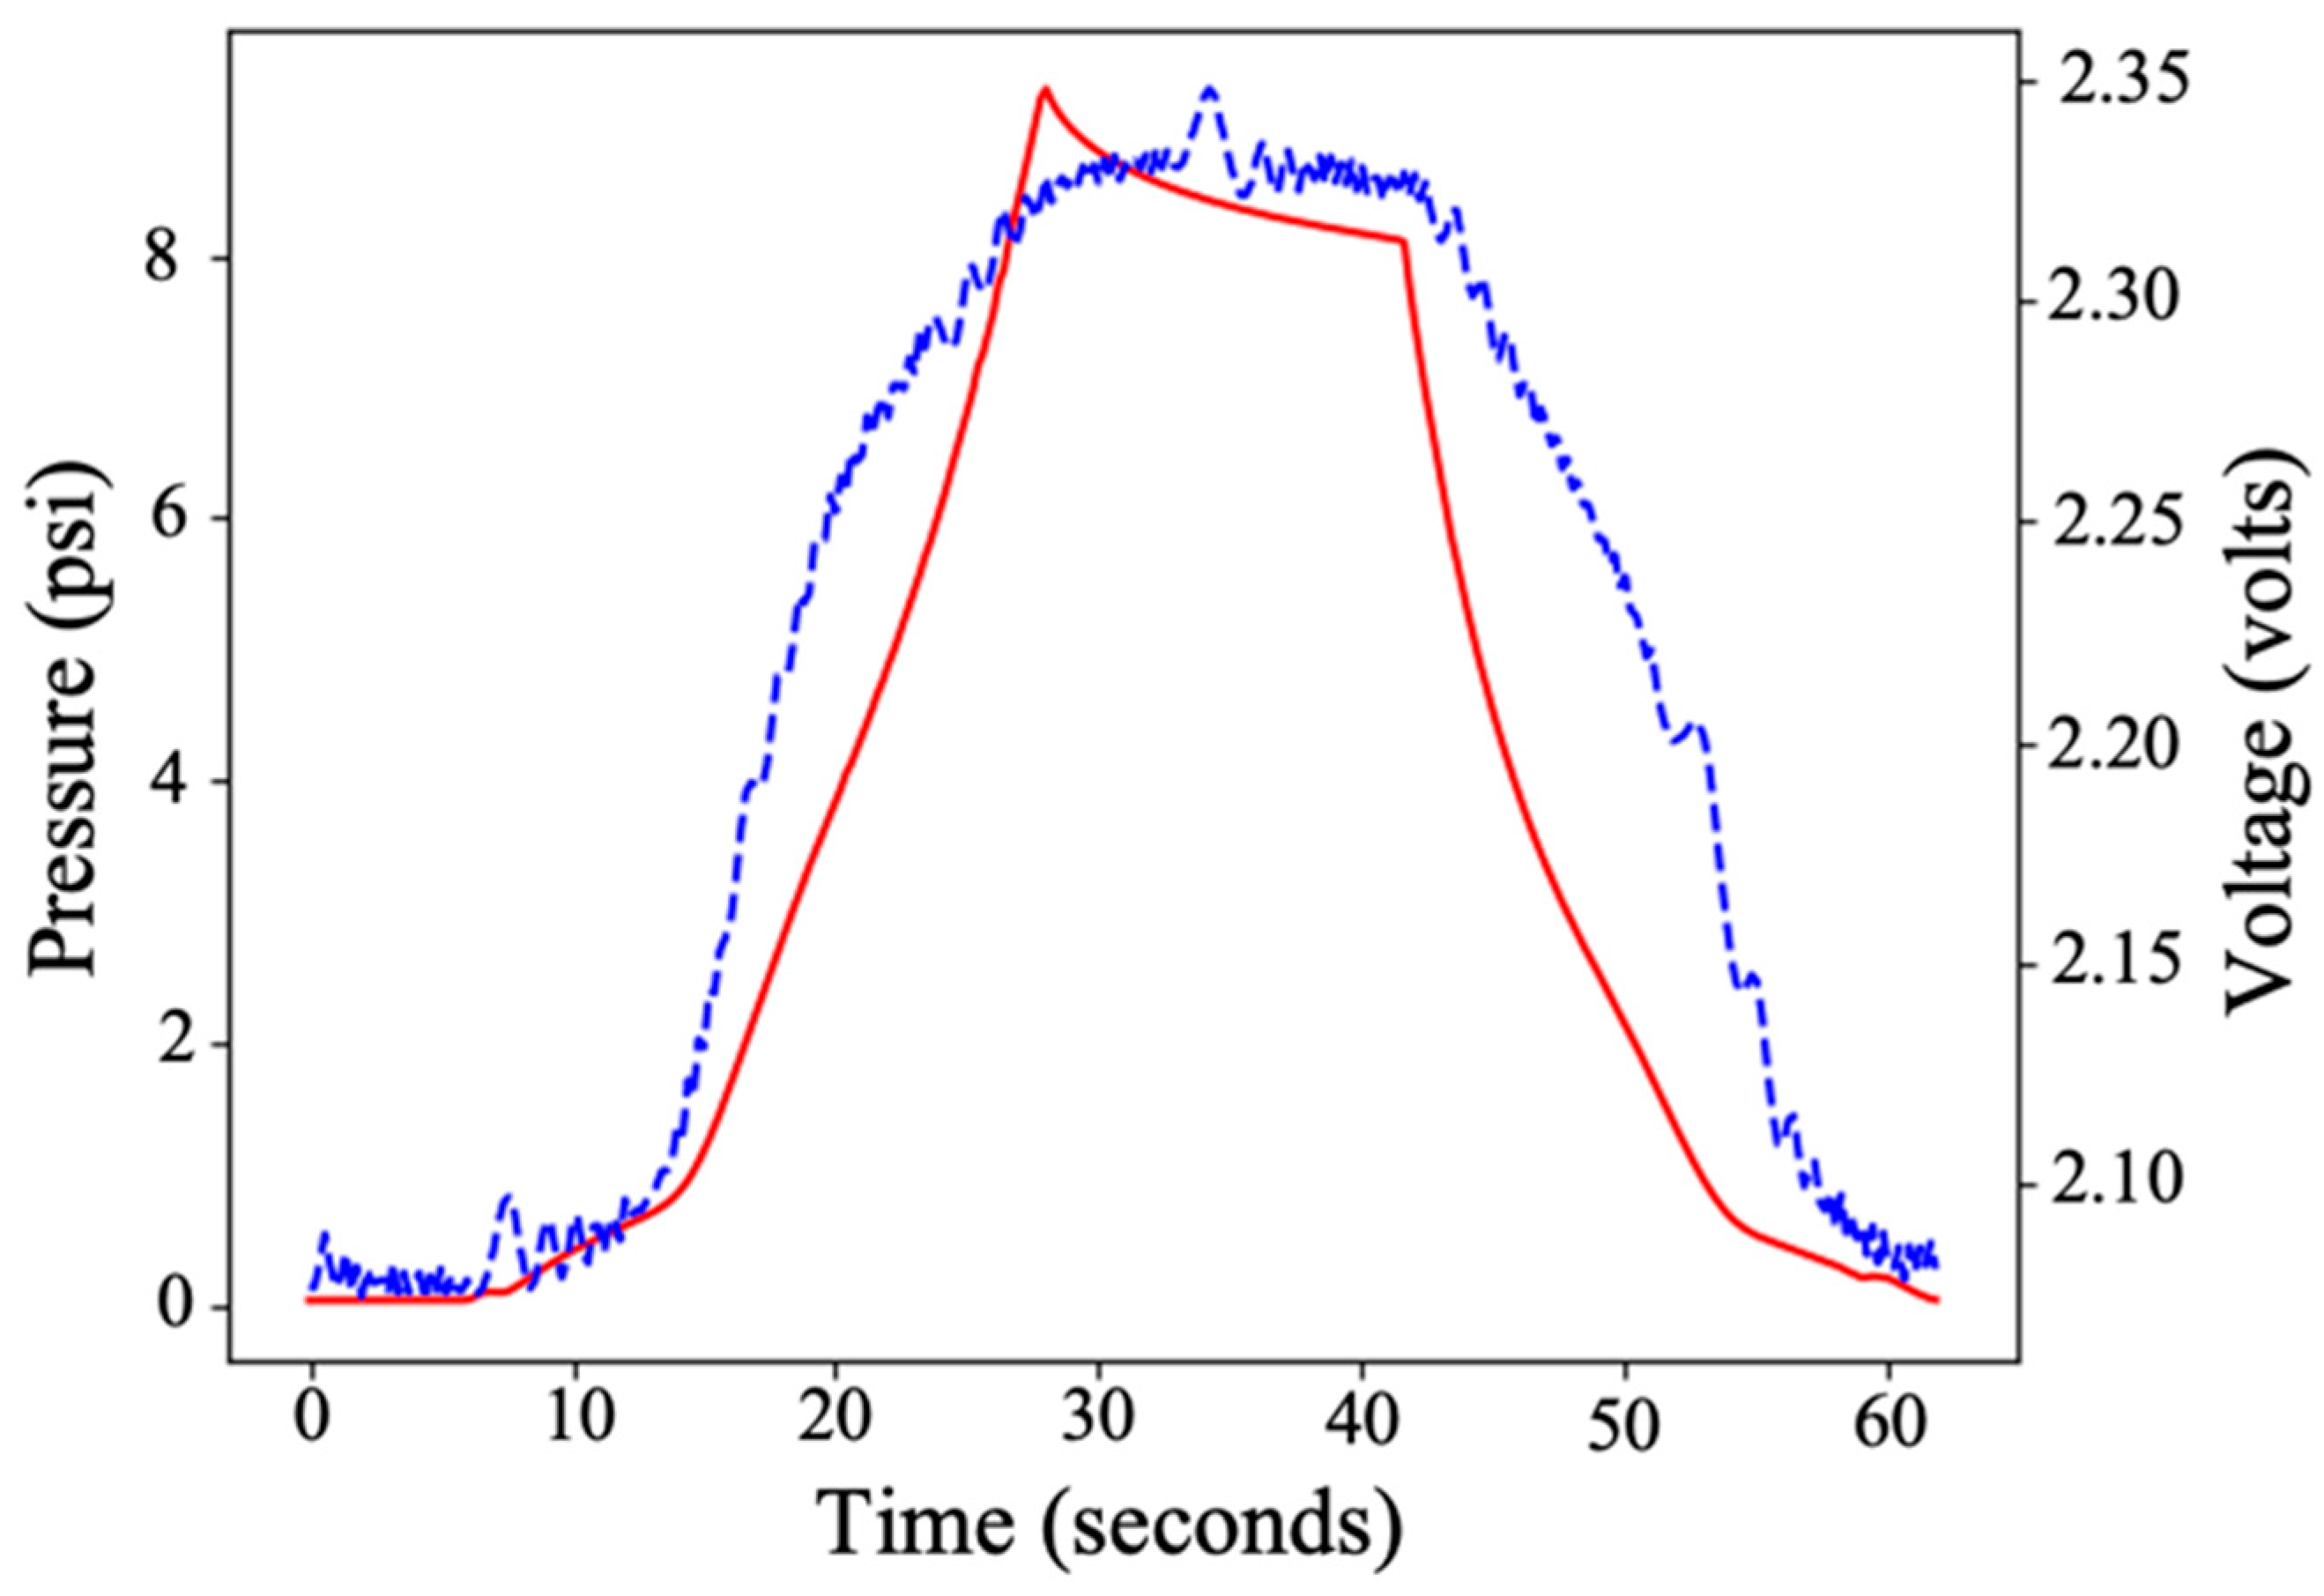
3.2. Data Visualization

Once the data were recorded by the slave devices and transmitted to the master device, the master transmitted the data to a BLE device, visualizing the effect they have on the NCPF and the pressure that it experiences for the user. Figure 16 shows how the data were visualized on an iOS application specifically written to accept data from four arrays totaling 36 different pressure sensing locations. When zero pressure was applied, the square correlating with the electrode was white. As pressure was applied, the correlating square became increasingly red in relation to pressure. The application was also equipped with a toggle switch which allowed the user to record pressure data to a file saved to the device for later evaluation.

4. Discussion

The modular system had a single ATtiny microcontroller for each set of nine electrodes and a single ESP32 as the master controller. The modular system can be increased by simply adding sets of nine electrodes with the accompanying ATtiny1627. There are several limiting factors that determine how large this modular system could reliably be expanded. Power consumption, I2C address size, and I2C communication length are immediate limiting factors when scaling this modular system architecture. If these limiting factors are exceeded, an alternative architecture would be required. The largest system tested is shown in Figure 15, which used 112 modular arrays, although the theoretical maximum is greater than the number tested.
Each modular array and ATtiny1627 drew approximately 2 mA when in use. The ESP32 master device drew 41 mA to perform its functions. The ESP32 datasheet lists a maximum current output of 1100 mA, which would allow for a theoretical maximum of 550 modular arrays to be supported by a single ESP32 master device. One method for removing this limitation would be to power the slave devices from several different power sources.
The ATtiny1627 had a seven-bit address recognition capability, which offered a maximum of 128 modular arrays to run on the same I2C buses. Ten-bit address recognition could be obtained with additional software support, which would allow for 1024 modular arrays to use the same I2C buses.
As a rule, I2C buses should not exceed a length of a few meters when operating in standard mode. If longer trace lengths are needed, a different communication protocol should be used for reliable data transfer. Each array jumper cable used was 127 mm long, meaning that for an I2C bus without redundancies, approximately 25 arrays in a row could be used. Each master PCB was outfitted with five I2C connectors, which would allow for 125 modular arrays to function with a single master PCB if following the I2C length rule. By adding more I2C connectors to the master PCB, this limitation would be mitigated.
With these limiting factors in mind, the first limit that would be reached is the I2C length limit, which would allow for approximately 125 modular arrays to be used. If arrays larger than 125 are desired, the described architecture could still be used in pods. Each pod would consist of an ESP32 master device and 125 slave devices. These pods could then report to another device to collect the pod data, essentially forcing the ESP32 master into a sub-master role.
Another issue with the system is that there are deficiencies with the pressure to voltage correlation. To measure the behavior of NCPF accurately, a load cell was used for compression. Figure 17 displays the displacement that NCPF experienced over time, with the output voltage. Notably, the relationship is not linear. The voltage–displacement relationship is different for low displacements (0 mm–1.5 mm) compared with high displacements (1.5 mm–2.5 mm).
Figure 18 shows the pressure versus the induced voltage for the same measurement provided in Figure 17. Notably, when the displacement was held constant from around 30 s to 40 s, there was a change in the pressure caused by the relaxation of the foam. There were also strain rate effects on the voltage–pressure relationship.
The accuracy of the system is more dependent on the relaxation of the foam and the strain rate than on the electrode optimization. Therefore, future work will involve developing a model to correlate between the pressure and the voltage that considers both the hysteresis and rate of the pressure change. The increase in the voltage with the smaller electrode gap simplifies the analog-to-digital conversion performed by the microcontroller.

5. Conclusions

In summary, this study has demonstrated the construction of a pressure-sensing system built with foam with a total of 1008 sensing points covering an area of slightly larger than 0.5 m by 1.2 m. As explained in the Introduction, this is applicable to pressure sensing in various applications that require the comfort of foam such as seats, pads, and beds. This development also involved the optimization of the interdigitated electrodes. The optimization found that the pressure–voltage relationship is most sensitive to the electrode gap.

Author Contributions

Conceptualization, J.S., J.M., M.T., T.C. and S.S.; methodology, J.S., J.M. and M.T.; software, J.S., J.M. and M.T.; validation, J.S., J.M. and M.T.; formal analysis, J.S., J.M., M.T. and S.S.; investigation, J.S., J.M. and M.T.; resources, J.M.; data curation, J.S., J.M., M.T. and S.S.; writing—original draft preparation, J.S. and S.S.; writing—review and editing, J.S., J.M., M.T., T.C. and S.S.; visualization, J.S., M.T. and S.S.; supervision, J.M.; project administration, J.M.; funding acquisition, J.M. All authors have read and agreed to the published version of the manuscript.

Funding

This research was funded by Xonano Smartfoam.

Data Availability Statement

Data presented within this study may be made available upon request.

Conflicts of Interest

Four of the authors of this publication are employed by Xonano, which is developing products related to the research described in this publication.

References

  1. Bennett, G.; Dealey, C.; Posnett, J. The cost of pressure ulcers in the UK. Age Ageing 2004, 33, 230–235. [Google Scholar] [CrossRef]
  2. Maklebust, J. Pressure ulcers: Etiology and prevention. Nurs. Clin. N. Am. 1987, 22, 359–377. [Google Scholar]
  3. Demarré, L.; Van Lancker, A.; Van Hecke, A.; Verhaeghe, S.; Grypdonck, M.; Lemey, J.; Annemans, L.; Beeckman, D. The cost of prevention and treatment of pressure ulcers: A systematic review. Int. J. Nurs. Stud. 2015, 52, 1754–1774. [Google Scholar] [CrossRef]
  4. Redelings, M.; Lee, N.; Sorvillo, F. Pressure ulcers: More lethal than we thought? Adv. Ski. Wound Care 2005, 18, 367–372. [Google Scholar] [CrossRef]
  5. Razak, A.; Zayegh, A.; Begg, R.; Wahab, Y. Foot plantar pressure measurement system: A review. Sensors 2012, 12, 9884–9912. [Google Scholar] [CrossRef] [PubMed]
  6. Lee, K.; Kwon, Y.; Lee, H.; Lee, Y.; Seo, J.; Kwon, O.; Kang, S.; Lee, D. Active Body Pressure Relief System with Time–of–Flight Optical Pressure Sensors for Pressure Ulcer Prevention. Sensors 2019, 19, 3862. [Google Scholar] [CrossRef] [PubMed]
  7. Maeda, M. Effects of baseball bat mass and position of center of gravity on batting. Procedia Eng. 2010, 2, 2675–2680. [Google Scholar] [CrossRef]
  8. Huang, M.; Liu, J.; Xu, W.; Alshurafa, N.; Zhang, X.; Sarrafzadeh, M. Using pressure map sequences for recognition of on bed rehabilitation exercises. IEEE J. Biomed. Health Inform. 2014, 18, 411–418. [Google Scholar] [CrossRef]
  9. Ren, Z.; Nie, J.; Shao, J.; Lai, Q.; Wang, L.; Chen, J.; Chen, X.; Wang, Z. Fully elastic and metal–free tactile sensors for detecting both normal and tangential forces based on triboelectric nanogenerators. Adv. Funct. Mater. 2018, 28, 1802989. [Google Scholar] [CrossRef]
  10. Claver, U.P.; Zhao, G. Recent progress in flexible pressure sensors based electronic skin. Adv. Eng. Mater. 2021, 23, 2001187. [Google Scholar] [CrossRef]
  11. Ren, Z.; Nie, J.; Xu, L.; Jiang, T.; Chen, B.; Chen, X.; Wang, Z. Directly visualizing tactile perception and ultrasensitive tactile sensors by utilizing body–enhanced induction of ambient electromagnetic waves. Adv. Funct. Mater. 2018, 28, 1805277. [Google Scholar] [CrossRef]
  12. Wan, C.; Cai, P.; Wang, M.; Qian, Y.; Huang, W.; Chen, X. Artificial sensory memory. Adv. Mater. 2020, 32, e1902434. [Google Scholar] [CrossRef]
  13. Tolvanen, J.; Hannu, J.; Jantunen, H. Hybrid foam pressure sensor utilizing piezoresistive and capacitive sensing mechanisms. IEEE Sens. J. 2017, 17, 4735–4746. [Google Scholar] [CrossRef]
  14. Liu, Q.; Liu, Y.; Shi, J.; Liu, Z.; Wang, Q.; Guo, C. High–porosity foam–based iontronic pressure sensor with superhigh sensitivity of 9280 kPa−1. Nano-Micro Lett. 2021, 14, 21. [Google Scholar] [CrossRef] [PubMed]
  15. Zuruzi, A.; Haffiz, T.; Affidah, D.; Amirul, A.; Norfatriah, A.; Nurmawati, M. Towards wearable pressure sensors using multiwall carbon nanotube/polydimethylsiloxane nanocomposite foams. Mater. Des. 2017, 132, 449–458. [Google Scholar] [CrossRef]
  16. Rosquist, P.; Collins, G.; Merrell, A.; Tuttle, N.; Tracy, J.; Bird, E.; Seeley, M.; Fullwood, D.; Christensen, W.; Bowden, A. Estimation of 3D ground reaction force using nanocomposite piezo–responsive foam sensors during walking. Ann. Biomed. Eng. 2017, 45, 2122–2134. [Google Scholar] [CrossRef] [PubMed]
  17. Seeley, M.; Evans, A.; Collins, G.; Tracy, J.; Tuttle, N.; Rosquist, P.; Merrell, A.; Christensen, W.; Fullwood, D.; Bowden, A. Predicting vertical ground reaction force during running using novel piezoresponsive sensors and accelerometry. J. Sports Sci. 2020, 38, 1844–1858. [Google Scholar] [CrossRef]
  18. Merrell, A.; Christensen, W.; Seeley, M.; Bowden, A.; Fullwood, D. Nano–composite foam sensor system in football helmets. Ann. Biomed. Eng. 2017, 45, 2742–2749. [Google Scholar] [CrossRef]
  19. Samad, Y.; Li, Y.; Schiffer, A.; Alhassan, S.; Liao, K. Graphene foam developed with a novel two–step technique for low and high strains and pressure–sensing applications. Small 2015, 11, 2380–2385. [Google Scholar] [CrossRef] [PubMed]
  20. Brady, S.; Diamond, D.; Lau, K. Inherently conducting polymer modified polyurethane smart foam for pressure sensing. Sens. Actuators A Phys. 2005, 119, 398–404. [Google Scholar] [CrossRef]
  21. Gupta, N.; Adepu, V.; Tathacharya, M.; Siraj, S.; Pal, S.; Sahatiya, P.; Kuila, B. Piezoresistive pressure sensor based on conjugated polymer framework for pedometer and smart tactile glove applications. Sens. Actuators A Phys. 2023, 350, 114139. [Google Scholar] [CrossRef]
  22. Hanson, R.; Newton, C.; Merrell, A.; Bowden, A.; Seeley, M.; Mitchell, U.; Mazzeo, B.; Fullwood, D. Dual–Sensing Piezoresponsive Foam for Dynamic and Static Loading. Sensors 2023, 23, 3719. [Google Scholar] [CrossRef] [PubMed]
  23. ATTINY1627. Available online: https://www.microchip.com/en-us/product/attiny1627 (accessed on 30 September 2023).
  24. MPLAB® X IDE | Microchip Technology. Available online: https://www.microchip.com/en-us/tools-resources/develop/mplab-x-ide (accessed on 30 September 2023).
  25. eXpert 5603F Foam Testing System. ADMET. Available online: https://www.admet.com/testing-applications/materials/foam-furniture-and-mattress-testing/expert-5630f-foam-testing-system/ (accessed on 30 September 2023).
  26. B&K Precision Corporation. Available online: https://www.bkprecision.com/products/component-testers/891 (accessed on 30 September 2023).
  27. Statistical Software. Available online: https://www.jmp.com/en_us/home.html (accessed on 30 September 2023).
Figure 1. Insoles that currently use NCPF as a dynamic load sensor.
Metrology 04 00006 g001
Figure 2. The voltage divider system to measure the change in impedance experienced upon NCPF deformation. Not drawn to scale. The inset shows the microcontroller with the resistor divider.
Metrology 04 00006 g002
Figure 3. Data path consisting of three major stages. In the first stage, data sampling is performed and RMS calculations are packaged and sent to a master device via I2C communication. In the second stage, data are filtered or passed through a model and then packaged for BLE transfer. In the third stage, BLE data are received, visually displayed, and saved for later evaluation.
Metrology 04 00006 g003
Figure 4. Example electrode used to measure the impedance change that the NCPF induced on the system.
Metrology 04 00006 g004
Figure 5. NCPF paired with a one square inch electrode with 1 mm gaps and a 1.5 mm finger width. Impedance vs. frequency lines are as follows: 0.1 PSI, 0.5 PSI, 1 PSI, 2 PSI, 5 PSI, and 10 PSI, colored blue, red, green, cyan, magenta, and black, respectively.
Metrology 04 00006 g005
Figure 6. Approximate lumped element circuit model of the NCPF.
Metrology 04 00006 g006
Figure 7. Impedance vs. frequency over various frequency ranges with lines as follows: 0.1 PSI, 0.5 PSI, 1 PSI, 2 PSI, 5 PSI, and 10 PSI, colored blue, red, green, cyan, magenta, and black, respectively.
Metrology 04 00006 g007
Figure 8. Impedance vs. frequency with lines as follows: 0.1 PSI, 0.5 PSI, 1 PSI, 2 PSI, 5 PSI, and 10 PSI, colored blue, red, green, cyan, magenta, and black, respectively. The ‘“×’ symbols indicate the measured data points, and the line is the best fit.
Metrology 04 00006 g008
Figure 9. Capacitance and resistance as a function of pressure to produce the impedance from Figure 8.
Metrology 04 00006 g009
Figure 10. Impedance as a function of pressure with 1 kHz excitation frequency.
Metrology 04 00006 g010
Figure 11. A six-by-six array of varying finger widths and gaps of the electrode used for NCPF enabled pressure sensing. Each of the 36 electrodes covered an area of 25 mm by 25 mm. The pin-outs seen on the right side of the array were used to connect to each electrode. The inset defines the finger gap, g, and the finger width, w.
Metrology 04 00006 g011
Figure 12. The PCB was placed under the compression tester with a three-millimeter-thick piece of NCPF on top of the electrodes. A large platen was used to ensure an even pressure distribution over the surface of the electrode undergoing testing.
Metrology 04 00006 g012
Figure 13. A flexible PCB designed with nine electrodes. The rigid PCB is equipped with a small area that houses the MCU and other hardware needed to use NCPF as a pressure sensor.
Metrology 04 00006 g013
Figure 14. Chaining four flexible arrays together to map a larger surface. Note that the flexible arrays share VDD, GND, and I2C lines. The arrays are connected to the NCPF using 3D-printed clips to ensure a secure interface.
Metrology 04 00006 g014
Figure 15. Using 112 flexible modular arrays to enable the pressure mapping of large surface. Notably, only one master device is needed to communicate with the entire array matrix.
Metrology 04 00006 g015
Figure 16. Display of the iOS application output when the NCPF experienced pressure.
Metrology 04 00006 g016
Figure 17. NCPF behavior showing the displacement (red) and voltage (blue) correlation.
Metrology 04 00006 g017
Figure 18. Pressure and voltage correlation. Red is the pressure exerted by the load cell; blue is the output NCPF voltage produced by the changing pressure.
Metrology 04 00006 g018
Table 1. Non-loaded impedance estimates.
TermEstimateStandard Deviationt RatioProb > |t|Lower 95%Upper 95%
Intercept2,440,00041,80058.4<0.00012,360,0002,520,000
Finger Width, w−207,00031,900−6.47<0.0001−269,000−144,000
Finger
Gap, g
2,690,00031,90084.4<0.00012,630,0002,750,000
Disclaimer/Publisher’s Note: The statements, opinions and data contained in all publications are solely those of the individual author(s) and contributor(s) and not of MDPI and/or the editor(s). MDPI and/or the editor(s) disclaim responsibility for any injury to people or property resulting from any ideas, methods, instructions or products referred to in the content.

