
Conservation Voltage Reduction Impact Investigation for Personal Computing Devices Using Experimental Measurements and Computation Performance Metrics


Abstract
:1. Introduction
1.1. Related Works and Research Gaps
1.2. Contributions
- Developed a novel experimental approach to benchmark the performance of computing systems under CVR deployment, considering the temporal variations in energy use behavior.
- Presented a comprehensive benchmark analysis of desktop PCs and laptops, assessing performance metrics like Single-Core and Multi-Core Scores under different voltage settings with a focus on CVR implementation.
- Investigated the thermal performance of computing systems under various CVR scenarios, providing novel insights into the impact of CVR on heat dissipation from the computing devices. This aspect has not been extensively discussed in the existing literature, marking it as a distinct and valuable contribution.
- Introduced and defined the CVR Performance Enhancement Ratio (%), a novel metric for systematically evaluating and quantifying the impact of CVR on the performance efficiency of computing systems. This ratio offers a unique perspective on the trade-offs between energy efficiency and system performance, contributing to the body of knowledge on sustainable computing practices.
2. Conservation Voltage Reduction
2.1. CVR Factor
2.2. Performance Metric of a Single-Core System
2.3. Performance Metric of a Multi-Core System
2.4. CVR Performance Enhancement Ratio
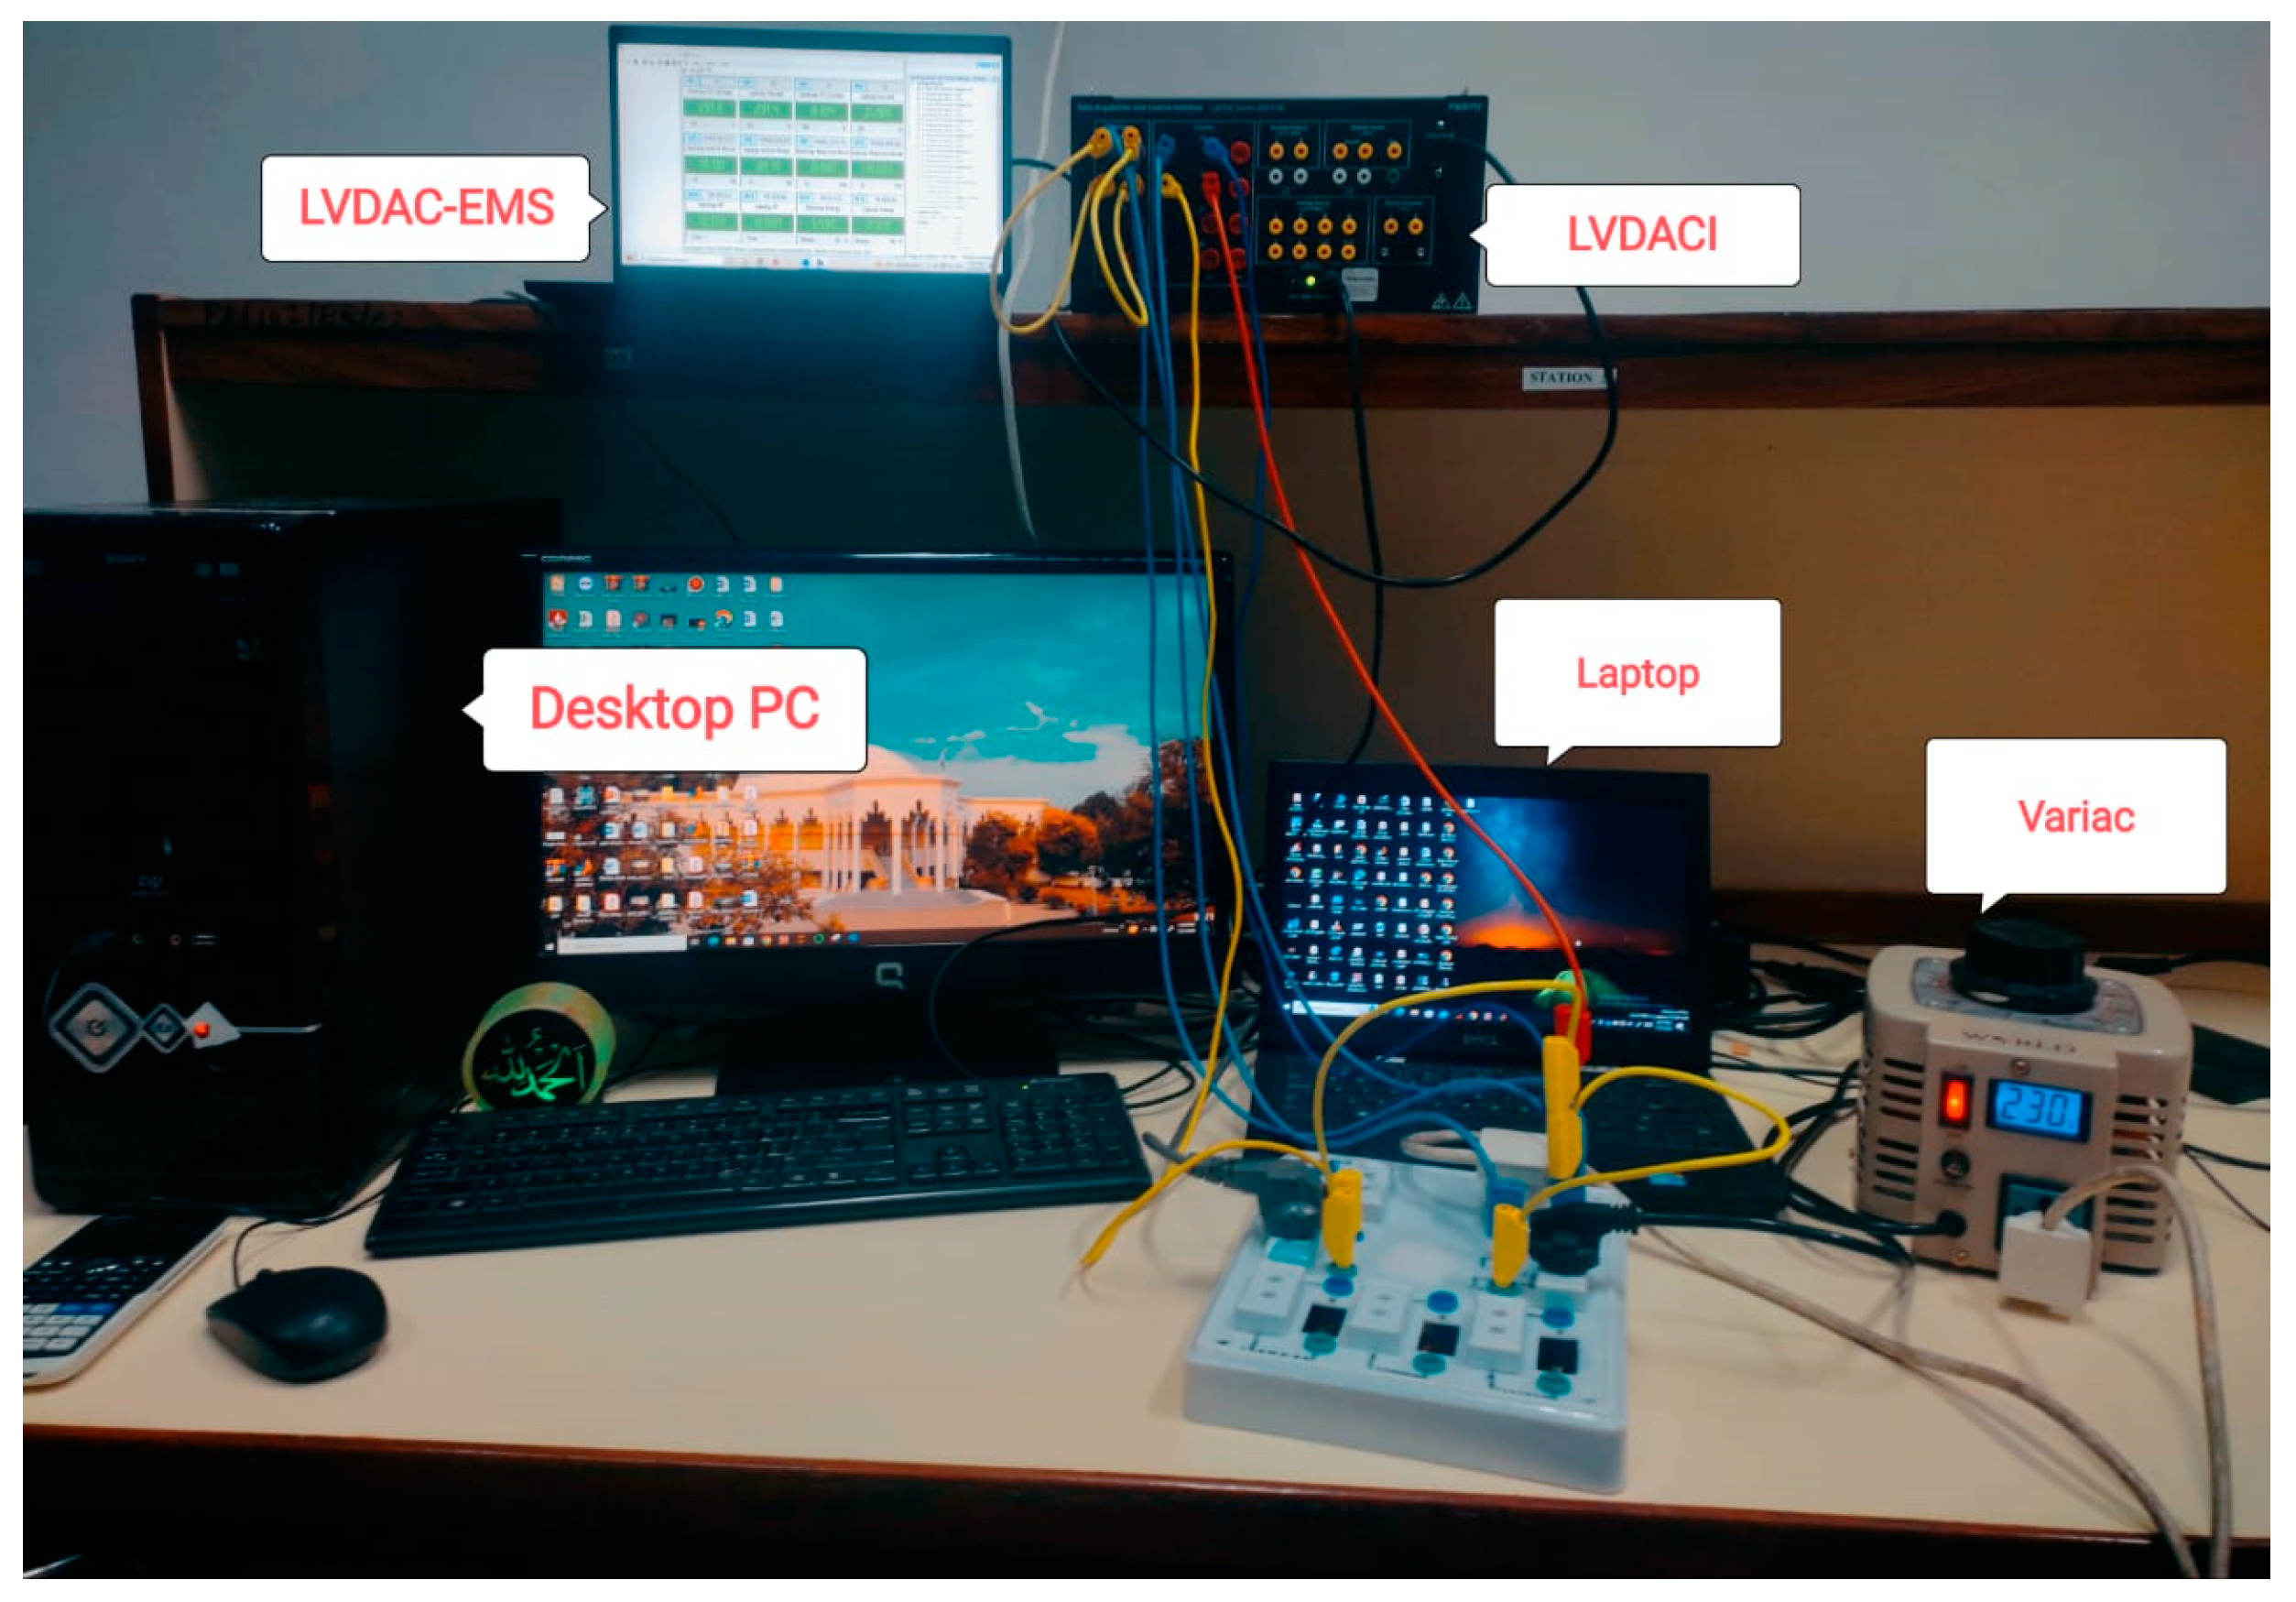
3. Experimental Setup and Methodology
3.1. Validation Procedures
3.2. Accuracy and Repeatability
3.3. Number of Tests Conducted
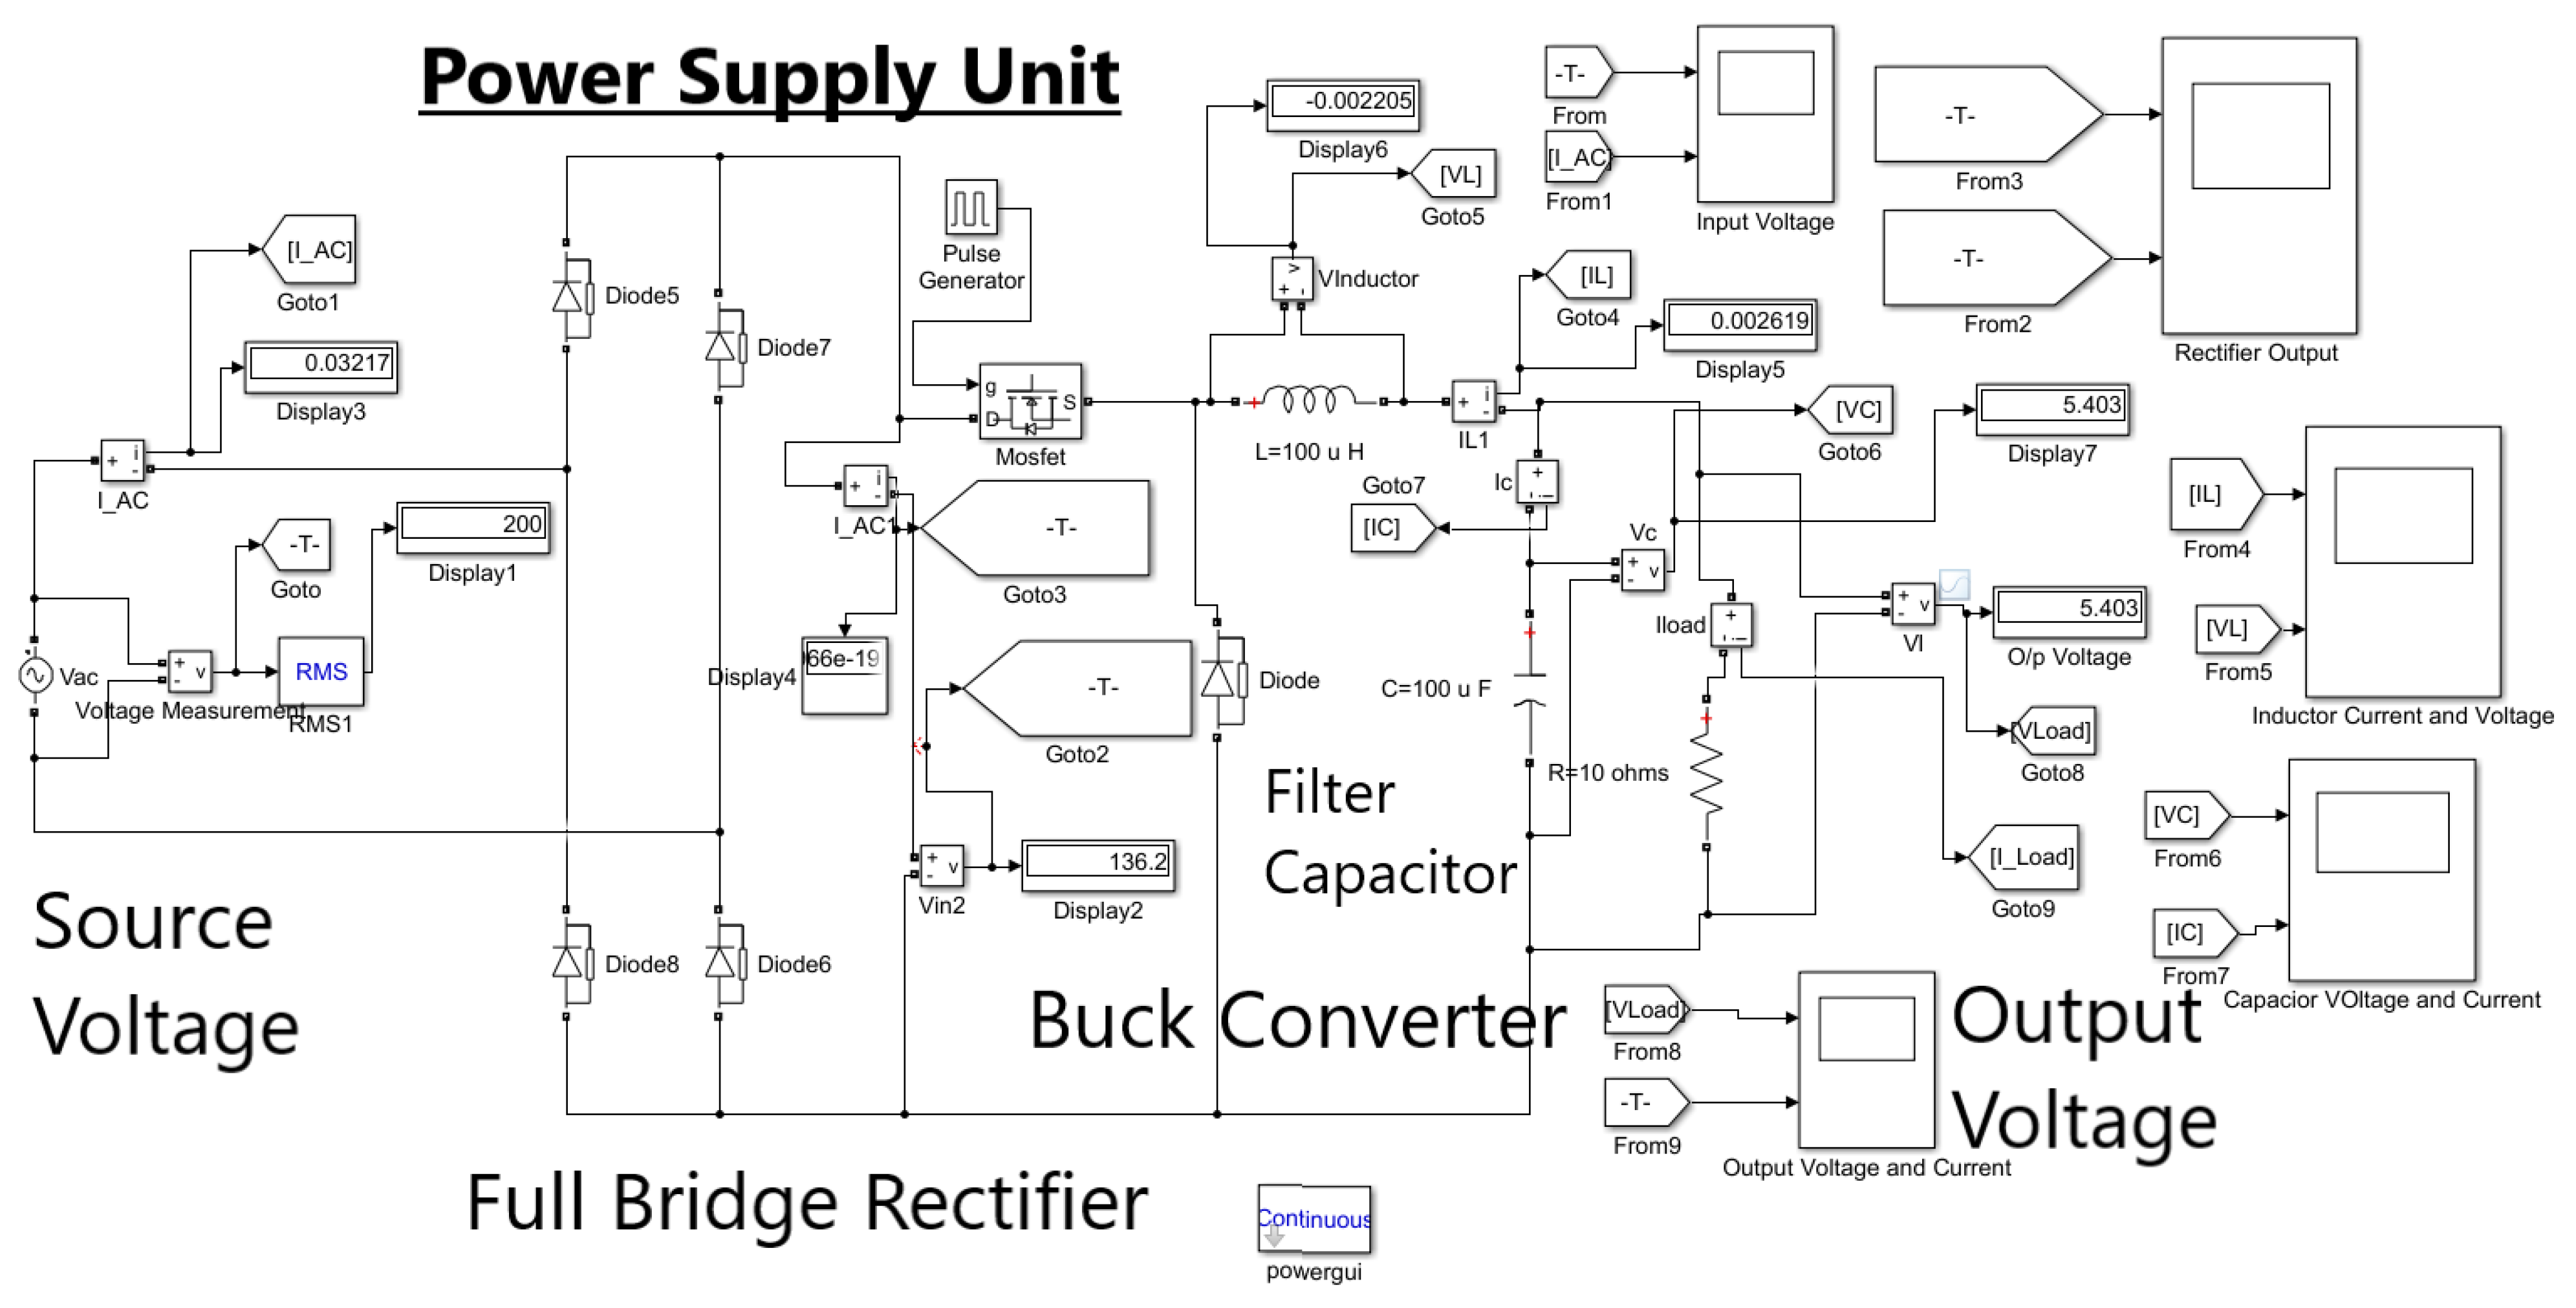
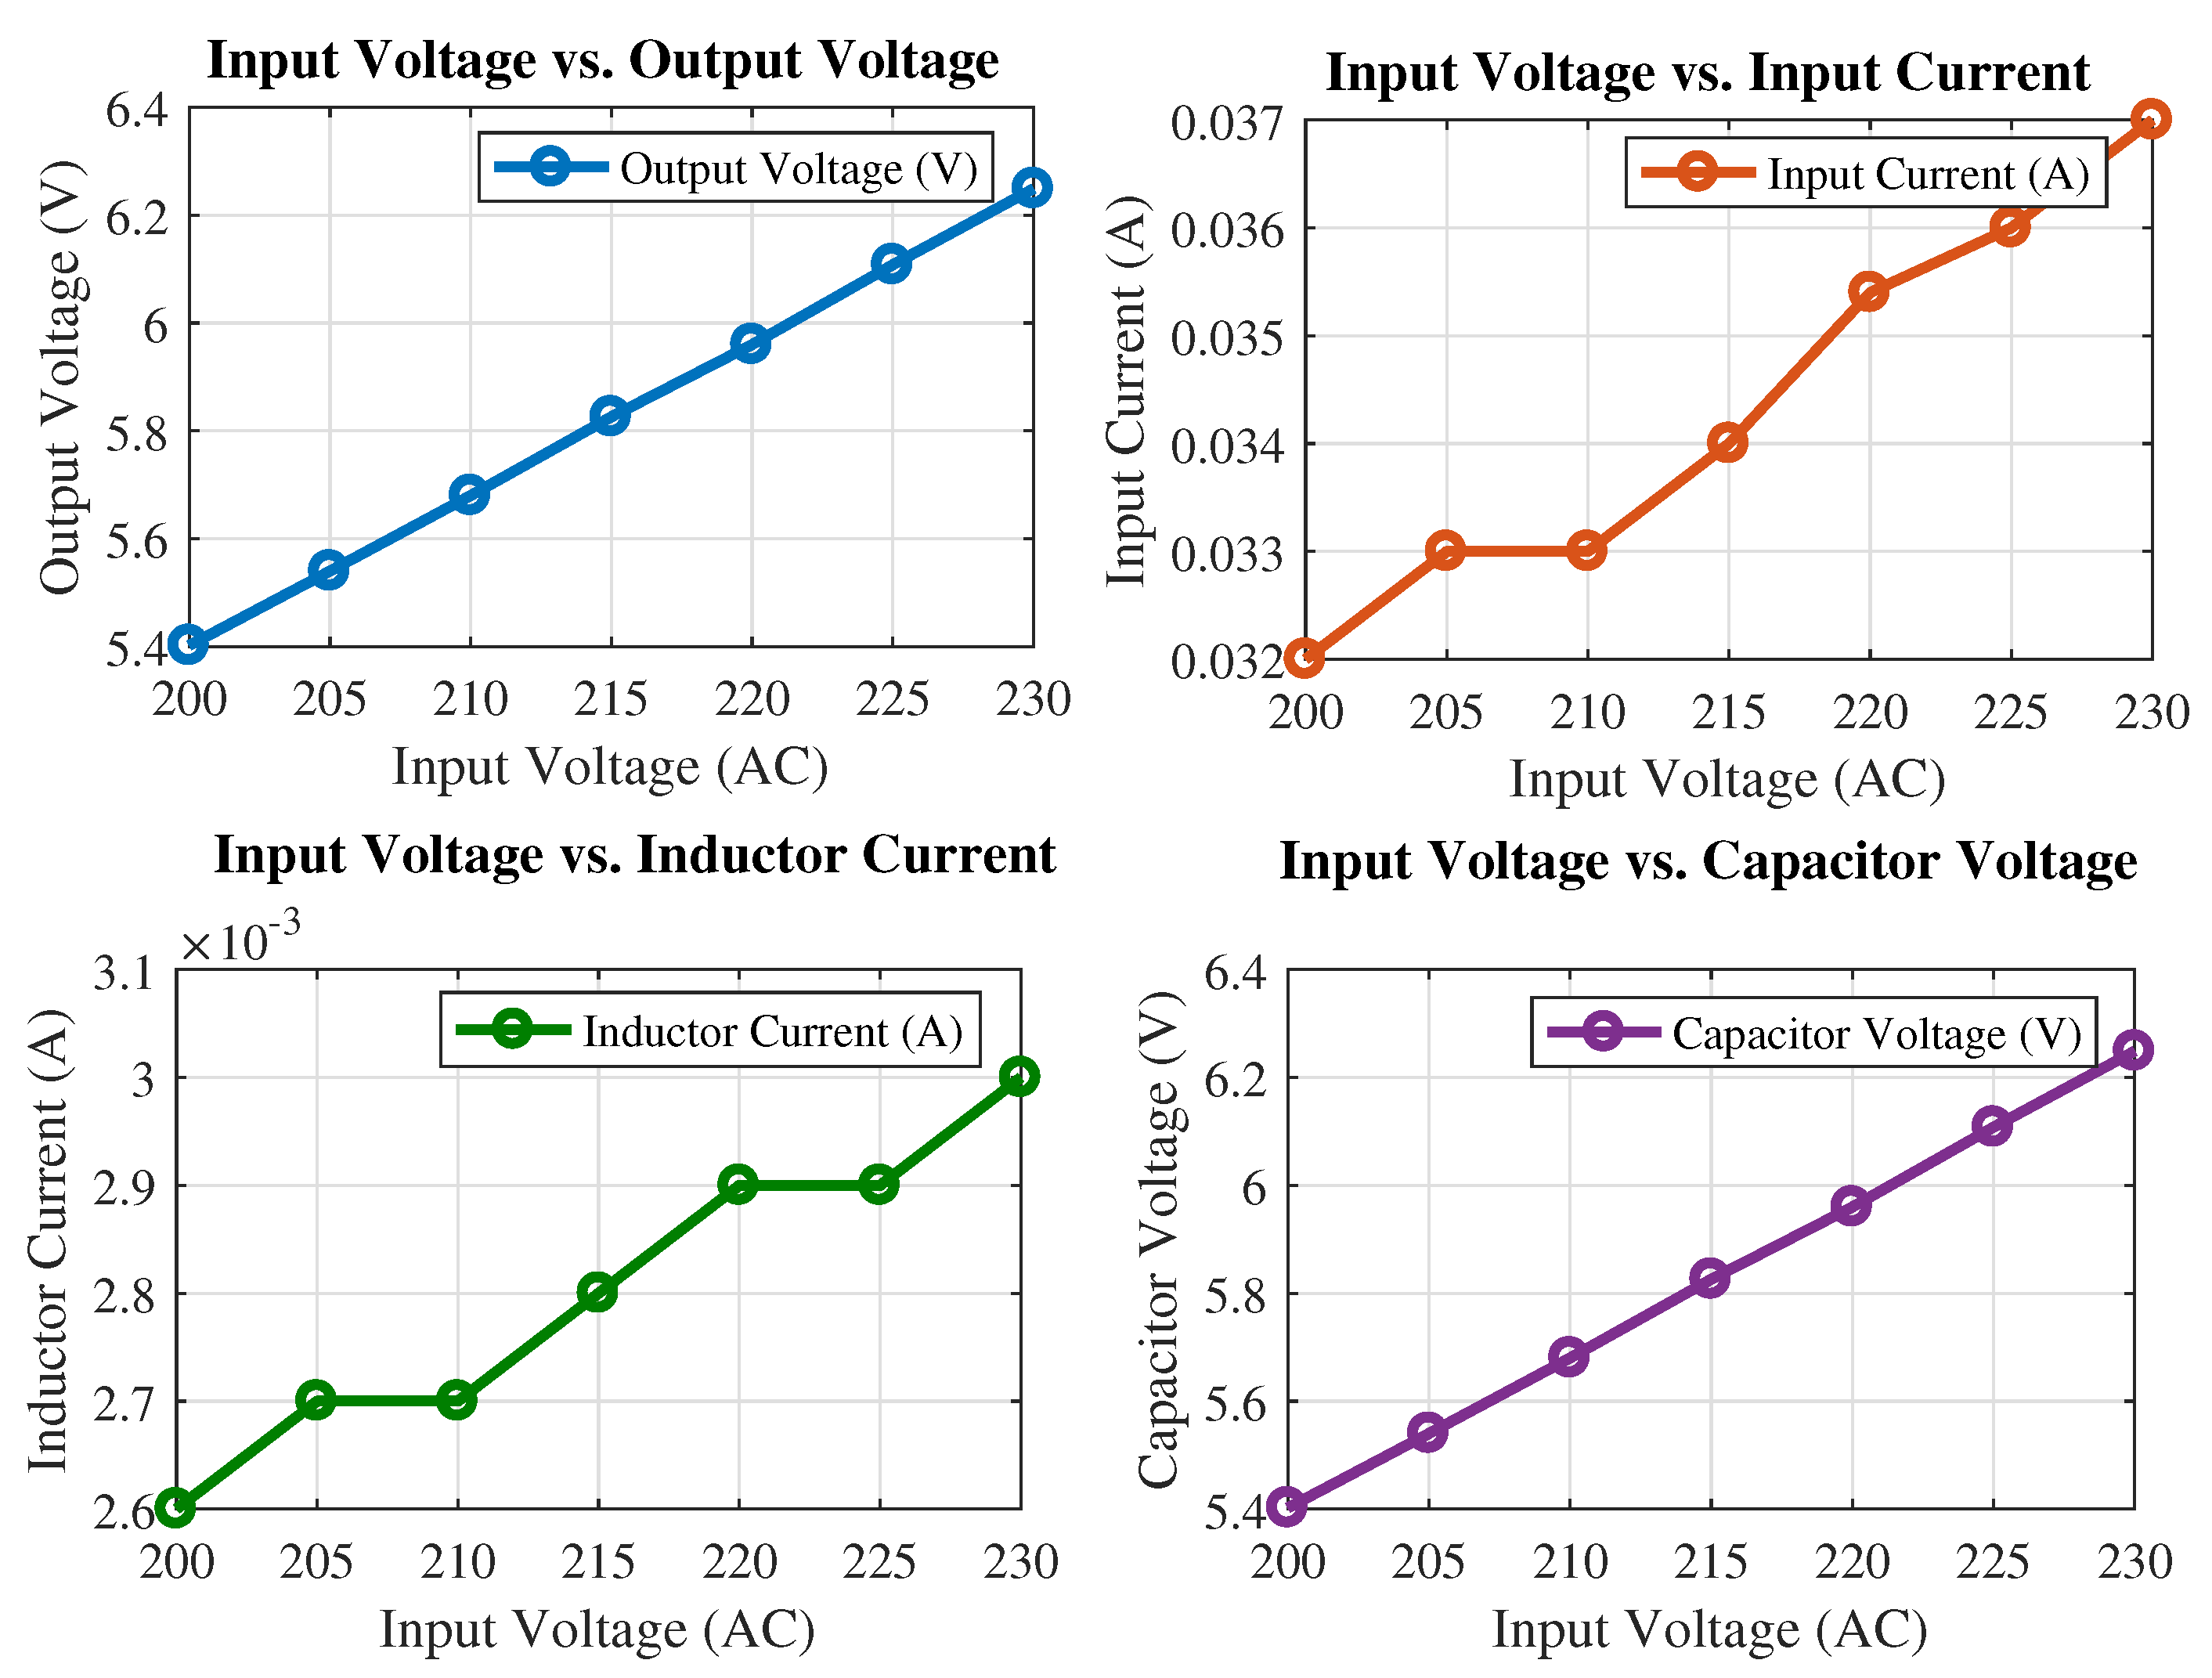
3.4. Power Supply Unit (PSU) Analysis
Simulink Model of PSU Operation
3.5. Description of Desktop PCs and Laptops Specifications
3.6. LVDACI and Variac Integration for Variable Voltage Conditions
4. Task Execution and Data Collection for Benchmarking
4.1. Tasks
4.1.1. CPU-Intensive Work
4.1.2. Graphics-Intensive Work
4.1.3. Multitasking Scenario
4.2. Data Gathering
4.2.1. Power Consumption
4.2.2. Performance Metrics
4.2.3. Thermal Behavior
4.3. Performance Benchmarking with Geekbench
4.3.1. Single-Core Score
4.3.2. Multi-Core Score
5. Results and Analysis
5.1. Power Consumption Analysis
5.2. CVR Analysis
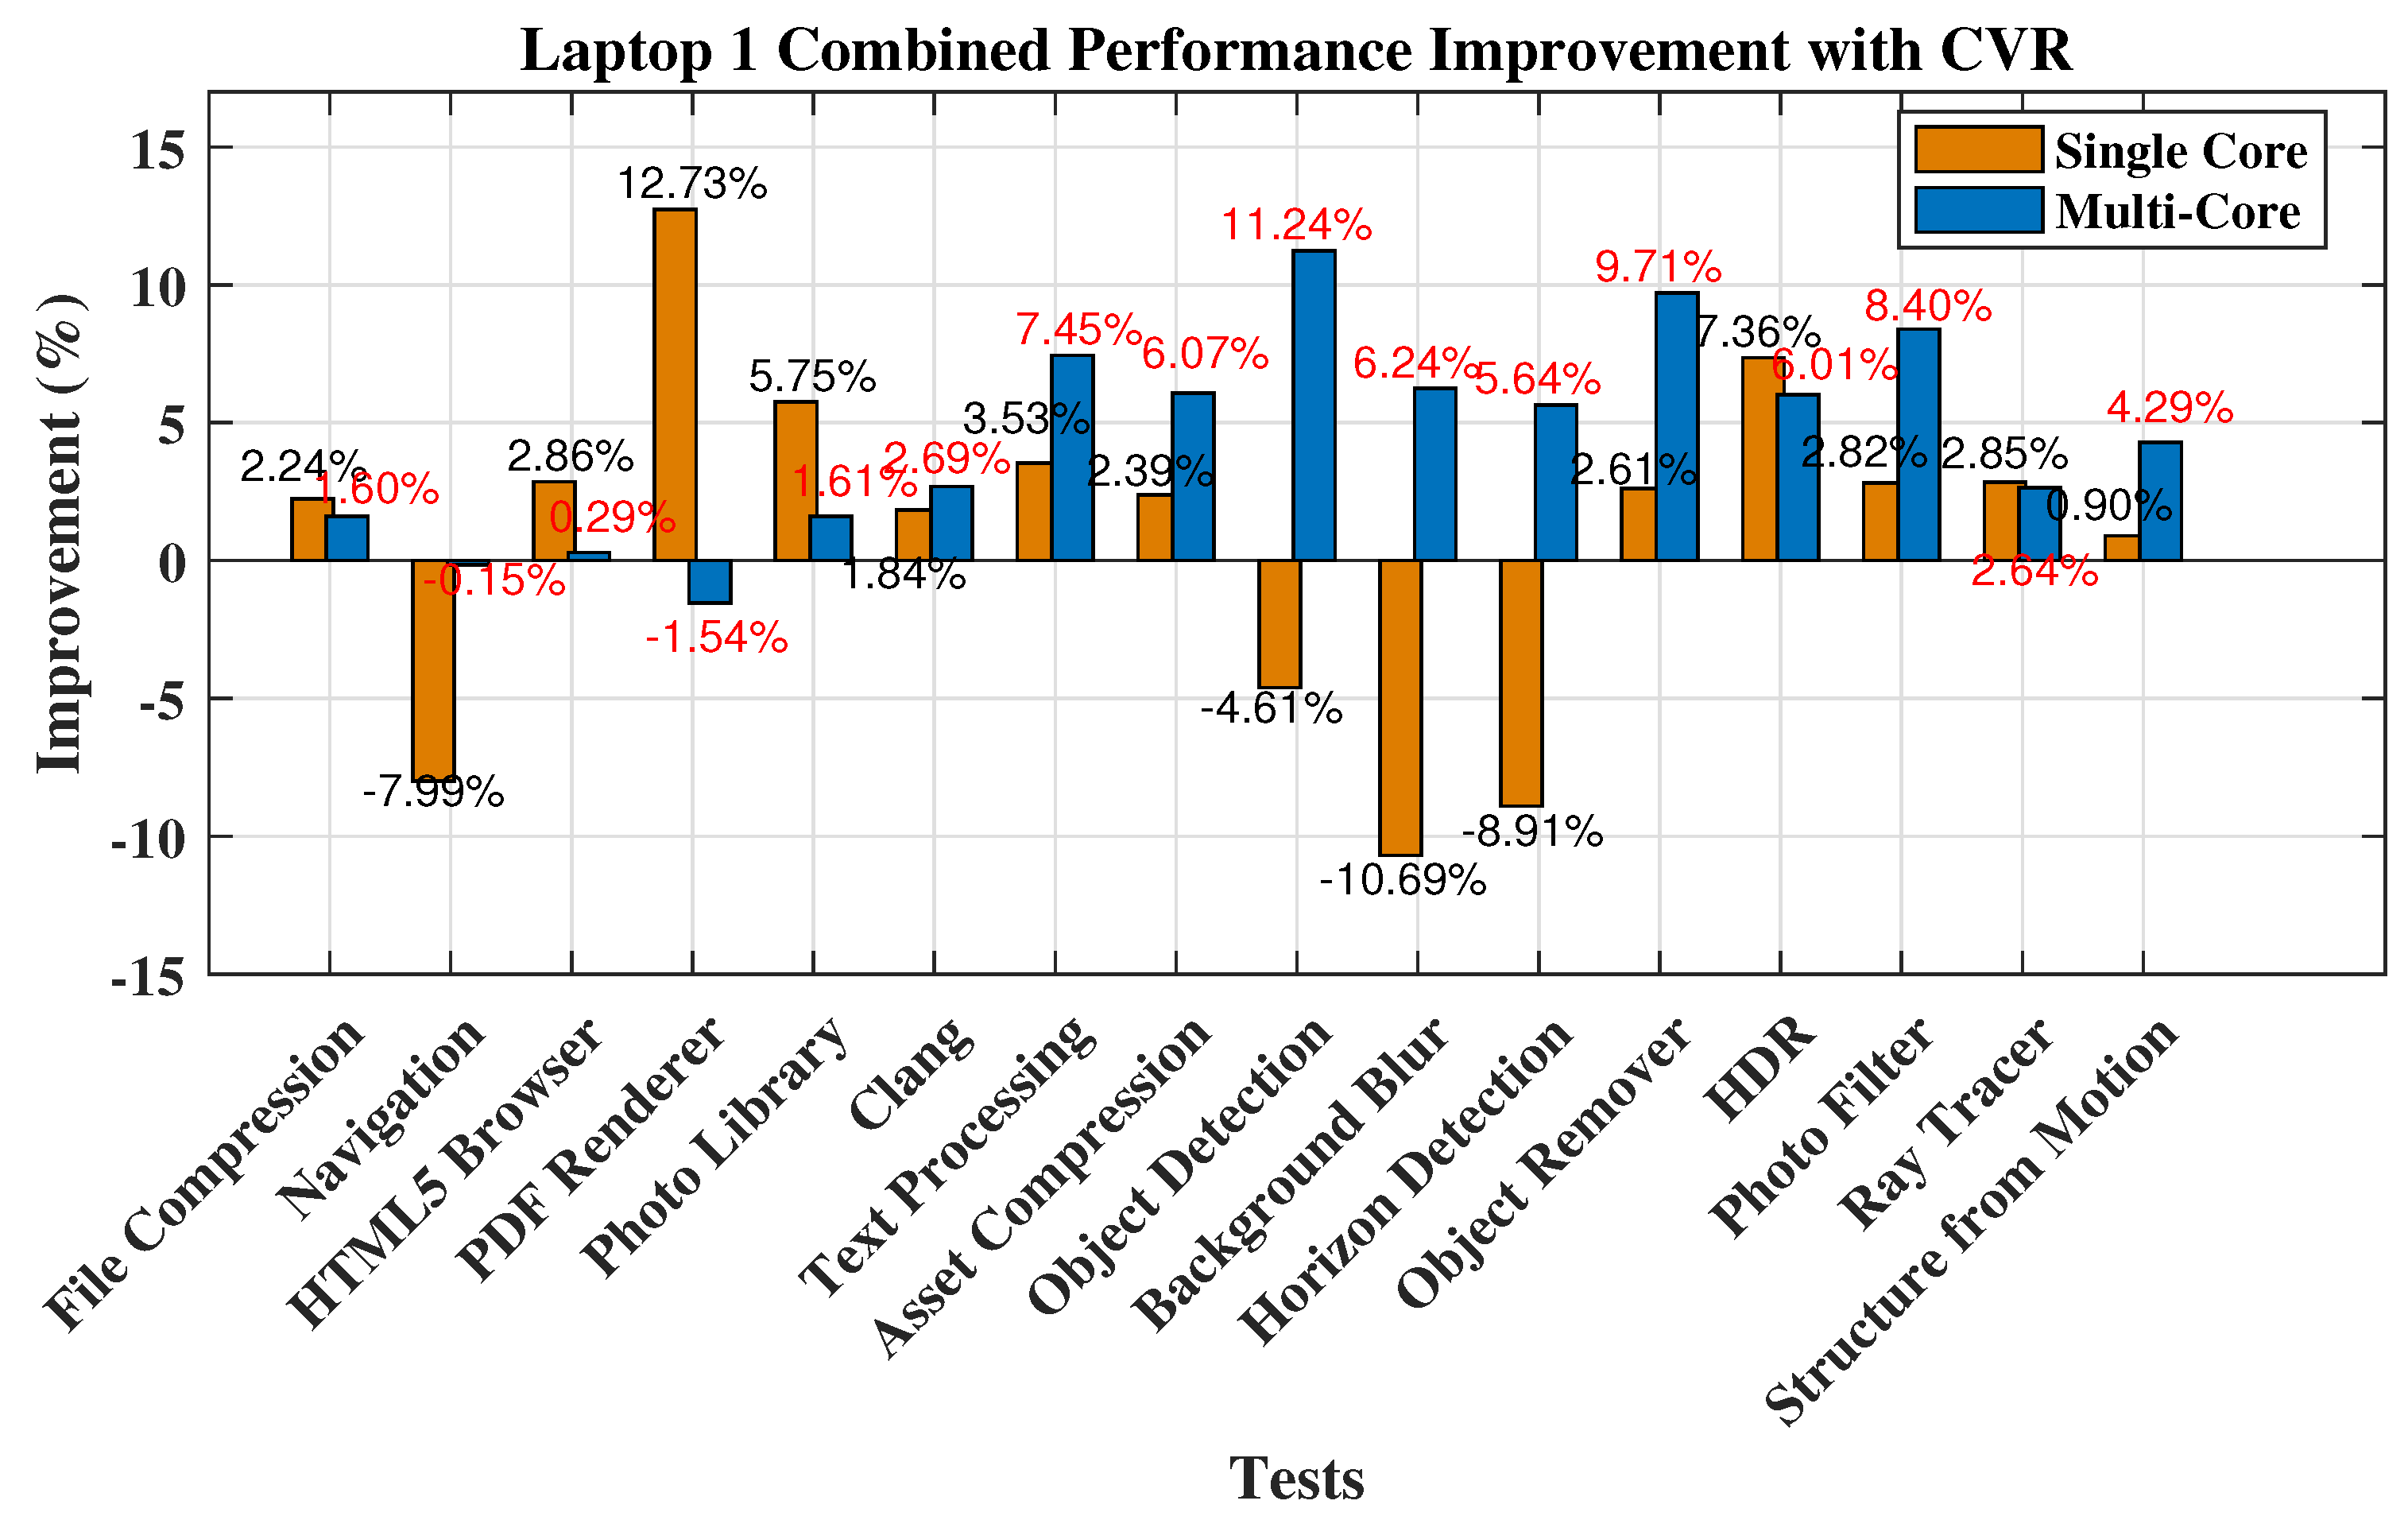
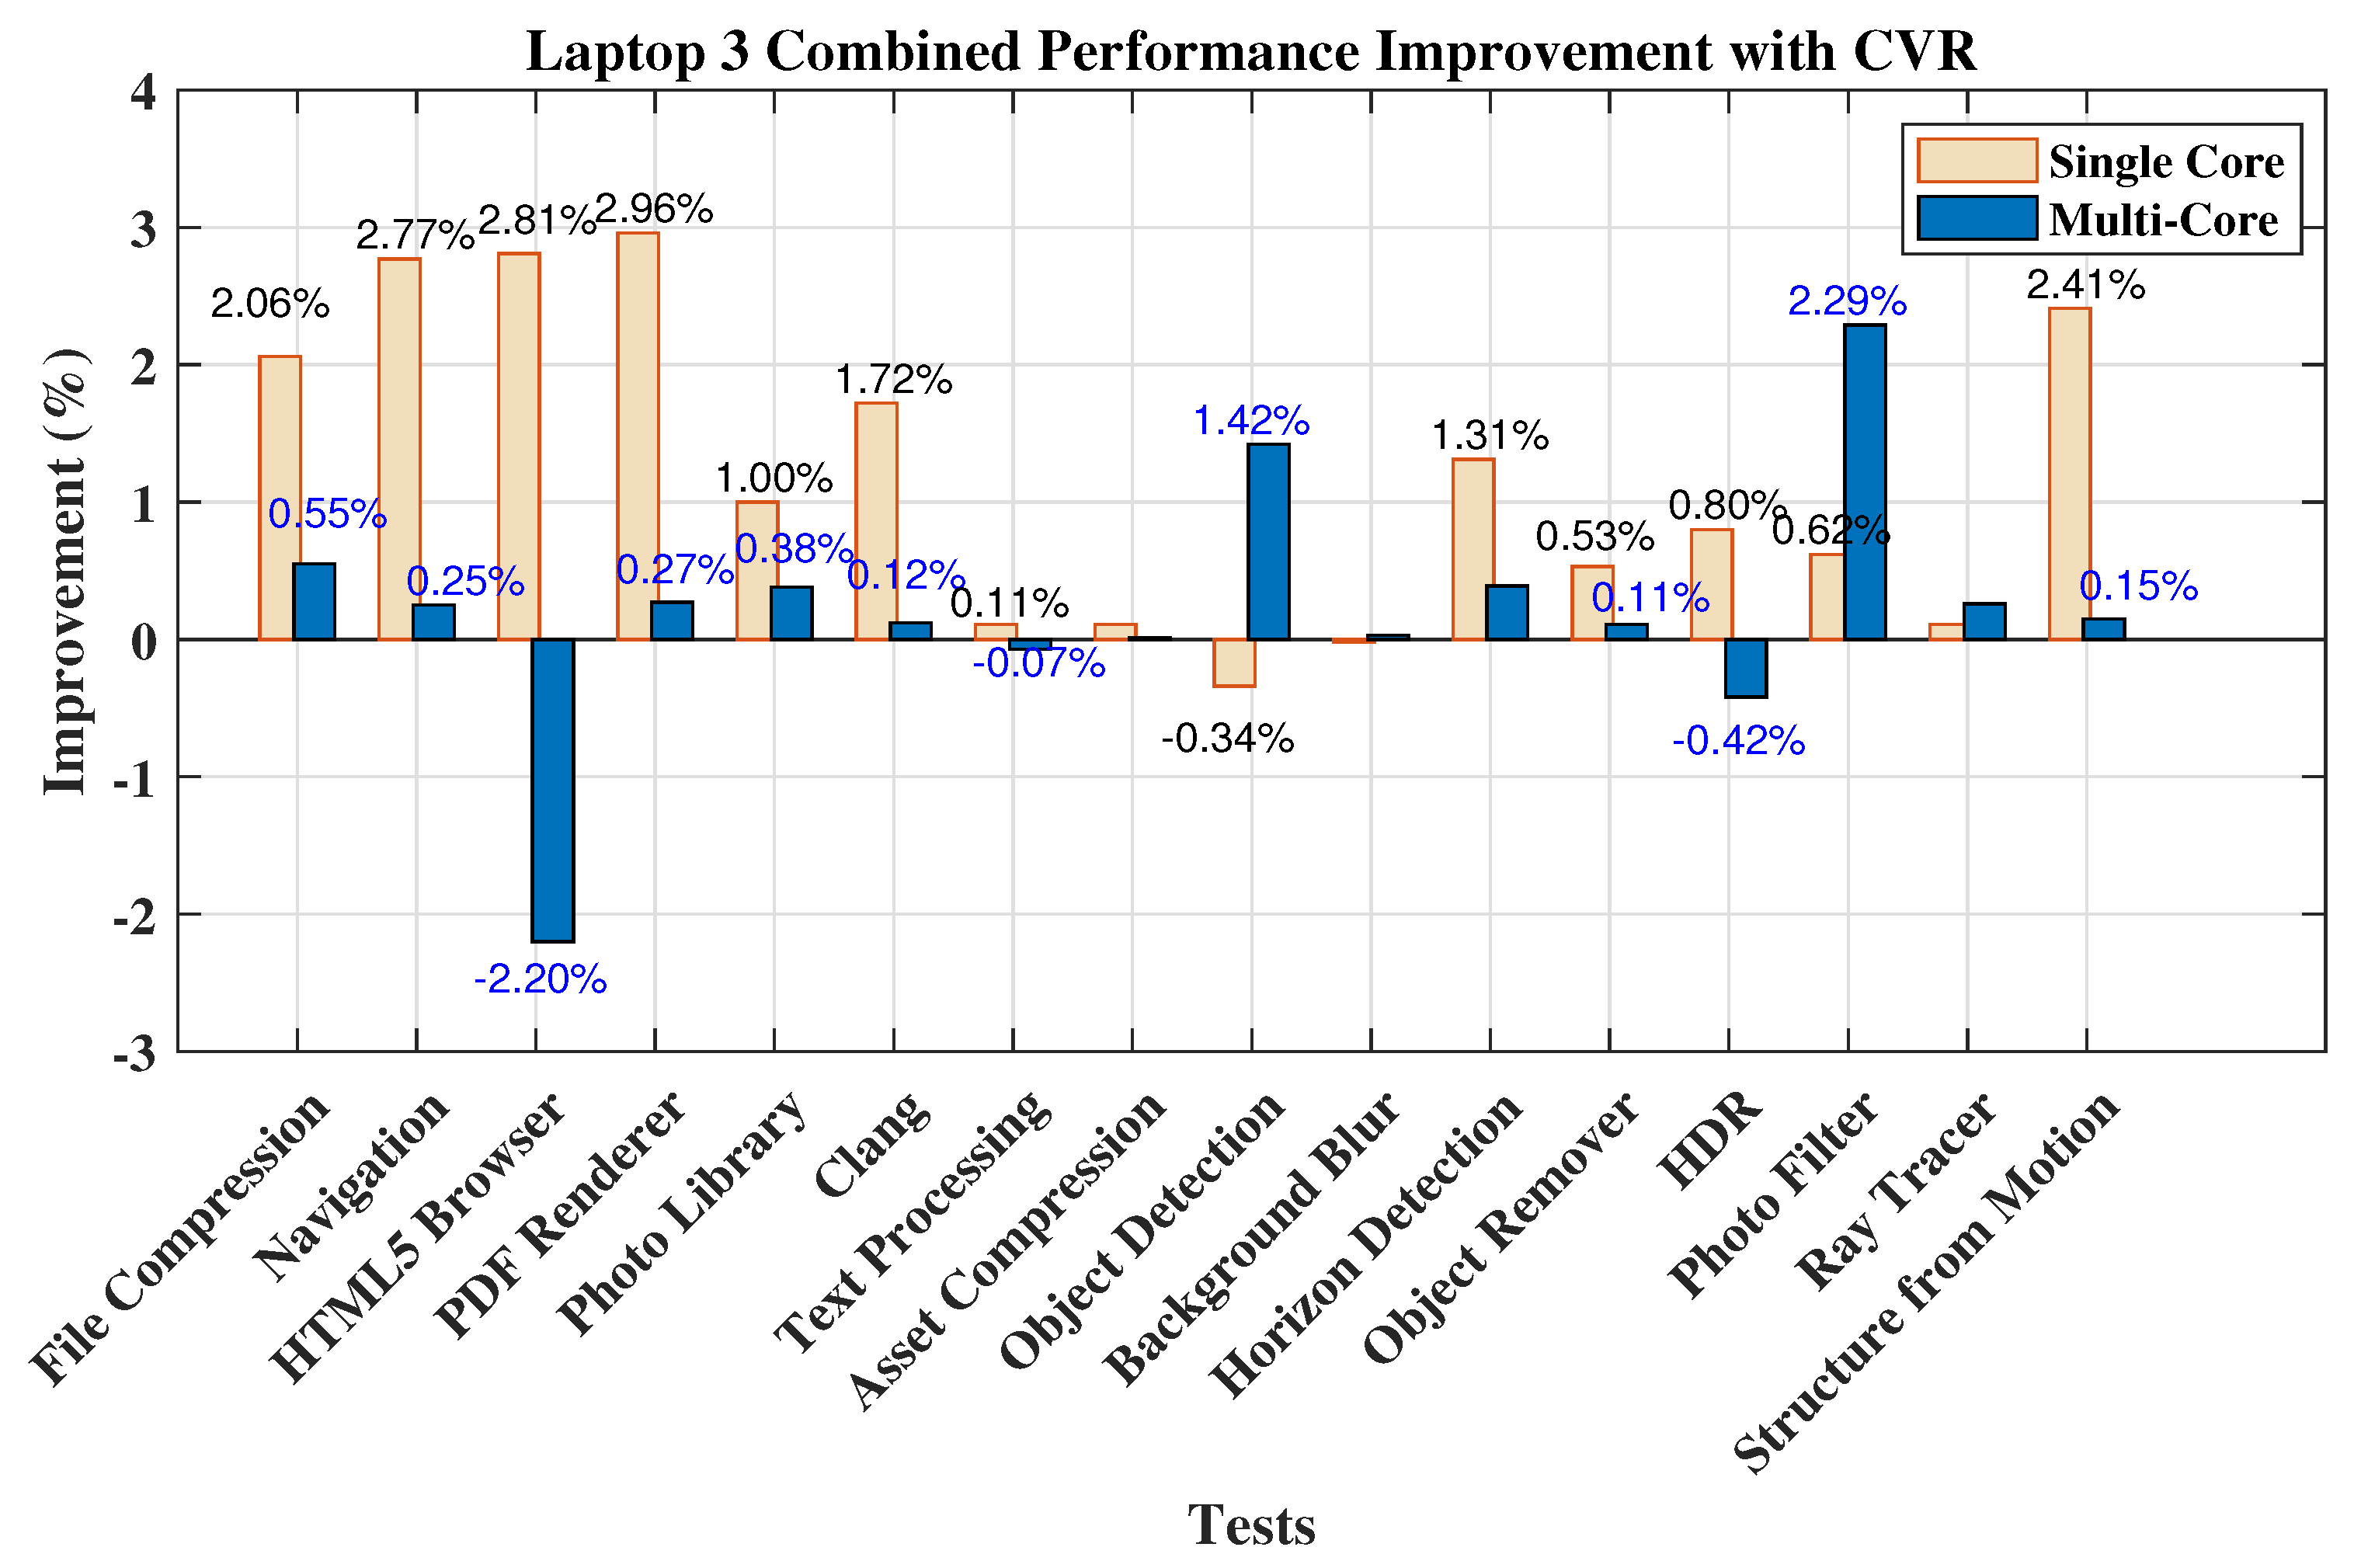
5.3. Performance Benchmarking of Computing Devices with and without CVR
Performance Enhancement Ratio Analysis
5.4. Power Supply Unit (PSU) Measurements Analysis
5.5. Thermal Performance Analysis under Variable Voltage Conditions
6. Conclusions
Author Contributions
Funding
Data Availability Statement
Conflicts of Interest
References
- Nourollahi, R.; Salyani, P.; Zare, K.; Mohammadi-Ivatloo, B.; Abdul-Malek, Z. Peak-Load Management of Distribution Network Using Conservation Voltage Reduction and Dynamic Thermal Rating. Sustainability 2022, 14, 11569. [Google Scholar] [CrossRef]
- Rahman, M.M.; Saha, S.; Majumder, M.Z.H.; Suki, T.T.; Rahman, M.H.; Akter, F.; Haque, M.A.S.; Hossain, M.K. Energy Conservation of Smart Grid System Using Voltage Reduction Technique and Its Challenges. Sustainability 2022, 9, 924–938. [Google Scholar]
- Gorjian, A.; Eskandari, M.; Moradi, M.H. Conservation Voltage Reduction in Modern Power Systems: Applications, Implementation, Quantification, and AI-Assisted Techniques. Energies 2023, 16, 2502. [Google Scholar] [CrossRef]
- Moradzadeh, A.; Sadeghian, O.; Pourhossein, K.; Mohammadi-Ivatloo, B.; Anvari-Moghaddam, A. Improving residential load disaggregation for sustainable development of energy via principal component analysis. Sustainability 2020, 12, 3158. [Google Scholar] [CrossRef]
- Anvari-Moghaddam, A.; Mohammadi-Ivatloo, B.; Asadi, S.; Larsen, K.G.; Shahidehpour, M. Sustainable Energy Systems Planning, Integration, and Management. Appl. Sci. 2019, 9, 4451. [Google Scholar] [CrossRef]
- Liu, Y.; Wang, X.; Zhao, L.; Liu, Y. Admittance-based load signature construction for non-intrusive appliance load monitoring. Energy Build. 2018, 171, 209–219. [Google Scholar] [CrossRef]
- Hua, H.; Qin, Z.; Dong, N.; Qin, Y.; Ye, M.; Wang, Z.; Chen, X.; Cao, J. Data-Driven Dynamical Control for Bottom-up Energy Internet System. IEEE Trans. Sustain. Energy 2022, 13, 315–327. [Google Scholar] [CrossRef]
- Lamedica, R.; Sorbillo, C.; Prudenzi, A. The continuous harmonic monitoring of single-phase electronic appliances: Desktop PC and printers. In Proceedings of the Ninth International Conference on Harmonics and Quality of Power. Proceedings (Cat. No. 00EX441), Orlando, FL, USA, 1–4 October 2000; Volume 2, pp. 697–702. [Google Scholar]
- 61000-3; Electromagnetic Compatibility. Part 3: Limits-Section 2: Limits for harmonic Current Emissions (Equipment Input Current < 16 A per Phase). IEC Standard: Newark, DE, USA, 1995.
- Nazari-Heris, M.; Mirzaei, M.A.; Mohammadi-Ivatloo, B.; Marzband, M.; Asadi, S. Economic-environmental effect of power to gas technology in coupled electricity and gas systems with price-responsive shiftable loads. J. Clean. Prod. 2020, 244, 118769. [Google Scholar] [CrossRef]
- Miyasawa, A.; Fujimoto, Y.; Hayashi, Y. Energy disaggregation based on smart metering data via semi-binary non-negative matrix factorization. Energy Build. 2019, 183, 547–558. [Google Scholar] [CrossRef]
- Bascetin, A.; Adiguzel, D.; Lü, S.T.; Karadogan, A.; Caglayan, M. The control of energy consumption and the investigation of CO2 emissions in the production of aggregate. Gazi Univ. J. Sci. 2011, 24, 647–656. [Google Scholar]
- Piette, M.; Eto, J.; Harris, J. Office Equipment Energy Use and Trends; LBNL Report #: LBL-31308; Lawrence Berkeley National Laboratory: Berkeley, CA, USA, 1991. [Google Scholar]
- National Grid Electricity System Operator. Power Quality in the GB Transmission Network: A System Operability Framework Document; National Grid Electricity System Operator: London, UK, 2023; Available online: https://www.nationalgrideso.com/document/277891/download (accessed on 28 December 2023).
- Mohod, S.W.; Aware, M.V. Power quality and grid code issues in wind energy conversion system. In An Update on Power Quality; IntechOpen: London, UK, 2013; pp. 21–36. [Google Scholar]
- Saqib, M.A.; Saleem, A.Z. Power-quality issues and the need for reactive-power compensation in the grid integration of wind power. Renew. Sustain. Energy Rev. 2015, 43, 51–64. [Google Scholar] [CrossRef]
- Rahman, M.T.; Hasan, K.N.; Sokolowski, P.; Mokhlis, H. Probabilistic Assessment of Conservation Voltage Reduction Using Static Load Model Parameter in the Presence of Uncertainties. IEEE Trans. Ind. Appl. 2023, 59, 2675–2685. [Google Scholar] [CrossRef]
- Xu, J.; Xie, B.; Liao, S.; Ke, D.; Sun, Y.; Jiang, X.; Yu, J. CVR-Based Real-Time Power Fluctuation Smoothing Control for Distribution Systems With High Penetration of PV and Experimental Demonstration. IEEE Trans. Smart Grid 2022, 13, 3619–3635. [Google Scholar] [CrossRef]
- Lakra, N.S.; Bag, B. Substation Demand Reduction using Combined Approach of CVR, VAr Optimization and Distributed Generation. In Proceedings of the 2022 Second International Conference on Advances in Electrical, Computing, Communication and Sustainable Technologies (ICAECT), Bhilai, India, 21–22 April 2022; pp. 1–6. [Google Scholar]
- Farkas, K.I.; Flinn, J.; Back, G.; Grunwald, D.; Anderson, J.M. Quantifying the energy consumption of a pocket computer and a Java virtual machine. In Proceedings of the 2000 ACM SIGMETRICS International Conference on Measurement and Modeling of Computer Systems, Santa Clara, CA, USA, 18–21 June 2000; pp. 252–263. [Google Scholar]
- Niewiadomska-Szynkiewicz, E.; Sikora, A.; Arabas, P.; Kołodziej, J. Control system for reducing energy consumption in backbone computer network. Concurr. Comput. Pract. Exp. 2013, 25, 1738–1754. [Google Scholar] [CrossRef]
- Lorch, J.R. A Complete Picture of the Energy Consumption of a Portable Computer. Master’s Thesis, University of California at Berkeley, Berkeley, CA, USA, 1995. [Google Scholar]
- Beitelmal, A.H.; Fabris, D. Servers and data centers energy performance metrics. Energy Build. 2014, 80, 562–569. [Google Scholar] [CrossRef]
- Zaim, O.; Gazel, T.U.; Akkemik, K.A. Measuring energy intensity in Japan: A new method. Eur. J. Oper. Res. 2017, 258, 778–789. [Google Scholar] [CrossRef]
- Hasanbeigi, A.; Hasanabadi, A.; Abdorrazaghi, M. Comparison analysis of energy intensity for five major sub-sectors of the textile industry in Iran. J. Clean. Prod. 2012, 23, 186–194. [Google Scholar] [CrossRef]
- Ahi, P.; Searcy, C.; Jaber, M.Y. Energy-related performance measures employed in sustainable supply chains: A bibliometric analysis. Sustain. Prod. Consum. 2016, 7, 1–15. [Google Scholar] [CrossRef]
- Luo, X.; Hong, T.; Chen, Y.; Piette, M.A. Electric load shape benchmarking for small- and medium-sized commercial buildings. Appl. Energy 2017, 204, 715–725. [Google Scholar] [CrossRef]
- Eyerman, S.; Eeckhout, L. System-level performance metrics for multiprogram workloads. IEEE Micro 2008, 28, 42–53. [Google Scholar] [CrossRef]
- Sherwood, T.; Perelman, E.; Hamerly, G.; Calder, B. Automatically characterizing large scale program behavior. ACM SIGPLAN Not. 2002, 37, 45–57. [Google Scholar] [CrossRef]
- Conte, T.M.; Hirsch, M.A.; Menezes, K.N. Reducing state loss for effective trace sampling of superscalar processors. In Proceedings of the International Conference on Computer Design (VLSI in Computers and Processors), Austin, TX, USA, 7–9 October 1996; pp. 468–477. [Google Scholar]
- Wunderlich, R.E.; Wenisch, T.F.; Falsafi, B.; Hoe, J.C. Smarts: Accelerating microarchitecture simulation via rigorous statistical sampling. In Proceedings of the 30th Annual International Symposium on Computer Architecture, San Diego, CA, USA, 9–11 June 2003; pp. 84–97. [Google Scholar]
- Yi, J.J.; Kodakara, S.V.; Sendag, R.; Lilja, D.J.; Hawkins, M.D. Characterizing and comparing prevailing simulation techniques. In Proceedings of the 11th International Symposium on High-Performance Computer Architecture, San Francisco, CA, USA, 12–16 February 2005; pp. 266–277. [Google Scholar]
- Yang, Z.; Hua, H.; Cao, J. A novel multiple impact factors based accuracy analysis approach for power quality disturbance detection. CSEE J. Power Energy Syst. 2020, 9, 88–99. [Google Scholar]
- Behzadirafi, S.; Malallah, Y.; Qaseer, L.; de León, F. Theoretical and Experimental Verification of CVR Energy Savings for Refrigeration Loads. IEEE Trans. Power Deliv. 2023, 38, 2489–2499. [Google Scholar] [CrossRef]
- Wang, Z.; Wang, J. Review on Implementation and Assessment of Conservation Voltage Reduction. IEEE Trans. Power Syst. 2014, 29, 1306–1315. [Google Scholar] [CrossRef]
- El-Shahat, A.; Haddad, R.J.; Alba-Flores, R.; Rios, F.; Helton, Z. Conservation Voltage Reduction Case Study. IEEE Access 2020, 8, 55383–55397. [Google Scholar] [CrossRef]
- Primate Labs. Geekbench. Available online: https://www.geekbench.com/ (accessed on 28 July 2023).
- Labvolt by Festo. Available online: https://labvolt.festo.com/ (accessed on 1 August 2023).
- CPUID HWMonitor. Available online: https://www.cpuid.com/softwares/hwmonitor.html (accessed on 28 July 2023).


| Category | Desktop 1 | Desktop 2 | Desktop 3 |
|---|---|---|---|
| Operating System | Microsoft Windows 10 Enterprise (64-bit) | Microsoft Windows 11 Famille (64-bit) | Microsoft Windows 11 Professionnel (64-bit) |
| Model | BRK5DRS | Dell Inc. XPS One 2710 | System manufacturer System Product Name |
| Processor | Intel Core i5-2320 @ 2.99 GHz, 1 Processor, 4 Cores | Intel Core i7-3770S @ 3.10 GHz, 1 Processor, 4 Cores, 8 Threads | AMD Ryzen 5 1600X, 1 Processor, 6 Cores, 12 Threads |
| Processor ID | Genuine-Intel Family 6 Model 42 Stepping 7 | GenuineIntel Family 6 Model 58 Stepping 9 | AuthenticAMD Family 23 Model 1 Stepping 1 |
| Processor Code-name | Sandy Bridge | Ivy Bridge | Summit Ridge |
| Processor Package | Socket 1155 LGA | Socket 1155 LGA | Socket AM4 (1331) |
| L1 Instruction Cache | 32.0 KB × 2 | 32.0 KB × 4 | 64.0 KB × 6 |
| L1 Data Cache | 32.0 KB × 2 | 32.0 KB × 4 | 32.0 KB × 6 |
| L2 Cache | 6.00 MB × 1 | 256 KB × 4 | 512 KB × 6 |
| L3 Cache | 3.00 MB × 1 | 8.00 MB × 1 | 8.00 MB × 2 |
| Motherboard | Intel Corporation DH67CL | Dell Inc. 02XMCT | ASUSTeK COMPUTER INC. PRIME X370-PRO |
| Category | Laptop 1 | Laptop 2 | Laptop 3 |
| Operating System | Microsoft Windows 10 Pro (64-bit) | Microsoft Windows 10 Pro Education (64-bit) | Microsoft Windows 10 Home (64-bit) |
| Model | Dell Inc. Latitude E4310 | Dell Inc. Vostro 14-3468 | ASUSTeK COMPUTER INC. TUF Z370-PLUS GAMING |
| Processor | Intel Core i5-520M @ 2.40 GHz, 1 Processor, 2 Cores, 4 Threads | Intel Core i7-7500U @ 2.89 GHz, 1 Processor, 2 Cores, 4 Threads | Intel Core i5-8500 @ 3.01 GHz, 1 Processor, 6 Cores |
| Processor ID | Genuine-Intel Family 6 Model 37 Stepping 5 | GenuineIntel Family 6 Model 142 Stepping 9 | GenuineIntel Family 6 Model 158 Stepping 10 |
| Processor Code-name | Arrandale | Kaby Lake-R | Coffee Lake |
| Processor Package | Socket 989 rPGA | Socket 1515 FCBGA | Socket 1151 LGA |
| L1 Instruction Cache | 32.0 KB × 2 | 32.0 KB × 2 | 32.0 KB × 2 |
| L1 Data Cache | 32.0 KB × 2 | 32.0 KB × 2 | 32.0 KB × 3 |
| L2 Cache | 256 KB × 2 | 256 KB × 2 | 256 KB × 3 |
| L3 Cache | 3.00 MB × 1 | 4.00 MB × 1 | 9.00 MB × 1 |
| Motherboard | Dell Inc. 0T6M8G | Dell Inc. 0VCX0K | ASUSTeK |
| Benchmark Test | Description |
|---|---|
| File Compression | This metric measures how rapidly |
| the system can compress files. | |
| Navigation | This function assesses the system’s |
| performance during web-based operations. | |
| HTML5 Browser | The HTML5 rendering critical for |
| the current online applications and multimedia content are evaluated | |
| PDF renderer | This metric assesses the system’s ability |
| to produce PDF documents effectively | |
| Photo Library | The system’s performance in maintaining and processing |
| picture files inside a photo library is measured. | |
| Clang | This function measures the system’s performance |
| when compiling programs with the Clang compiler. | |
| Asset Comparison | The system’s capacity to compress and decompress |
| digital materials effectively is measured. | |
| Object Detection | The performance of the system in |
| identifying items inside photos/videos. | |
| Background Blur | The ability of the system to create |
| a background blur effect on photographs | |
| Horizon Detection | This test evaluates the system’s ability to |
| recognize the horizon line in photos | |
| Object Remover | Evaluates effectiveness to remove items from photos. |
| HDR | Evaluates performance of producing/processing HDR photos. |
| Photo Filter | Evaluates performance in applying |
| filters and effects to photos | |
| Ray tracer | Capacity of the system to conduct |
| ray tracing is evaluated. | |
| Structure from Motion | Evaluates performance in building 3-D models using structure from motion approaches. |
| Voltage (V) | Desktop PC Active Power (W) | Laptop Power Consumption (W) | ||||
|---|---|---|---|---|---|---|
| Desktop 1 | Desktop 2 | Desktop 3 | Laptop 1 | Laptop 2 | Laptop 3 | |
| 230 | 15.4 | 22.202 | 18.55 | 35.6 | 40.25 | 25.52 |
| 225 | 15.8 | 22.388 | 17.65 | 32.52 | 39.67 | 25.19 |
| 220 | 15.2 | 21.586 | 18.98 | 33.41 | 39.67 | 24.12 |
| 215 | 16.72 | 20.869 | 18.52 | 32.79 | 38 | 23.09 |
| 210 | 14.78 | 18.955 | 17.25 | 32.62 | 37.48 | 21.89 |
| 205 | 14.9 | 18.622 | 17.11 | 31.66 | 36.02 | 20.51 |
| 200 | 14.73 | 18.241 | 16.89 | 31.91 | 35.7 | 19.74 |
| Voltage (V) | Desktop 1 | Desktop 2 | Desktop 3 | Laptop 1 | Laptop 2 | Laptop 3 |
|---|---|---|---|---|---|---|
| 230 | - | - | - | - | - | - |
| 225 | −1.19 | −0.37 | 2.23 | 3.97 | 0.66 | 0.59 |
| 220 | 0.29 | 0.64 | −0.53 | 1.41 | 0.33 | 1.26 |
| 215 | −1.31 | 0.92 | 0.02 | 1.21 | 0.85 | 1.46 |
| 210 | 0.46 | 1.68 | 0.8 | 0.96 | 0.79 | 1.63 |
| 205 | 0.29 | 1.48 | 0.71 | 1.01 | 0.96 | 1.8 |
| 200 | 0.33 | 1.36 | 0.68 | 0.79 | 0.86 | 1.73 |
| Test | Single-Core Performance | Multi-Core Performance | ||||
|---|---|---|---|---|---|---|
| W/O CVR | With CVR | % Improvement | W/O CVR | With CVR | % Improvement | |
| File Compression | 637.2 | 651.8 | 2.24 | 810.4 | 823.6 | 1.60 |
| Navigation | 824.4 | 763.4 | −7.99 | 1890.4 | 1887.6 | −0.15 |
| HTML5 Browser | 692.4 | 712.8 | 2.86 | 1372.4 | 1376.4 | 0.29 |
| PDF Renderer | 655.4 | 751 | 12.73 | 1730.4 | 1704.2 | −1.54 |
| Photo Library | 180.2 | 191.2 | 5.75 | 353.8 | 359.6 | 1.61 |
| Clang | 702.6 | 715.8 | 1.84 | 1493.2 | 1534.4 | 2.69 |
| Text Processing | 689 | 714.2 | 3.53 | 778.2 | 840.8 | 7.45 |
| Asset Compression | 660.4 | 676.6 | 2.39 | 1424 | 1516 | 6.07 |
| Object Detection | 45.4 | 43.4 | −4.61 | 77.4 | 87.2 | 11.24 |
| Background Blur | 281.6 | 254.4 | −10.69 | 493.2 | 526 | 6.24 |
| Horizon Detection | 549.8 | 504.8 | −8.91 | 1141.6 | 1209.8 | 5.64 |
| Object Remover | 410 | 421 | 2.61 | 740.2 | 819.8 | 9.71 |
| HDR | 410.2 | 442.8 | 7.36 | 891.2 | 948.2 | 6.01 |
| Photo Filter | 262 | 269.6 | 2.82 | 519.2 | 566.8 | 8.40 |
| Ray Tracer | 566.4 | 583 | 2.85 | 1357.6 | 1394.4 | 2.64 |
| Structure from Motion | 221.2 | 223.2 | 0.90 | 468 | 489 | 4.29 |
| Overall Score | 412.6 | 418.2 | 1.34 (%) | 789.2 | 824.4 | 4.27 (%) |
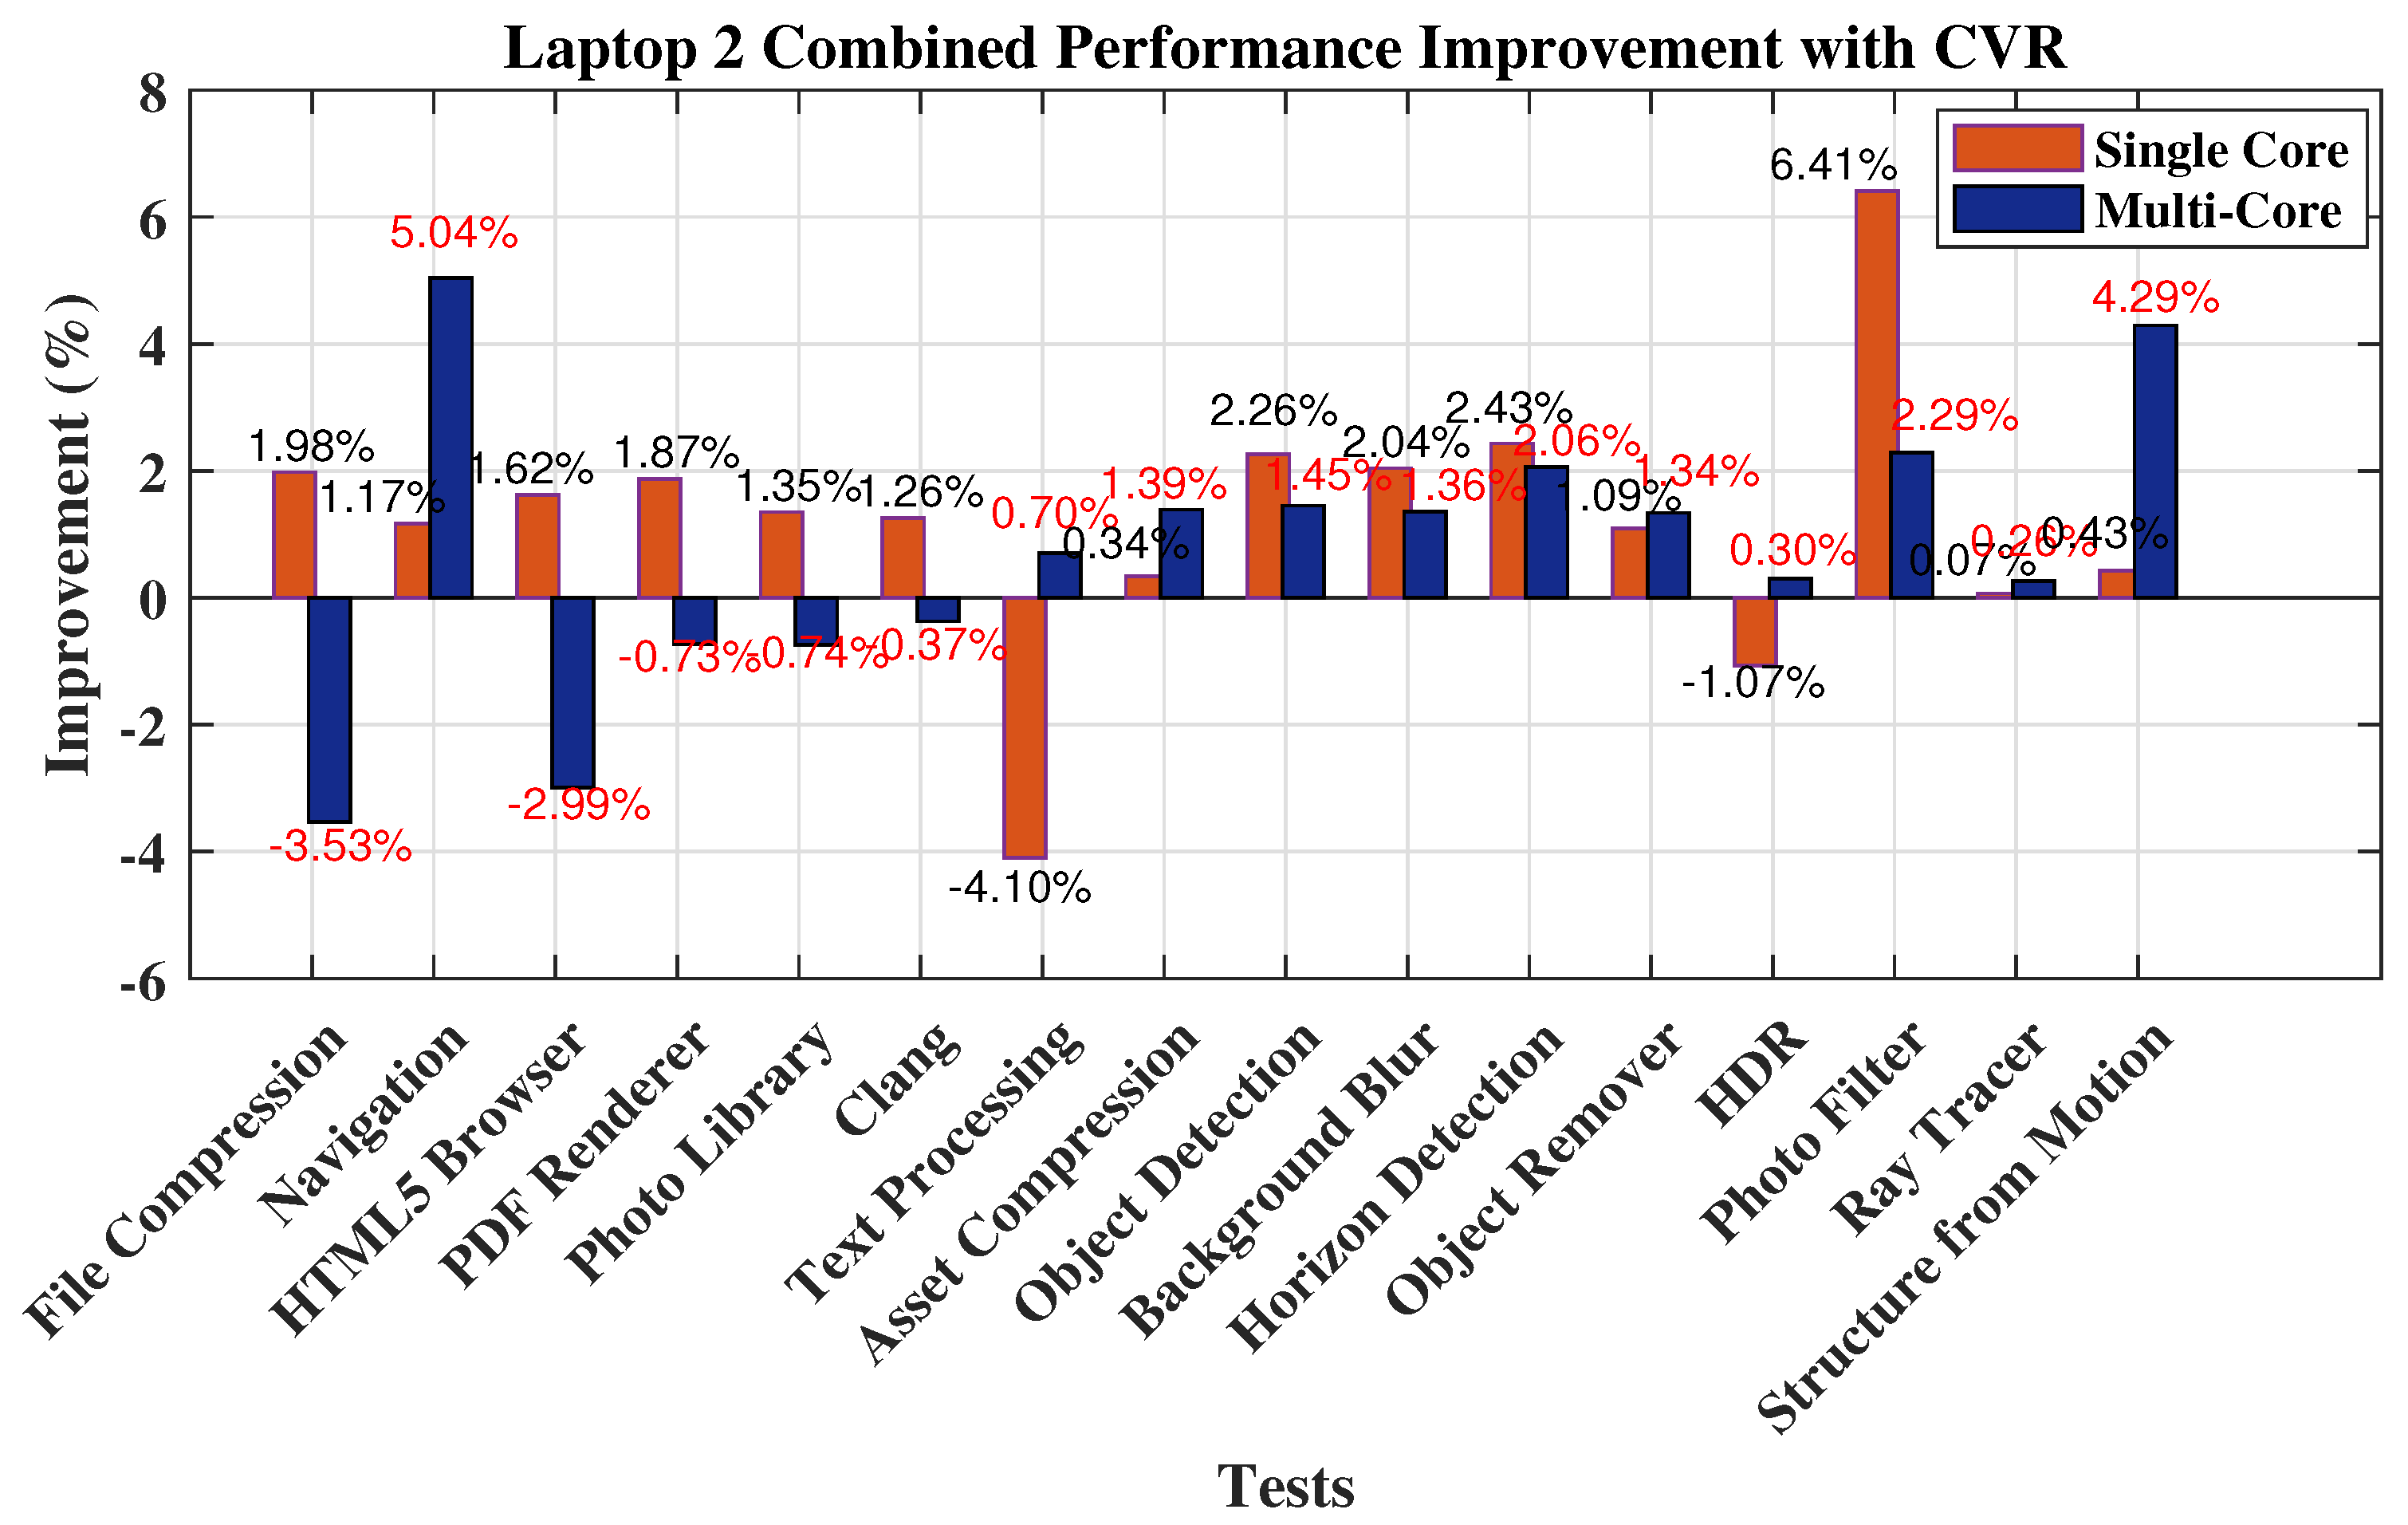
| Test | Single-Core Performance | Multi-Core Performance | ||||
|---|---|---|---|---|---|---|
| W/O CVR | With CVR | % Improvement | W/O CVR | With CVR | % Improvement | |
| File Compression | 1118.6 | 1141.2 | 1.98 | 1284.6 | 1240.8 | −3.53 |
| Navigation | 1371.4 | 1387.6 | 1.17 | 2942.2 | 3098.2 | 5.04 |
| HTML5 Browser | 1241.8 | 1262.2 | 1.62 | 2290.2 | 2223.8 | −2.99 |
| PDF Renderer | 1272.4 | 1296.6 | 1.87 | 2915.2 | 2894.2 | −0.73 |
| Photo Library | 996.8 | 1010.4 | 1.35 | 2160.6 | 2144.8 | −0.74 |
| Clang | 1313.4 | 1330.2 | 1.26 | 2854.8 | 2844.4 | −0.37 |
| Text Processing | 1156.8 | 1111.2 | −4.10 | 1399.8 | 1409.6 | 0.70 |
| Asset Compression | 1339.4 | 1344 | 0.34 | 3285.2 | 3331.6 | 1.39 |
| Object Detection | 535.6 | 548 | 2.26 | 980.8 | 995.2 | 1.45 |
| Background Blur | 1626.4 | 1660.2 | 2.04 | 3146.2 | 3189.6 | 1.36 |
| Horizon Detection | 1774.4 | 1818.6 | 2.43 | 3625.6 | 3702 | 2.06 |
| Object Remover | 982.2 | 993 | 1.09 | 1938.8 | 1965.2 | 1.34 |
| HDR | 1229.4 | 1216.4 | −1.07 | 2358 | 2365.2 | 0.30 |
| Photo Filter | 1474.6 | 1575.6 | 6.41 | 2482.8 | 2483 | 0.01 |
| Ray Tracer | 1079.8 | 1080.6 | 0.07 | 2921.2 | 3002.4 | 2.70 |
| Structure from Motion | 1384.8 | 1404.4 | 1.40 | 2828.2 | 2711.8 | 4.29 |
| Overall Score | 1189 | 1202 | 1.09 (%) | 2276.4 | 2279.6 | 0.14 (%) |
| Test | Single-Core Performance | Multi-Core Performance | ||||
|---|---|---|---|---|---|---|
| W/O CVR | With CVR | % Improvement | W/O CVR | With CVR | % Improvement | |
| File Compression | 1349 | 1377.4 | 2.06 | 2224.4 | 2236.8 | 0.55 |
| Navigation | 1417.2 | 1457.6 | 2.77 | 5529.6 | 5543.4 | 0.25 |
| HTML5 Browser | 1100.8 | 1132.6 | 2.81 | 4724.4 | 4715.2 | −0.20 |
| PDF Renderer | 1266.4 | 1305 | 2.96 | 6486.2 | 6503.6 | 0.27 |
| Photo Library | 1169 | 1180.8 | 1.00 | 4707 | 4725 | 0.38 |
| Clang | 1463 | 1488.6 | 1.72 | 7285.4 | 7293.8 | 0.12 |
| Text Processing | 1317.8 | 1319.2 | 0.11 | 1762.8 | 1761.6 | −0.07 |
| Asset Compression | 1517.6 | 1519.2 | 0.11 | 8233.6 | 8234.2 | 0.01 |
| Object Detection | 641.2 | 639 | −0.34 | 2152.8 | 2183.8 | 1.42 |
| Background Blur | 1942.8 | 1942.4 | −0.02 | 7342.8 | 7344.8 | 0.03 |
| Horizon Detection | 2046.4 | 2073.6 | 1.31 | 6775.8 | 6802 | 0.39 |
| Object Remover | 1305.4 | 1312.4 | 0.53 | 4832.2 | 4837.4 | 0.11 |
| HDR | 1492.6 | 1504.6 | 0.80 | 4924.4 | 4903.8 | −0.42 |
| Photo Filter | 1972.4 | 1984.8 | 0.62 | 4118.4 | 4215 | 2.29 |
| Ray Tracer | 1121.2 | 1122.4 | 0.11 | 7191.8 | 7210.8 | 0.26 |
| Structure from Motion | 1604 | 1643.6 | 2.41 | 4994.6 | 5002.2 | 0.15 |
| Overall Score | 1336.4 | 1393.8 | 4.12 (%) | 4642.4 | 4680.2 | 0.81 (%) |
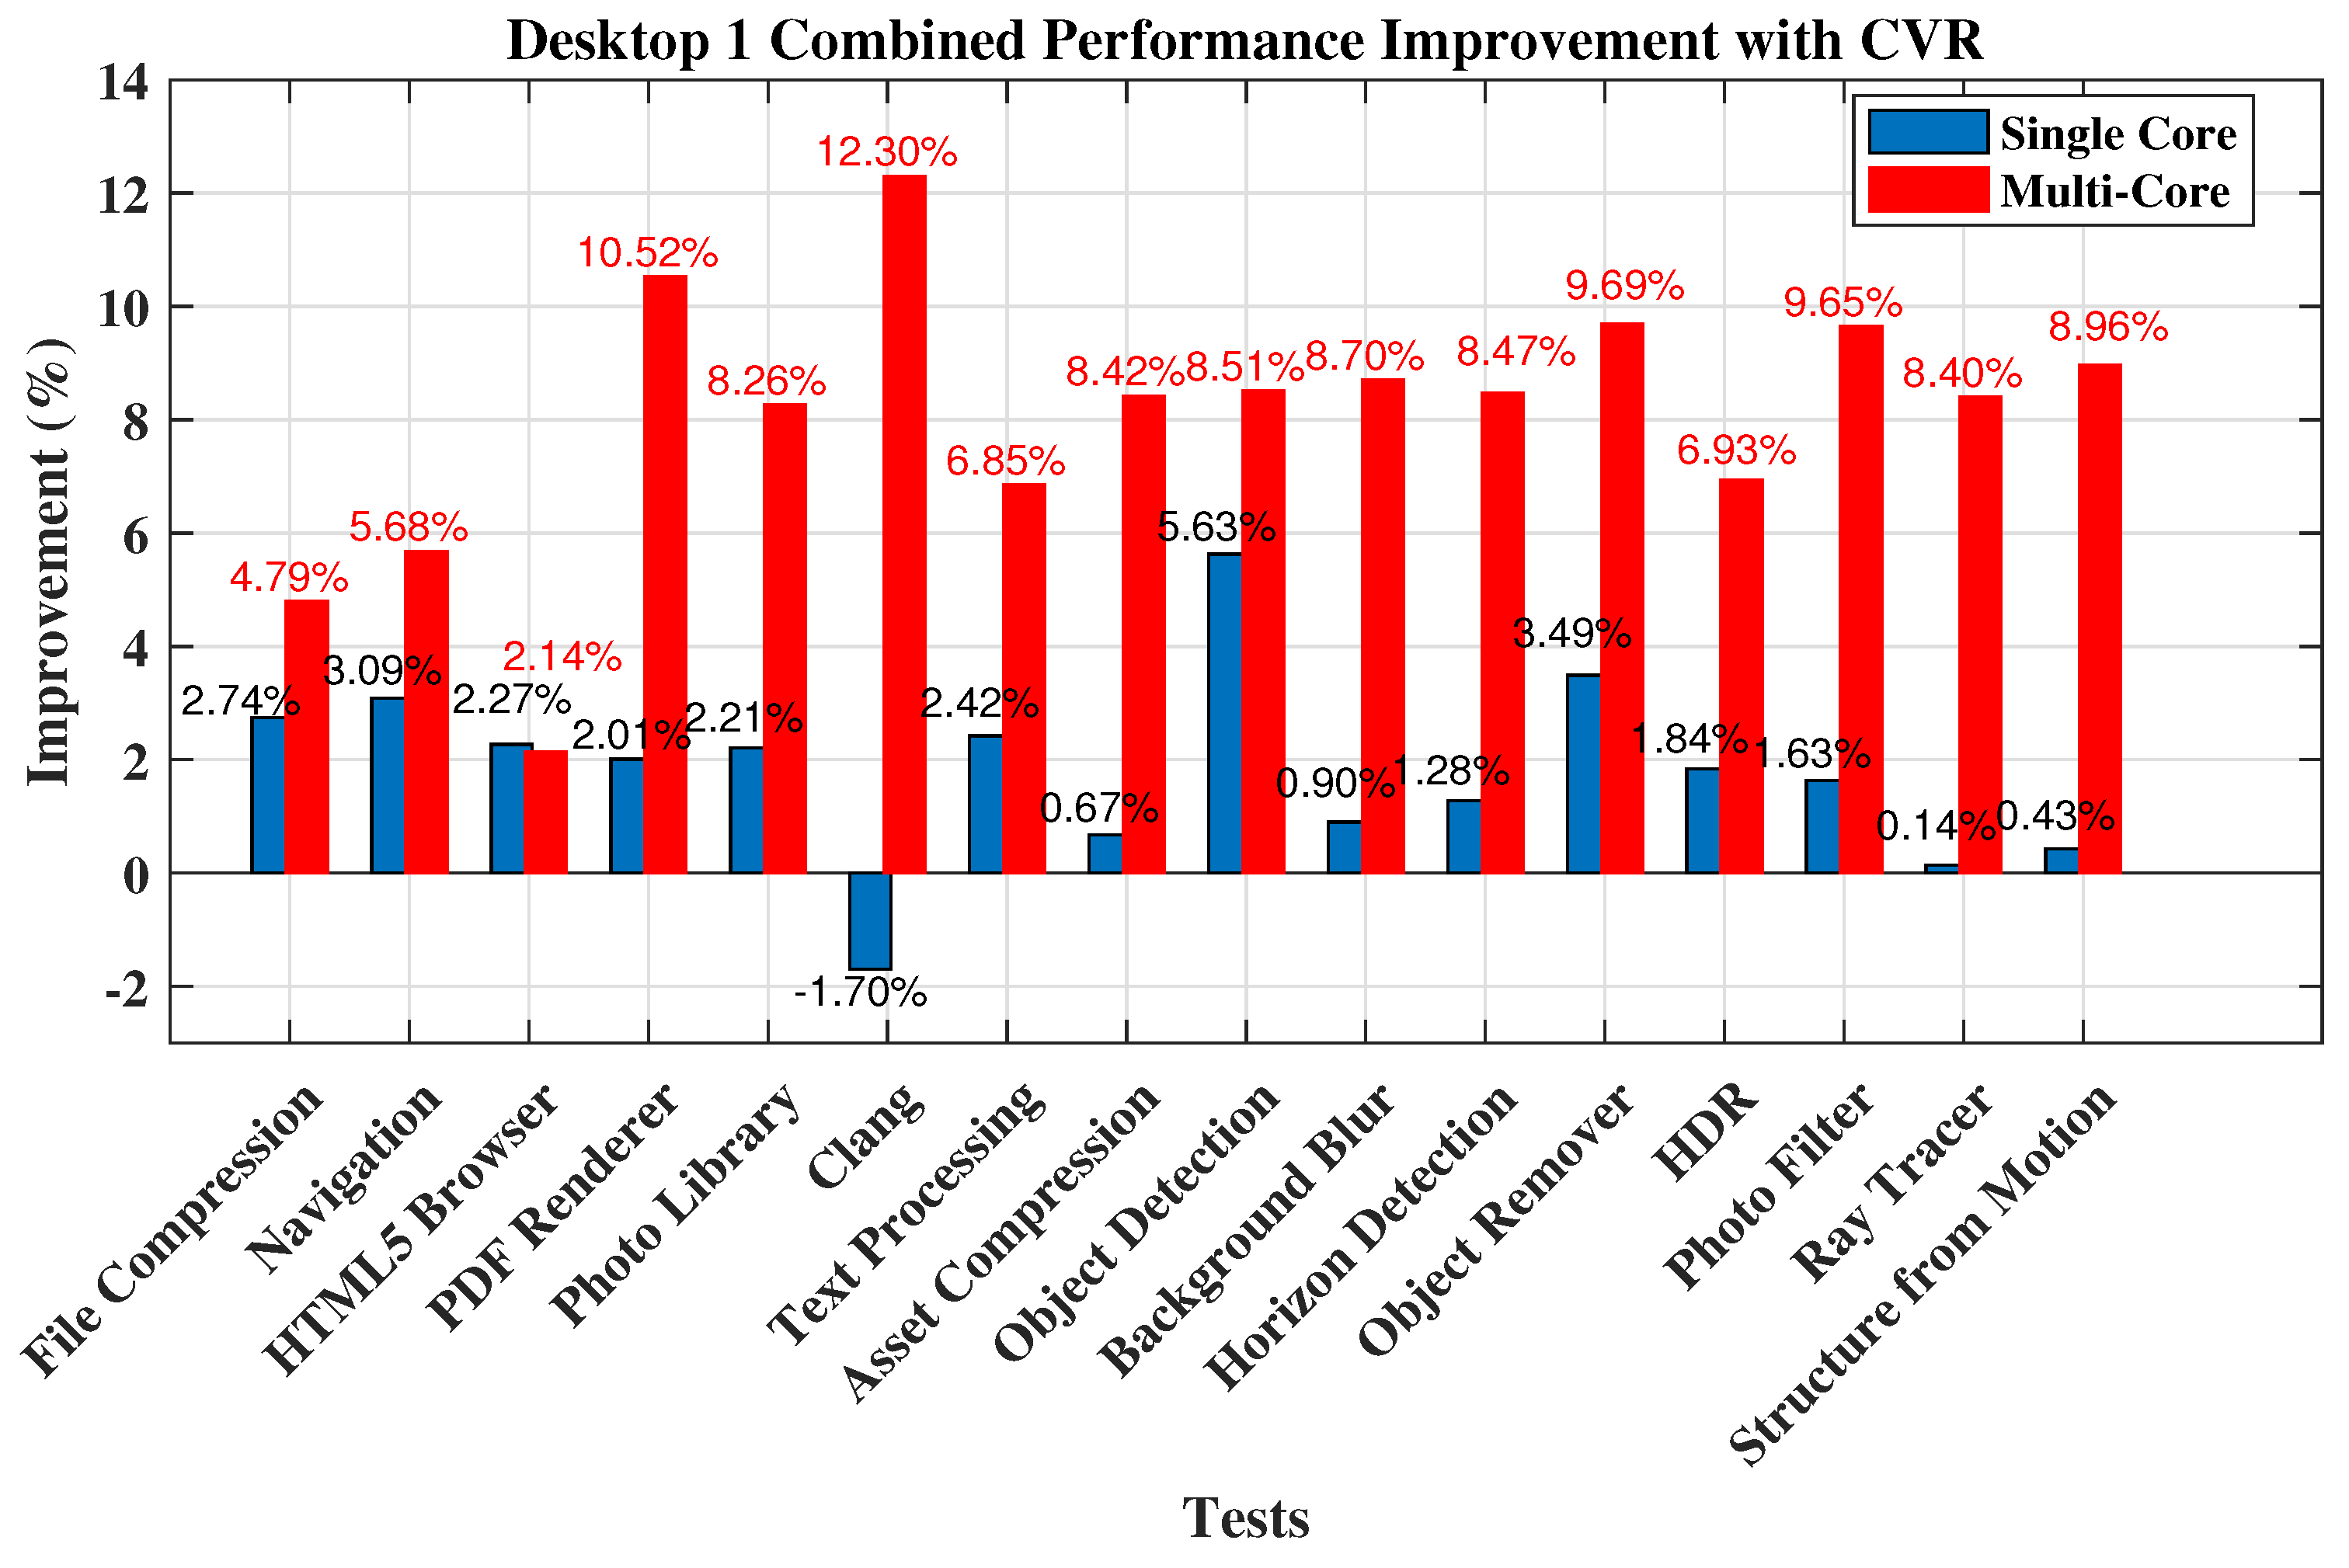
| Test | Single-Core Performance | Multi-Core Performance | ||||
|---|---|---|---|---|---|---|
| W/O CVR | With CVR | % Improvement | W/O CVR | With CVR | % Improvement | |
| File Compression | 838 | 861.6 | 2.74 | 1236.8 | 1299 | 4.79 |
| Navigation | 1109.6 | 1145 | 3.09 | 3104 | 3290.8 | 5.68 |
| HTML5 Browser | 878.4 | 898.8 | 2.27 | 1960.4 | 2003.2 | 2.14 |
| PDF Renderer | 918.6 | 937.4 | 2.01 | 2545.2 | 2844.4 | 10.52 |
| Photo Library | 220.8 | 225.8 | 2.21 | 733.4 | 799.4 | 8.26 |
| Clang | 909.8 | 894.6 | −1.70 | 2952 | 3366.2 | 12.30 |
| Text Processing | 839 | 859.8 | 2.42 | 1020 | 1095 | 6.85 |
| Asset Compression | 862.2 | 868 | 0.67 | 2928.4 | 3197.8 | 8.42 |
| Object Detection | 53.6 | 56.8 | 5.63 | 178.4 | 195 | 8.51 |
| Background Blur | 486.8 | 491.2 | 0.90 | 1578.6 | 1729 | 8.70 |
| Horizon Detection | 756.4 | 766.2 | 1.28 | 2090 | 2283.4 | 8.47 |
| Object Remover | 701.6 | 727 | 3.49 | 2021.4 | 2238.2 | 9.69 |
| HDR | 522.4 | 532.2 | 1.84 | 1454 | 1562.2 | 6.93 |
| Photo Filter | 337.2 | 342.8 | 1.63 | 894.8 | 990.4 | 9.65 |
| Ray Tracer | 722 | 723 | 0.14 | 2504.4 | 2734.2 | 8.40 |
| Structure from Motion | 276.6 | 277.8 | 0.43 | 908.8 | 998.2 | 8.96 |
| Overall Score | 547.4 | 555.8 | 1.51 (%) | 1452.8 | 1580.2 | 8.06 (%) |
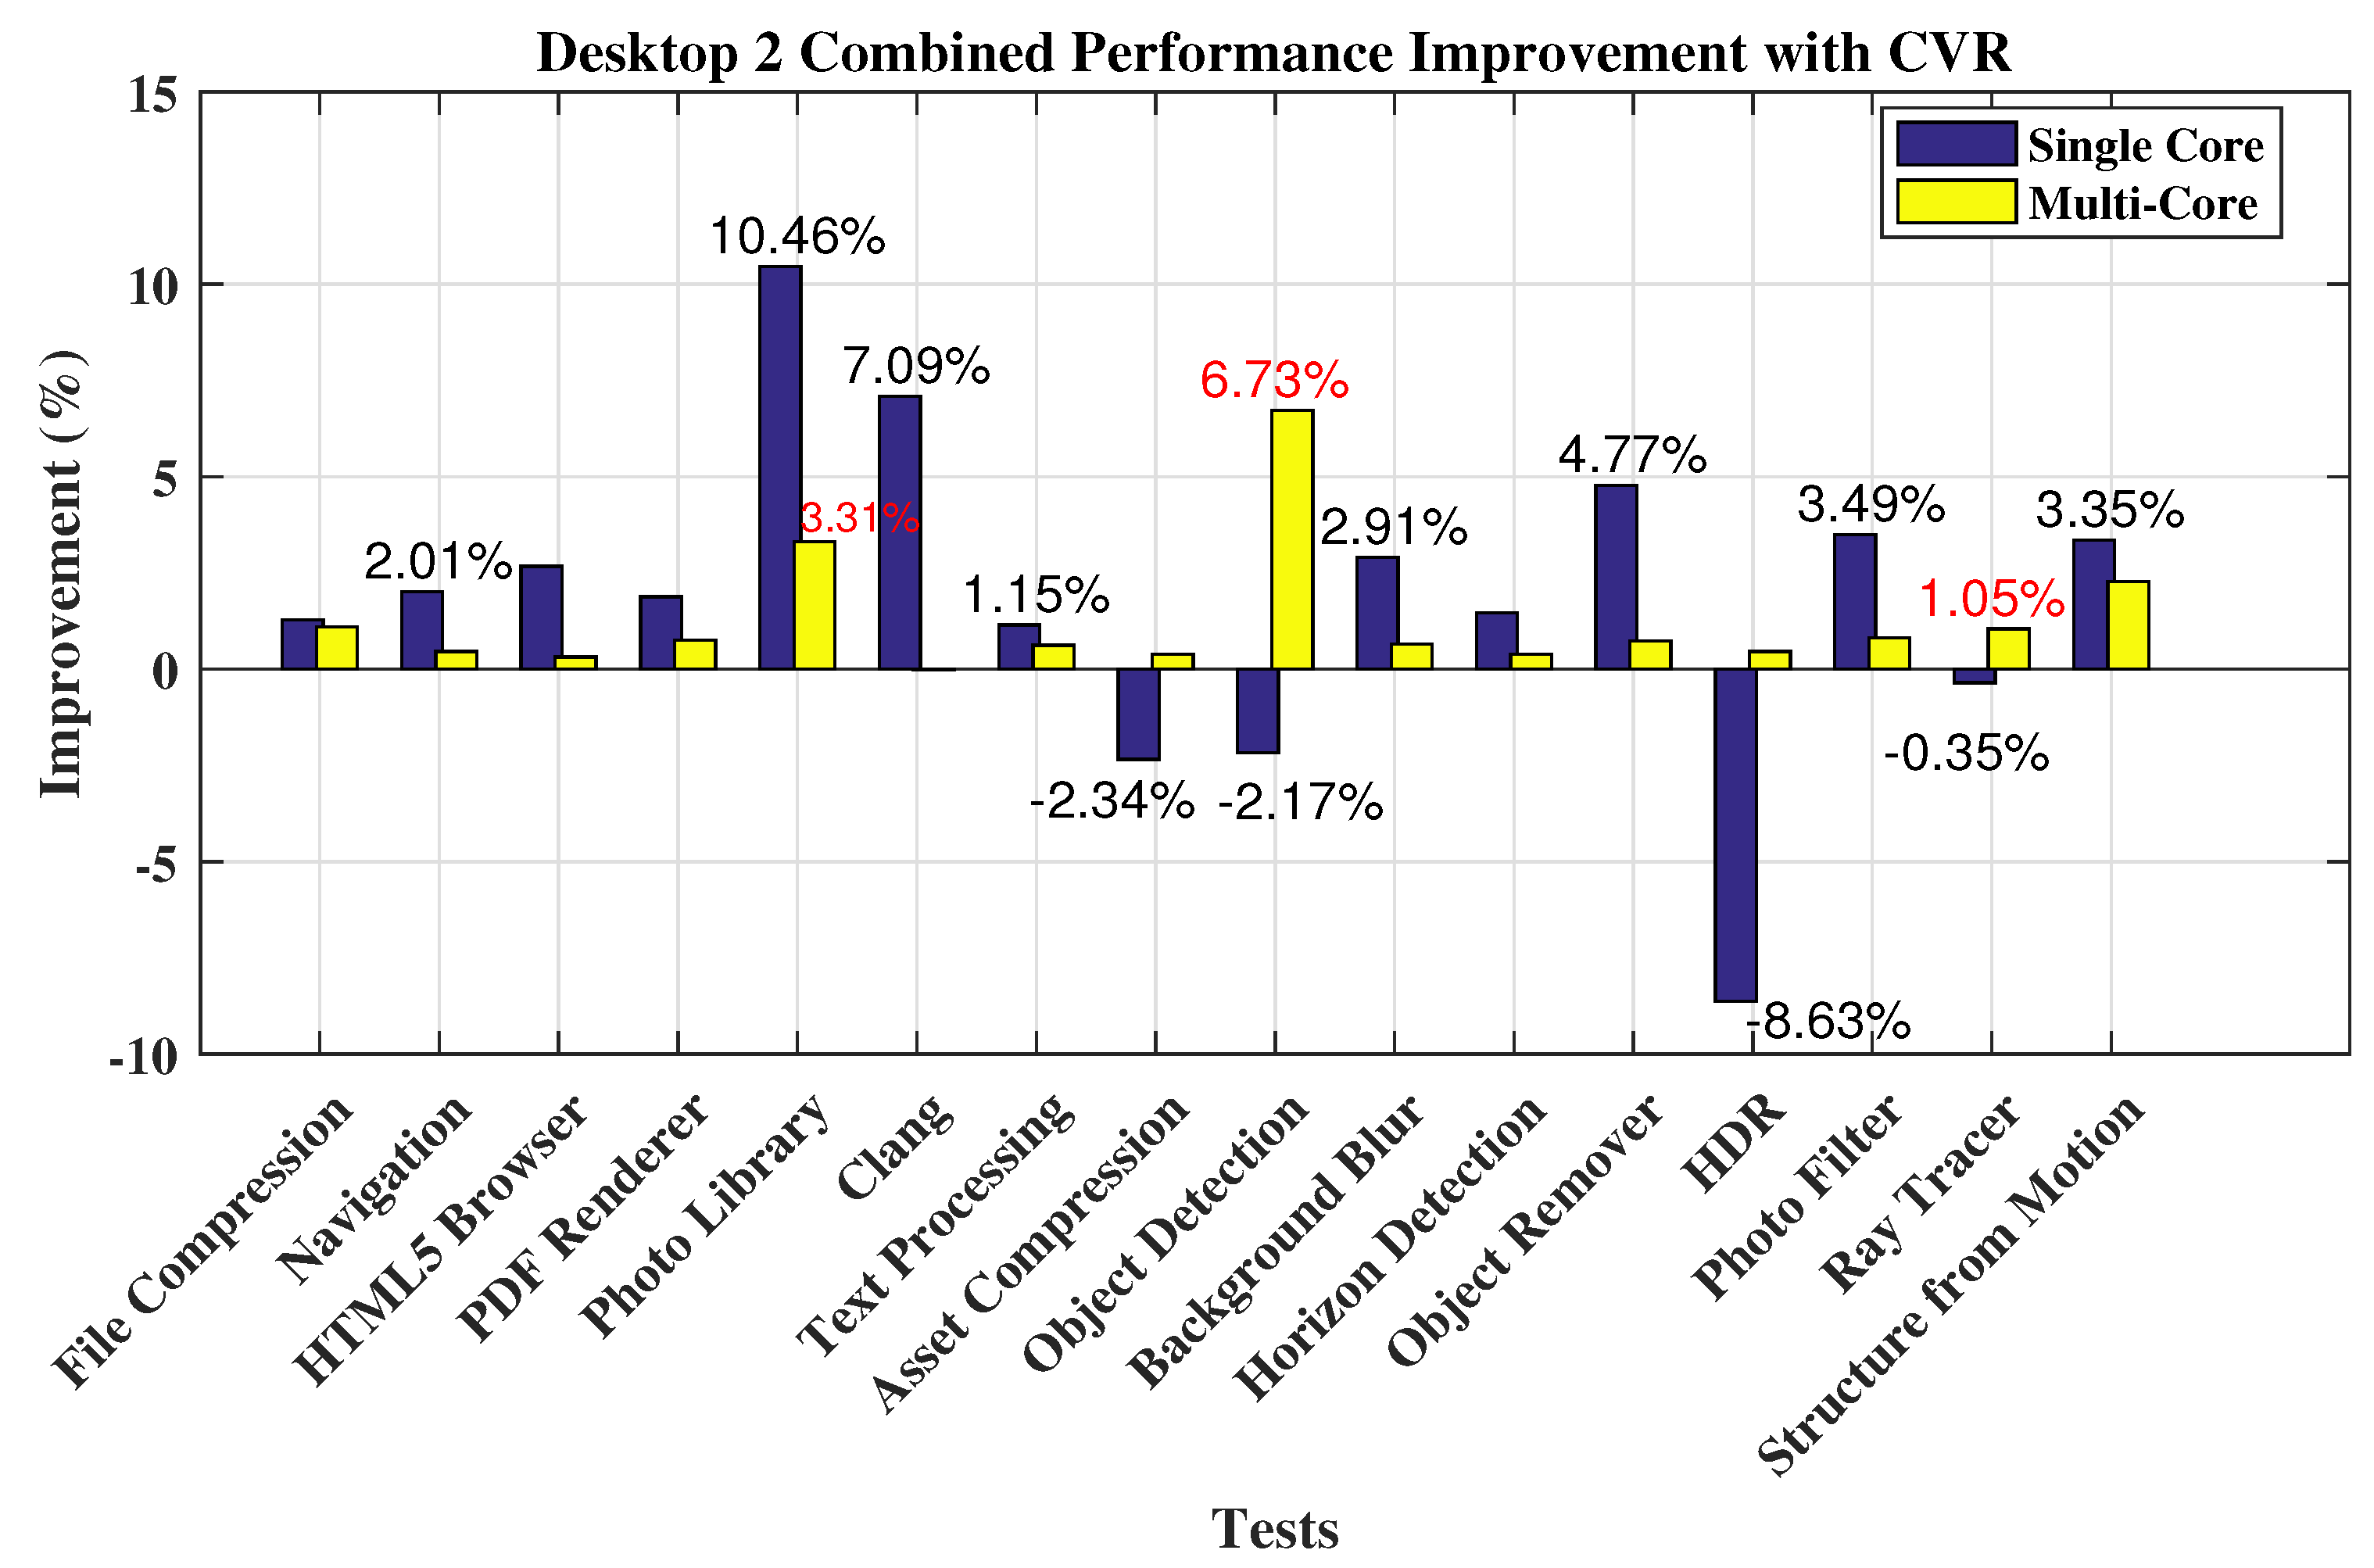
| Test | Single-Core Performance | Multi-Core Performance | ||||
|---|---|---|---|---|---|---|
| W/O CVR | With CVR | % Improvement | W/O CVR | With CVR | % Improvement | |
| File Compression | 968.6 | 981.2 | 1.28 | 2219.75 | 2244.4 | 1.10 |
| Navigation | 1158.4 | 1182.2 | 2.01 | 4732 | 4754 | 0.46 |
| HTML5 Browser | 1093 | 1123 | 2.67 | 3184.5 | 3194.6 | 0.32 |
| PDF Renderer | 1125 | 1146.6 | 1.88 | 3873.5 | 3903 | 0.76 |
| Photo Library | 260.2 | 290.6 | 10.46 | 1047.5 | 1083.4 | 3.31 |
| Clang | 1069.2 | 1150.8 | 7.09 | 4365 | 4364.6 | −0.01 |
| Text Processing | 1032.8 | 1044.8 | 1.15 | 1304.25 | 1312.4 | 0.62 |
| Asset Compression | 1076.2 | 1051.6 | −2.34 | 4545 | 4563 | 0.39 |
| Object Detection | 66 | 64.6 | −2.17 | 243.25 | 260.8 | 6.73 |
| Background Blur | 573.2 | 590.4 | 2.91 | 1922.75 | 1935.4 | 0.65 |
| Horizon Detection | 882.4 | 895.6 | 1.47 | 3249.5 | 3262.2 | 0.39 |
| Object Remover | 911.2 | 956.8 | 4.77 | 3343.25 | 3368 | 0.73 |
| HDR | 657.2 | 605 | −8.63 | 2650 | 2662.2 | 0.46 |
| Photo Filter | 398.6 | 413 | 3.49 | 1089.25 | 1098.2 | 0.81 |
| Ray Tracer | 868 | 865 | −0.35 | 4143.5 | 4187.6 | 1.05 |
| Structure from Motion | 340.6 | 352.4 | 3.35 | 1480.25 | 1514.8 | 2.28 |
| Overall Score | 652.4 | 683.8 | 4.59 (%) | 2189.4 | 2218 | 1.29 (%) |
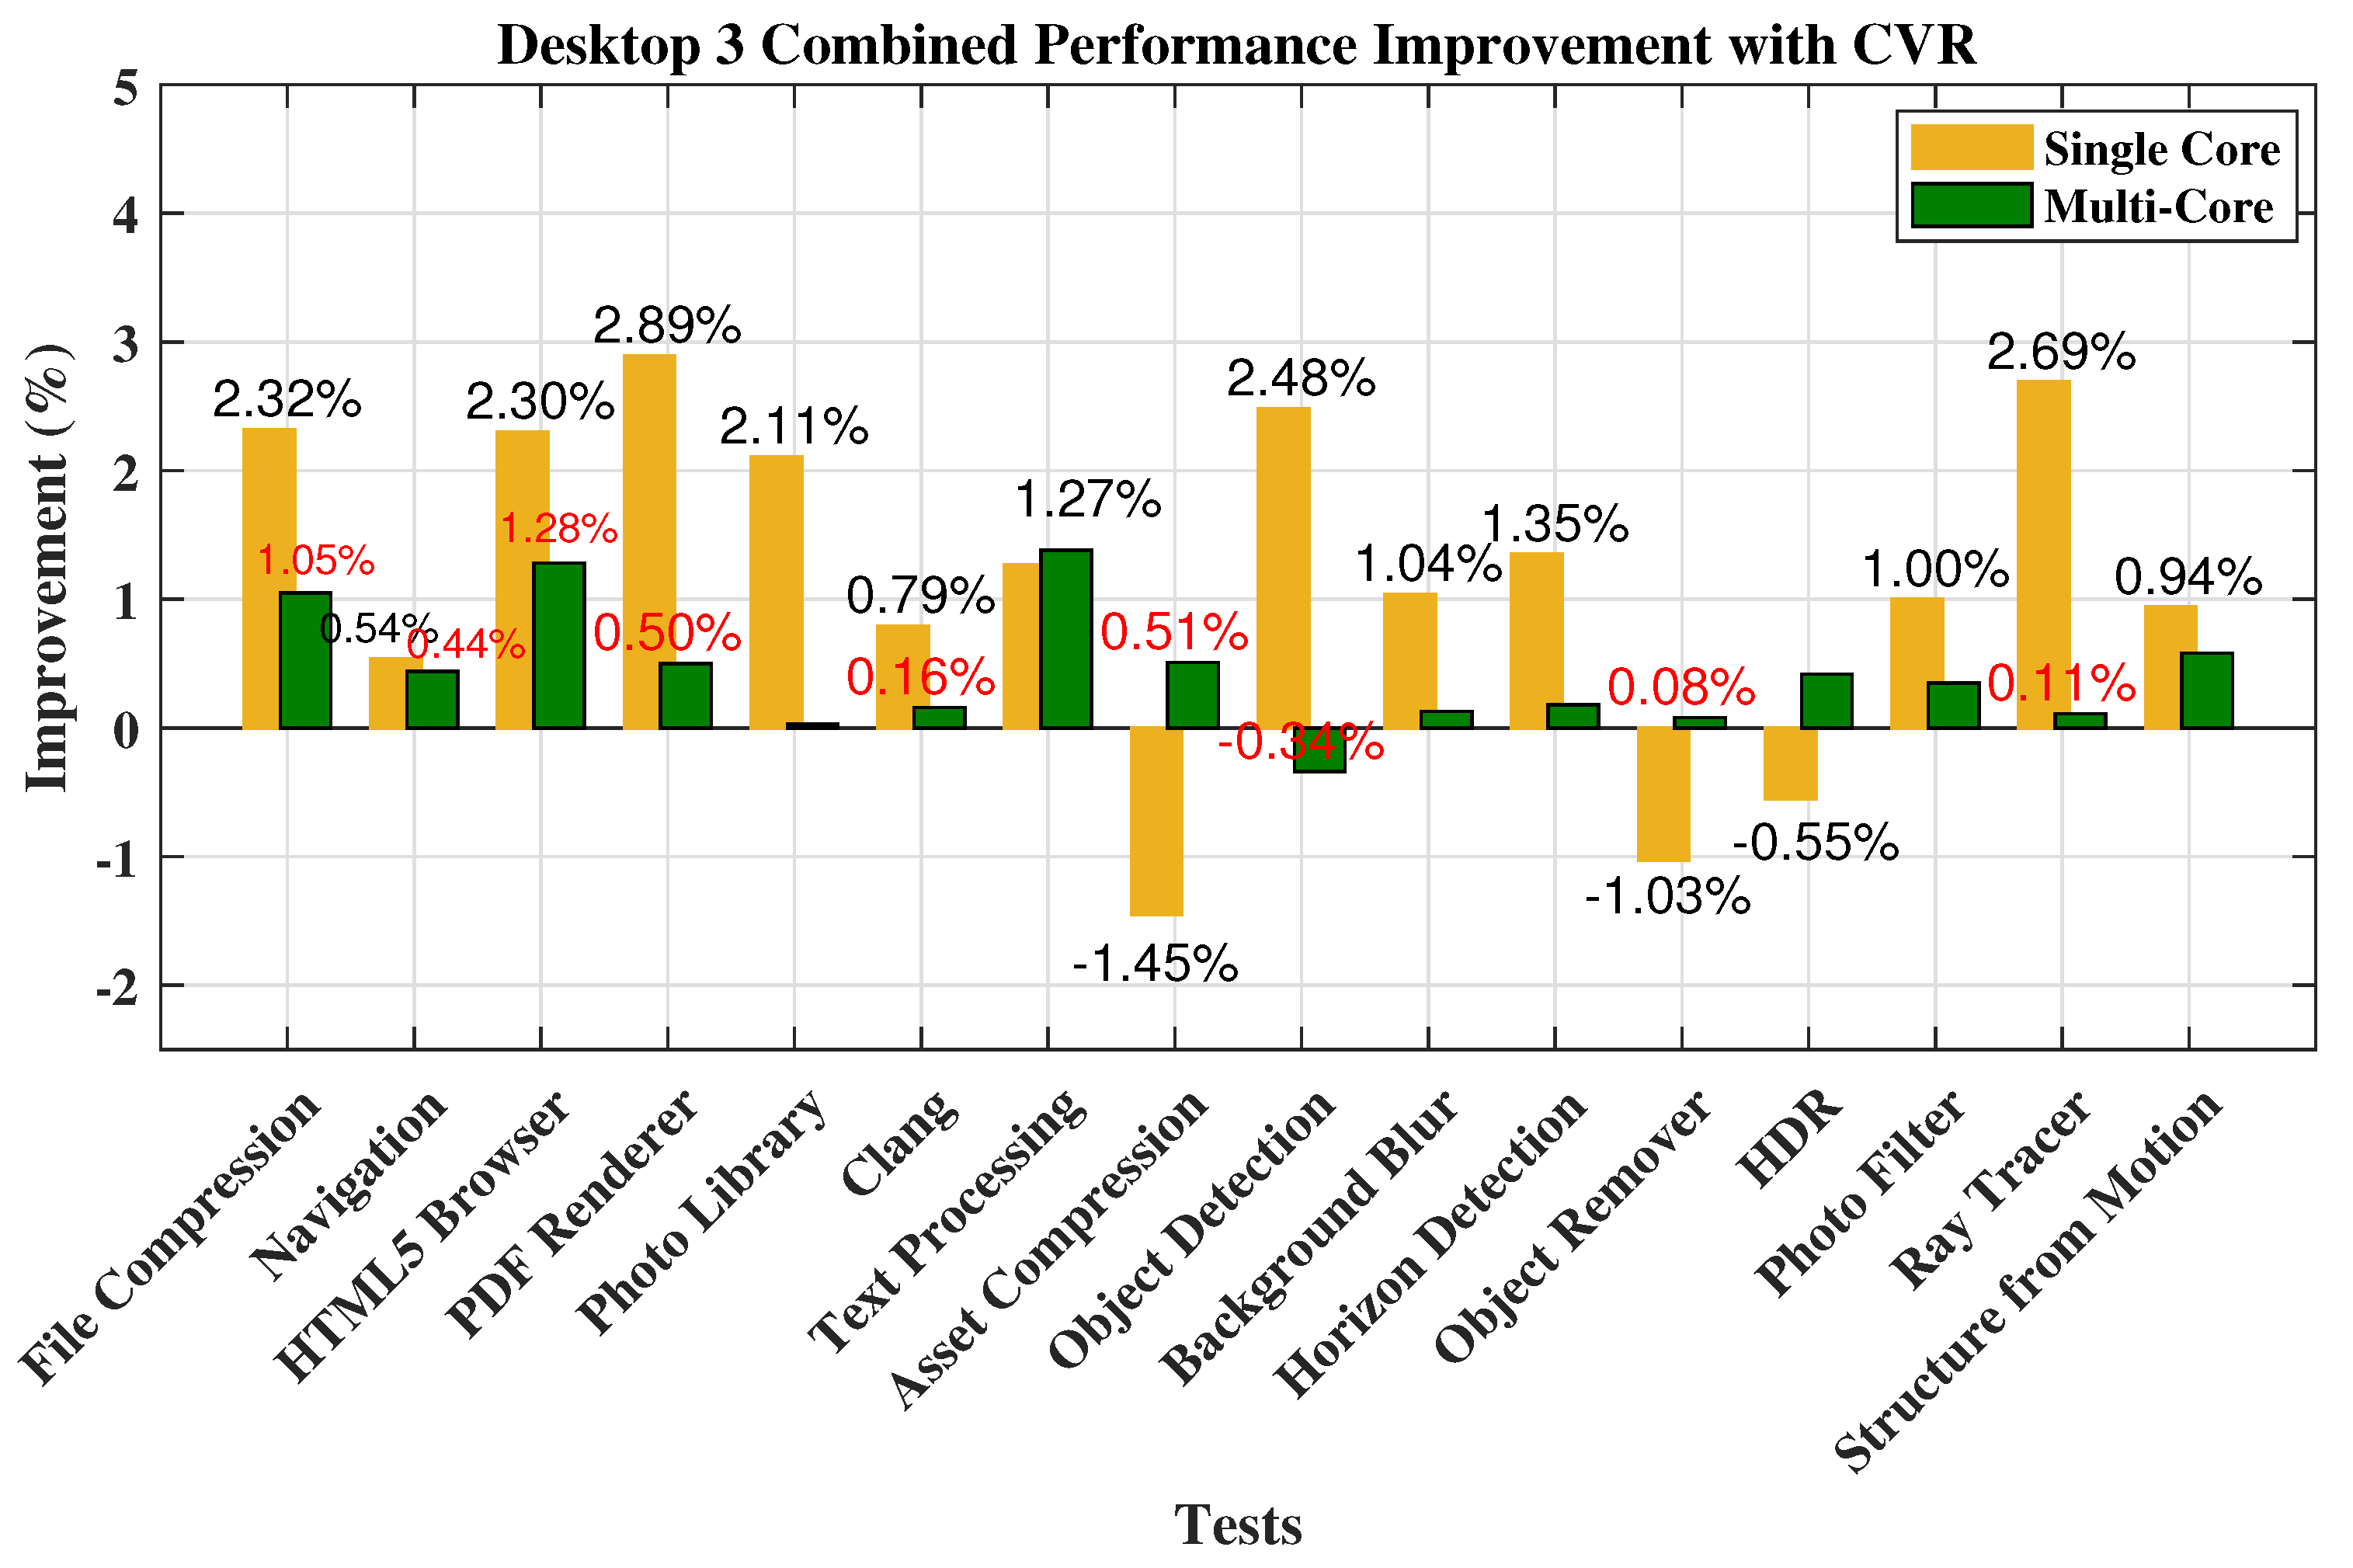
| Test | Single-Core Performance | Multi-Core Performance | ||||
|---|---|---|---|---|---|---|
| W/O CVR | With CVR | % Improvement | W/O CVR | With CVR | % Improvement | |
| File Compression | 1354 | 1386.2 | 2.32 | 2219.75 | 2243.2 | 1.05 |
| Navigation | 1420.75 | 1428.4 | 0.54 | 5529 | 5553.6 | 0.44 |
| HTML5 Browser | 1103 | 1129 | 2.30 | 4727.75 | 4789 | 1.28 |
| PDF Renderer | 1273.25 | 1311.2 | 2.89 | 6486.75 | 6519.6 | 0.50 |
| Photo Library | 1173.5 | 1198.8 | 2.11 | 4705 | 4706.4 | 0.03 |
| Clang | 1474.25 | 1486 | 0.79 | 7286 | 7297.6 | 0.16 |
| Text Processing | 1324 | 1341 | 1.27 | 1767 | 1791.8 | 1.38 |
| Asset Compression | 1523.75 | 1502 | −1.45 | 8234.75 | 8277 | 0.51 |
| Object Detection | 649.5 | 666 | 2.48 | 2154.5 | 2147.2 | −0.34 |
| Background Blur | 1946.25 | 1966.8 | 1.04 | 7334.75 | 7344.6 | 0.13 |
| Horizon Detection | 2058.25 | 2086.4 | 1.35 | 6785.5 | 6797.4 | 0.18 |
| Object Remover | 1305.5 | 1292.2 | −1.03 | 4834.75 | 4838.4 | 0.08 |
| HDR | 1502.75 | 1494.6 | −0.55 | 4927 | 4948 | 0.42 |
| Photo Filter | 1975.25 | 1995.2 | 1.00 | 4123.5 | 4138 | 0.35 |
| Ray Tracer | 1124.75 | 1155.8 | 2.69 | 7199 | 7206.6 | 0.11 |
| Structure from Motion | 1608.75 | 1624 | 0.94 | 4997.25 | 5026.6 | 0.58 |
| Overall Score | 1346.8 | 1391.2 | 3.19 (%) | 4647.2 | 4711 | 1.35 (%) |
| System | PM W/O CVR | PM with CVR | PER (%) |
|---|---|---|---|
| Desktop 1 Single-Core | 547.4 | 555.8 | 1.53 |
| Desktop 1 Multi-Core | 1452.8 | 1580.2 | 8.76 |
| Desktop 2 Single-Core | 652.4 | 683.8 | 4.8 |
| Desktop 2 Multi-Core | 2189.4 | 2218 | 1.3 |
| Desktop 3 Single-Core | 1346.8 | 1391.2 | 3.19 |
| Desktop 3 Multi-Core | 4647.2 | 4711 | 1.35 |
| Laptop 1 Single-Core | 412.6 | 418.2 | 1.34 |
| Laptop 1 Multi-Core | 789.2 | 824.4 | 4.27 |
| Laptop 2 Single-Core | 1189 | 1202 | 1.09 |
| Laptop 2 Multi-Core | 2276.4 | 2279.6 | 0.14 |
| Laptop 3 Single-Core | 1336.4 | 1393.8 | 4.12 |
| Laptop 3 Multi-Core | 4642.4 | 4680.2 | 0.81 |
| Vin (AC) | Iin (A) | IL (A) | Vc (V) | Iout (A) | Vout (V) |
|---|---|---|---|---|---|
| 230 | 0.037 | 0.003 | 6.249 | 0.624 | 6.249 |
| 225 | 0.036 | 0.0029 | 6.108 | 0.6108 | 6.108 |
| 220 | 0.0354 | 0.0029 | 5.96 | 0.5966 | 5.96 |
| 215 | 0.034 | 0.0028 | 5.826 | 0.0582 | 5.826 |
| 210 | 0.033 | 0.0027 | 5.68 | 0.5685 | 5.68 |
| 205 | 0.033 | 0.0027 | 5.54 | 0.554 | 5.54 |
| 200 | 0.032 | 0.0026 | 5.402 | 0.504 | 5.402 |
| Voltage (V) | Desktop Temp (°C) | Laptop Temp (°C) | ||||
|---|---|---|---|---|---|---|
| Desktop 1 | Desktop 2 | Desktop 3 | Laptop 1 | Laptop 2 | Laptop 3 | |
| 230 | 76 | 68 | 62 | 81 | 74 | 56 |
| 225 | 76 | 64 | 62 | 81 | 74 | 53 |
| 220 | 76 | 64 | 60 | 80 | 73 | 53 |
| 215 | 71 | 60 | 56 | 69 | 72 | 50 |
| 210 | 70 | 60 | 60 | 66 | 70 | 50 |
| 205 | 75 | 62 | 58 | 66 | 70 | 50 |
| 200 | 75 | 64 | 58 | 66 | 72 | 50 |
Disclaimer/Publisher’s Note: The statements, opinions and data contained in all publications are solely those of the individual author(s) and contributor(s) and not of MDPI and/or the editor(s). MDPI and/or the editor(s) disclaim responsibility for any injury to people or property resulting from any ideas, methods, instructions or products referred to in the content. |
© 2024 by the authors. Licensee MDPI, Basel, Switzerland. This article is an open access article distributed under the terms and conditions of the Creative Commons Attribution (CC BY) license (https://creativecommons.org/licenses/by/4.0/).
Share and Cite
Ayaz, M.; Rizvi, S.M.H.; Akbar, M. Conservation Voltage Reduction Impact Investigation for Personal Computing Devices Using Experimental Measurements and Computation Performance Metrics. Metrology 2024, 4, 24-45. https://doi.org/10.3390/metrology4010003
Ayaz M, Rizvi SMH, Akbar M. Conservation Voltage Reduction Impact Investigation for Personal Computing Devices Using Experimental Measurements and Computation Performance Metrics. Metrology. 2024; 4(1):24-45. https://doi.org/10.3390/metrology4010003
Chicago/Turabian StyleAyaz, Muhammad, Syed Muhammad Hur Rizvi, and Muhammad Akbar. 2024. "Conservation Voltage Reduction Impact Investigation for Personal Computing Devices Using Experimental Measurements and Computation Performance Metrics" Metrology 4, no. 1: 24-45. https://doi.org/10.3390/metrology4010003